Micro-Scale Variability Impacts the Outcome of Competition Between Different Modeled Size Classes of Phytoplankton
 Sandip Mandal
 S. Lan Smith
 Anupam Priyadarshi
 Hidekatsu Yamazaki
- 1Department of Ocean Sciences, Tokyo University of Marine Science and Technology, Tokyo, Japan
- 2Public Health Foundation of India, New Delhi, India
- 3Research and Development Centre for Global Change, Japan Agency for Marine-Earth Science and Technology, Yokohama, Japan
- 4Department of Mathematics, Institute of Science, Banaras Hindu University, Varanasi, India
Previous modeling studies have shown that observed micro-scale (mm) variability of nutrients and phytoplankton biomass can strongly impact the large-scale mean growth response of phytoplankton in ways that cannot be represented by typical models based on the mean field approximation. Also, models accounting for the flexible eco-physiology of phytoplankton predict quite different responses to changing environmental conditions compared to most current (inflexible) models. Combining these two ideas for nutrient-phytoplankton systems we have developed a new “Flexible NP closure model” to represent competition among the three typically observed phytoplankton size classes: pico-, nano-, and micro-phytoplankton. Both micro-scale variability and flexible eco-physiology are expected to impact the competition among these size classes. With this work we begin to address how both these factors determine the size structure and size diversity of phytoplankton in the ocean. Under eutrophic conditions, variability does not impact the modeled growth rate of any size class. On the other hand, under oligotrophic conditions, variability preferentially enhances the biomass of the largest typically observed micro-size class, and reduces the biomass of the smallest nano- and intermediate pico-size classes.
Introduction
Nearly all plankton ecosystem models have been developed based on the mean field approximation, i.e., ignoring intermittency in the distributions of biomass and nutrients by averaging over spatio-temporal scales much greater than those relevant to planktonic organisms (Mandal et al., 2014; Foloni-Neto et al., 2015). Micro-scale intermittency has long been known to affect the dynamics of aquatic microbes, nutrients, and carbon, because aggregates constitute “hotspots” of biological activity (Azam et al., 1994). More recent research has clarified how interactions between biotic and abiotic factors (Blackburn et al., 1998; Young et al., 2001) generate micro-scale (< 1 mm) aggregates of phytoplankton, bacteria, and organic matter (Franks and Jaffe, 2001; Waters and Mitchell, 2002). Although many laboratory and field studies have verified the importance of physiological flexibility (acclimation) for phytoplankton growth dynamics (Flynn et al., 2015), and recent field observations have revealed ubiquitous micro-scale variability of phytoplankton in both oceanic and estuarine waters (Mandal et al., 2014), we are not aware of any previous study examining their combined impact on phytoplankton ecology and biodiversity.
Recent modeling studies have predicted that observed levels of micro-scale variability affect the growth of phytoplankton (Mandal et al., 2014, 2016) and enhance tropic transfer (Priyadarshi et al., 2017), but have not accounted for the well-known acclimation response, which enhances phytoplankton growth under resource limitation (Smith et al., 2011, 2016a; Chen et al., 2019). Given that such acclimation response is the result of natural selection operating in the aquatic environment (Smith et al., 2011), it seems necessary to account for both factors in order to fully understand the growth response of phytoplankton.
Size-scaling of plankton traits has been incorporated into models in order to examine the effects of environmental change on the size composition and ecological response of plankton communities (e.g., Baird and Suthers, 2007; Baird, 2010; Banas, 2011; Roy et al., 2011; Ward et al., 2013; Chen and Smith, 2018). However, such studies have not considered how micro-scale variability may impact the size and species composition of plankton communities. Furthermore, most such studies have not accounted for the flexible response of phytoplankton).
The level of micro-scale variability in observed fluorescence profiles increases with the resolution of the method (Figure 1A). Vertical profiles (down to 120 m depth) of fluorescence were observed at the mouth of Tokyo Bay, Japan, in 2011, using four sampling methods: Niskin bottles, Seapoint fluorometer, light emitting diode (LED) sensor, and laser sensor (Mandal et al., 2014). Although the observed variability increased substantially with the resolution of the method, the 1-m averaged fluorescence levels (spatial mean) are consistent for all four devices. High-resolution data show high spatial variability of phytoplankton near the ocean surface, and decreases in both mean and variability with increasing depth. These and other observations motivated development of the closure modeling approach (Mandal et al., 2014) in order to investigate the impact of micro-scale variability on plankton dynamics.
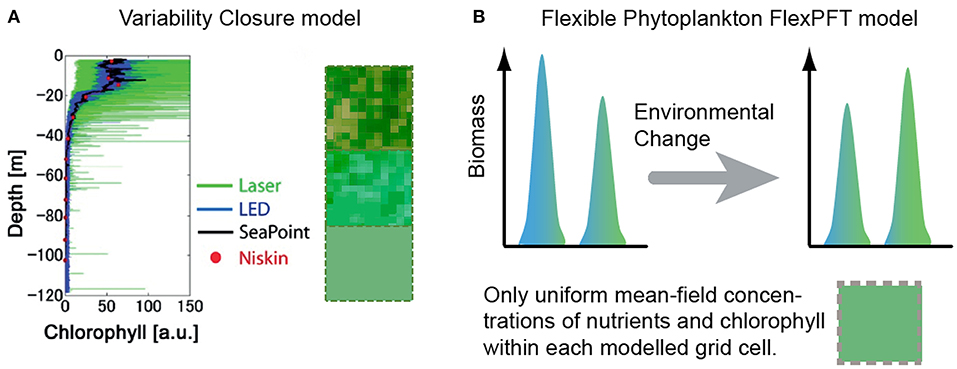
Figure 1. (A) Compared to the typical mean-field assumption, the closure modeling approach (Mandal et al., 2014) accounts for the statistical distribution of chlorophyll in aggregates within each modeled grid-cell (green squares with internal variability), providing a more realistic representation than the typical assumption of uniformity within each grid cell (solid green squares), and predicting substantially different spatio-temporal patterns of growth response (Mandal et al., 2016). (B) The FlexPFT model (Smith et al., 2016a) reproduces more realistic growth response and different biodiversity patterns, compared to typical inflexible models. Here we combine these two approaches to develop the first Flexible Closure model.
We present a new modeling framework (Flexible-closure) to account for the combined effects of micro-scale environmental variability (Figure 1A) and flexible eco-physiological response on size-based phytoplankton communities (Figure 1B). We also present new model predictions about how different levels of micro-scale variability and nutrient levels impact phytoplankton of different size.
Materials and Methods
Flexible Model With Different Size-Scaled Phytoplankton
We first developed a simple model of three phytoplankton size classes in competition for nutrient. Typical sizes for pico-, nano-, and micro- plankton are considered as 1, 5, and 25 μm, respectively (Marañón et al., 2012). The model Equations are:
For each size class quadratic mortality is assumed (Edwards and Yool, 2000) representing both natural and grazing related mortality, because this allows co-existence of the three modeled size classes. Growth, G, is a function of irradiation (I) and free nutrient (N) as Smith et al. (2016a),
Model parameters:
Qs: Structural cell quota
ζN: Energetic respiratory cost of assimilating inorganic N
A0: Potential maximum values of affinity
V0: Maximum uptake rate
: Potential maximum growth rate of phytoplankton
M: Mortality rate coefficient for phytoplankton.
Pp, Pn, and Pm represent phytoplankton biomass for pico-, nano- and micro- size scale, respectively.
In order to simplify the expressions, the following terms are defined,Pp = x, Pn = y, Pz = z, N = n, , , , M = m
Then the Equations 1–4 are expressed as follows:
Size Scaling of Traits
We define size-scaling for the traits (i.e., model parameters) following, Wirtz (2013) in terms of l, the log of the equivalent spherical diameter (ESD):
Then the size scaling of the relevant model parameters are, e.g., for the potential maximum growth rate:
where αμ is the size-scaling exponent (positive for an increase of the relevant trait value with increasing l and the constant is the size independent growth value.
Other trait values are similarly scaled (parameter values in Table S1, Supplementary). Here size is taken as the “master trait,” and the above size-scaling relationships translate the size distribution into a distribution of functional (i.e., trait) diversity (Smith et al., 2016a).
Flexible Closure Model With Different Size Scales of Phytoplankton
Reynolds decomposition is applied to the above model equations to obtain a mass balance equation for each prognostic variable, considered as a randomly fluctuating quantity in time and space. Any fluctuating variable A is decomposed into an ensemble-averaged quantity < A > and a fluctuating quantity A′, such that total A = < A > + A′ with < A′ > = 0. Applying this to variables x, y, z, and n from above, we obtain , , , and . Substituting these expressions into Equations (6–9) and applying the Reynolds averaging method in space (see Supplementary Material for details), yields the following equations for our Flexible NP closure model:
Mean equations:
Variance equations:
Co-variance equations:
Where,
The single derivative of gi(n) with respect to n is then,
and its double derivative with respect to n is,
with,
and,
The sum N + Pp + Pn + Pm remains constant (total N is conserved), and both x0 + y0 + z0 + n0 and < x′2 > + < y′2 > + < z′2 > + < n′2 > + 2(< n′x′ > + < n′y′ > + < n′z′ > + < x′y′ > + < y′z′ > + < z′x′ >) are temporally conserved quantities. Therefore, we define x0 + y0 + z0 + n0 = A and < x′2 > + < y′2 > + < z′2 > + < n′2 > + 2(< n′x′ > + < n′y′ > + < n′z′ > + < x′y′ > + < y′z′ > + < z′x′ > ) = B, which reflects the overall strength of the fluctuating components.
Results
Micro-scale variability impacts the modeled biomass of a single size class of phytoplankton (Figures 2A,B) and the outcome of competition between different size classes (Figures 2C,D). For parameter values (see Table S1 in Supplementary Material).
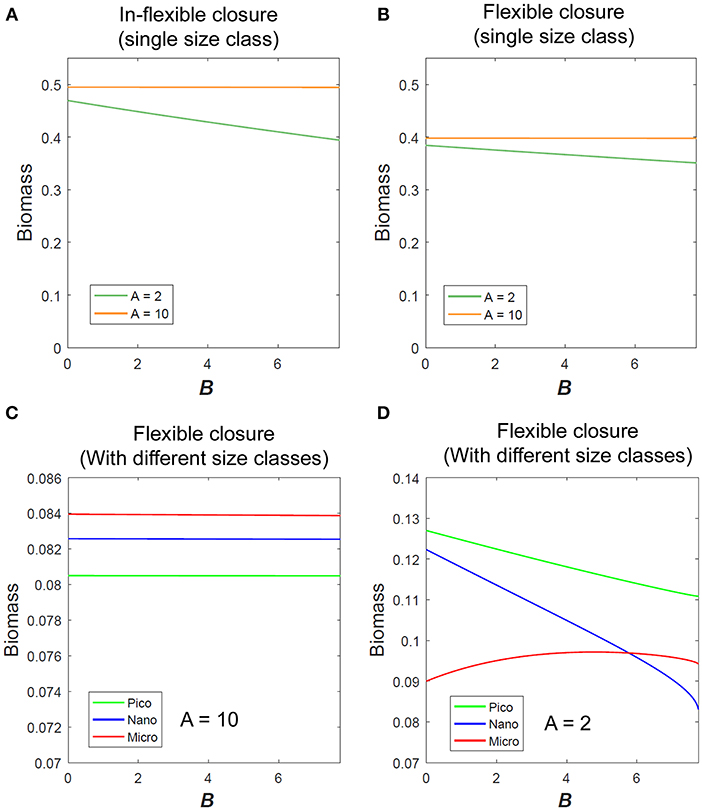
Figure 2. Variation of phytoplankton biomass with micro-scale variability using (A) In-flexible model and (B) Flexible closure model in eutrophic (A = 10) and oligotrophic conditions (A = 2) as obtained for single size class of phytoplankton. Variation of different size classes of phytoplankton biomass (considering competition between them) with micro-scale variability in (C) eutrophic and (D) oligotrophic condition.
Micro-scale variability impacts the mean phytoplankton biomass under low nutrient conditions, but not under high nutrient conditions. Qualitatively both the in-flexible closure and flexible closure models respond similarly with the variation of B for any single size class (Figures 2A,B).
These results show that in oligotrophic environments where physiological flexibility is already known to impact phytoplankton growth (Smith et al., 2009, 2016a; Chen et al., 2019), micro-scale variability also impacts their growth. In the absence of micro-scale variability, i.e., B = 0, micro- size phytoplankton dominates under eutrophic conditions (Figure 2C), whereas pico- size dominates under oligotrophic conditions (Figure 2D). Micro-scale variability has no impact on any size class of phytoplankton when the environment is eutrophic, but changes the outcome of competition under oligotrophic conditions. With increase in B the modeled biomass of pico- and nano-size phytoplankton decreases as that of the micro-scale variability increases (Figure 2D).
Discussion and Conclusions
Application of a similar Reynolds' decomposition for plankton ecosystem modeling (Woodson and Litvin, 2015), although at the much larger scale of oceanic fronts, revealed that patchiness of plankton distributions substantially enhances trophic transfer via predator-prey overlap. Typical models based on the mean-field approximation (ignoring sub-grid scale patchiness), may therefore greatly underestimate the growth of predators (Woodson and Litvin, 2015; Greer and Woodson, 2016). Similarly, our previous NP closure modeling (Mandal et al., 2016) revealed that co-variance terms, representing overlap between nutrients and phytoplankton, enhanced the growth of a single phytoplankton class, compared to the mean-field assumption. Here we have extended this approach to examine the differential effects of micro-scale NP variability on different size classes of phytoplankton. Our Flexible NP closure model, which is to our knowledge the first to account for both acclimation response and micro-scale variability, predicts that the latter has the greatest impact on phytoplankton growth in the oligotrophic ocean, where it preferentially enhances the growth of micro-size phytoplankton at the expense of smaller phytoplankton. This suggests that micro-scale variability may be important for sustaining phytoplankton size diversity across vast low nutrient ocean areas.
Many important phytoplankton traits scale with size (Litchman et al., 2007; Edwards et al., 2012; Marañón et al., 2013), and size diversity can be taken as a proxy for phytoplankton functional diversity (Marañón, 2015). Our results herein may therefore have important implications for modeling and understanding biogeochemistry and Biodiversity-Ecosystem Function (BEF) relationships (Ward et al., 2013; Smith et al., 2016b; Vallina et al., 2017; Acevedo-Trejos et al., 2018; Chen et al., 2019) across environmental gradients. Specifically, our model predicts that the diversity-sustaining effects of heretofore ignored micro-scale variability increase with decreasing ambient nutrient concentration.
If micro-scale variability is indeed an important determinant of phytoplankton size diversity, even recent cutting-edge modeling studies of ocean biogeography and BEF relationships (e.g., Acevedo-Trejos et al., 2018; Chen et al., 2019), which ignored micro-scale variability, may have underestimated the size diversity of phytoplankton in the oligotrophic ocean and mis-interpreted the mechanisms underlying large-scale diversity gradients. Given that in general biodiversity tends to enhance productivity (Tilman et al., 2012, 2014; Grace et al., 2016; Vallina et al., 2017), this may have in turn resulted in underestimates of productivity, particularly for oligotrophic regions. Recent studies have clarified some relationships between environmental conditions, trait distributions, and BEF relationships (e.g., Vallina et al., 2017; Chen et al., 2019), but none have yet accounted for micro-scale variability, which our results suggest is likely to impact those relationships.
Assimilation of data from satellite observations into a plankton ecosystem model has revealed complex, cyclical relationships between chlorophyll and the slope of the phytoplankton size distribution (Figure 4 of Roy et al., 2011), which the authors could not explain. Our model results suggest that both seasonal and spatial differences in the ambient level of micro-scale variability could be one as yet unexplored reason for such complex patterns. Different phytoplankton size classes also contribute differentially to detrital sinking rates and hence to determining carbon and nutrient export, and this has been incorporated into various models of plankton ecosystems and biogeochemistry (e.g., Ward et al., 2013; Yool et al., 2013). Micro-scale variability may modulate these effects and specifically enhance export fluxes of carbon and nutrients from the upper ocean in oligotrophic regions by enhancing the growth of micro-size phytoplankton, which produce more large, fast-sinking particles than smaller phytoplankton. Future studies that incorporate effects of micro-scale variability therefore have the potential to give new perspectives on the mechanistic links between plankton ecosystems and biogeochemistry.
Author Contributions
SS and HY conceived the study. SM developed the model and performed the analysis. SM and AP ran the simulations. All authors contributed to the interpretation of the results. SM and SS wrote a first draft, and all authors contributed to the final manuscript.
Conflict of Interest Statement
The authors declare that the research was conducted in the absence of any commercial or financial relationships that could be construed as a potential conflict of interest.
Acknowledgments
This work was supported by JST CREST Grant Numbers JPMJCR12A6 (PI HY) and JPMJCR12A3 (PI SS), Japan.
Supplementary Material
The Supplementary Material for this article can be found online at: https://www.frontiersin.org/articles/10.3389/fmars.2019.00259/full#supplementary-material
References
Acevedo-Trejos, E., Marañón, E., and Merico, A. (2018). Phytoplankton size diversity and ecosystem function relationships across oceanic regions. Proc. R. Soc. B 285:20180621. doi: 10.1098/rspb.2018.0621
Azam, F., Smith, D., Steward, G., and Hagstrom, A. (1994). Bacteria-organic matter coupling and its significance for oceanic carbon cycling. Microb. Ecol. 28, 167–179. doi: 10.1007/BF00166806
Baird, M. E. (2010). Limits to prediction in a size-resolved pelagic ecosystem model. J. Plankt. Res. 32, 1131–1146. doi: 10.1093/plankt/fbq024
Baird, M. E., and Suthers, I. M. (2007). A size-resolved pelagic ecosystem model. Ecol. Model. 203, 185–203. doi: 10.1016/j.ecolmodel.2006.11.025
Banas, N. S. (2011). Adding complex trophic interactions to a size-spectral plankton model: emergent diversity patterns and limits on predictability. Ecol. Model. 222, 2663–2675. doi: 10.1016/j.ecolmodel.2011.05.018
Blackburn, N., Fenchel, T., and Mitchell, J. (1998). Microscale nutrient patches in planktonic habitats shown by chemotactic bacteria. Science 282, 2254–2256. doi: 10.1126/science.282.5397.2254
Chen, B., and Smith, S. L. (2018). Phytoplankton continuous trait-distribution model with one-dimensional physical transport applied to the North Pacific. Geophys. Model Dev. 11, 467–495. doi: 10.5194/gmd-11-467-2018
Chen, B., Smith, S. L., and Wirtz, K. W. (2019). Effect of phytoplankton size diversity on primary productivity in the North Pacific: trait distributions under environmental variability. Ecol Lett. 22, 56–66. doi: 10.1111/ele.13167
Edwards, A. M., and Yool, A. (2000). The role of higher predation in plankton population models. J. Plankton Res. 22, 1085–1112. doi: 10.1093/plankt/22.6.1085
Edwards, K. F., Thomas, M. K., Klausmeier, C. A., and Litchman, E. (2012). Allometric scaling and taxonomic variation in nutrient utilization traits and maximum growth rate of phytoplankton. Limnol. Oceanogr. 57, 554–566. doi: 10.4319/lo.2012.57.2.0554
Flynn, K. J., St John, M., Raven, J. A., Skibinski, D. O. F., Allen, J. I., Mitra, A., et al. (2015). Acclimation, adaptation, traits and trade-offs in plankton functional type models: reconciling terminology for biology and modelling. J. Plankton Res. 37, 683–691. doi: 10.1093/plankt/fbv036
Foloni-Neto, H., Tanaka, M., Joshima, H., and Yamazaki, H. (2015). A comparison between quasi-horizontal and vertical observations of phytoplankton microstructure. J. Plankton Res. 38:1–13. doi: 10.1093/plankt/fbv075
Franks, P. J. S., and Jaffe, J. S. (2001). Microscale distributions of phytoplankton: initial results from two-dimensional imaging fluorometer, OSST. Mar. Ecol. Prog. Ser. 220, 59–72. doi: 10.3354/meps220059
Grace, J. B., Anderson, T. M., Seabloom, E. W., Borer, E. T., Adler, P. B., Harpole, W. S., et al. (2016). Integrative modelling reveals mechanisms linking productivity and plant species richness. Nature 529, 390–393. doi: 10.1038/nature16524
Greer, A. T., and Woodson, C. B. (2016). Application of a predator–prey overlap metric to determine the impact of sub-grid scale feeding dynamics on ecosystem productivity. ICES J. Mar. Sci. 73, 1051–1061. doi: 10.1093/icesjms/fsw001
Litchman, E., Klausmeier, C. A., Schofield, O. M., and Falkowski, P. G. (2007). The role of functional traits and trade-offs in structuring phytoplankton communities: scaling from cellular to ecosystem level. Ecol. Lett. 10, 1170–1181. doi: 10.1111/j.1461-0248.2007.01117.x
Mandal, S., Homma, H., Priyadarshi, A., Burchard, H., Smith, S. L., Wirtz, K. W., et al. (2016). A 1D physical-biological model of the impact of highly intermittent phytoplankton distributions. J. Plankton Res. 38, 964–976. doi: 10.1093/plankt/fbw019
Mandal, S., Locke, C., Tanaka, M., and Yamazaki, H. (2014). Observations and models of highly intermittent Phytoplankton distributions. PLOS ONE. 9:e94797. doi: 10.1371/journal.pone.0094797
Marañón, E. (2015). Cell size as a key determinant of phytoplankton metabolism and community structure. Ann. Rev. Mar. Sci. 7, 241–264. doi: 10.1146/annurev-marine-010814-015955
Marañón, E., Cermeño, P., Latasa, M., and Tadonléké, R. D. (2012). Temperature, resources, and phytoplankton size structure in the ocean. Limnol. Oceanogr. 57, 1266–1278. doi: 10.4319/lo.2012.57.5.1266
Marañón, E., Cermeno, P., López-Sandoval, D. C., Rodríguez-Ramos, T., Sobrino, C., Huete-Ortega, M., et al. (2013). Unimodal size scaling of phytoplankton growth and the size dependence of nutrient uptake and use. Ecol. Lett. 16, 371–379. doi: 10.1111/ele.12052
Priyadarshi, A., Mandal, S., Smith, S. L., and Yamazaki, H. (2017). Micro-scale variability enhances trophic transfer and potentially sustains biodiversity in plankton ecosystems. J. Theor Biol. 412, 86–93. doi: 10.1016/j.jtbi.2016.10.005
Roy, S., Platt, T., and Sathyendranath, S. (2011). Modelling the time-evolution of phytoplankton size spectra from satellite remote sensing. ICES J. Mar. Sci. 68, 719–728. doi: 10.1093/icesjms/fsq176
Smith, S. L., Pahlow, M., Merico, A., Acevedo-Trejos, E., Yoshikawa, C., Sasai, Y., et al. (2016a). Flexible phytoplankton functional type (FlexPFT) model: size-scaling of traits and optimal growth. J. Plankton Res. 38, 977–992. doi: 10.1093/plankt/fbv038
Smith, S. L., Pahlow, M., Merico, A., and Wirtz, K. W. (2011). Optimality-based modeling of planktonic organisms. Limnol. Oceanogr. 56, 2080–2094. doi: 10.4319/lo.2011.56.6.2080
Smith, S. L., Vallina, S. M., and Merico, A. (2016b). Phytoplankton size-diversity mediates an emergent trade-off in ecosystem functioning for rare versus frequent disturbances. Sci. Rep. 6:34170. doi: 10.1038/srep34170
Smith, S. L., Yamanaka, Y., Pahlow, M., and Oschlies, A. (2009). Optimal uptake kinetics: physiological acclimation explains the pattern of nitrate uptake by phytoplankton in the ocean. Mar. Ecol. Prog. Ser. 384, 1–12. doi: 10.3354/meps08022
Tilman, D., Isbell, F., and Cowles, J. M. (2014). Biodiversity and ecosystem functioning. Ann. Rev. Ecol. Evol. Syst. 45, 471–493. doi: 10.1146/annurev-ecolsys-120213-091917
Tilman, D., Reich, P. B., and Isbell, F. (2012). Biodiversity impacts ecosystem productivity as much as resources, disturbance, or herbivory. Proc. Nat. Acad. Sci. U.S.A. 109, 10394–10397. doi: 10.1073/pnas.1208240109
Vallina, S. M., Cermeno, P., Dutkiewicz, S., Loreau, M., and Montoya, J. M. (2017). Phytoplankton functional diversity increases ecosystem productivity and stability. Ecol. Model. 361, 184–196. doi: 10.1016/j.ecolmodel.2017.06.020
Ward, B. A., Dutkiewicz, S, and Follows, M. J. (2013). Modelling spatial and temporal patters in size-structured marine plankton communities: top-down and bottom-up controls. J. Plankton Res. 36:31–47. doi: 10.1093/plankt/fbt097
Waters, R. L., and Mitchell, J. G. (2002). Centimetre-scale spatial structure of estuarine in vivo fluorescence profiles. Mar. Ecol. Prog. Ser. 237, 51–63. doi: 10.3354/meps237051
Wirtz, K. W. (2013). Mechanistic origins of variability in phytoplankton dynamics: part I: niche formation revealed by a size-based model. Mar. Biol. 160, 2319–35. doi: 10.1007/s00227-012-2163-7
Woodson, C. B., and Litvin, S. Y. (2015). Ocean fronts drive marine fishery production and biogeochemical cycling. Proc. Nat. Acad. Sci. U.S.A. 112, 1710–1715. doi: 10.1073/pnas.1417143112
Yool, A., Popova, E. E., and Anderson, T. R. (2013). MEDUSA-2.0: an intermediate complexity biogeochemical model of the marine carbon cycle for climate change and ocean acidification studies. Geosci. Model Dev. 6, 1767–1811. doi: 10.5194/gmd-6-1767-2013
Keywords: plankton, nutrient, intermittency, closure model, eco-physiologyl
Citation: Mandal S, Smith SL, Priyadarshi A and Yamazaki H (2019) Micro-Scale Variability Impacts the Outcome of Competition Between Different Modeled Size Classes of Phytoplankton. Front. Mar. Sci. 6:259. doi: 10.3389/fmars.2019.00259
Received: 17 April 2018; Accepted: 02 May 2019;
Published: 22 May 2019.
Edited by:
Michael Arthur St. John, National Institute of Aquatic Resources, Technical University of Denmark, DenmarkReviewed by:
Shovonlal Roy, University of Reading, United KingdomSergio M. Vallina, Instituto Español de Oceanografía (IEO), Spain
Copyright © 2019 Mandal, Smith, Priyadarshi and Yamazaki. This is an open-access article distributed under the terms of the Creative Commons Attribution License (CC BY). The use, distribution or reproduction in other forums is permitted, provided the original author(s) and the copyright owner(s) are credited and that the original publication in this journal is cited, in accordance with accepted academic practice. No use, distribution or reproduction is permitted which does not comply with these terms.
*Correspondence: Hidekatsu Yamazaki, hide@kaiyodai.ac.jp