Sectoral Futures Are Conditional on Choices of Global and National Scenarios – Australian Marine Examples
 Fabio Boschetti1*
  Catherine M. Bulman2
  Alistair J. Hobday2
  Elizabeth A. Fulton2
  Stephanie Contardo1
  Hector Lozano-Montes1
  Lucy M. Robinson1,3,4 Anthony D. M. Smith2
  Joanna Strzelecki1
  E. Ingrid van Putten2
- 1CSIRO Oceans and Atmosphere, Crawley, WA, Australia
- 2CSIRO Oceans and Atmosphere, Hobart, TAS, Australia
- 3Oceans Institute, The University of Western Australia, Perth, WA, Australia
- 4Oceans Graduate School, The University of Western Australia, Perth, WA, Australia
Planning and management require expectations of future system behavior. These expectations can come in the form of predictions, projections, scenarios, narratives, visions and intuitions, at different spatial and temporal scales. While each can provide different insights into a system future, it is not clear how they can be effectively combined into a unified analysis. Here, we propose a general framework to combine conceptual models, numerical projections and scenario narratives, leading to a system view of the functioning of the future Blue Economy sectors as applied to Australian oceans. We start by developing a conceptual model of the sectors directly or indirectly interacting with the Australian oceans and their national and global drivers. We then identify scenarios and projections for each global driver as well as projections of future development for the national drivers and for the Blue Economy sectors. Comparisons of the global scenarios, national projections and sectoral projections suggest that the Australian marine sectors expect to follow a path of growth mostly driven by market forces enabled by government regulations. The analysis of each sector provides information on the extent to which the initial conceptual model can be improved as part of more detailed analysis at a sectoral level. This approach supports sector-based marine planning with a consistent and repeatable framing and can help researchers, managers and stakeholders reach a shared understanding of system interactions and the potential impact of future shocks to national and international drivers.
Introduction
‘It is possible to be… surprised, and at the same time be… prepared’ (Grabo, 2012).
Imagining and predicting the future have long fascinated humans as evidenced in the areas of religion, literature, and economics. More recently, several approaches have been developed within the Future Studies literature to develop meaningful expectations about the future (see Box 1). Increasingly, these approaches are being used to inform science and policy in environmental management, including for marine environments [e.g., (Pinnegar et al., 2006)]. Discussions about the future of marine environments increasingly include a narrative in which the world oceans are the new frontier of economic and technological development (Eikeset et al., 2018), which contrasts with older conservation-focused preserve-and-protect narratives (Safina, 1998; Pauly and Maclean, 2003) or final frontier for exploration narratives [e.g., (Steinbeck, 1995)]. This new narrative is widely termed the Blue Economy (Howard, 2018; Voyer et al., 2018). It represents a vision of an increasingly crowded marine environment with competition for space and resources, together with development-driven governance and technological innovation that provides solutions for the demands of a growing global population. Although there is no universally accepted definition (see Box 2), the Blue Economy vision is centered on recognizing that diverse ocean uses are interconnected and that integrated management is crucial not only to balance environmental, economic and social outcomes but also to capitalize on synergies among different uses, services and scales (Burgess et al., 2018).
Box 1. Approaches commonly used in Future Studies.
Scenarios: Alternative narratives of how the future might unfold.
Projections: A numerical estimate (time series, plots, trends, growth rates, etc.) of the likely or possible future values of one or more indicators of a system’s behavior. Usually used about time frames in the medium to long term.
Foresighting: An informed analysis of some aspects of a future reasonably far from now, which arises from intellectual speculation requiring both broad and expert knowledge.
Forecasting: A prediction about a future usually next to now (short term, on the scales of months to a few years), requiring expert knowledge.
Visioning: A statement about a desirable future and commitment to create it.
Box 2. Definitions of the Blue Economy.
Various definitions of the Blue Economy have been proposed (Howard, 2018; Voyer et al., 2018). These definitions look quite different depending on whether they are combined into a single vision or grouped into different themes.
When represented as a single vision, they highlight three aspirations: i) to exploit marine resources to address the needs of a growing global population, ii) to contribute to global GDP growth and iii) to ensure environmental and social sustainability. The potential win-win-win goal on the three pillars of economic, environmental and social sustainability makes the Blue Economy an appealing vision for future marine development. Key to this vision is learning from the experience of past unrestrained resource exploitation on land, which has provided for improved living conditions for many, at the cost of environmental degradation and wealth and social inequality.
However, when different themes in these definitions are explicitly represented, the Blue Economy vision is interpreted differently by different actors (Howard, 2018; Voyer et al., 2018). In Voyer et al. (2018), the authors carry out a content analysis of a large set of documents, largely comprised of policy documents, conference proceedings, position papers and reports, and identify four core themes:
• Oceans as natural capital, a view often promoted by conservation agencies/NGOs. It promotes valuing marine ecosystem services for societal and economic benefits with focus on environmental protection and restoration activities.
• Oceans as a good business, a view often promoted by industry and large global economies. It highlights the importance of marine industries and focuses on investment in marine sectors to foster economic growth and employment.
• Oceans as livelihoods, a view often promoted by development agencies, Pacific Small Island Developing States and small-scale fisheries. It emphasizes providing employment and income to alleviate poverty and fostering food security and social and economic resilience in developing countries.
• Oceans as a driver of innovation, a view often promoted by academic institutes, industry and governments. It emphasizes public and private investment, innovative financing mechanisms, research networks and competition to develop new ocean uses, new industries and innovation in existing ones.
The tension between a focus on nature (Oceans as natural capital) vs people (Oceans as livelihoods) vs business (Oceans as a good business) vs technology (Oceans as a driver of innovation) is not peculiar to the Blue Economy. It commonly arises in Future Studies when people are asked to express their aspirations and concerns regarding the future, independently of the specific context (Boschetti et al., 2016). Empirical literature (Douglas, 1978; Douglas and Wildavsky, 1982) suggests that this tension is found across cultures. This is because underlying this tension are different preferences or concerns for societal organization and distribution of power which correlate with preferences for how to manage the environment (Price et al., 2014) and thus directly address preferred balances between three pillars of sustainable development (ecological, social, and economic).
While the scope of the Blue Economy vision is global, it also has clear implications at national scales, and can be considered in strategic planning by marine sectors. National, regional and local institutions, businesses, organizations and communities engaged with the oceans need to understand the implications of this vision. The time horizon of this vision ranges from one to several decades into the future, well beyond the usual time span of reliable economic, biophysical, ecological, political and social predictions. Nevertheless, several approaches can be used to say something meaningful about possible future development within this time span. Within the discipline of Future Studies, experts can provide analyses in terms of foresights, and stakeholder teams can be assembled to create narratives of future developments in the form of scenarios (Hunt et al., 2012; Boschetti et al., 2016). Intelligence about possible threats, trends and opportunities can be collected, prioritized for further monitoring and converted into warnings for decision making, as has long occurred as part of geo-political and military analyses (Grabo, 2012).
Strategic planning approaches seeking to understand the implications of the Blue Economy narrative in terms of future scenarios face at least three challenges: i) an assessment of the reliability of the scenarios or future projections, by considering a wide range of information sources; ii) how to integrate different sources and styles of information (for example, how a projection spanning the next 3-5 years can be integrated with one spanning half a century, or; how scenarios of overall system behavior can be integrated with a projection for a single sector) and iii) how the outcome of such analysis (scenarios, visions or projections) can best be used for strategic or tactical planning.
Here we articulate a process to assimilate the Blue Economy vision into sectorial planning of activities in the Australian oceans. We focus on Australia as we are Australian-based researchers, however, features of the Australian marine estate are common to other nations. In common with the ocean waters of nations around the globe, Australia’s oceans offer large and growing economic, ecological, social and cultural opportunities which include recreation, energy and food production (AIMS, 2016) and the provision of safety and security to the nation (National Marine Science Committee, 2015). In addition, over the next decade Australia’s marine economy is projected to grow three times faster than the gross domestic product [Australian Bureau of Statistics (ABS), 2018a], similar growth rates are commonly projected for many other nations (OECD, 2016; Noaa Office for Coastal Management, 2019). This growth is expected to come from existing industries such as tourism, ports, transport, shipbuilding, offshore oil and gas, aquaculture and wild fisheries, and additional opportunities for further economic gains in less well developed areas like biotechnology and renewable energy. Thus, approaches to generate consistent, reliable and actionable information are urgently needed.
The approach we describe in this paper involves five stages. First, a conceptual model of the drivers of change affecting the ocean sectors is developed. This conceptual model includes the sectors directly or indirectly interacting with the oceans (e.g., fishing, aquaculture, shipping, tourism, oil and gas), their regional and national drivers (e.g., population and GDP growth, energy requirements) and their global drivers (global population growth, global GDP growth, climate change). Second, scenarios for each global driver are defined from existing sources of information. Third, projections for future development for the regional and national drivers and for the sectors relevant to Australia’s oceans are obtained from a wide range of documents. Fourth, the consistency between the global scenarios, national projections and sectorial projections is examined. This provides a large scale, top-down assessment of the system. Finally, the drivers described in the sector projection documents are analyzed. This local, bottom-up view of the conceptual model from the perspective of each sector provides information on the extent to which the initial conceptual model needs to be revised. This approach will provide sector-based planning exercises with a consistent and repeatable framing to consider their future and convey this future to other sectors seeking to understand their linkages in the Blue Economy.
Materials and Methods
Developing a Conceptual Model of Influences on the National Blue Economy
Our project team developed the conceptual model (Figure 1) over a five-year period via a number of dedicated workshops supplemented by out-of-session research (see Supplementary Material, Section 4). The team had expertise in fisheries, aquaculture, marine conservation, ecological modeling, complex system science, management of natural resources, economics, future studies and stakeholder engagement. The conceptual model consists of a network in which nodes represent natural and anthropogenic drivers and activities impacting the Australian Ocean either directly or indirectly and the links represent the presence of interactions between them. In the rest of the document, we refer to the nodes of the network as components of the conceptual model. To identify the main components of the model, we considered three levels; Global Drivers, National Drivers, and the Blue Economy Sectors (Figure 1). Review of each level involved consideration of existing literature showing linkages between components at each level, and mapping the main connections between components at different levels, in this case, for Australia.
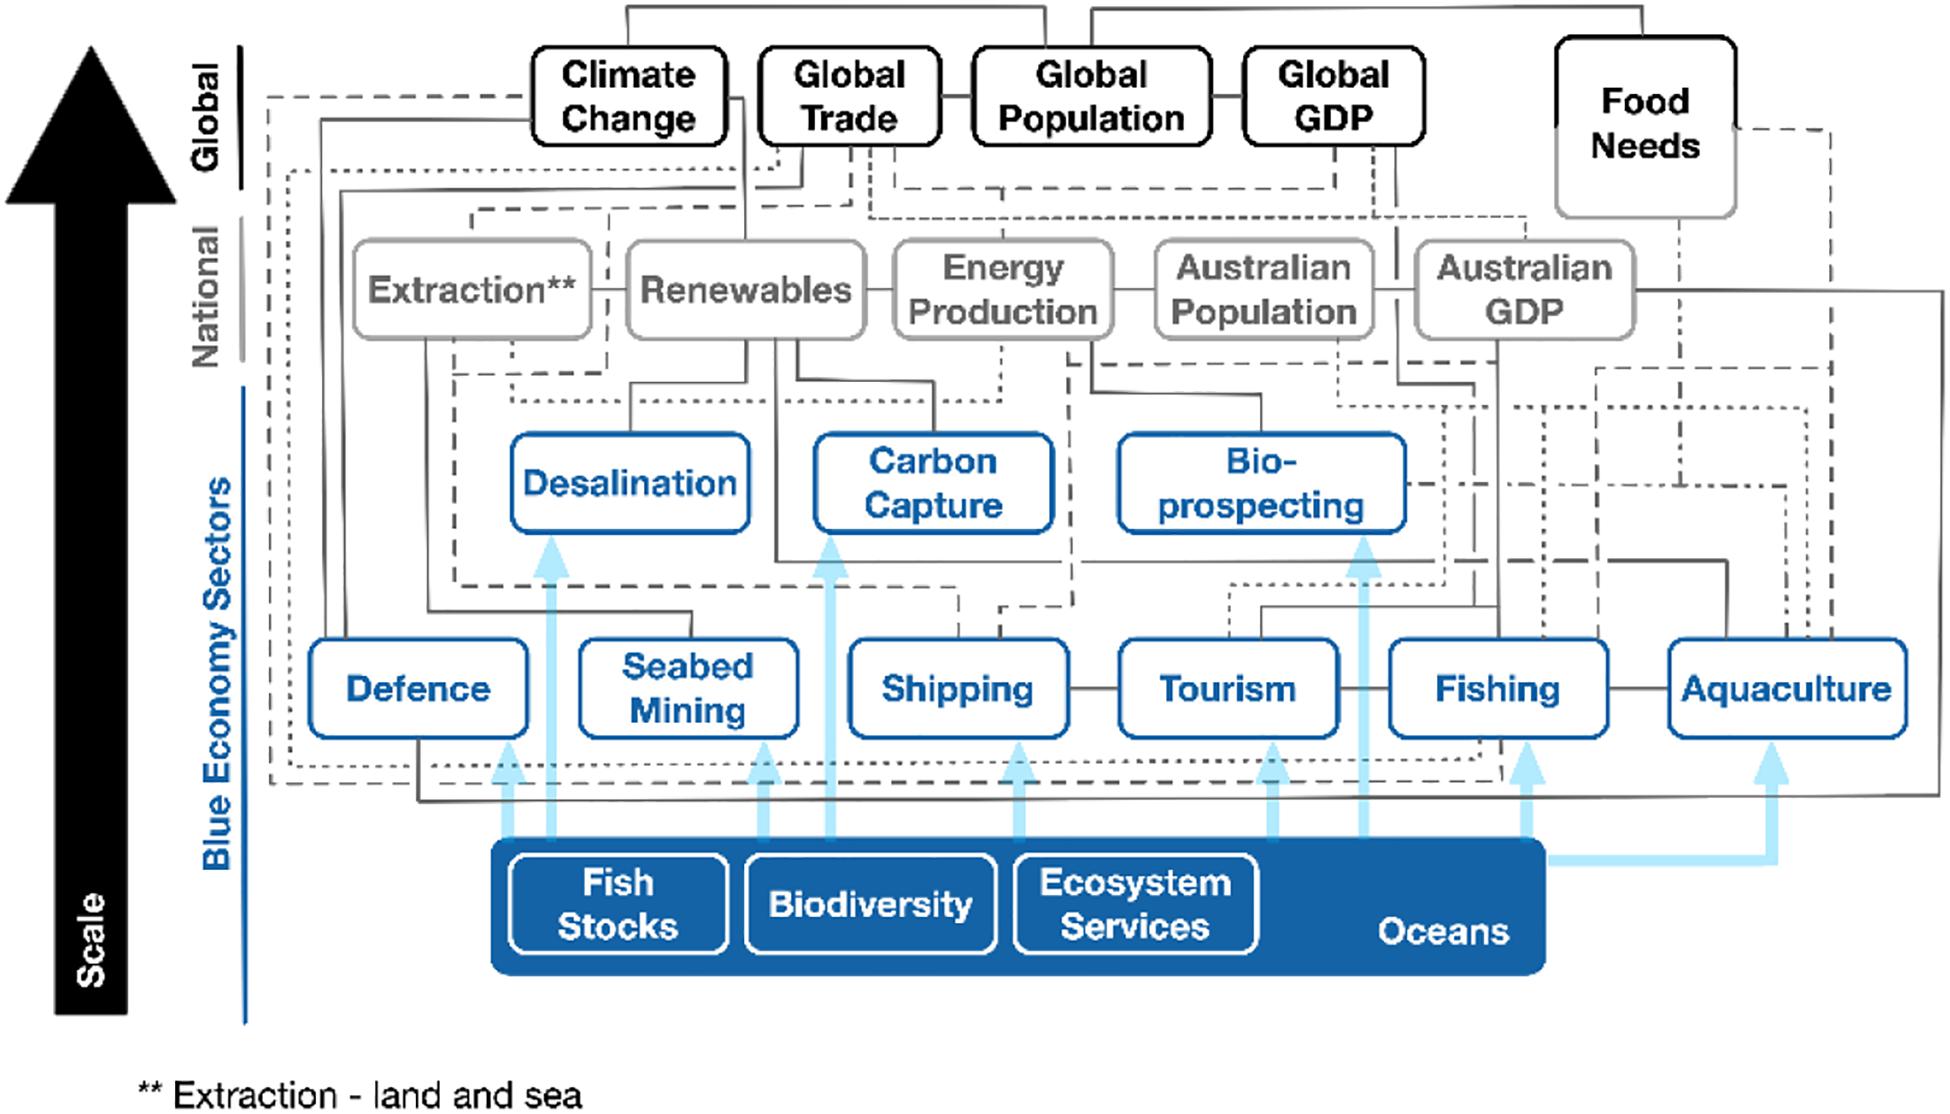
Figure 1. The initial conceptual model of influences on the national Blue Economy. The model components are organised at three levels: Global Drivers, National Drivers, and the Blue Economy Sectors (with ‘Food Needs’ included both as Global and National driver). The blue arrows show direct connections from the natural world into the Blue Economy. The model can be interpreted as a network in which components are the nodes and the edges represent their interaction. Here and in all other figures, edges are plotted via different line styles for ease of visualisation.
• Global drivers are those whose control and scope lie outside Australia but are the main drivers controlling the global context in which Australia as a system needs to operate.
• National drivers are those with control or scope within Australia whose impact on the oceans is mostly indirect.
• Blue Economy Sectors directly relate to uses of Australian oceans.
The model includes five global drivers (Figure 1 top row): climate change, global trade, global population and global GDP trends, and food requirements (geopolitics acts on these drivers, but we do not include it specifically). Trends in international trade and global GDP will affect the Australian economy both directly and indirectly. This in turn will have both direct and indirect effects on Australian oceans in terms of transport and resource extraction (e.g., minerals and fish). Energy technology has had a crucial impact on economic production and growth (Ayres and Warr, 2001; Warr et al., 2008) and it is likely to have an even stronger impact in a world of declining fossil fuel energy use and increasing renewable energy generation. It is likely to affect the Australian economy through its impact on transport costs and the demand for different types of mineral resources available in Australia. Food technology can have an impact on resources to feed a growing global human population and on the balance between land versus marine food production (Hilborn, 2011). Finally, climate change will directly or indirectly affect all processes at various time scales [e.g., (McDonald et al., 2018)]. Here we assume that Australia has little impact upon these global drivers either through policy or feedback effects.
National drivers (Figure 1; second row) include mining (“Extraction” panel, which includes both land and offshore activities), energy production, renewable energy production, economic activity (gross domestic product, GDP) and population growth. Their impact on Australian oceans is mediated by transport, environmental impacts of land-based resource extraction, and requirements for different ecosystem services. In principle, there is scope for control and policy intervention on these drivers. However, this may be limited in practice for several reasons. First, the complexity of the political processes may render some of these intervention options less likely to occur. Second, regulation for these components is in the hands of bodies different from the ones tasked to manage marine matters. Finally, their management is strongly coupled with other national and international issues of larger social and political scope.
Blue Economy Sectors in our Australian model (Figure 1; blue fonts) include sea bed mining, defense, transport, tourism, fishing, aquaculture, bio-prospecting, carbon capture and desalination. Tourism is likely affected by trends in both local and international GDP but also by other factors like environmental quality and the cost of transport; in turn it can affect fishing as well as other ecosystem services and Australia’s GDP itself. Australian population growth is considered the main driver in this category, as indicated by the number of linkages.
The Global Context – Future Scenarios
A range of approaches has been developed to provide context for future scenarios at the global scale (Box 3). In order to better understand the global context in which Australia as a system needs to operate, we employed the global scenarios from the Great Transition Initiative (Raskin et al., 2010) which explores pathways of long-term development and their implications for global sustainability. The four scenarios (Market Forces, Policy Reform, Great Transition, and Fortress World, see Box 3) focus on markets, institutional reforms, social and moral transformation and local nationalistic priorities as main drivers of change. The assumptions underlying these scenarios were used by the Great Transition Initiative team to initialise the PoleStar System software tool (Tellus Institute and Stockholm Environment Institute, 2010) which allowed them to assess numerically the impact of these assumptions on a number of social, economic and environmental indicators (Figure 2).
Box 3. Plausible global futures.
The Foresight literature describes a long tradition, going back at least to the early 1970s (Miles, 2010; Jefferson, 2012), on how to explore ‘probable, plausible, possible and preferable futures’ (Hancock and Bezold, 1994). With some variations, this accumulated experience has converged toward a well-established approach according to which a practitioner guides a group of experts, stakeholders or members of the public who, working as a team in a workshop setting, explore scenarios of possible future system trajectory.
One of the most important insights from this literature is the observation that scenarios developed in a wide range of foresight exercises, addressing disparate issues, in different contexts and arising in different cultural backgrounds, share features which cluster the scenarios into 5 or 6 common themes (Bezold, 2009; Hunt et al., 2012; Boschetti et al., 2016). These common themes, referred to as scenario archetypes (Hunt et al., 2012; Alford et al., 2014; Boschetti et al., 2016), explore what the future may look like if development is principally determined by either i) markets, ii) institutional reforms, iii) social and moral transformation at a global scale, iv) local rather than global focus, v) ecological and social decline or vi) technological innovations.
Rarely are all six scenario archetypes used in a single work. More often, practitioners assist stakeholders to identify the two most critical drivers of change (represented as axes in a 2D plane) and develop scenarios by analyzing their interplay (Hunt et al., 2012). This leads to defining a 2 × 2, double uncertainty grid (Pinnegar et al., 2006; Curry and Schultz, 2009; Bezold, 2010; Amer et al., 2013; Ramirez and Wilkinson, 2013; Raven, 2014), in which the two most important and uncertain issues represent the two axes and their interplay define four scenarios. Once again the literature shows considerable consistency in the choice of the two axes (Boschetti et al., 2016). With rare exceptions, the first axis maps amount of government regulation and the second axis maps social values and priorities, ranging from a self-interested and individualistic to communitarian (Boschetti et al., 2016). In this paper, the four global scenarios in the Great Transition Initiative (Raskin et al., 2010) can be mapped into the high-vs-low regulation and individualistic-vs-communitarian axes as shown in Figure 2 (left). These scenarios are:
• Market Forces: a future in which markets drive progress. Economic growth-oriented globalization dominates. Population grows 40% and the economy 300% by 2050. The availability of sufficient resources, bio-physical sustainability and social inequalities are the main challenges to this future.
• Policy Reform: a future in which institutions drive progress and influence human values. Governments lead the way toward sustainability goals without major changes to existing institutional structures and social values. Economic incentives and technological innovation result in strong gains in poverty reduction, climate stabilization and ecosystem preservation.
• Great Transition: a future in which human values drive progress. While Policy Reform focuses more on changing institutions than values, the opposite happens in Great Transition. Driven by the necessities of deepening crises and the desire for a just and sustainable society, the focus moves to human solidarity, ecological resilience and quality of life over economic growth.
• Fortress World: a future in which crises lead to force which exacerbates crises. Global crises lead to local authoritarian solutions. This is a future of protected enclaves with poor masses outside. Social conflict and mass migration lead to emergency measures of higher priority than sustainable development.
A detailed description of the four scenarios and their rationale is found in Electris et al. (2009). Scenarios are alternative narratives of how the future might unfold and do not necessarily include numerical projections (see Box 2). In this work, we chose to use the scenarios from the Great Transition Initiative because they have been studied via modeling, providing numerical projections of the expected behavior of several global processes under the different scenarios (Figure 2 (right)).
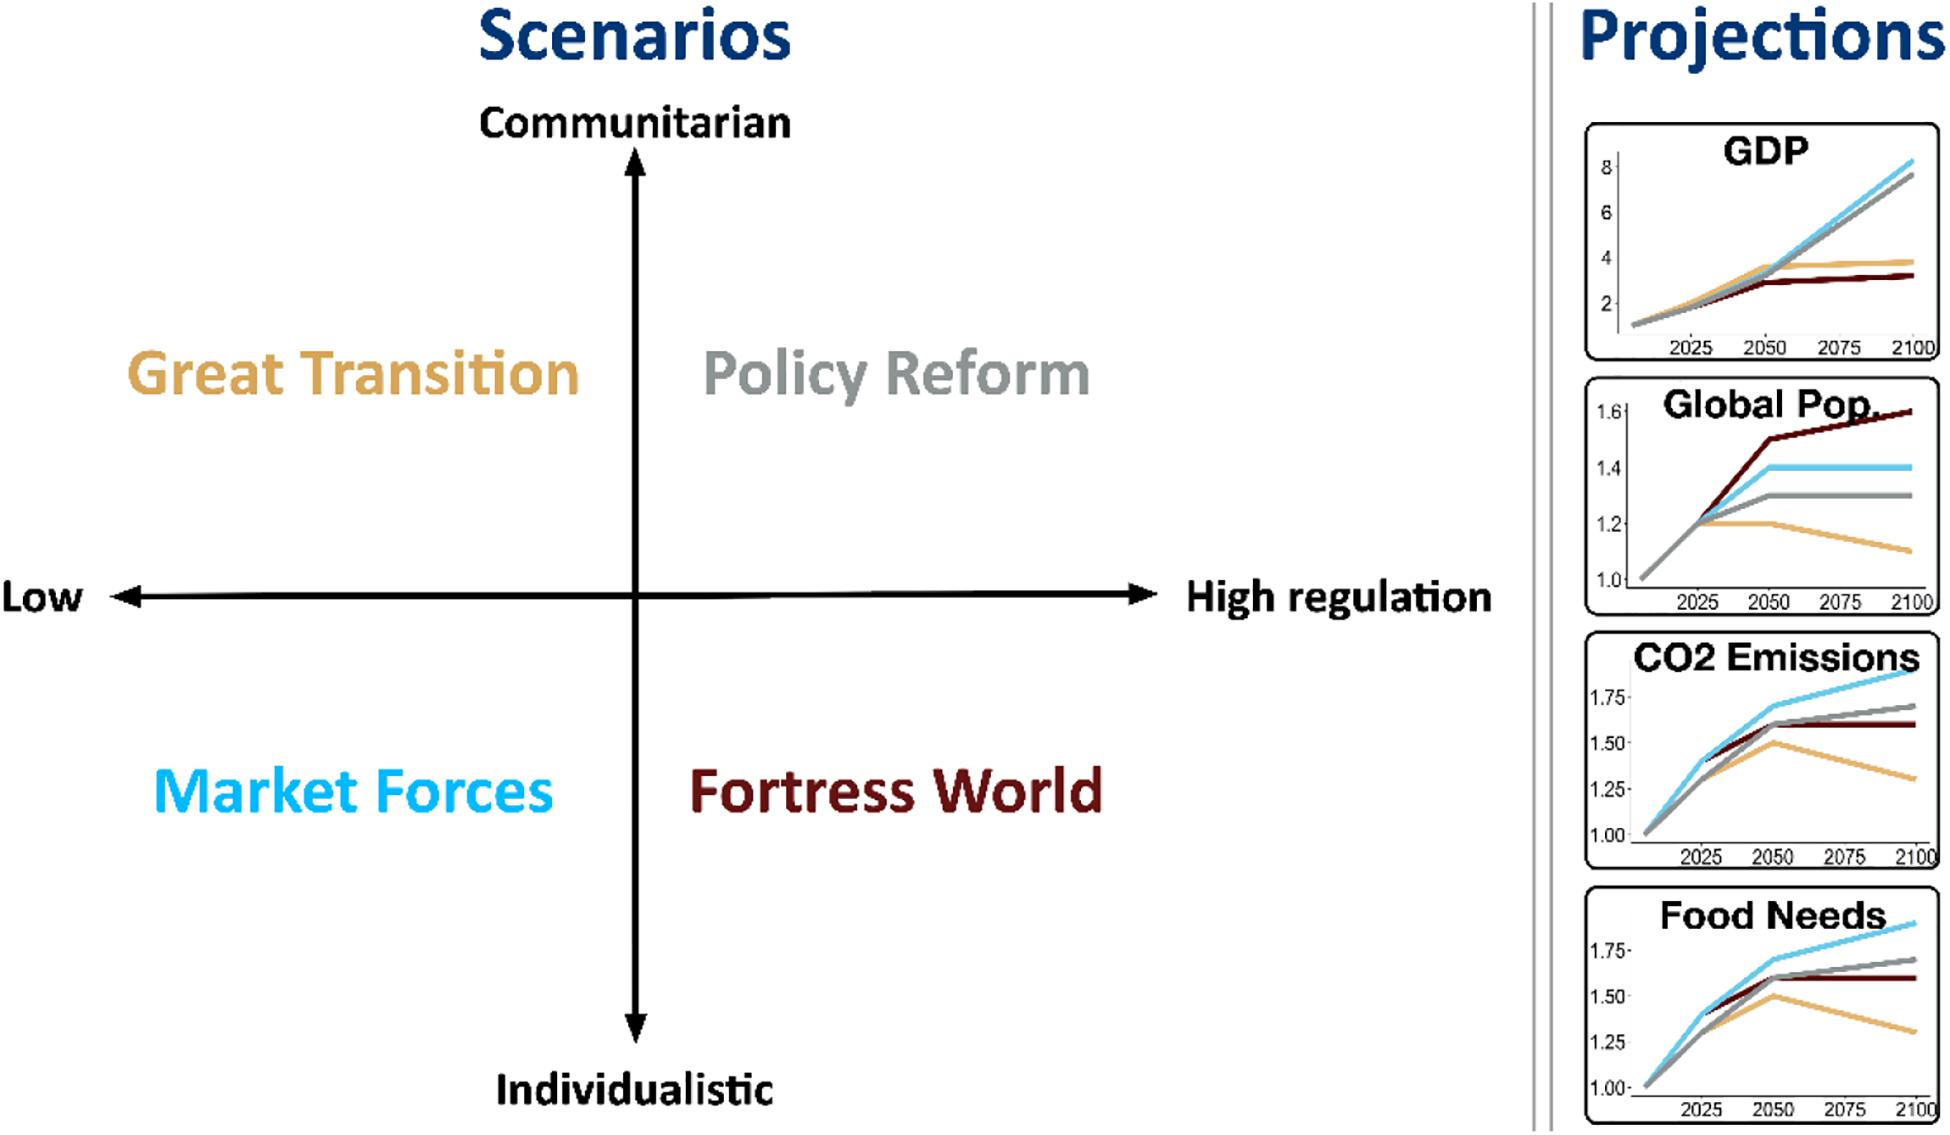
Figure 2. Scenarios from Raskin et al. (2010) and global projections. The 2 × 2 double uncertainty grid used by the Great Transition Initiative and the location of the four scenarios within it (left). The numerical projections of global GDP, global population, CO2 emissions and food requirements, generated by modelling the scenario via the PoleStar model (right). Colour coding relates the scenario to each individual projection.
It is important to emphasize that the purpose of a scenario exercise is rarely to assess the most likely future, rather to explore ranges of possibilities. Exploring and assessing possibilities is often helped by framing them against a business-as-usual or most likely scenario, because it highlights which underlying assumptions, possibly unquestioned, are core to the business-as-usual developments and how alternative economic drivers, power relations and social attitudes (Dator, 1998; Inayatullah, 2004) may lead to alternative outcomes. As a result, how the projections for different national drivers and Blue Economy Sectors described in Section 3 compare to the modeled projections of these global scenarios in Figure 2, may say something about which global scenarios are considered more likely to occur or more desirable. This is further discussed in Sections 3 and 4.
Results
National Drivers and Blue Economy Sector Projections
Projections for each of the National drivers and Blue Economy sectors in Figure 1 were collected and summarized by searching the literature for scientific publications or industry reports (see Supplementary Material, Section 1). Figure 3 shows the projections for each component with the exception of sea-bed mining and bio-prospecting for which numerical projections could not be found. For some components, proxy indicators had to be used, i.e., water consumption for desalination and cruise passengers for tourism. Onshore and offshore oil & gas projections are represented as a single projection (‘Extractive’ panel as a national driver). To simplify the visual comparison, the projections are plotted as a ratio over the value in the year 2019 (i.e., a value of 2 means doubling the sector performance compared to its value in 2019).
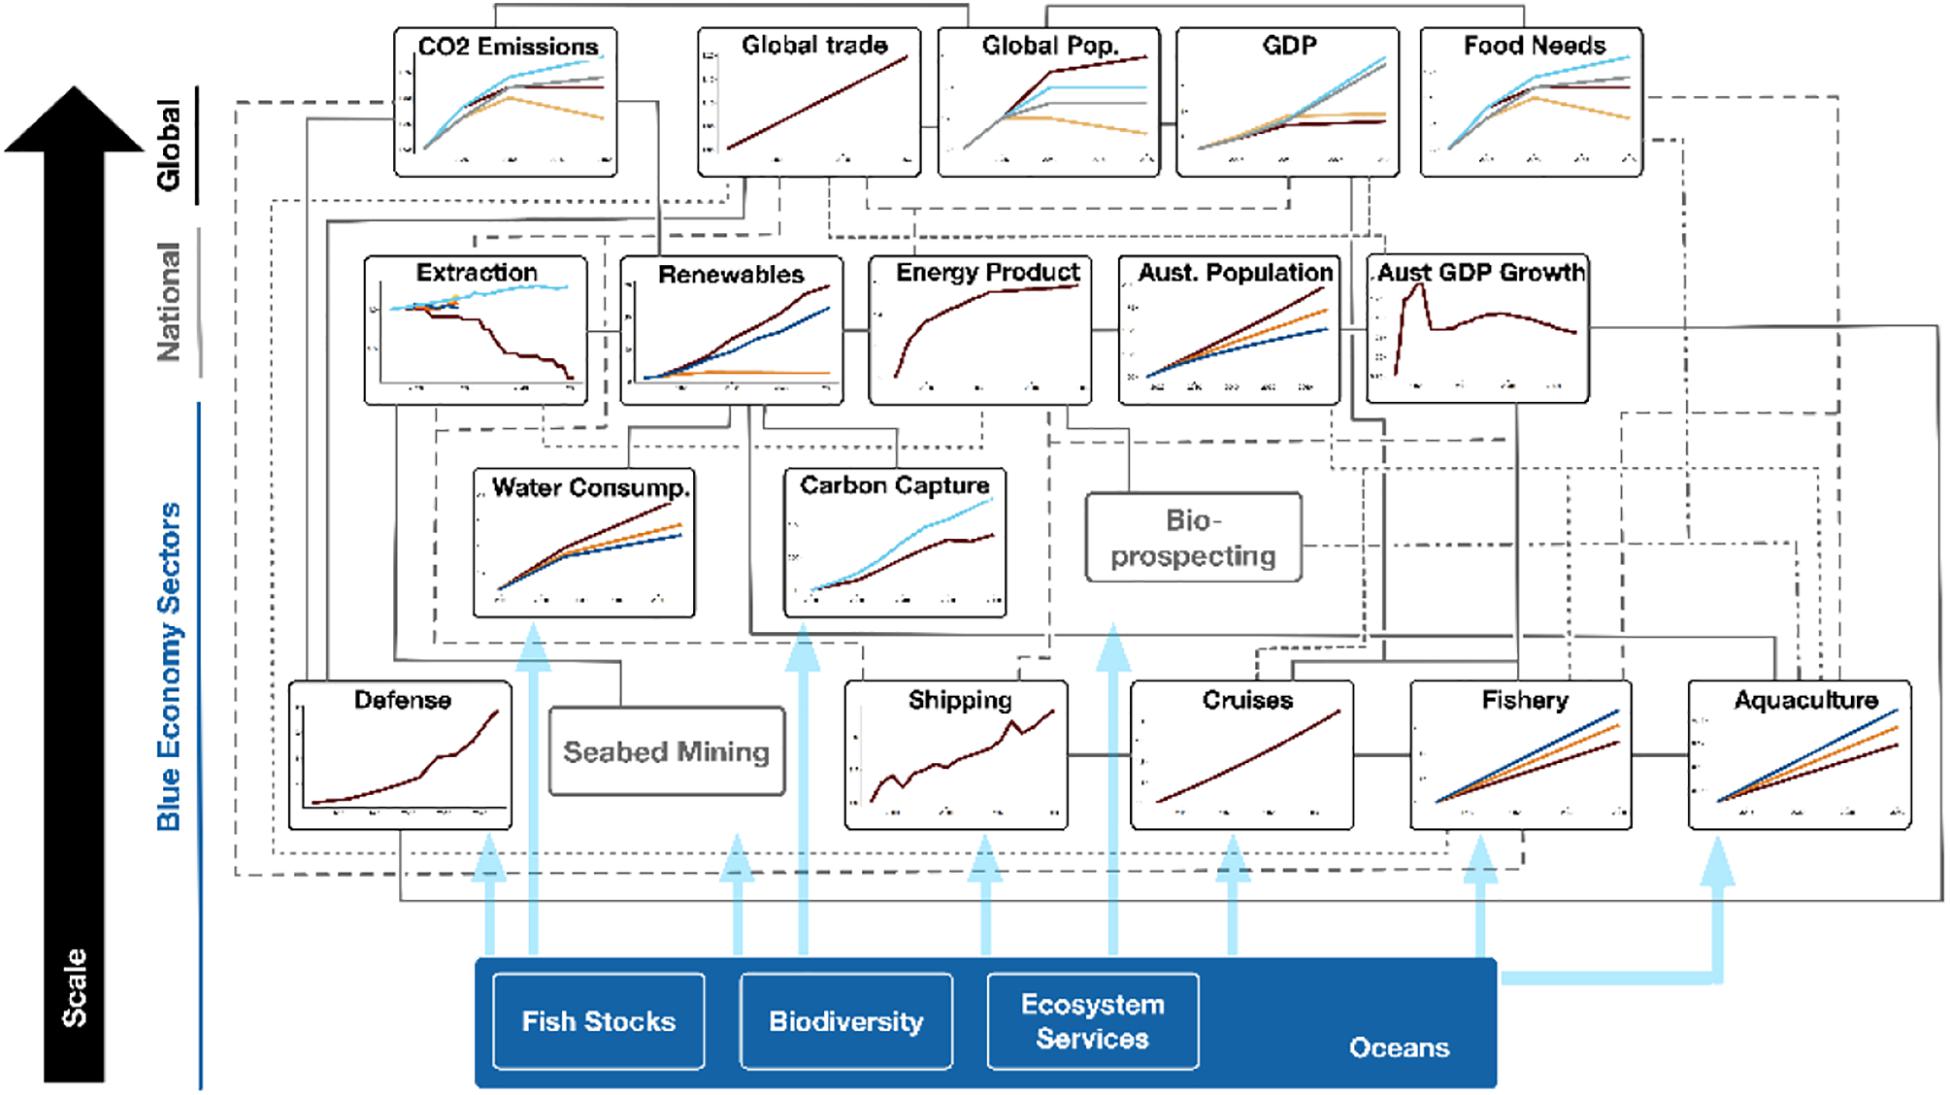
Figure 3. The conceptual model with projections of future development for each component, with the exception of sea-bed mining and bio-prospecting for which Australian numerical projections could not be found. The time horizons of the projections vary considerably, from a few years for some business and economic sectors to a century for climate change (CO2 emissions). To simplify the visual comparison, the projections are plotted as the ratio over the value in the year 2019. Labels for multiple sector projections are given in Supplementary Material, Section 3. Here and in all other figures, edges are plotted via different line styles for ease of visualisation.
A few observations can be drawn from analyzing the set of projections (Figure 3). First, with the single exception of coal use for energy generation (in the National Extractive sector), all projections show growth (notice that this also applies to Australian GDP, since it plots GDP growth, which is >1 for most of the projected time span). Second, we assessed which of the Global Scenarios in Figure 2 is most aligned with the set of projections, on average. To do so, we developed two measures: (i) the Mean Correlation, given by the mean of the correlations between the indicators for each Global Scenario and all Sector Projections and (ii) The Mean Similarity Rank, given by the mean of each Global Scenario similarity rank over all sector projections (n = 17). Details of how these measures have been computed is given in the Supplementary Material, Section 2. The results are shown in Table 1.
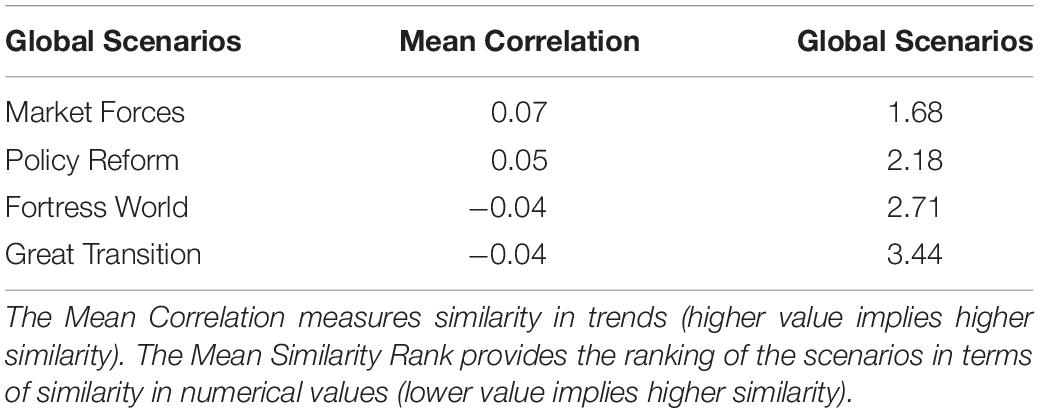
Table 1. Mean Correlation and Mean Similarity Rank for each Great Transition Initiative Global Scenarios, computed against 17 Sector Projections.
Table 1 shows a good match between the relative order in the Mean Correlation and Mean Similarity Rank results. Both measures suggest that the Sector Projections are most aligned with the Market Forces Global Scenario, followed by Policy Reform, with Great Transition being the most dissimilar. Of particular significance is that both Market Forces and Policy Reform have a positive (albeit small) mean correlation with the Sector Scenarios, while Fortress World and Great Transition have a small mean negative correlation. Although the Mean Correlation and Mean Similarity Rank provide only approximate indications of similarity (see the Supplementary Material, Section 2 for details of the measurement limitations), they provide complementary information since The Mean Correlation is most sensitive to similarity in trends, while the Mean Similarity Rank is most sensitive to similarity in numerical values. The fact that these measures provide the same ranking for all four Global Scenarios gives some weight to our interpretation. It is important to clarify that the alignment of the Sector Projections with the Market Forces and Policy Reform Global Scenarios should not be interpreted as a suggestion that these scenarios are more likely to occur in the future. Rather, it should be interpreted as a suggestion that these scenarios are most consistent with the assumptions and expectations of future development in the sectors we analyzed.
Third, some National drivers and Blue Economy sectors show alternative projections based on alternative scenarios, while for some we could locate only a single projection, reflecting a single, business-as-usual scenario. However, it is important to notice that the sectors which provide multiple projections have based these projections on different sets of scenarios. Some employ the IPCC scenarios (IPCC, 2014), others the International Energy Agency scenarios (IE Agency, 2018), others the ABS population growth scenarios [Australian Bureau of Statistics (ABS), 2018b], but most use sets of scenarios designed by sector’s experts for the sector’s specific needs. All together more than 10 different sets of scenarios form the basis of the projections in Figure 3. In addition, our analysis found that these scenarios can be grouped in two types. The first type is forward looking and includes most projections: it is based on taking the state of a sector or process as it is now and considers how it may develop into the future. The second type is backward looking (e.g., carbon capture and renewable energy): it takes an aspirational state of the sector at some time in the future (as set by the Paris Agreement or Sustainable Development Goals, for example) and considers how it can be reached from the current state of the system. Finally, the time horizons of the projections vary considerably, from a few years for some business and economic sectors to a century for climate change and biodiversity projections. The implications of different sets and types of scenarios and time horizons are discussed in Section 4.
Local Context and Sector Interactions
The conceptual model in Figure 1 offers a broad system view of the components shaping the future of Australian oceans. We can also assess the system as viewed from each sector. As an example, the literature we reviewed for the sector specific projection of Maritime Transport, shortened to ‘Shipping’ in the figures (see Supplementary Material, Section 3), explicitly mentions global GDP, national GDP, global trade, mining, oil and gas, population growth and tourism as drivers of future development. This confirms connections included in the original conceptual model (Figure 1). In addition, however, it also mentions fluctuations in exchange rates, disease outbreaks, international terrorist threats and government regulations and compliances, which were not included in the original conceptual model. Adding these new factors to the conceptual model gives the updated structure shown in Figure 4.
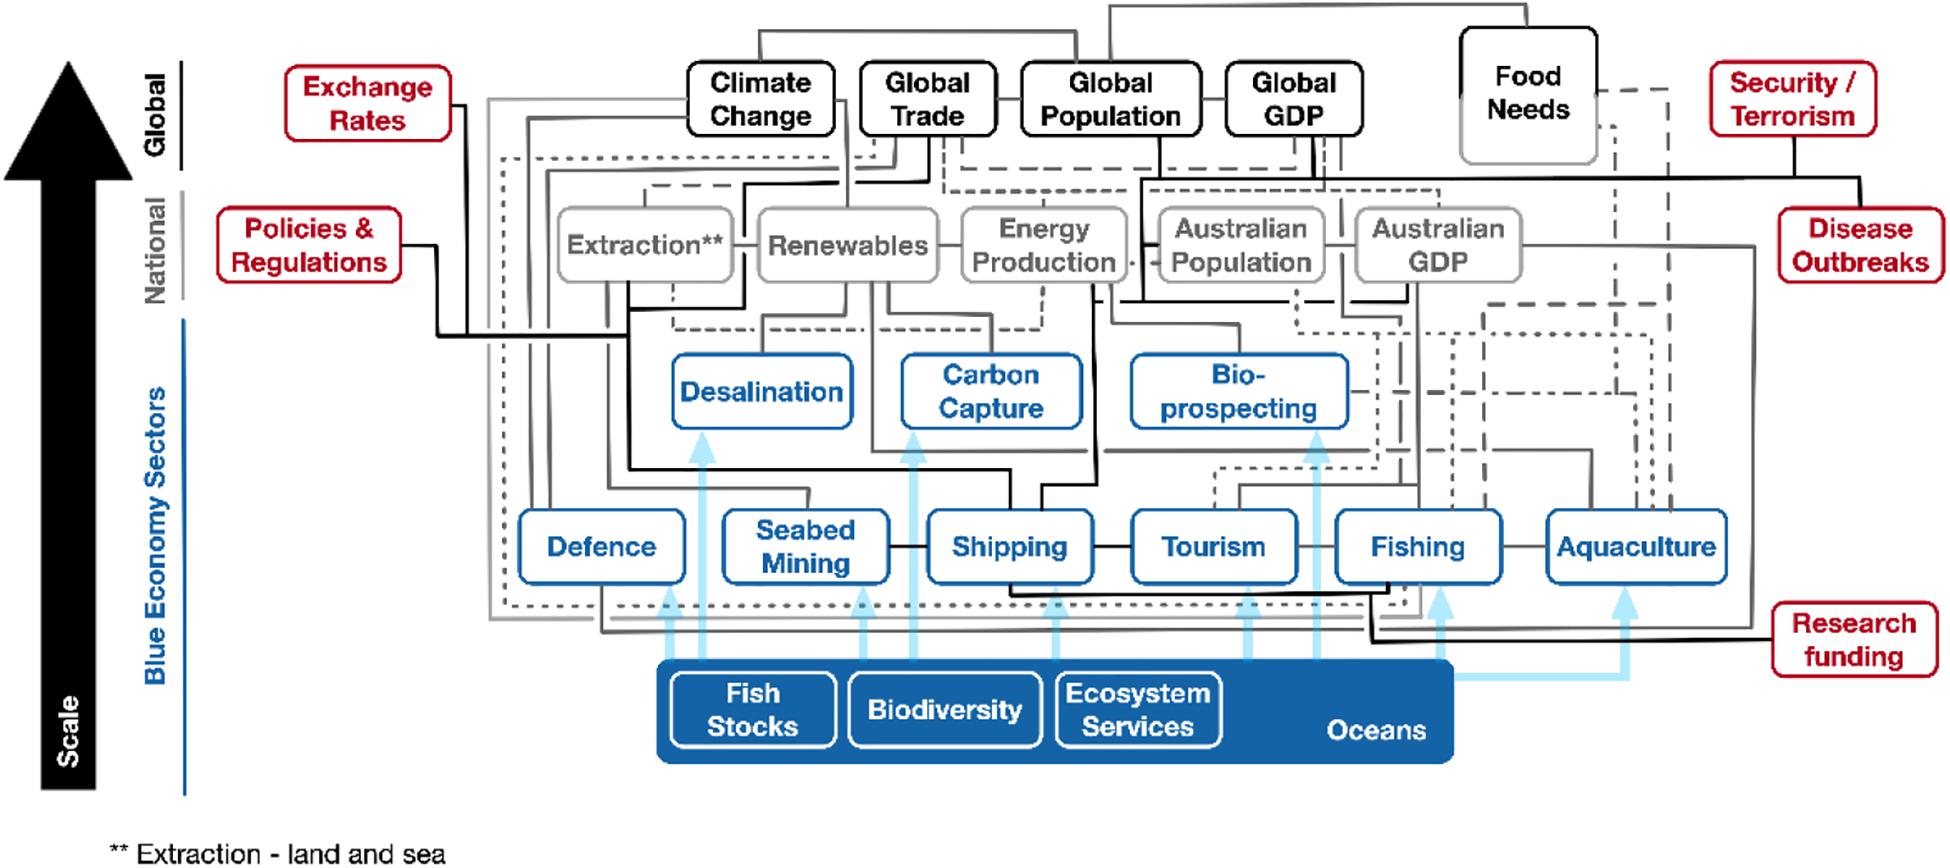
Figure 4. The original conceptual model further developed with information from the shipping sector. Interactions with processes not originally included in the conceptual model in Figure 1 are shown in red and constitute the additional insight obtained by combining top-down and bottom-up analysis of the system. Here and in all other figures, edges are plotted via different line styles for ease of visualisation.
A further example of the type of knowledge which can be gained by coupling a top down and bottom up system analysis is provided by the analysis of the fishing sector (Figure 5). In Figure 1 the fishery sector is linked only to aquaculture, tourism, Australia population and GDP, global trade, climate change and global food requirements. Literature searches provided us with access to a deeper and broader set of information on this sector’s projections (see Supplementary Material, Section 1) than for other sectors. In addition, the maturity of the sector, the level of regulations and a long history of model use also have an impact on the numbers of models and projections available. As a result, the projections we collected revealed a more nuanced understanding of the sector and its drivers than was revealed by analyzing Maritime Transport. In addition to what was already captured in Figure 1, our analysis reveals how the fishery sector is likely to be affected by diet preferences both in Australia and overseas, GDP growth in specific trade partners (Japan and China in particular), overseas aquaculture production, relative income distribution (both in Australia and overseas markets), disease outbreaks, balance with land food production in Australia, energy costs, exchange rates, environmental degradation, environmental regulations, black markets for fish products, societal attitudes toward fishing, technology, property rights and financial investments options (see Figure 5). Some of these drivers may be pertinent only to the fishery sector, while others may be relevant to other model components besides the fishery sector. For example, disease outbreaks, exchange rates and regulations, were already discussed in the projections of the Maritime Transport sector (Figure 4) and thus represent avenues for interaction between the fishery and the shipping sectors.
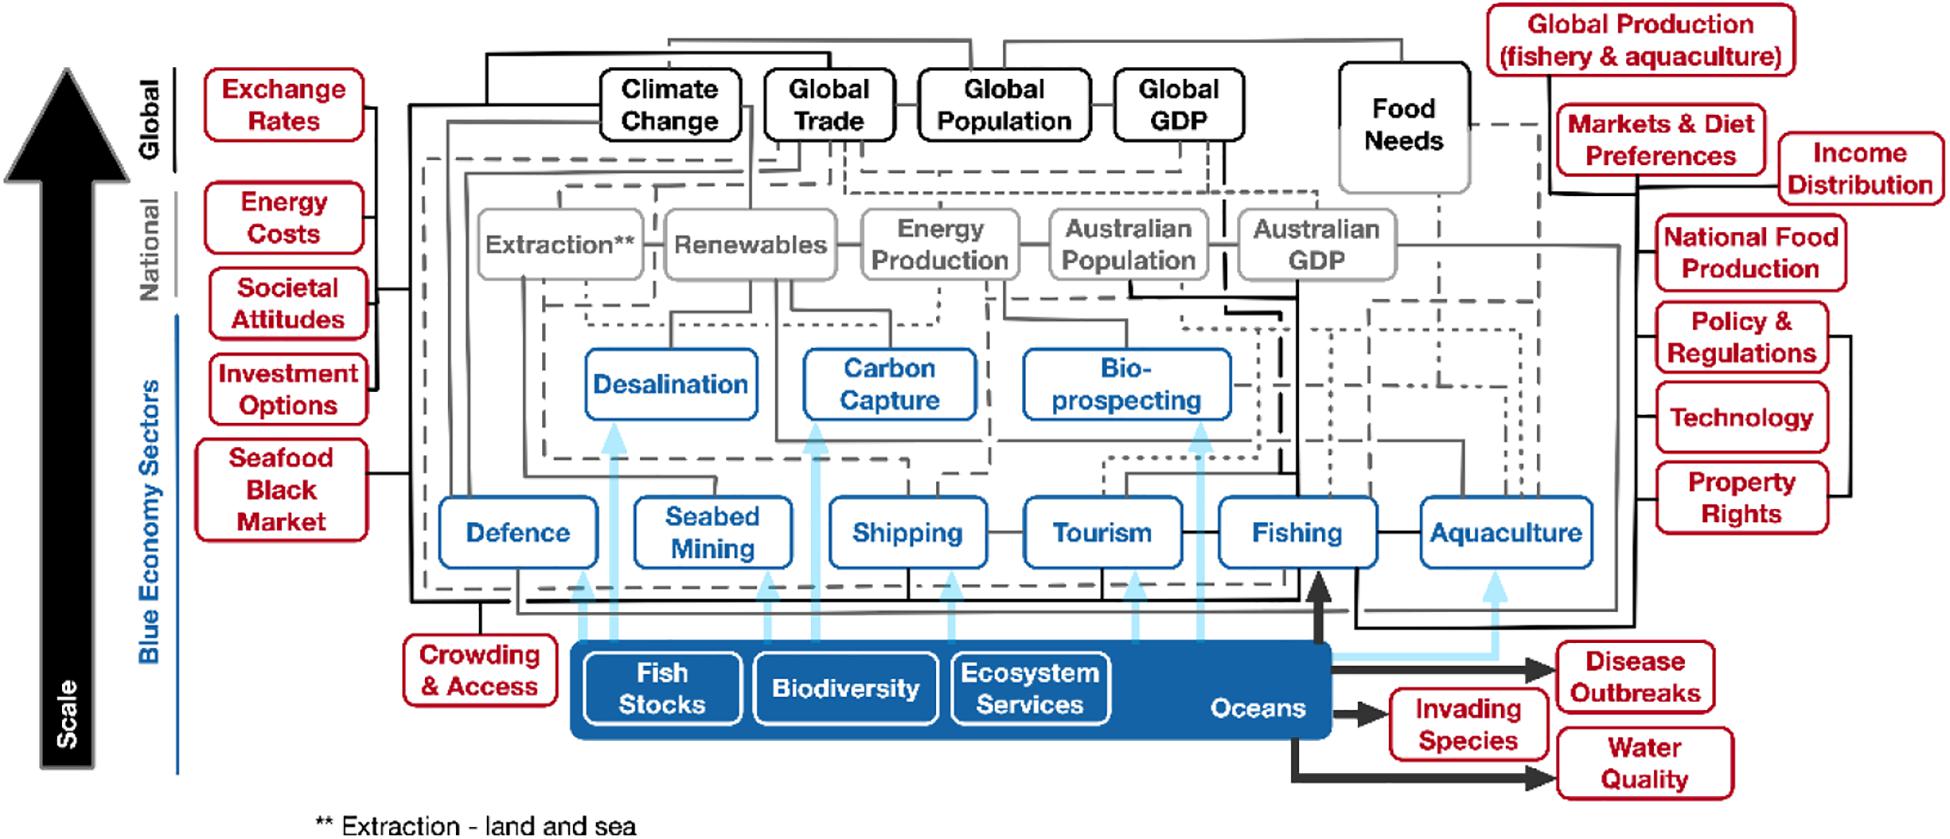
Figure 5. The original conceptual model further developed with information from the fishery sector. Interactions with processes not originally included in the conceptual model in Figure 1 are shown in red and constitute the additional insight obtained by combining top-down and bottom-up analysis of the system. Similarly, the thick black arrows show additional direct connections from the natural world into the blue economy. Here and in all other figures, edges are plotted via different line styles for ease of visualisation.
The conceptual models for all remaining sectors are provided in links provided at Supplementary Material, Section 3 together with the original conceptual model in Figure 1 further developed with information from all Blue Economy sectors. In any modeling exercise, a suitable level of description needs to be found, which includes the components pertinent to the scope of the model. Fewer components may fail to describe important dynamical features of interest while more components may lead to unnecessary complexity (Fulton, 2001; Israeli and Goldenfeld, 2004). Finding a fine balance requires knowledge, system understanding and experience but also intuition; it is an art as much as a science. The final choice is also subjective and can be affected by the modelers’ expertise. Whether each sectors’ driver needs including into this comprehensive conceptual model that still holds relevance and legitimacy for the people/sector using it will likely depend on the purpose and the stakeholders involved, as discussed in Section 4.
Example Scenarios for the Individual Sectors
One of the purposes of developing a conceptual model as in Figure 4 is to better understand system function - that is how a perturbation to a model component may spread through the network of interactions. This may enable us to consider ‘what if’ scenarios and to prepare for them. One such example is provided in Figure 6, in which we consider a perturbation leading to a reduction in global trade. The thick links help visualize how such perturbation may spread through the system. In this hypothetical scenario, the direct impacts of a reduction in global trade lead to a trade imbalance negatively affecting the Australia GDP growth, a reduced demand for Australia mineral resources, a reduction in Australia energy production and requirement, a shrinking in shipping activities and a reduction in defense contracts. In turn, these lead to indirect impacts on offshore oil and gas production, attractiveness of seabed mining and carbon capture projects, a possible increase in attractiveness for renewable energy projects, a reduction in tourist numbers to Australia, and reduced exports of fishery and aquaculture production. In fact, this is very similar to the current situation arising in Australia as a result of COVID-19. Fishery and aquaculture are also further affected by possible increases in energy costs and local market demand.
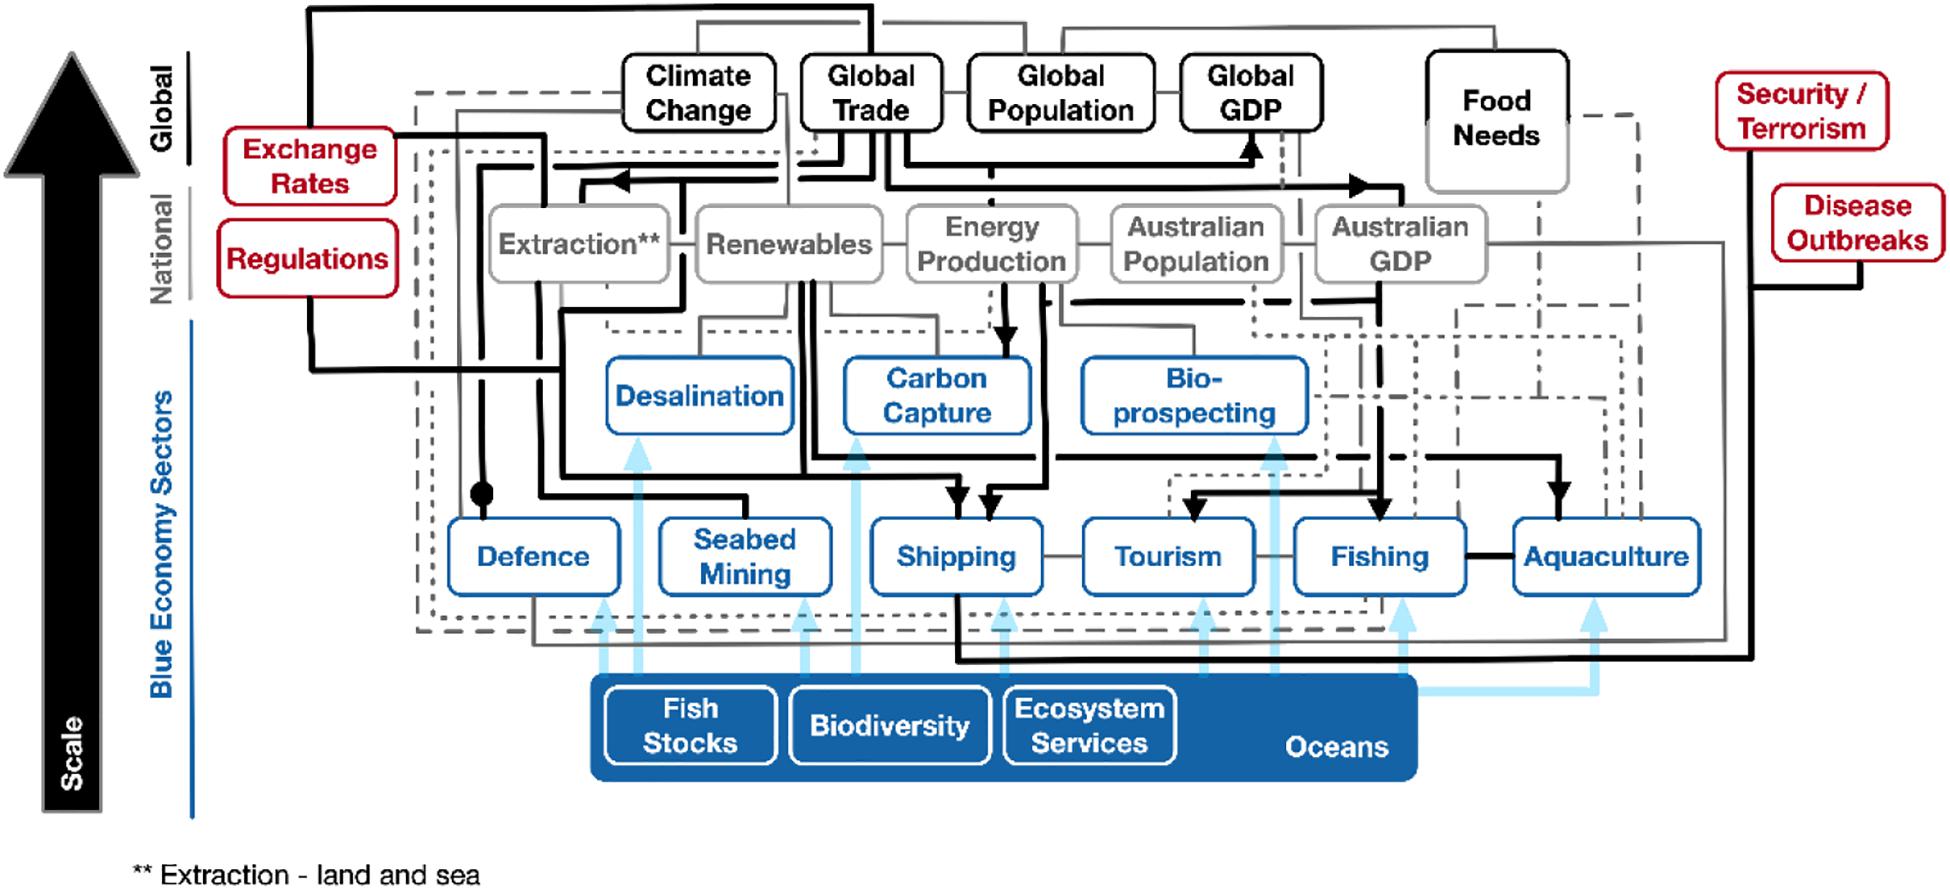
Figure 6. Path of spread of a perturbation to the Global trade component through the network of interactions captured by the conceptual model (thick links). This type of analysis may help a stakeholder team consider possible impacts of a set of ‘what if’ scenarios between linked components. Here and in all other figures, edges are plotted via different line styles for ease of visualisation.
In general, sectors may interact both via direct and indirect pathways, different pathways may have positive or negative impact and each pathway may have a different response time. This may result in transient dynamics and non-linear counterintuitive outcomes whose complexity may warrant analysis with numerical modeling. It follows that the considerations of ‘what if’ scenarios as described above are better suited to develop narratives of possible future developments than projections. In particular, they are best suited at preparing for possible uncertain futures and to help turning ‘unknown unknowns’ into known ones (Boschetti, 2011).
Discussion
‘In preparing for battle I have always found that plans are useless, but planning is indispensable’ (Eisenhower, 1957).
In the Future Studies literature, it is commonly acknowledged that participating in a scenario exercise provides a type of learning which goes beyond what can be captured by the specific set of scenarios developed during the exercise (De Vries, 2007; Coates et al., 2010). The act of planning and exploring the future is considered, by some, more important that its outcome in the form of strategic planning and scenarios. The rationale for this statement is that by the time a plan or a scenario is formulated and deployed, the world has likely changed and a new plan and scenario is needed. However, the effort spent in understanding system functioning, considering alternative options, and exploring counterfactuals will make updating the plan and scenario faster and more effective. In the language of adaptive management, planning predisposes for better adaptation.
Within this context, we have made three contributions to the Future Studies literature with a specific focus on decision and policy making for Australia’s oceans under a Blue Economy lens. First, we propose a framework within which conceptual models, scenarios and projections can be integrated and consistently analyzed. Developing a conceptual model is necessary to ensure that a system view of a problem is accounted for and that the drivers acting at different scales are understood. Doing so before the scenarios are developed makes sure that drivers which may appear irrelevant to the scenarios under discussion, but which may indirectly determine how the system responds, are included. Once the scenario narratives are produced, projections of sector behavior, either modeled or independently developed by sector representatives, can provide a first-pass reality check on the plausibility of the scenario narratives. Comparison of the conceptual model and these projections informs us on whether the projections are consistent with the conceptual model. This can inform whether the conceptual model includes the minimum set of processes needed for a useful system representation, or whether it needs updating. It also highlights whether the projections themselves are consistent with system understanding (it is possible for projections to suggest an unrealistic outcome because the underlying model used omits constraints coming from the broader system). Sector projections also play the role of virtual indicators of expert confidence in future system behavior. As an example, by analyzing projections of development in several Blue Economy sectors, we show that among the four global scenarios modeled by the Great Transition Initiative, the Market Forces and Policy Reform scenarios appear to be more consistent with current expectations, because they more closely align with projected growth in most sectors. This suggests that, seen from within the Blue Economy sectors, the future of Australian oceans is perceived to be largely determined by the intersection of markets and policy making, with societal and technological innovation, as well as divisive geopolitical interests and conflicts (described by the Great Transition and Fortress World global scenarios, respectively), playing a secondary role.
Second, we highlight some specific challenges which need to be addressed in order to make the suggested approach more effective. On the one hand, projections from different sectors are likely to be based on scenarios and assumptions which are sector specific and difficult to compare. On the other hand, global scenarios may be too general to inform local sectors. This highlights the need to develop a set of scenarios which are informative and relevant to all Blue Economy sectors and which can be used for a comparative analysis. Borrowing from the concept of “Shared Socioeconomic Pathways” (O’Neill et al., 2014), high seas fisheries have already proposed “Shared Ocean Pathways” to provide a common framework for discussion of fisheries across nations participating in these fisheries (Maury et al., 2017). A set of “Shared Australian Ocean Pathways” could perhaps play a similar role at national scale across Blue Economy sectors. Particularly challenging will be to make these scenarios equally informative to sectors whose dynamics play out at very fast time scales, such as exchange rates and regional and global trade, as well as to biodiversity and climate change processes, which play out at decadal and secular time scales.
Finally, the conceptual model and sector projections are not the end-points of this study, rather they are tools to enhance communication among sectors representatives and stakeholders. As an example, these have already been used both to guide and to assess future scenarios exploring changes in Australian fisheries. This occurred as part of stakeholder engagement to support a fisheries research funding organization develop a new strategic plan. The model helped to clarify which of the global and national drivers could influence the sustainable management of seafood in Australia and via what paths such influence could materialize. Consideration of these drivers and linkages were used by stakeholder groups to define alternative future worlds as well as to widen the set of indicators requiring monitoring. Communication with sector stakeholders may also provide information about most suitable indicators of sector development and address uncertainty in the analysis which may arise when proxi indicators are used (in our case, water consumption for desalination and cruise passengers for tourism, as discussed in Section 3.1).
The conceptual model in Figure 1 and the sector projections in Supplementary Material, Section 3 should be viewed as living documents, which we intend to update at regular intervals following feedback and information provided by sector representatives with the aim of achieving a shared understanding of the functioning and possible futures of the Australian oceans in a Blue Economy. For this reason, we make our sector projections publicly available at https://research.csiro.au/oceanfutures/combining-conceptual-models-sectoral-futures-and-global-and-national-scenarios/.
Data Availability Statement
The original contributions presented in the study are included in the article/Supplementary Material, further inquiries can be directed to the corresponding author.
Author Contributions
FB performed conceptualization, methodology, writing, visualization, and formal analysis. CB, SC, HL-M, LR, and JS performed investigation, data curation, and writing. AH performed conceptualization, methodology, and writing. EF performed conceptualization, methodology, writing, and visualization. AS performed conceptualization and methodology. EP performed writing. All authors contributed to the article and approved the submitted version.
Conflict of Interest
The authors declare that the research was conducted in the absence of any commercial or financial relationships that could be construed as a potential conflict of interest.
Acknowledgments
We acknowledge Chris Moeseneder, Cindy Bessey, Christopher Cvitanovic, Jeffery Dambacher, Leo Dutra, Dale Kolody, Andrew Lenton, L. Richard Little, Bruce Mapstone, Karlie McDonald, John Parslow, Eva E. Plaganyi, Heidi Pethybridge, Peter Rothlisberg, Robert L. Stephenson, and Peter Thompson for their input and discussions during a number of team meetings and workshops. We also acknowledge Jessica Melbourne-Thomas for useful comments on the manuscript.
Supplementary Material
The Supplementary Material for this article can be found online at: https://www.frontiersin.org/articles/10.3389/fmars.2020.563205/full#supplementary-material
References
Alford, K., Cork, S., Finnigan, J. J., Grigg, N., Fulton, B., and Raupach, M. R. (2014). The challenges of living scenarios for Australia in 2050. J. Futures Stud. 18, 115–112.
Australian Bureau of Statistics [ABS] (2018a). Australian National Accounts: State Accounts, 2017-18. Canberra: Austral Bureau of Statistics.
Australian Bureau of Statistics [ABS] (2018b). Population Projections, Australia, 2017 to 2066. Canberra: Australian Bureau of Statistics [ABS].
Ayres, R., and Warr, B. (2001). Two Paradigms of Production and Growth. London: INSEAD Center for the Management.
Bezold, C. (2009). Jim Dator’s Alternative Futures and the Path to IAF’s Aspirational Futures. J. Futures Stud. 14, 123–134.
Bezold, C. (2010). Lessons from using scenarios for strategic foresight. Technol. Forecast. Soc. Change 77, 1513–1518. doi: 10.1016/j.techfore.2010.06.012
Boschetti, F. (2011). A graphical representation of uncertainty in complex decision making. Emergence Complexity Organ. 13, 146–168.
Boschetti, F., Price, J., and Walker, I. (2016). Myths of the future and scenario archetypes. Technol. Forecast. Soc. Change 111, 76–85. doi: 10.1016/j.techfore.2016.06.009
Burgess, M. G., Clemence, M., Mcdermott, G. R., Costello, C., and Gaines, S. D. (2018). Five rules for pragmatic blue growth. Mar. Policy 87, 331–339. doi: 10.1016/j.marpol.2016.12.005
Coates, J., Durance, P., and Godet, M. (2010). Strategic foresight issue: introduction. Technol. Forecast. Soc. Change 77, 1423–1425. doi: 10.1016/j.techfore.2010.08.001
Curry, A., and Schultz, W. (2009). Roads less travelled: different methods, different futures. J. Futures Stud. 13, 35–60.
Dator, J. (1998). The future lies behind! Thirty years of teaching futures studies. Am. Behav. Sci. 42, 298–319. doi: 10.1177/0002764298042003002
De Vries, B. (2007). “Scenarios: guidance for an uncertain and complex world?,” in Sustainability or Collapse?, eds R. Costanza, L. Graumlich, and W. Steffen (Cambridge: MIT Press).
Douglas, M., and Wildavsky, A. (1982). Risk and Culture: An Essay on The Selection of Technological and Environmental Dangers. Berkeley: University of California Press.
Eikeset, A. M., Mazzarella, A. B., Davíðsdóttir, B., Klinger, D. H., Levin, S. A., Rovenskaya, E., et al. (2018). What is blue growth? The semantics of “Sustainable Development” of marine environments. Mar. Policy 87, 177–179. doi: 10.1016/j.marpol.2017.10.019
Eisenhower, D. D. (1957). Containing the Public Messages, Speeches, and Statements of the President, January 1 to December 31, 1957. Washington: Office of the Federal Register, National Archives and Records Service, General Services Administration : For sale by the Supt. of Docs., U.S. G.P.O.
Electris, C., Raskin, P., Rosen, R., and Stutz, J. (2009). The Century Ahead: Four Global Scenarios: Technical Documentation. Boston, MA: Tellus Institute.
Fulton, E. A. (2001). The Effects of Model Structure and Complexity on the Behaviour and Performance of Marine Ecosystem Models. Hobart: University of Tasmania.
Grabo, C. M. (2012). Anticipating Surprise: Analysis for Strategic Warning. Bethesda, MD: Center for Strategic Intelligence Research, Joint Military Intelligence College.
Hancock, T., and Bezold, C. (1994). Possible futures, preferable futures. Health Forum J. 37, 23–29.
Hilborn, R. (2011). The Environmental Costs of Fish From the Ocean or Food From the Land. Seafood Summit 2011. Bethesda, MD: Center for Strategic Intelligence Research, Joint Military Intelligence College.
Howard, B. C. (2018). Blue growth: stakeholder perspectives. Mar. Policy 87, 375–377. doi: 10.1016/j.marpol.2017.11.002
Hunt, D. V. L., Lombardi, D. R., Atkinson, S., Barber, A. R. G., Barnes, M., Boyko, C. T., et al. (2012). Scenario archetypes: converging rather than diverging themes. Sustainability 4, 740–772. doi: 10.3390/su4040740
Inayatullah, S. (2004). “Causal layered analysis: theory, historical context, and case studies,” in The Causal Layered Analysis (CLA) Reader: Theory and Case Studies of an Integrative and Transformative Methodology, ed. S. Inayatullah (Taipei: Tamkang University Press), 8–49.
Israeli, N., and Goldenfeld, N. (2004). Computational irreducibility and the predictability of complex physical systems. Phys. Rev. Lett. 92:074105.
Jefferson, M. (2012). Shell scenarios: what really happened in the 1970s and what may be learned for current world prospects. Technol. Forecast. Soc. Change 79, 186–197. doi: 10.1016/j.techfore.2011.08.007
Maury, O., Campling, L., Arrizabalaga, H., Aumont, O., Bopp, L., Merino, G., et al. (2017). From shared socio-economic pathways (SSPs) to oceanic system pathways (OSPs): building policy-relevant scenarios for global oceanic ecosystems and fisheries. Glob. Environ. Change 45, 203–216. doi: 10.1016/j.gloenvcha.2017.06.007
McDonald, K. S., Hobday, A. J., Fulton, E. A., and Thompson, P. A. (2018). Interdisciplinary knowledge exchange across scales in a globally changing marine environment. Glob. Change Biol. 24, 3039–3054. doi: 10.1111/gcb.14168
Miles, I. (2010). The development of technology foresight: a review. Technol. Forecast. Soc. Change 77, 1448–1456. doi: 10.1016/j.techfore.2010.07.016
National Marine Science Committee (2015). National Marine Science Plan 2015-2025: Driving the Development of Australia's Blue Economy. Harbour: National Marine Science Committee.
Noaa Office for Coastal Management (2019). NOAA Report on the U.S. Ocean and Great Lakes Economy. Charleston, SC: National Oceanic and Atmospheric Administration (NOAA), Office for Coastal Management.
O’Neill, B. C., Kriegler, E., Riahi, K., Ebi, K. L., Hallegatte, S., Carter, T. R., et al. (2014). A new scenario framework for climate change research: the concept of shared socioeconomic pathways. Clim. Change 122, 387–400. doi: 10.1007/s10584-013-0905-2
Pauly, D., and Maclean, J. (2003). In a Perfect Ocean: The State of Fisheries and Ecosystems in the North Atlantic Ocean. Washington, DC: Island Press.
Pinnegar, J., Viner, D., Hadley, D., Dye, S., Harris, M., Berkout, F., et al. (2006). Alternative Future Scenarios for Marine Ecosystems: Technical Report. Lowestoft: Department for Environment, Food and Rural Affairs.
Price, J., Walker, I., and Boschetti, F. (2014). Measuring cultural values and beliefs about environment to identify their role in climate change responses. J. Environ. Psychol. 37, 8–20. doi: 10.1016/j.jenvp.2013.10.001
Ramirez, R., and Wilkinson, A. (2013). Rethinking the 2∗2 scenario method: grid or frames? Technol. Forecast. Soc. Change 86, 254–264. doi: 10.1016/j.techfore.2013.10.020
Raskin, P. D., Electris, C., and Rosen, R. A. (2010). The century ahead: searching for sustainability. Sustainability 2, 2626–2651. doi: 10.3390/su2082626
Raven, P. G. (2014). The future’s four quarters: proposing a quadrant methodology for strategic prototyping in infrastructural contexts. Technol. Forecast. Soc. Change 84, 115–130. doi: 10.1016/j.techfore.2013.10.012
Safina, C. (1998). Song for The Blue Ocean: Encounters Along the World’s Coasts and Beneath the Seas. New York, NY: Holt Paperbacks.
Steinbeck, J. (1995). The Log from the Sea of Cortez. 1951. New York, NY: Twentieth-Century Classics.
Tellus Institute and Stockholm Environment Institute (2010). PoleStar Project [Online]. Available: http://www.polestarproject.org/ (accessed September, 2019).
Voyer, M., Quirk, G., Mcilgorm, A., and Azmi, K. (2018). Shades of blue: what do competing interpretations of the Blue Economy mean for oceans governance? J. Environ. Policy Plann. 20, 595–616. doi: 10.1080/1523908x.2018.1473153
Keywords: future studies, global scenarios, blue economy, marine resources, global change
Citation: Boschetti F, Bulman CM, Hobday AJ, Fulton EA, Contardo S, Lozano-Montes H, Robinson LM, Smith ADM, Strzelecki J and Ingrid van Putten E (2020) Sectoral Futures Are Conditional on Choices of Global and National Scenarios – Australian Marine Examples. Front. Mar. Sci. 7:563205. doi: 10.3389/fmars.2020.563205
Received: 03 July 2020; Accepted: 14 October 2020;
Published: 03 November 2020.
Edited by:
Eugen Victor Cristian Rusu, Dunarea de Jos University of Galati, RomaniaReviewed by:
Zuzana V. Harmackova, Global Change Research Institute, Czech Academy of Sciences, CzechiaMomme Butenschön, Ca’ Foscari University of Venice, Italy
Copyright © 2020 Boschetti, Bulman, Hobday, Fulton, Contardo, Lozano-Montes, Robinson, Smith, Strzelecki and Ingrid van Putten. This is an open-access article distributed under the terms of the Creative Commons Attribution License (CC BY). The use, distribution or reproduction in other forums is permitted, provided the original author(s) and the copyright owner(s) are credited and that the original publication in this journal is cited, in accordance with accepted academic practice. No use, distribution or reproduction is permitted which does not comply with these terms.
*Correspondence: Fabio Boschetti, Fabio.Boschetti@csiro.au