Seasonal and Interannual Variability of the CO2 System in the Eastern Mediterranean Sea: A Case Study in the North Western Levantine Basin
 Cathy Wimart-Rousseau1*
  Thibaut Wagener1
  Marta Álvarez2
  Thierry Moutin1
  Marine Fourrier3
  Laurent Coppola3,4
  Laure Niclas-Chirurgien1
  Patrick Raimbault1
  Fabrizio D’Ortenzio3
  Xavier Durrieu de Madron5
  Vincent Taillandier3
  Franck Dumas6
  Pascal Conan7
  Mireille Pujo-Pay7
  Dominique Lefèvre1
- 1Aix Marseille Université, Université de Toulon, CNRS, IRD, MIO, UM 110, Marseille, France
- 2Instituto Español de Oceanografia, A Coruña, Spain
- 3Sorbonne Université, CNRS, Laboratoire d’Océanographie de Villefranche, Villefranche-sur-Mer, France
- 4Sorbonne Université, CNRS, Institut de la Mer de Villefranche, Villefranche-sur-Mer, France
- 5CEFREM, CNRS-Université de Perpignan Via Domitia, Perpignan, France
- 6Service Hydrographique et Océanographique de la Marine—Shom, Brest, France
- 7Sorbonne Université, CNRS, Laboratoire d’Océanographie Microbienne, Observatoire Océanologique, Banyuls-sur-Mer, France
The seasonal variability of the carbonate system in the eastern Mediterranean Sea (EMed) was investigated based on discrete total alkalinity (AT), total dissolved inorganic carbon (CT), and pH measurements collected during three cruises around Crete between June 2018 and March 2019. This study presents a detailed description of this new carbonate chemistry dataset in the eastern Mediterranean Sea. We show that the North Western Levantine Basin (NWLB) is unique in terms of range of AT variation vs. CT variation in the upper water column over an annual cycle. The reasons for this singularity of the NWLB can be explained by the interplay between strong evaporation and the concomitant consumption of CT by autotrophic processes. The high range of AT variations, combined to temperature changes, has a strong impact on the variability of the seawater pCO2 (pCO2SW). Based on Argo float data, an entire annual cycle for pCO2SW in the NWLB has been reconstructed in order to estimate the temporal sequence of the potential “source” and “sink” of atmospheric CO2. By combining this dataset with previous observations in the NWLB, this study shows a significant ocean acidification and a decrease in the oceanic surface pHT25 of −0.0024 ± 0.0004 pHT25 units.a–1. The changes in the carbonate system are driven by the increase of atmospheric CO2 but also by unexplained temporal changes in the surface AT content. If we consider that the EMed will, in the future, encounter longer, more intense and warmer summer seasons, this study proposes some perspectives on the carbonate system functioning of the “future” EMed.
Introduction
Since the beginning of the industrial era, the rise in atmospheric CO2 due to anthropogenic activities is considered to be the main factor responsible for current climate change (IPCC, 2018). The ocean plays a significant role in modulating atmospheric CO2 as it has sequestrated ca. 31% of the global anthropogenic CO2 emissions in the past few decade (Gruber et al., 2019). Between 2009 and 2018, the ocean CO2 sink was estimated to be equal to 2.5 ± 0.6 PgC.a–1 (Friedlingstein et al., 2019). Ocean CO2 uptake induces an increase in hydronium ion concentration (i.e., a decrease in oceanic pH) commonly referred as ocean acidification (Doney et al., 2009). This ocean acidification represents a significant threat to marine organisms (Kroeker et al., 2013) and is likely to affect marine ecosystems (Feely et al., 2004).
The marginal Mediterranean Sea (MedSea) is a singular oceanic basin in terms of carbonate chemistry and deserves specific study. Due to the relatively short residence time of its water masses, this semi-enclosed, basin is considered to be more reactive to external forcing than other oceanic areas (Durrieu de Madron et al., 2011). The warm and highly alkaline waters absorb CO2 from the atmosphere and transport it to the interior by active overturning circulation (Schneider et al., 2010; Álvarez et al., 2014). Indeed, while representing only 0.3% of the global oceanic volume, the anthropogenic carbon content of the MedSea was estimated to represent 1.1% of the world’s ocean content in 1994 (Schneider et al., 2010; Lee et al., 2011). Moreover, several studies have reported a marked decline in the pH of the MedSea over the last few decades (e.g., Touratier and Goyet, 2011; Hassoun et al., 2015b; Palmiéri et al., 2015; Flecha et al., 2019).
Detailed descriptions of the circulation and water masses of the MedSea can be found in Millot and Taupier-Letage (2005), Bergamasco and Malanotte-Rizzoli (2010), and Durrieu de Madron et al. (2011). The water masses of the Eastern Mediterranean Sea (EMed) are warmer, more haline, more oxygenated and more alkaline than those in the Western Mediterranean Sea (WMed) (Álvarez et al., 2014). The EMed water column can be schematically divided into three layers: (1) The surface layer, filled with Modified Atlantic Waters (MAW) with specific regional and seasonal characteristics [e.g., Levantine Surface Waters (LSW)]; (2) Intermediate waters characterised, in the presence of MAW, by a local salinity maximum and generally described by the generic name Levantine Intermediate Waters (LIW); (3) The Eastern Mediterranean Deep Waters (EMDW), mostly retained in the EMed, consisting of a mixture of Adriatic Deep Waters (AdDW) and Aegean Deep Waters (AeDW). EMDW have undergone drastic changes over the last few decades (known as the Eastern Mediterranean Transient; Roether et al., 1996).
The MedSea is already exhibiting a consistent ocean acidification trend as a direct consequence to oceanic CO2 uptake. It is therefore important to observe carbonate chemistry over sustained time-series to understand the long-term changes in ocean chemistry. The seasonal dynamics of the carbonate system, crucial in understanding the variability in the air-sea CO2 exchanges, also requires these important time-series observations. When compared to other oceanic areas, including the WMed, the oligotrophic EMed (Pujo-Pay et al., 2011) is characterised by low primary production rates (Moutin and Raimbault, 2002). This low productivity reduces the vertical gradients of dissolved inorganic carbon, making the detection and understanding of decadal and seasonal changes in the carbonate system particularly challenging in this area. Over the last few decades, a considerable amount of work has been devoted to the EMed (e.g., Schneider et al., 2010; Álvarez et al., 2014; Hassoun et al., 2015b; Hainbucher et al., 2019), however, these cruises do not cover a full seasonal cycle leading to biased observations. Most of the time-series measurements recorded in the MedSea have been taken in the coastal (e.g., De Carlo et al., 2013; Ingrosso et al., 2016; Kapsenberg et al., 2017) and oceanic WMed (Lefèvre, 2010; Coppola et al., 2018). In the EMed, time-series measurements are scarce and mostly based in the Cretan Sea (Petihakis et al., 2018) or coastal sites such as the Lebanese coast (Hassoun et al., 2019) or the Israeli coast (Sisma-Ventura et al., 2017), precluding a rigorous description of the temporal variability of the carbonate system in the open-ocean EMed. In the MedSea open-ocean, studies based on data derived from satellite observations have been conducted to decipher, over a seasonal and interannual scale, the variations in pCO2 (D’Ortenzio et al., 2008; Taillandier et al., 2012). Nonetheless, understanding the variability in the seasonal carbonate system in the EMed is required to evaluate the effects of the increasing threats in this area, such as warming (Nykjaer, 2009) and ocean acidification.
In the frame of the PERLE project (the Pelagic Ecosystem Response to deep water formation in the Levant Experiment), an intense in situ survey of the Levantine area was carried out during 2018–2019 (D’Ortenzio et al., 2020). This study reports on a new oceanic inorganic carbon dataset acquired over three different periods of the year in the South Cretan area (described as the North Western Levantine Basin or NWLB hereafter) (Figure 1).
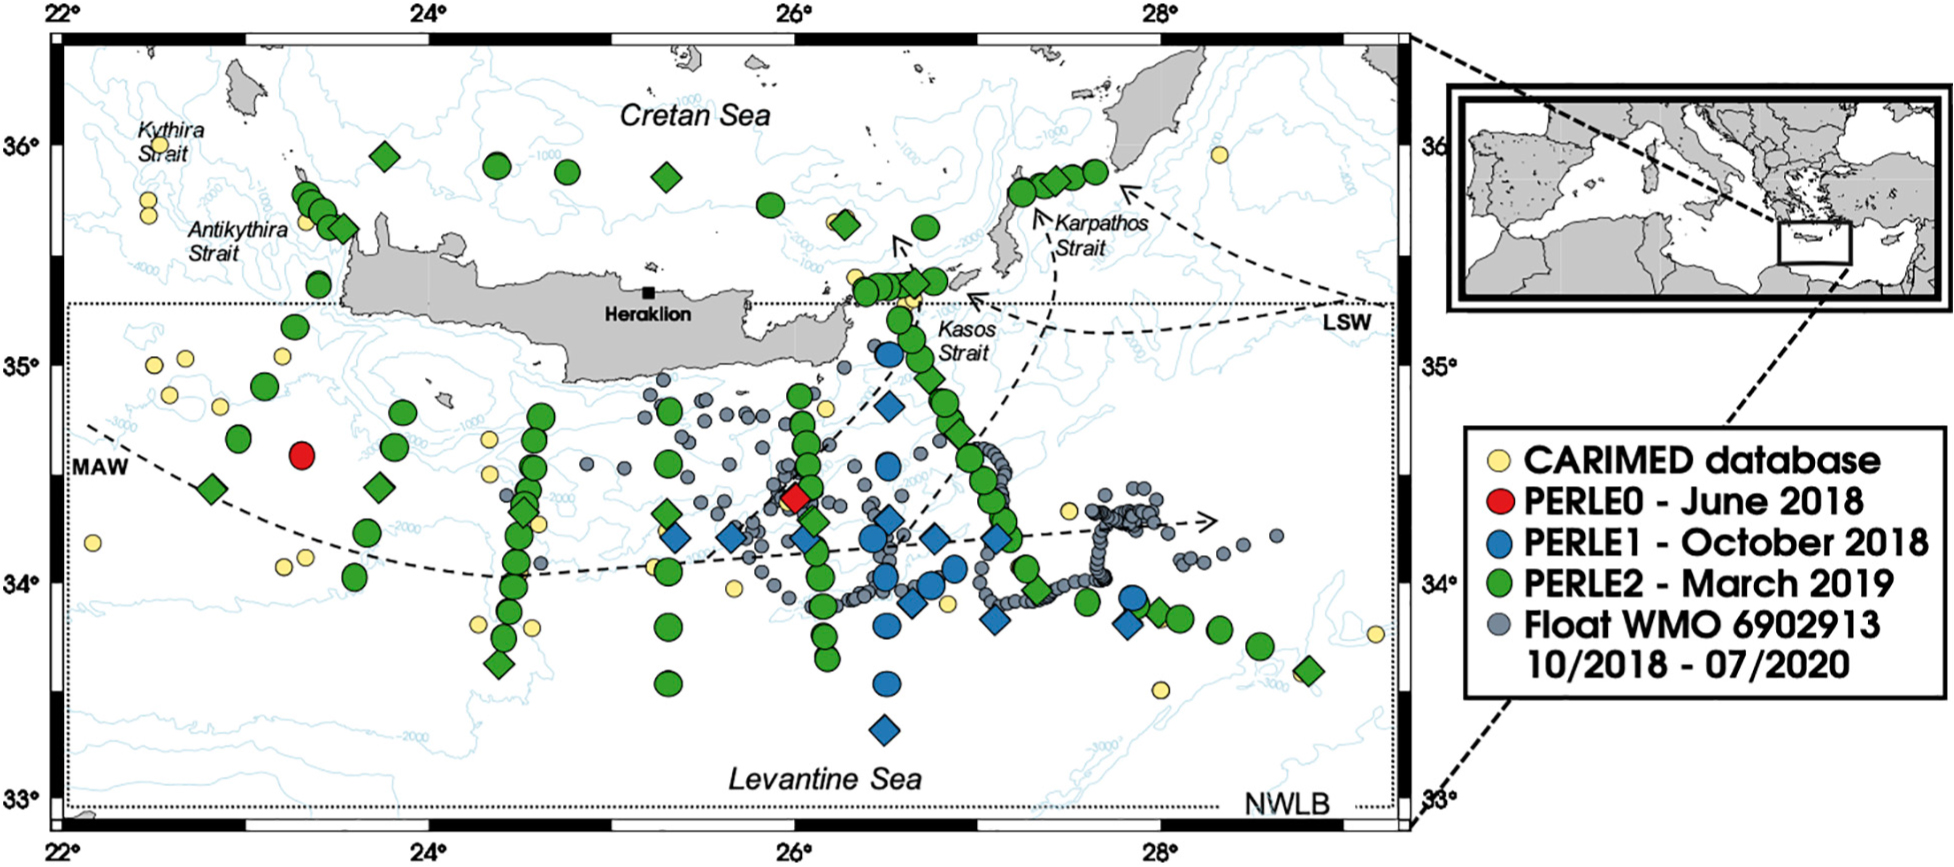
Figure 1. Map of the “PERLE area.” Stations visited during PERLE0 are in red, during PERLE1 in blue and during PERLE2 in green. Diamonds represent stations with carbonate chemistry. Stations from the CARIMED database with AT and CT measurements are shown by small yellow dots. Grey dots show the WMO 6902913 Argo profiler positions from October 2018 to July 2020. Arrows show the main surface water mass pathways (see acronyms in the text). The North Western Levantine Basin area (NWLB) is defined by the dotted insert.
This study gives a detailed description of this new dataset and the oceanographical context (section “Descriptive Carbonate Chemistry in the Context of the PERLE Cruises”). In section “Atypical Drivers of the Seasonal Dynamics of the Carbonate Chemistry Within the Mixed Layer of the North Western Levantine Basin,” using these new annual observations in the NWLB, the physical and biological drivers explaining the seasonal variability of the carbonate parameters in the upper water column will be investigated and the impact of the variations on air-sea CO2 fluxes will be discussed. In section “Long Term Temporal Changes in Carbonate Chemistry in the North Western Levantine Basin,” the main drivers of carbonate chemistry changes will be considered on longer timescales, based on the estimated trends in the surface carbonate chemistry of the NWLB derived from existing data over the last 20 years. Some hypotheses on the future of the carbonate system functioning of the EMed will be discussed.
Materials and Methods
Cruise and Sampling Strategy
This study focuses on three PERLE cruises: PERLE0, PERLE1, and PERLE2 (Figure 1). These cruises were carried out in the EMed between 2018 and 2019. At all stations, a CTD-Rosette was deployed (1) to acquire data with sensors (Conductivity Temperature and Depth–CTD and associated parameters) along vertical profiles and (2) to collect discrete seawater samples from Niskin bottles for chemical analysis. Over the 11, 31, and 125 casts performed during the PERLE0, PERLE1, and PERLE2 cruises, seawater was sampled from 1, 12, and 17 casts, respectively, for carbonate parameter analysis (see Supplementary Table 1 and Supplementary Figure 1). Details for the cruises and parameters measured during each PERLE cruise are summarised in Table 1.
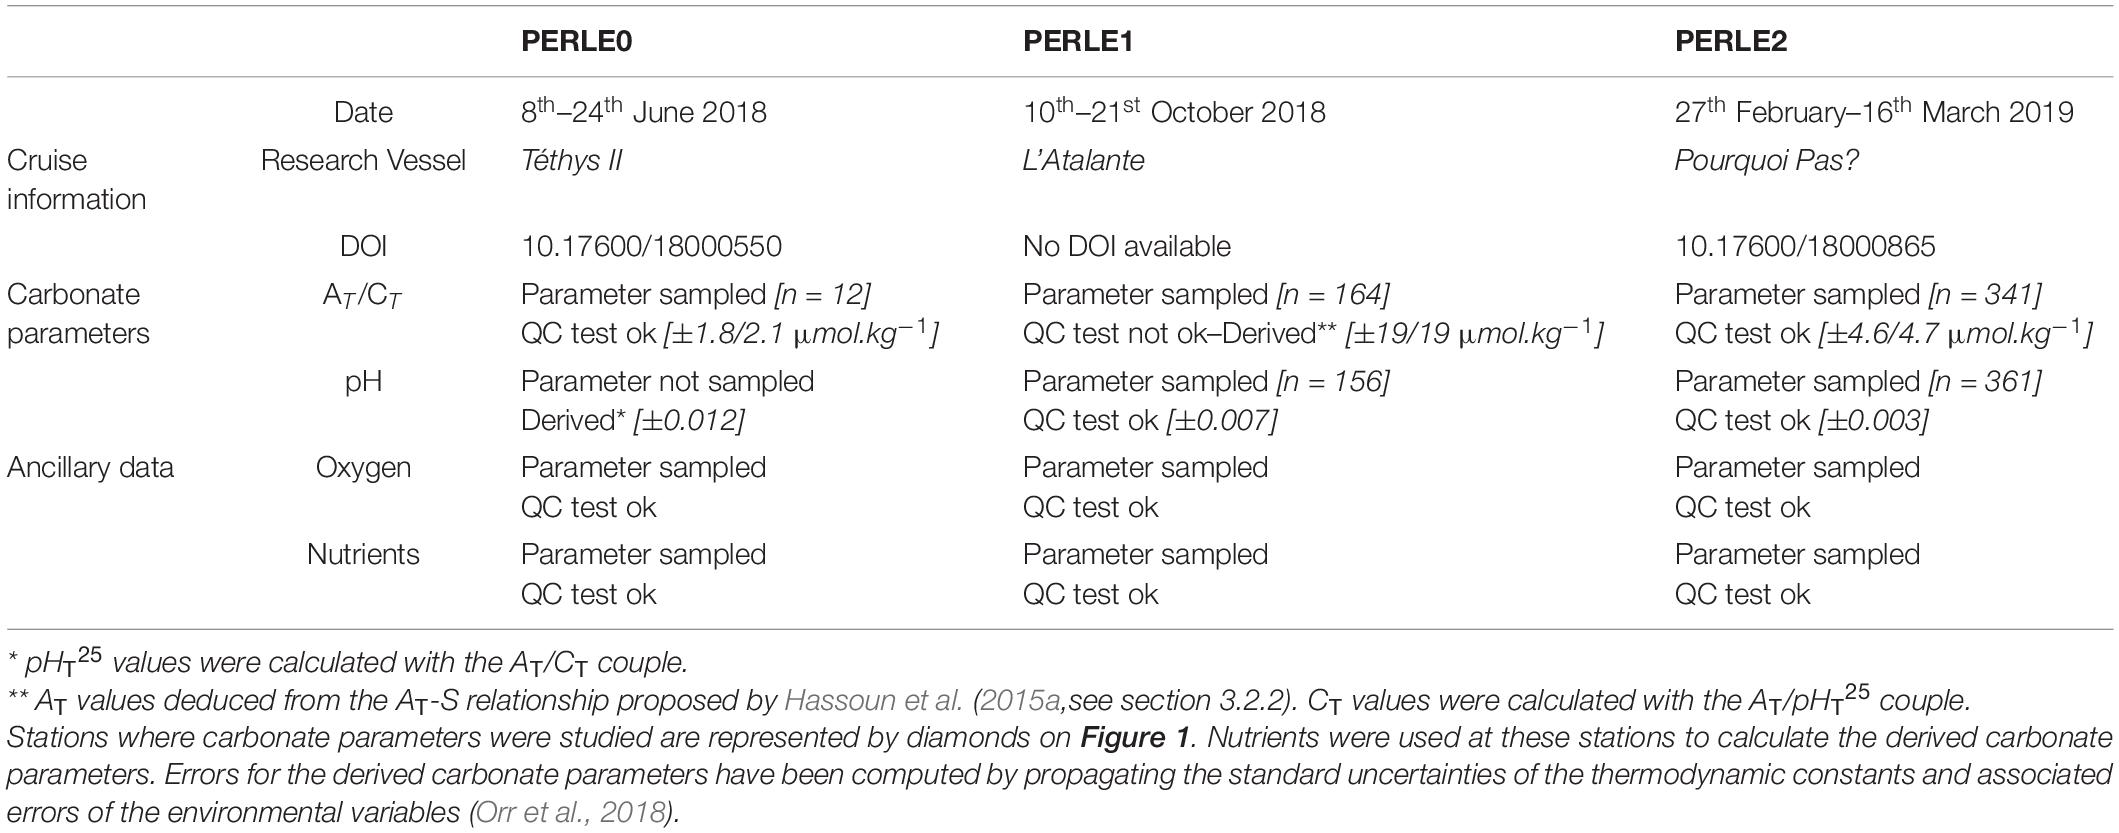
Table 1. Summary of the cruise information and the parameters measured during each PERLE cruises including availability, number of samples (n) and their associated accuracy.
Parameters Measured
CTD and Seawater Sampling
A SeaBirdTM 911+ underwater unit was used to interface a pressure sensor, an external temperature probe (SBE3plus) and an external conductivity cell (SBE4C). Sensors were calibrated by the manufacturer. Additional sensors were interfaced and data from a fluorescence (Chelsea Aqua 3) and an oxygen (SBE43) sensor are used in this study. Fluorescence and oxygen are expressed in A.U. (Arbitrary Unit) and μmol.kg–1, respectively, in this study. For vertical profiles, 24 Hz data on the downcast were averaged on 1 dbar bins by the SeaBirdTM dedicated software. Water samples were collected from CTD-Rosette casts with a carousel equipped with 22 Niskin bottles (12 L). Water was sampled from 10 to 21 depths, from a few meters above the seafloor up to the surface (0–5 dbars). From 0 to 200 dbars, a higher sampling resolution was applied (every ca. 20 dbars) than below 200 dbars (every ca. 200 dbars).
In addition, the “Real-time” CTD data from the WMO 6902913 Argo float (Argo, 2000) deployed during the PERLE1 cruise were used in this study to complete the hydrological data. Data collected from October 2018 to July 2020 were used (Figure 1). Because the Argo float considered in this study is still operational, no “Delayed Mode” data were available at this stage. The Argo real-time quality control procedures have been applied by the Coriolis data centre (Wong et al., 2020). A visual comparison of the Argo CTD data with collocated PERLE cruise CTD data was carried out on two profiles to exclude major deviations in the Argo data. Salinity measurements (derived from conductivity—SBE41CP sensor, SeabirdTM) were recorded with an accuracy of 0.005 psu.
Total Alkalinity and Total Dissolved Inorganic Carbon
Samples for total dissolved inorganic carbon (CT) and total alkalinity (AT) were collected into acid-washed 500 cm3 borosilicate glass bottles, poisoned with 200 mm3 of a 36 g.dm–3 HgCl2, as recommended by Dickson et al. (2007) and stored in the dark at 4°C. Analyses were performed after 5 months of storage. Measurements of CT and AT were performed simultaneously by potentiometric acid titration using a closed cell following the methods described by Edmond (1970) and Dickson and Goyet (1994). Analyses were performed at the National Facility for Analysis of Carbonate System Parameters (SNAPO-CO2, LOCEAN, Sorbonne University—CNRS, France) with a prototype developed at LOCEAN. The average accuracy of AT and CT analysis (estimated from repeated measurements of Certified Reference Material provided by Prof. Dickson’s laboratory from the Scripps Institution of Oceanography, San Diego) was 1.8 and 2.1 μmol.kg–1, respectively, for PERLE0 and 4.6 and 4.7 μmol.kg–1, respectively, for PERLE2. Although AT and CT measurements were carried out during the PERLE1 cruise, the accuracy of the dataset did not conform to the quality control procedure (see section “Primary Quality Control of the Measured Data”) therefore the measured PERLE1 AT/CT dataset was not used in this study. However, AT values were reconstructed for PERLE1 based on a published AT-S relationship (see section “Derived Parameters”).
pH
The pH was measured directly on board. Samples for pH measurements were collected in cylindrical optical glass vials and analyses were performed manually using purified m-Cresol Purple (mCP) following the spectrophotometric protocol (at 25°C) described by Clayton and Byrne (1993) (see details in Supplementary Material). This method is based on the dissociation of the pH-sensitive mCP dye (provided by Prof. Byrne, University of Southern Florida) in the water sample. pH is reported on the total scale at 25°C (pHT25) using the equation by Liu et al. (2011). The reproducibility of measurements was estimated to be ± 0.0009 by measuring replicates from the same Niskin bottle. The accuracy was determined to range within ± 0.007 for PERLE1 and ± 0.003 for PERLE2 by analysing replicates of TRIS solution (provided by Prof. Dickson, Scripps Institution of Oceanography, San Diego). No direct pH measurements were carried out during the PERLE0 cruise. The effect of the addition of the indicator on the seawater pH was evaluated and corrected (see details in the Supplementary Material).
Oxygen
For all three PERLE cruises, dissolved oxygen concentrations ([O2]mes) were analysed on board following the Winkler method (Winkler, 1888; modified Carritt and Carpenter, 1966) using photometric endpoint detection (Williams and Jenkinson, 1982). The recommendations of Langdon (2010) were followed for sampling, reagent preparation and sample analysis. The thiosulfate solution was calibrated by titrating it against a potassium iodate certified standard solution of 0.0100 N (CSK standard solution—WAKO). The reproducibility of measurements, calculated by measuring replicates from the same Niskin bottle, was estimated to be ± 0.86 μmol.kg–1 (n = 42, PERLE2).
Oxygen measurements from the SBE43 sensor from the CTD rosette were systematically adjusted for all cruises with the “Winkler” values on the whole water column. Based on the raw data processing algorithm (Owens and Millard, 1985), 3 calibration coefficients were adjusted (the oxygen signal slope, the voltage at zero oxygen signal and the pressure correction factor) by minimising the sum of the square of the difference between the Winkler oxygen values and oxygen derived from the sensor signal. The accuracy of the SBE43 adjusted values is around ± 2 μmol.kg–1.
Nutrients
Samples for dissolved inorganic nutrients were collected from Niskin bottles in 20 mL polyethylene bottles. Samples were analysed directly on board during PERLE2 and frozen before analysis on land for PERLE0 and PERLE1. Analyses were performed after less than a month of storage. All nutrient samples were analysed by a standard colorimetric method on a segmented flow analyser (Autoanalyser II Seal Bran& Luebbe®) following Aminot and Kerouel (2007). The relative precision of these analyses ranged from 5 to 10% (Aminot and Kerouel, 2007).
Primary Quality Control of the Measured Data
Systematic primary quality control of the measured data was performed on each PERLE dataset. No significant problems have been detected for Winkler oxygen and pH measurements. During PERLE1, for a few casts, a CTD pump dysfunction significantly altered the quality of the CTD oxygen: oxygen measurements from these casts were disregarded. A systematic quality control procedure for AT and CT was conducted based on internal consistency tests between AT, CT and pHT (see details in the Supplementary Material). Following these steps, only 15 PERLE2 casts were validated, leading to the loss of ca. 60% of the PERLE2 AT/CT dataset. All the AT/CT PERLE1 dataset was lost. A comparison of the quality controlled PERLE dataset with previously collected data does not reveal systematic biases for AT, CT, or pHT25 (Figure 2A–C).
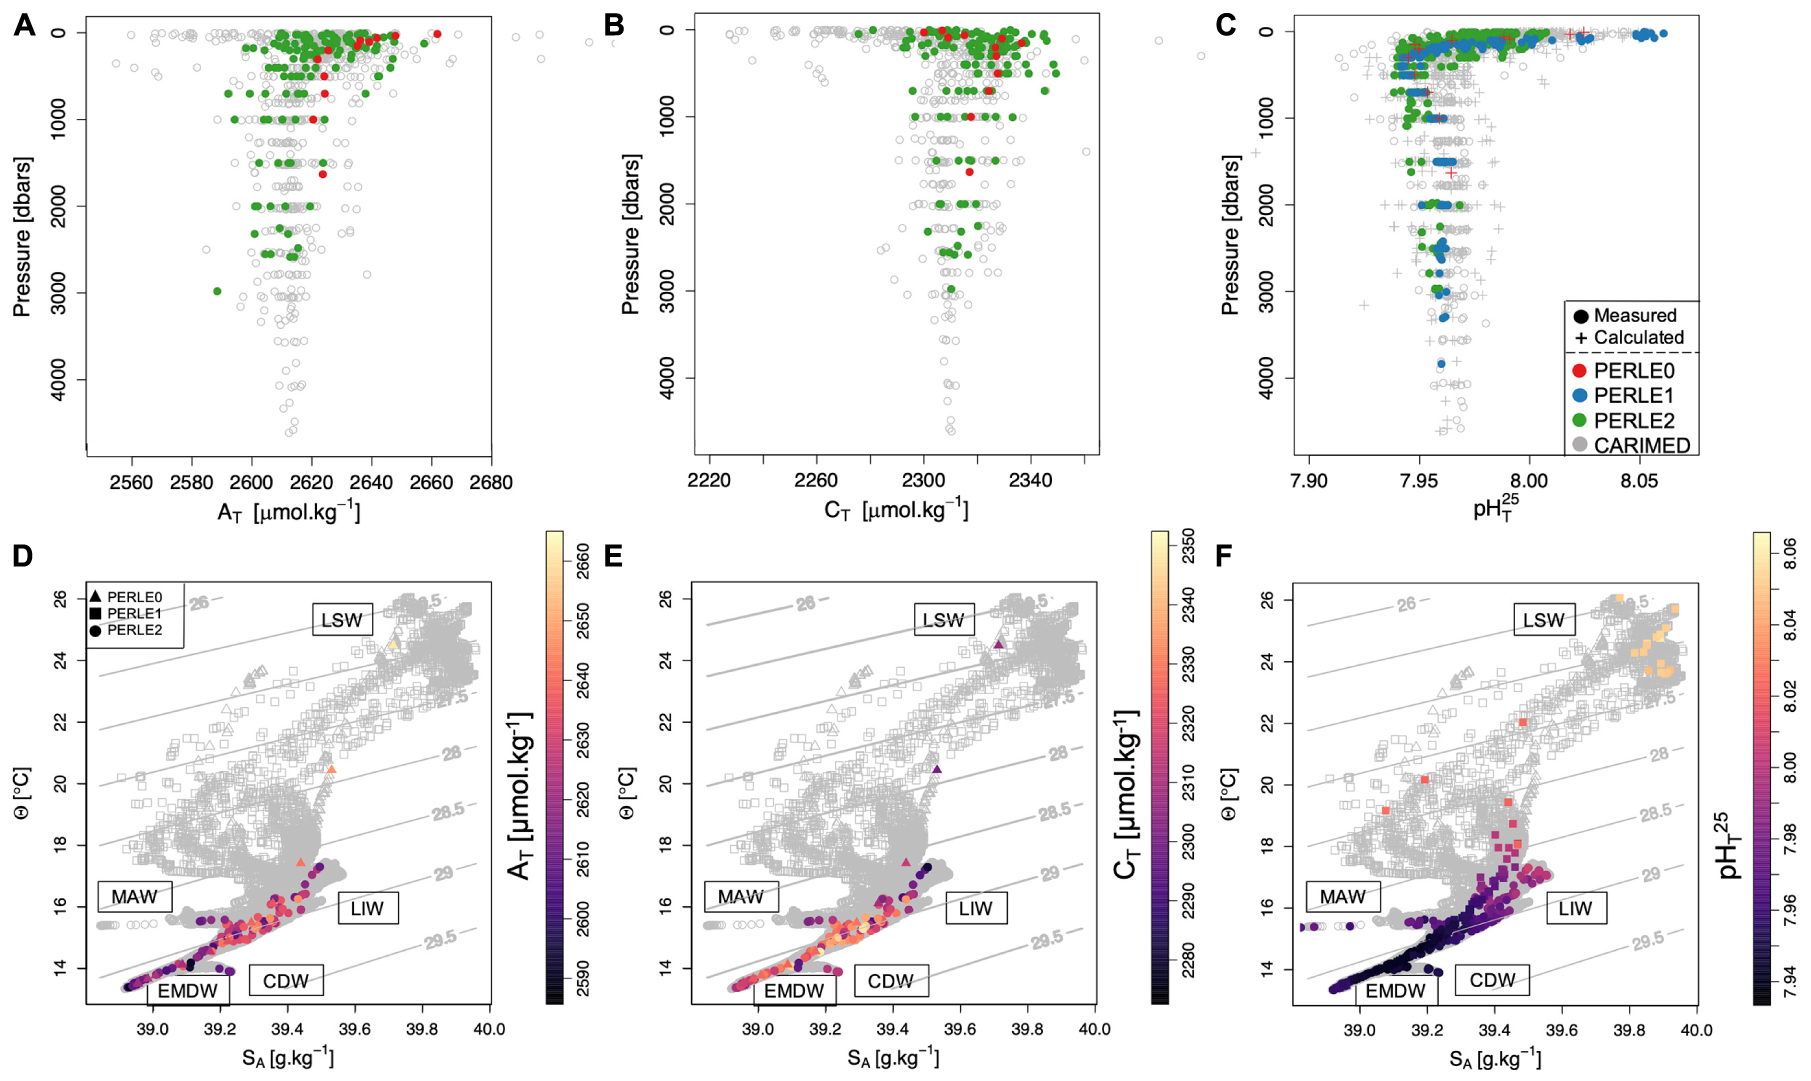
Figure 2. Upper panel: Vertical profiles of total alkalinity (AT–μmol.kg–1; A), total dissolved inorganic carbon (Cθ–μmol.kg–1; B) and pH (measured and calculated) in total scale at 25°C (pHT25; C) for the three PERLE cruises superimposed on the CARIMED data corresponding to the PERLE area (22°–29°E, 33°–36.5°N; grey dots). Lower panel: Θ–SA diagrams for the three PERLE cruises with the name of the main water mass end members for the entire water column. Colored points correspond to AT on (D), to CT on (E) and to pHT25on (F). Isopycnal horizons based on potential density referenced to a pressure of 0 dbar (σθ) are represented by grey contour lines. On (D–F), different dots have been used for each PERLE cruise. Because no AT and CT data were available for PERLE1 cruise, only pHT25 data have been represented (C,F).
Statistical Tests on the Linear Model
Relationships between years and carbonate parameters (AT, CT, and pHT25) and between AT and salinity were computed using a linear regression model. Linear regression statistics, including the standard error of the slope (i.e., the error of the estimated trend), the coefficient of determination (r2) and the significance of the trend (p-value) were calculated using the R software. Linear relationships have been tested using the Pearson coefficient for parametric test (Sokal and Rohlf, 1969) with a significance level of 95%.
Parameters derived from the AT-S linear relationship were tested against previously published AT-S relationships in the area using a Student’s t-test for the slope and intercept. The null hypothesis, H0, was that our observations were not significantly different from these linear models.
Derived Parameters
Absolute salinity (SA), conservative temperature (Θ) and potential density (σθ) were derived from practical salinity, temperature and pressure and the geographic position based on the TEOS-10 (The International Thermodynamic Equation of Seawater-2010). In this study, following the recommendations of the Intergovernmental Oceanographic Commission (Valladares et al., 2011), SA and Θ were used to study the hydrological context (Θ−SA diagrams). Calculations were made with the “oce” R package (Kelley et al., 2017). Note that practical salinity (labelled Salinity) and in situ temperature (labelled Temperature) were used in this study to facilitate comparisons with previous studies in particular, for AT-S relationships.
Apparent Oxygen Utilisation (AOU–μmol.kg–1) was calculated from the difference between oxygen solubility concentration (at P = 0 dbar) estimated with the “Benson and Krause coefficients” (Garcia and Gordon, 1992) and in situ [O2]mes.
A density threshold of 0.03 kg.m–3 with a reference depth of 10 dbars was used to compute the Mixed Layer Depth (MLD) (D’Ortenzio et al., 2005).
Salinity data were used to reconstruct an AT time-series using the sub-surface AT-S relationship proposed by Hassoun et al. (2015a) (see discussion in section “Total Alkalinity and Salinity Relationships Within the Mixed Layer”). In this study, the PERLE1 and the Argo float AT datasets were reconstructed following this AT-S relationship. Considering the standard deviation of the AT-S relationship proposed by Hassoun et al. (2015a), the accuracy of the calculated AT values is ± 19 μmol.kg–1.
Salinity-normalised changes in AT (NAT39.3) and CT (NCT39.3) were calculated dividing by in situ salinity and multiplying by 39.3 (i.e., the mean PERLE salinity above 200 dbars).
Seawater carbonate system parameters were derived from AT and CT values. Calculations were made with the software program CO2SYS-MATLAB (van Heuven et al., 2011) using silicate and phosphate concentrations. When nutrient data was not available, silicate and phosphate mean concentrations for each depth were used. As recommended for the MedSea by Álvarez et al. (2014), the carbonic acid dissociation constants K1 and K2 from Mehrbach et al. (1973) as refitted by Dickson and Millero (1987) and the dissociation constant for HSO4– from Dickson (1990) were used. Uppström (1974) was used to calculate the ratio of total boron to salinity and Dickson and Riley (1979) to calculate the hydrogen fluoride constant KF.
The buffer factors γAT (γCT), βAT (βCT) and ωAT (ωCT) provide an estimation of the seawater’s ability to buffer changes in the aqueous CO2 [CO2], protons [H+] and the carbonate saturation state (Ω) when AT (CT) changes at constant CT (AT) (Egleston et al., 2010). The calculations were performed following the formula proposed by Álvarez et al. (2014).
Quantification of Biological Processes
Net Ecosystem Production (NEP) is defined as the sum of biotic and abiotic carbon fluxes in the ecosystem (Borges et al., 2008). Net Ecosystem Calcification (NEC) is a measure of the balance between CaCO3 formation (calcification) and dissolution (Smith and Kinsey, 1978). Based on the NAT39.3 and NCT39.3 plot, the reaction path can take on variable slopes depending on the ratio of different processes, such as photosynthesis/respiration, carbonate dissolution/formation and CO2 release/invasion (Zeebe, 2012). Temporal changes in NAT39.3 (ΔNAT39.3) and NCT39.3 (ΔNCT39.3) between each PERLE cruise can be calculated according to NEP and NEC processes as:
Following equation (2), NEP can be expressed according to NEC as:
Then, by replacing the NEP term in equation (1) by equation (3), NEC can be calculated as:
NEC and NEP are expressed in μmolC.kg–1.d–1. Salinity-normalised AT and CT values “exclude” the “precipitation-evaporation” influence in the layer where biological activity is at a maximum. It is assumed that the layers considered (MLD-200 dbars) to estimate the NEP and NEC processes are not influenced by air-sea CO2 fluxes, which were therefore not considered.
CARIMED Database
CARIMED (CARbon, tracer and ancillary data In the MEDsea) aims to be an internally consistent database containing inorganic carbon data relevant for this basin (Álvarez et al., in preparation). Ancillary (hydrographic, inorganic nutrients and dissolved oxygen), CO2 (pH, AT, and CT) and transient tracer (CFC-11 and 12, Tritium, SF6, Neon, CCl4, and ΔHe3) data from several cruises in the MedSea from 1976 until 2018 were assembled. Primary and secondary quality control procedures following the GLODAP (Global Ocean Data Analysis Project) philosophy (Tanhua et al., 2010) are locally adapted to this marginal sea. This work only uses data collected in the Levantine basin (Supplementary Table 2).
Descriptive Carbonate Chemistry in the Context of the Perle Cruises
Carbonate Chemistry Along the Water Column Below the Surface Layer
All vertical profiles for AT, CT and pHT25 measured during the PERLE cruises are presented in Figures 2A–C, respectively. All the AT profiles presented maximum values in the surface, minimum values between 500 and 700 dbars and remained almost constant (or slightly decreasing) below 1000 dbars. Most of the CT vertical profiles presented the lowest values in surface waters, reaching maximum values between 500 and 700 dbars and then remaining relatively invariable below 1000 dbars. pHT25 presented maximum values at the surface (with values around 8.060 measured during PERLE1 cruise), minimum values close to 700 dbars and nearly constant values under 1000 dbars (Figure 2C). The main water masses are identified in Figures 2D–F and detailed in Supplementary Figure 1.
Intermediate waters (mostly LIW) were located around the 29.0 kg.m–3 isopycnal layer (Lascaratos and Nittis, 1998; see Supplementary Figure 1) and were characterised by an AT maximum evolving from 2,600 to 2,640 μmol.kg–1 (Figures 2A,D). As observed by Álvarez et al. (2014), the LIW was located above the layer of maximum organic matter mineralisation in the EMed and was associated with low CT concentrations (ca. 2,290 μmol.kg–1) and high pHT25 values (ca. 8.000) in contrast to the deepest water masses. It can be observed that slightly colder, more haline and denser Cretan Intermediate Waters (Velaoras et al., 2019) were detected during PERLE2 in the western part of the Cretan Sea with the highest AT value for PERLE2 cruise (ca. 2,660 μmol.kg–1, Figure 2A).
In the deep-water layer (i.e., EMDW), both AeDW and AdDW presented similar CT values (Figure 2E) while slightly higher pHT25 (Figure 2F) and AT (Figure 2D) values were measured in the AeDW (see Supplementary Figure 2). On the Cretan shelf, deep waters were comprised of dense EMDW with high AT (≈ 2,650 μmol.kg–1) and CT values (≈ 2,350 μmol.kg–1). Deep waters of the Cretan Sea were filled with CDW with low pHT25 (≈ 7.950) values resulting from relatively low AT and high CT content (Figures 2D–F).
This description of the carbonate chemistry in the deep and intermediate water masses in the PERLE area is in good agreement with previous studies (Schneider et al., 2010; Álvarez et al., 2014). However, the PERLE strategy based on an intense observation period over a year is not appropriate to describe changes in deep-water masses. For the rest of this study, in order to tackle the seasonal dynamics of the surface waters, only data in the NWLB (Figure 1) where all three PERLE cruises were conducted, will be discussed further.
Seasonal Variability in the Upper Water Column
The highest spatial and temporal variability in carbonate chemistry parameters was encountered in the upper water layer which has been defined to be approximately the first 200 dbars. Discrete pHT25 values (measured and calculated), taken from the southern part of the PERLE sampling area (the NWLB) illustrate the seasonal variability of the carbonate chemistry in the upper layer (Figure 3A). The pHT25 was the most measured carbonate parameter in this study and, when normalised to 25°C, can be considered as an indicator of the carbonate chemistry status by including the changes in AT and CT. An overview of the upper layer seasonal dynamics is also presented for temperature, salinity, fluorescence, and AOU profiles in Figures 3B–E, respectively.
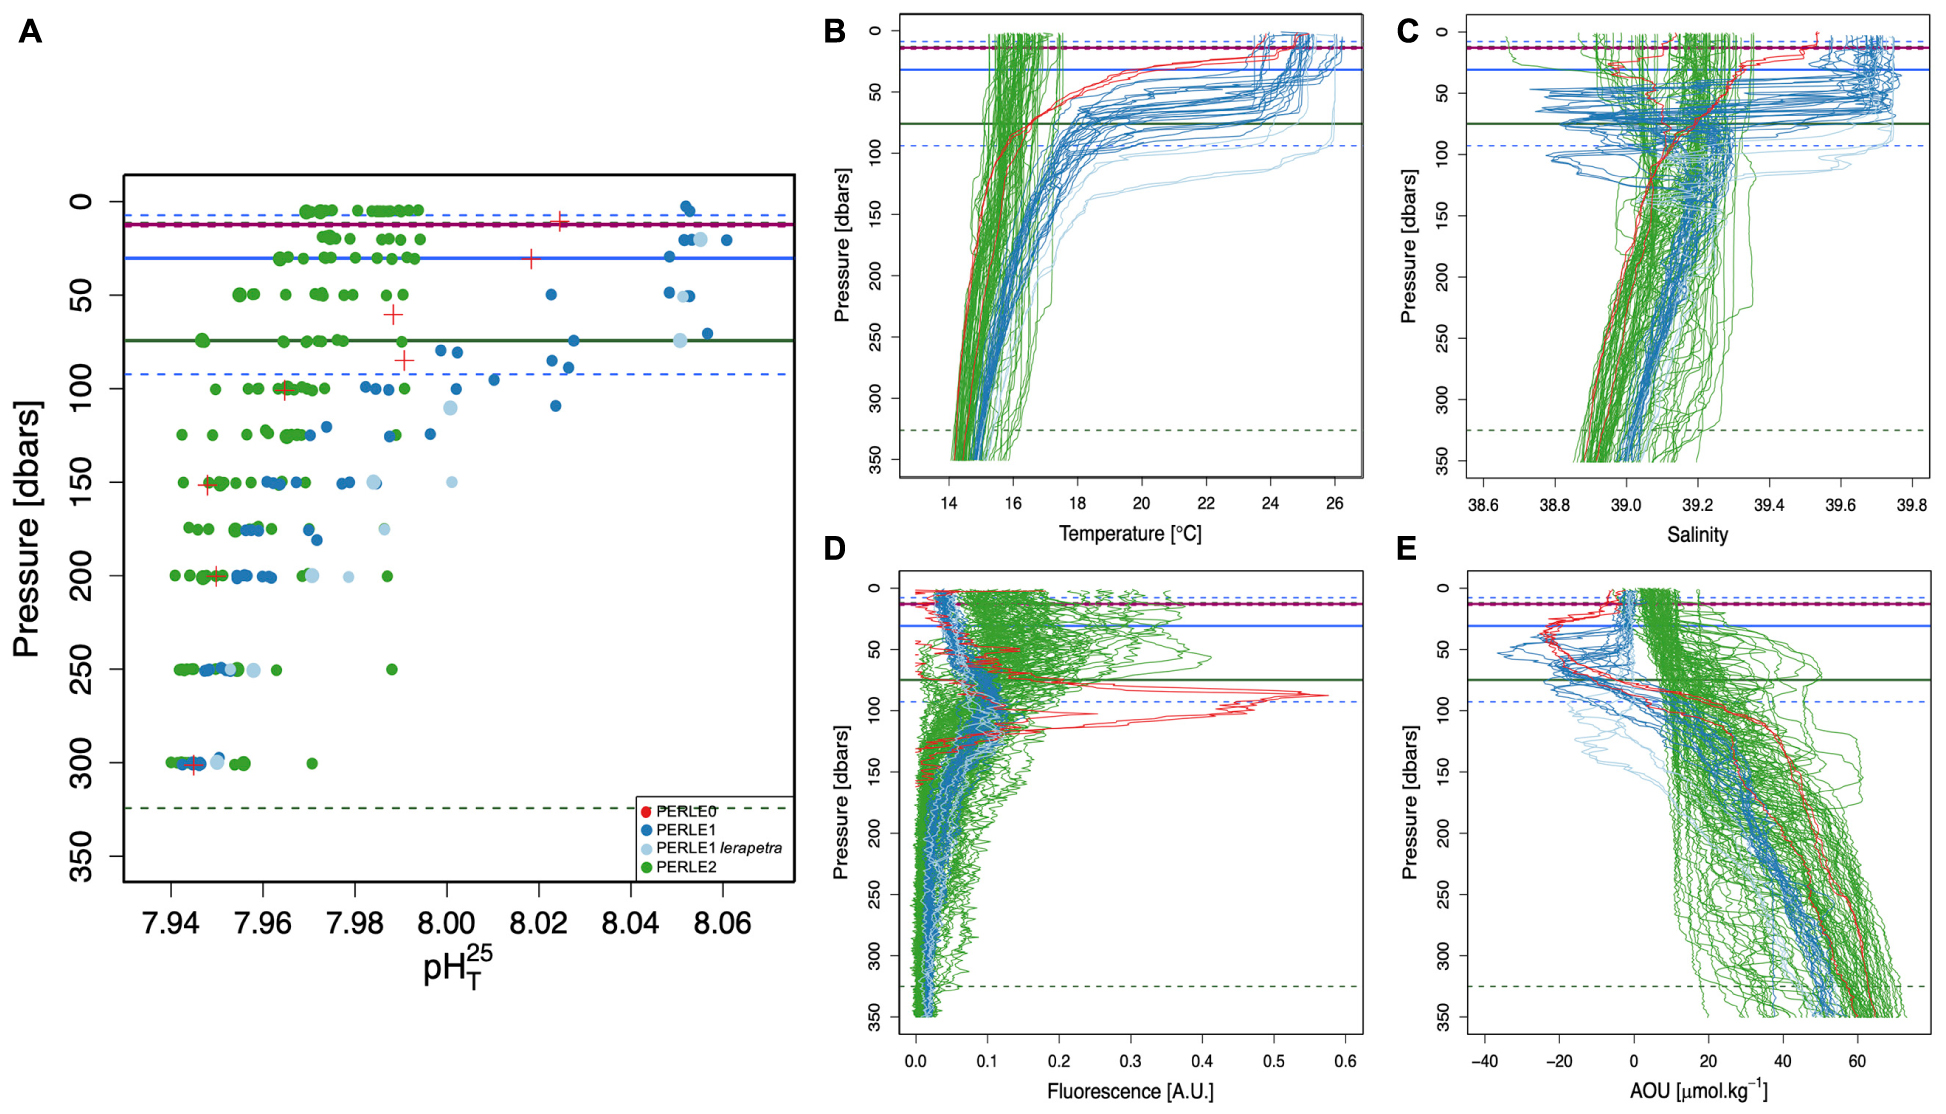
Figure 3. Vertical profiles of pH in total scale at 25°C (pHT25, A), temperature (°C, B), salinity (C), fluorescence (A.U., D) and AOU concentrations (O2sol—O2mes; μmol.kg–1, E) above 350 dbars for all stations in the North Western Levantine Basin during the three PERLE cruises. Horizontal full lines represent the mean Mixed Layer Depth (MLD; dbars). Dotted lines represent the minimum and maximum MLD values, respectively. For PERLE1, a distinction is made between inside (light blue lines) and outside (dark blue lines) the Ierapetra gyre.
The lowest pHT25 values were encountered in March 2019 during the PERLE2 cruise and correspond to the relatively higher CT values and lower AT values. During this cruise, a significant range in the MLD was encountered with the deepest values observed. This cruise coincided with the abrupt stratification observed in the EMed after the deepening of the MLD from November to February-March (D’Ortenzio et al., 2005). Increased fluorescence values were observed in shallow waters at the end of the cruise (in the eastern part of the area) in comparison to the beginning of the cruise (in the western part).
Intermediate pHT25 values were measured in June 2018 during the PERLE0 cruise corresponding to increased surface alkalinity and a moderate depletion in inorganic carbon. The PERLE0 cruise is an early summer cruise characterised by a shallow MLD. The highest fluorescence values were recorded during this cruise well below the MLD (ca. 90 dbars) and light oxygen supersaturation (AOU ≈ −20 μmol.kg–1) just beneath the MLD.
Finally, high pHT25 values (>8.000) were measured up to 100 dbars during the PERLE1 cruise, probably in association with a high AT content due to evaporation. During this late summer cruise, the deepest Deep Chlorophyll Maximum (DCM) with the lowest fluorescence values but also the deepest negative AOU concentrations were encountered. Moreover, during this cruise, the mesoscale Ierapetra Eddy (IE) was crossed (see Supplementary Figure 3 and Ioannou et al., 2019). The core of this warm and salty eddy (Figures 3B,C) was characterised by a deepening of the MLD associated with a deep DCM and negative AOU values. Nonetheless, no clear IE signal was observed on the pHT25 values (Figure 3A).
In the EMed, spring and autumn seasons need to be considered as short transition periods between the summer and winter, which come later than on the continent (Özsoy et al., 1989). Moreover, in the EMed, summer is characterised by maximum heat in the surface layer that can remain up until November, whereas winter is identified with minimal heat that can occur until April. Considering each cruise as representative of a period within the annual cycle, the PERLE0 cruise (June 2018) associated with intermediate pHT25 values corresponds to the early summer period with decreasing biological activity associated with the strengthening of stratification. PERLE1 (October 2018) is associated with the highest pHT25 values and corresponds to the end of the summer period characterised by a warm and stratified water column with deep and low fluorescence maximum. PERLE2 (March 2019), associated with the lowest pHT25 values and shallow fluorescence maximum, corresponds to the end of the winter period, with the beginning of the seasonal stratification of the water column in the eastern part. These features agree with the analysis of the seasonal patterns of surface chlorophyll a concentration (Chl a) (based on remote sensing). The lowest values of surface Chl a were observed during the summer period, whereas an increase in surface Chl a was observed in winter, concomitantly to the deepening of MLD (Bosc et al., 2004; D’Ortenzio and Ribera d’Alcalà, 2009).
Total Alkalinity and Salinity Relationships Within the Mixed Layer
When no AT values were available (see section “Primary Quality Control of the Measured Data”), AT can be estimated based on an AT-S relationship. In the MedSea, several linear relationships between AT and salinity in the surface waters have been proposed for different sub-basins (e.g., Schneider et al., 2007; Cossarini et al., 2015; Hassoun et al., 2015a; Gonzaìlez-Daìvila et al., 2016).
During the PERLE cruises, in the NWLB, AT was significantly (n = 14, p-value = 0.014, r2 = 0.36) influenced by salinity variations within the mixed layer (Figure 4). Figure 4 also displays the AT-S distribution in the Cretan Sea (grey dots on Figure 4). The mixing of high alkalinity Black Sea waters (values of ca. 2,967 μmol.kg–1; Hiscock and Millero, 2006) in the Cretan Sea shifts the AT-S characteristics of surface waters in agreement with Schneider et al. (2007) who demonstrated that freshwater and Black Sea inputs affect the AT-S relationship. More pronounced deviations from the expected linear AT-S relationship are observed for stations with deeper mixed layers (Figure 4). This might be the result of the mixing of water masses with different AT-S relationships during winter mixing. As AT values were available only for PERLE0 and PERLE2 cruises, the AT-S relationship derived for the PERLE cruises in the mixed layer (and in the NWLB) have been based on a very limited number of data. The PERLE AT-S linear relationship was tested against the Hassoun AT-S linear model (Hassoun et al., 2015a). No significant differences were found on either the slope (t-test = 1.86, n = 14, p < 0.05) or the intercept (t-test = 0.27, n = 14, p < 0.05). Therefore, the annual time-series were reconstructed based on the AT-S linear relationship measured by Hassoun et al. (2015a) in the surface waters (0–25 m) of the eastern Mediterranean sub-basin, and AT has been estimated based on this relationship.
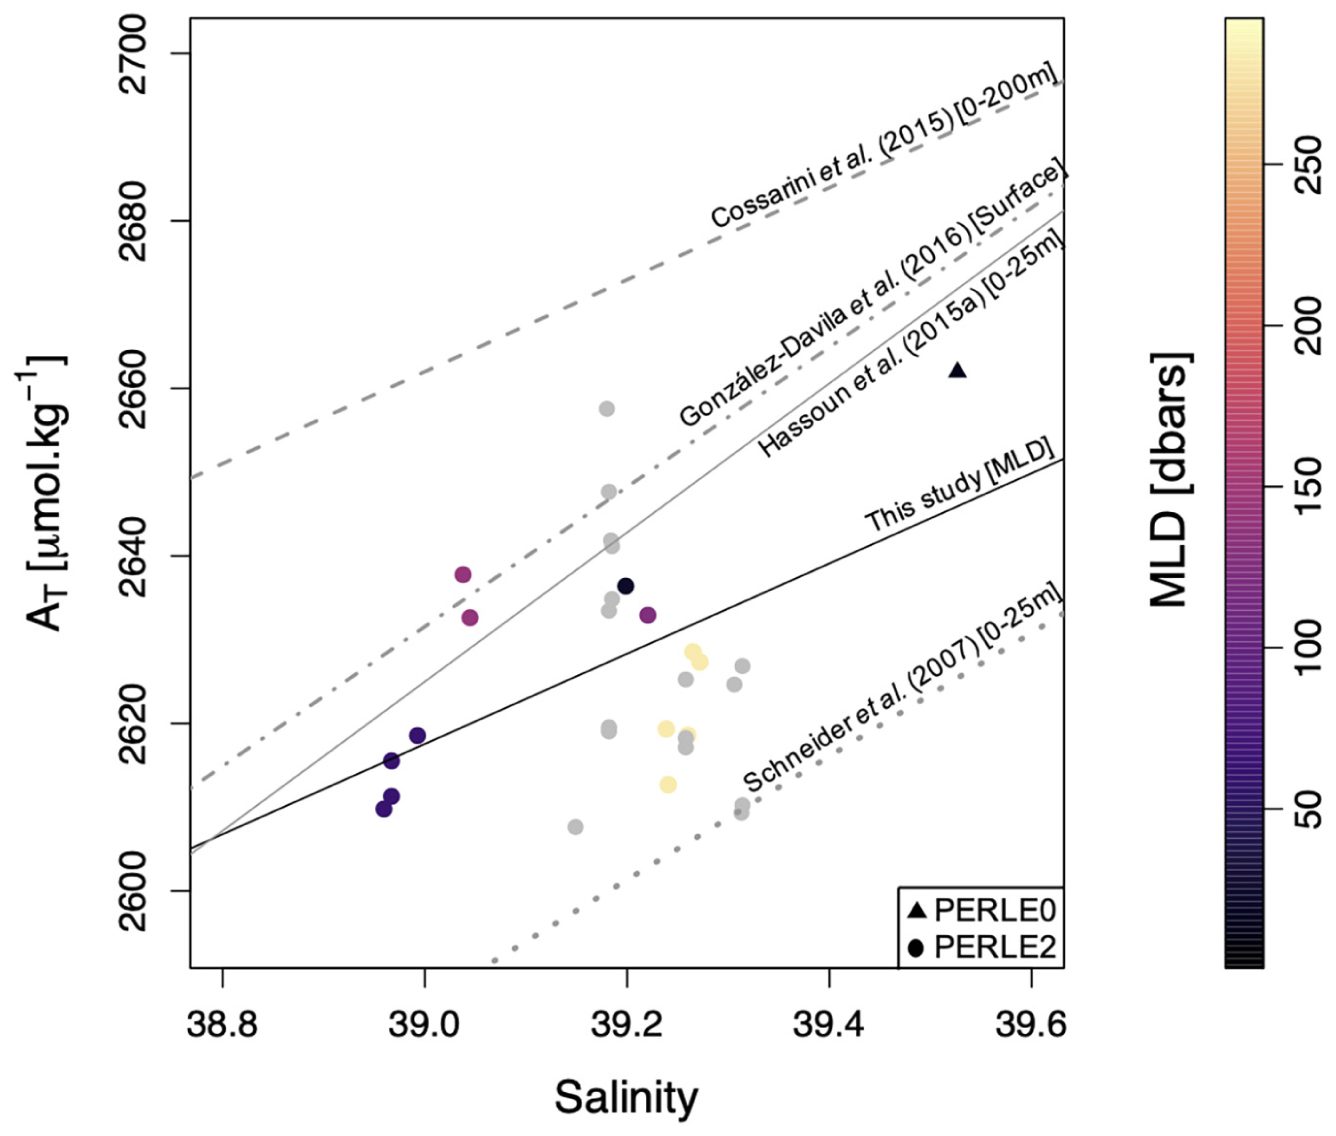
Figure 4. AT vs. Salinity during PERLE0 and PERLE2 cruises within the mixed layer for all stations situated in the North Western Levantine Basin. The colour scale corresponds to the mixed layer depth (MLD–dbars). The black line corresponds to the significant linear regression (in the NWLB). The different grey lines correspond to the linear regressions between AT and salinity in the surface EMed reported by Schneider et al. (2007), Cossarini et al. (2015), Hassoun et al. (2015a), and Gonzaìlez-Daìvila et al. (2016). The grey dots correspond to data in the Cretan Sea (not used in the linear regression).
Atypical Drivers of the Seasonal Dynamics of the Carbonate Chemistry Within the Mixed Layer of the North Western Levantine Basin
Seasonal Variations in Total Alkalinity and Total Inorganic Carbon
During the PERLE cruises, the NWLB exhibited a greater range in AT than CT values within the mixed layer (see section “Total alkalinity control on the seasonal air-sea CO2 exchanges”). AT ranged between 2,610 and 2,693 μmol.kg–1 whereas CT ranged between 2,292 and 2,332 μmol.kg–1. Over an annual scale, the ratio of the range in AT variations to the range in CT variations (ΔAT/ΔCT) can be used to infer the sensitivity to AT and CT changes in the upper ocean. Over the period studied, in the NWLB, the ratio ΔAT/ΔCT is equal to 2.1. In the global ocean, long-term time-series ΔAT/ΔCT ratios are lower than 1.0 (Table 2).
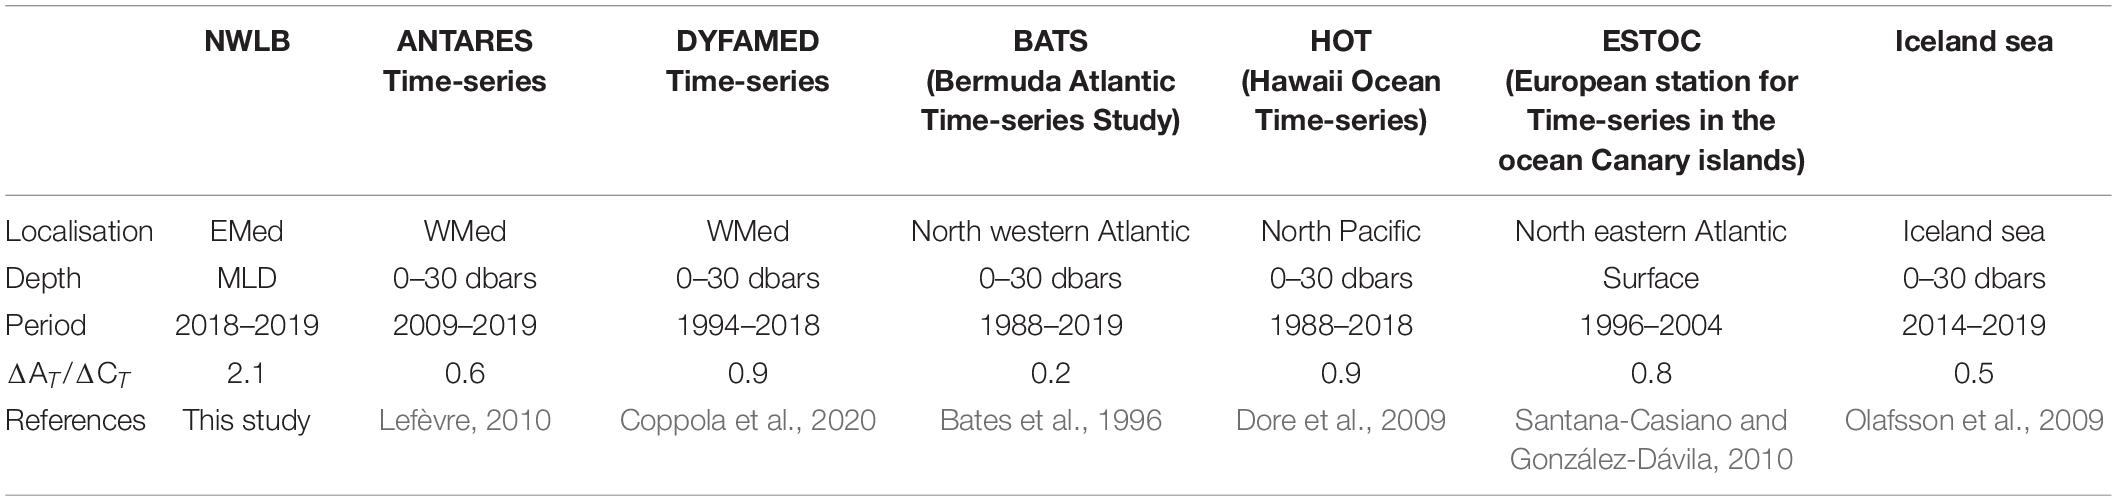
Table 2. Ratios (ΔAT/ΔCT) of the range in AT variations (maximum value minus minimum value) to the range in CT variations (maximum value minus minimum value) in the upper ocean for the different time-series.
The reasons for these apparent and rather unique ranges of AT and CT over the year in the NWLB can be attributed to several factors: (1) The main drivers of the CT gradient in the water column are, primary production transforming the CT into organic carbon in the photic layer, and respiration transforming the organic carbon into CT. As the EMed is an area of low productivity (Moutin and Raimbault, 2002), the vertical CT gradient is lower than in other oceanic areas. Consequently, the CT range in surface waters, driven by CT consumption during the stratified period and replenishment via vertical mixing with sub-surface waters enriched in CT, is greatly reduced. (2) The high levels of evaporation that affect the MAW in the EMed during the summer season increases salinity by nearly 1 g.kg–1 (Figure 2) between the end of winter (PERLE2) and the end of summer (PERLE1). The AT and CT parameters should be equally affected by evaporation in a closed system. However, when reported on a AT/CT diagram (with normalised axes—see Figure 5), a higher range of AT variation compared to CT is observed. This indicates that when salinity increases in surface waters, a concomitant consumption of CT must occur to compensate for the CT increase due to evaporation to maintain an apparent stability in CT concentrations. The biological consumption of CT will be discussed in the next section as a possible mechanism to explain this low CT variability.
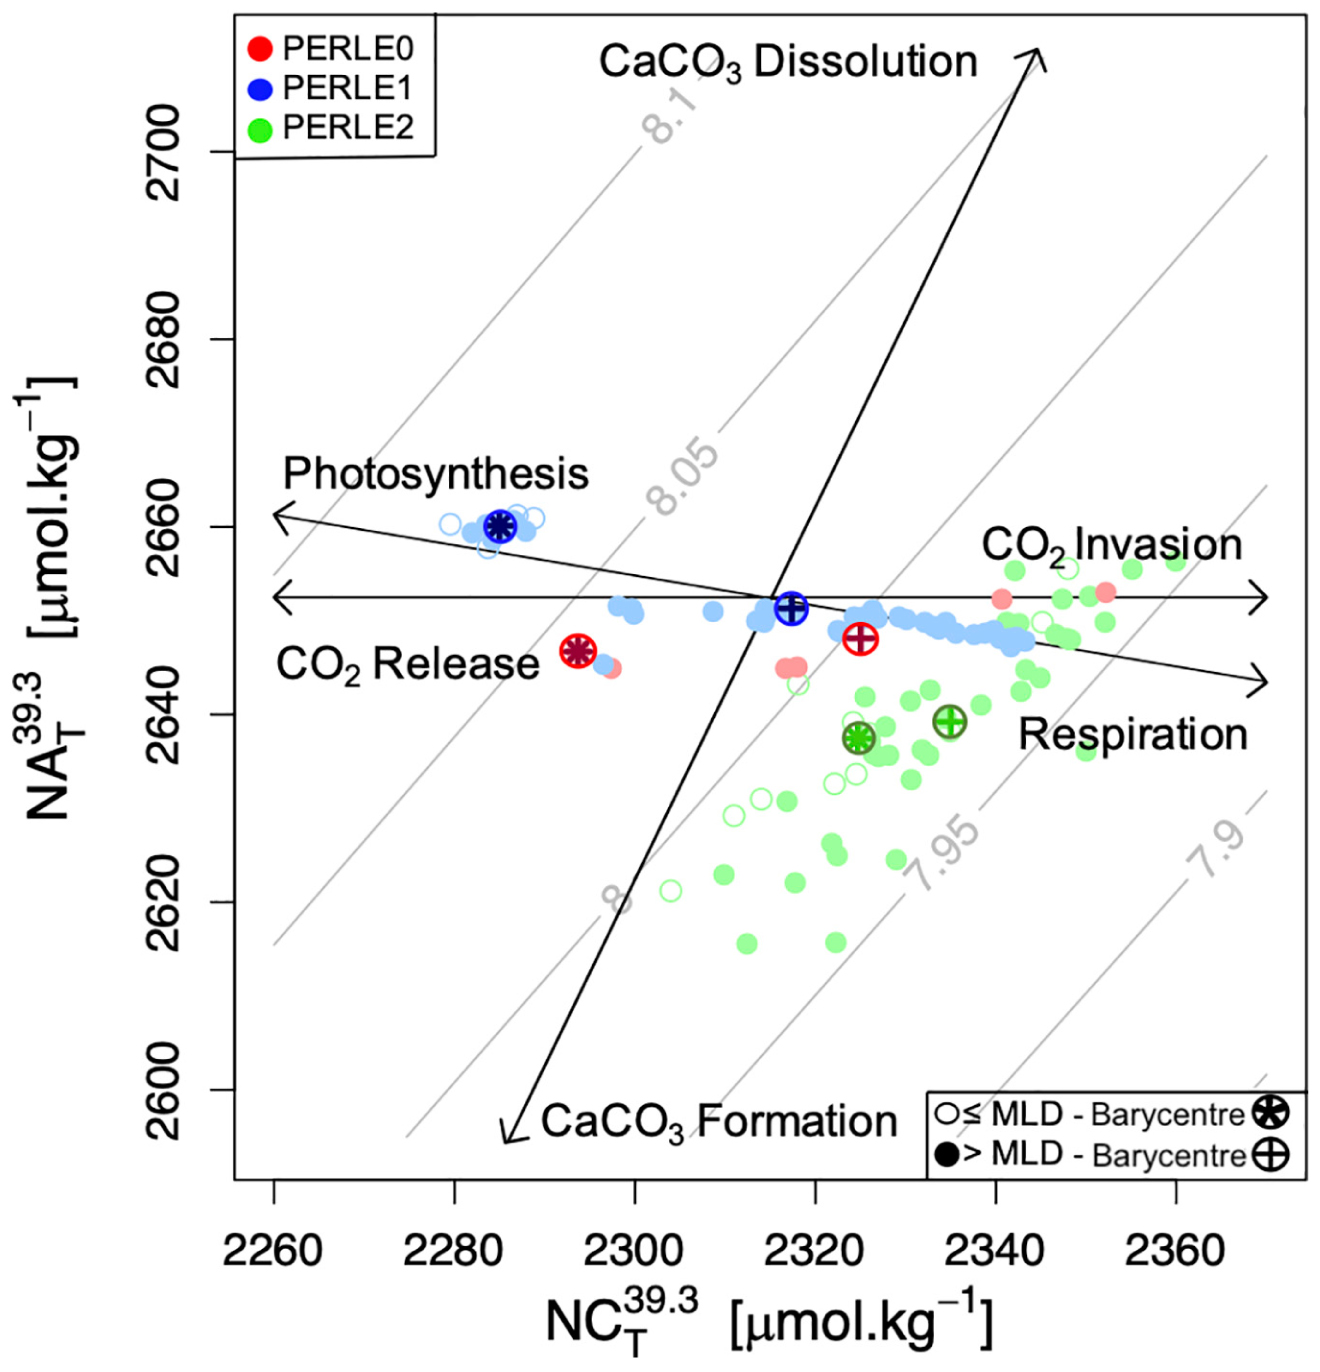
Figure 5. Salinity-normalised AT (NAT39.3) vs. salinity-normalised CT (NCT39.3) during the three PERLE cruise in the upper 200 dbars for all stations situated in the North Western Levantine Basin. The layer of 0-200 dbars has been chosen as having the highest AOU variability because of the biological signal. Salinity-normalised values have been calculated with the mean PERLE salinity above 200 dbars (i.e., 39.3). Empty and full dots represent data within and below the mixed layer, respectively. Circled crosses and circled stars represent the barycentre of data below and within the mixed layer, respectively. Black vectors reflect theoretical impacts of various processes (photosynthesis/respiration, carbonate dissolution/formation and CO2 release/invasion) on AT and CT. Grey isolines indicate levels of constant pHT25 as a function of AT and CT.
Impact of Biological Processes on Variations in Seasonal Carbonate Parameters
To understand the overall impact of biological processes on the seasonal variations in the carbonate system in the NWLB, changes in AT and CT need to be considered independently from the changes induced by dilution and evaporation. For this purpose, salinity-normalised changes of AT and CT in the upper 200 dbars are plotted in Figure 5. To differentiate waters affected by air-sea exchanges from sub-surface waters, the upper 200 dbars of water column has been divided into two layers: within and below the mixed layer (0 dbars—MLD and MLD—200 dbars). The barycentre of all observational points, defined as the coordinate of the mean AT and CT values during each cruise, is reported and considered to be representative of the “season” sampled.
The barycentres are spread along the photosynthesis-respiration line between the three cruises, reflecting the effects of biological processes on the carbonate system over the year. From the early summer period (PERLE0—red dots on Figure 5) to the end of the summer period (PERLE1—blue dots on Figure 5), for both layers, the barycentre shift was a signature for increased photosynthetic processes compared to respiration processes. The deepening of the DCM observed between the PERLE0 and PERLE1 cruises and the negative AOU values recorded during these cruises supported this observation. The deepening of the DCM is a signature to the downward displacement of primary producers related to surface nutrient depletion (Sigman and Hain, 2012), and negative AOU values reflect oxygen production. All these elements indicate that autotrophic processes dominate the upper water column between early and late summer. Based on these assumptions, between the end of the summer period (PERLE1) and the end of the winter period (PERLE2—green dots on Figure 5), the barycentre shift indicates that heterotrophic processes were dominant in the upper water column. Whilst observations cannot be time related, it can be assumed that between the late winter period of PERLE2 and the early summer period of PERLE0, the “theoretical” shift of the barycentre indicates a balance in favor of autotrophic processes during this period. When considered together, these seasonal changes in normalised AT and CT confirm that during periods of high evaporation, autotrophic processes are consuming CT and increasing AT. This can explain the apparent CT stability and the important change in AT over an annual cycle.
Based on the assumption that, below the mixed layer, the PERLE sampling area is a closed system (unimpacted by air-sea CO2 fluxes), the temporal evolution in NAT39.3 and NCT39.3 was used to calculate NEP and NEC fluxes. From the end of the bloom period (PERLE0) to the end of the summer period (PERLE1), daily NEP and NEC values of 0.53 and 0.01 μmolC.kg–1.d–1, respectively, were estimated whereas from the end of the summer period (PERLE1) to the start of the bloom period (PERLE2), negative daily NEP and NEC values of −1.02 and −0.04 μmolC.kg–1.d–1, respectively, were estimated. In the MedSea, the MLD seasonal variability is characterised by a deepening from November to February-March (D’Ortenzio et al., 2005). Therefore, it can be assumed that the water masses below the mixed layer remain isolated from surface CO2 inputs between the PERLE0 and PERLE1 cruises. However, due to the late winter deepening of the MLD (Figure 3), between the end of the summer period (PERLE1) and the late winter period (PERLE2), NEC and NEP could be biased by air-sea exchanges.
The seasonal NEP values estimated in this study confirm previous estimations based on oxygen concentration changes monitored with short-time incubations during the stratified period. In June 2006, Regaudie-de-Gioux et al. (2009) reported a positive NEP value of 0.22 ± 1.30 mmol O2.m–3d–1 in waters above 100 meters in the EMed and in summer 2008, Christaki et al. (2011) reported positive NEP values of 4 ± 14 mmol O2.m–2d–1. As previously observed by Schneider et al. (2007), the contribution of calcification and dissolution processes to variations in the carbonate system could be assumed to have a minor role in the MedSea. The NEC values calculated in the NWLB confirm this. The spreading of PERLE2 data points along the CaCO3 formation/dissolution line in Figure 5 (green dots) might be associated to the spatial changes in alkalinity content across the geographical distribution of sampling sites during this cruise rather than to calcification and dissolution processes.
Total Alkalinity Control on the Seasonal Air-Sea CO2 Exchanges
To address the question of the control of AT and CT changes on the “source” (pCO2SW > pCO2ATM) or “sink” (pCO2SW < pCO2ATM) of CO2 in the NWLB, PERLE’s AT and CT values are reported in Figure 6. The temperature range in the area has been used to draw the red and blue “iso pCO2SW-lines” as representative of the pCO2SW values encountered during the winter and summer PERLE cruises. Considering a mean atmospheric partial pressure (pCO2ATM) value of 403 μatm (recorded at Lampedusa site from October 2018 to December 2019; Dlugokencky et al., 2021), the upper seawaters encountered at the warm end of summer with high alkalinity (PERLE1) were a “source” of CO2. In contrast, the cold and low alkalinity end of winter (PERLE2) surface waters were a “sink” of CO2 with pCO2SW.
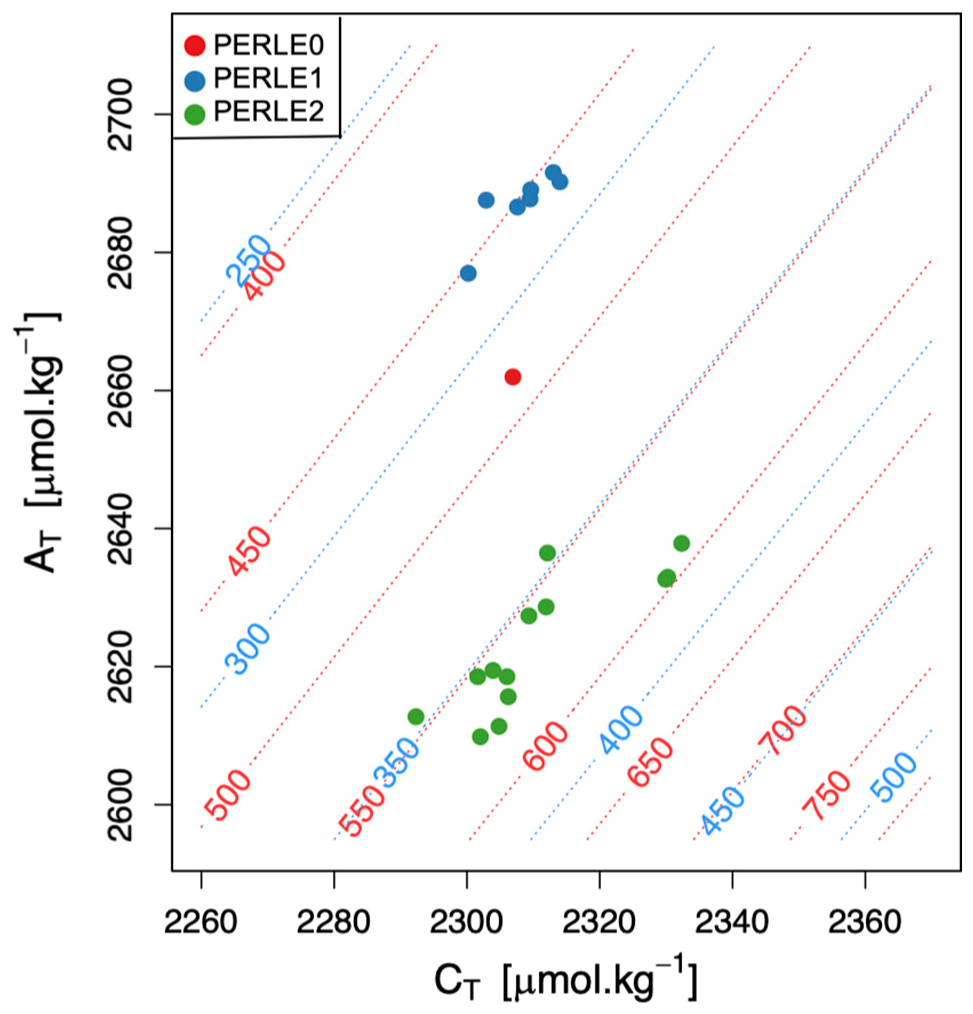
Figure 6. Total alkalinity (AT) vs. total dissolved inorganic carbon (CT) within the MLD for all stations situated in the North Western Levantine Basin during the three PERLE cruises. Red and blue isolines indicate levels of constant pCO2SW as a function of AT and CT at 26°C and 15°C, respectively.
Although the CT content remained almost stable between the PERLE cruises, the AT variability was noticeable with the lowest AT values measured at the end of the winter period (PERLE2) and the highest AT values estimated during PERLE1, at the end of the summer period. When considering the large pCO2SW variations due to the temperature variability represented by the shift between the red and blue isolines, the high alkalinity seawater at the end of summer (PERLE1–blue dots on Figure 6) induces low pCO2SW values when seawater starts to cool and therefore highlights the potential for surface waters to absorb atmospheric CO2. In the NWLB, the variability of the AT content of the surface waters over an annual cycle impacts the air-sea CO2 exchanges. The “classical” vision that the pCO2SW variability is not driven by temperature change but by the biological control on CT, must be largely revisited in light of the important effect that variations in AT have on the pCO2SW regulation capability in the EMed.
In order to estimate the effect of the AT variability on the pCO2SW over an annual cycle, alkalinity was derived from salinity data from an Argo float that cycled in the NWLB for over a year. The temperature and total alkalinity (derived from salinity) values recorded by the float in the upper 20 dbars of the water column representative of the surface mixed layer affected by air-sea exchanges are presented in Figure 7. The cruise data within the mixed layer are also reported. In Figure 7, the red “iso pCO2SW-line” indicates the pCO2 equilibrium between the ocean and the atmosphere. This isoline was derived at constant CT, based on the assumption that the pCO2SW is, apart from temperature, controlled by AT rather than by CT in the NWLB. The distribution of data above and below this line highlights the “source” or “sink” status of the NWLB for atmospheric CO2, respectively.
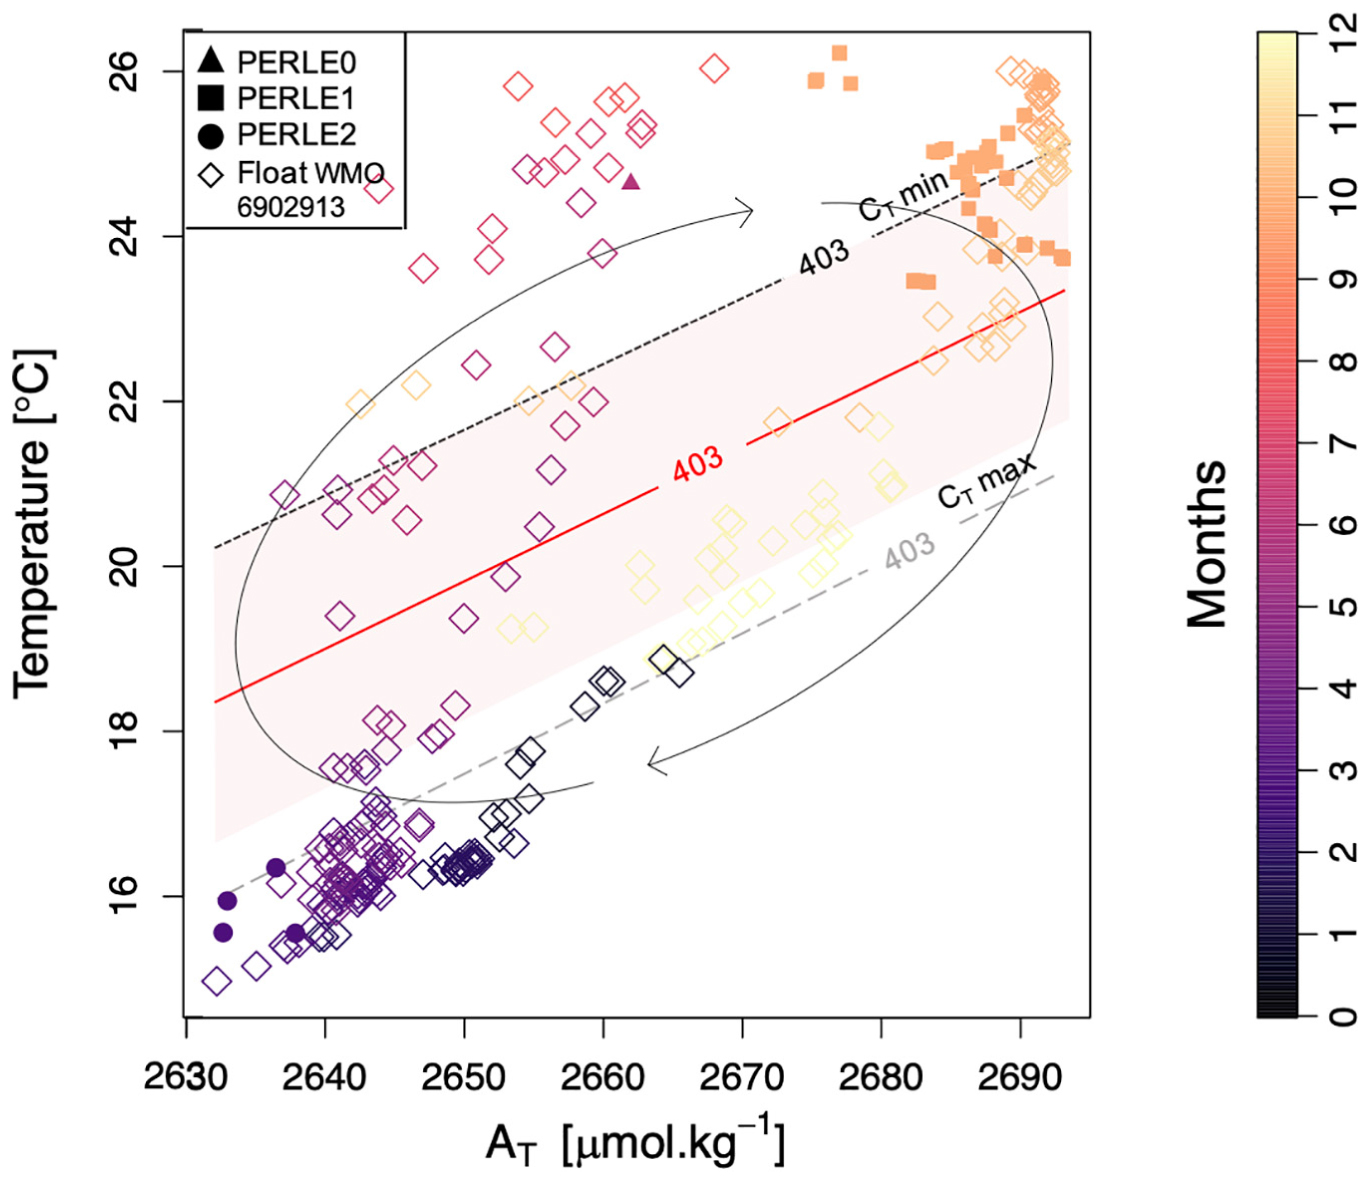
Figure 7. Total alkalinity (AT) vs. temperature in the upper 20 dbars during the three PERLE cruises and for the WMO 6902913 float data from October 2018 to July 2020 [AT values have been estimated from the float salinity following the AT-S sub-surface relationship proposed by Hassoun et al. (2015a)]. The colour bar corresponds to the “month of the year.” The red “iso pCO2SW-line” corresponds to the mean pCO2ATM value at Lampedusa site (estimated from the mean mole fraction of CO2 in ppm) calculated with the mean CT values for all PERLE cruises (= 403 μatm). The two others grey isolines correspond to the same constant pCO2SW with the minimum and maximum CT values (from PERLE cruises) (2,292 and 2,332 μmol.kg–1, respectively). Arrows reflect the theoretical changes in AT and temperature throughout the year. The coloured area represents the error associated to the red “iso pCO2SW-line” deduced by combining the uncertainty associated to the AT values (i.e., ± 19 μmol.kg–1) with the default standard uncertainties from the constants (Orr et al., 2018).
The float derived data agreed with data measured during the PERLE cruises and indicate a penetration of atmospheric CO2 into the EMed from December to April, and a release of CO2 into the atmosphere from May to November. It must be noted that these estimates are sensitive to the CT value used. Indeed, by considering a high CT content (grey isoline labelled “CT max” in Figure 7), the period of CO2 “sink” for the atmosphere will be shorter (from February to April). Conversely, if the lowest CT mean value is considered (black isoline labelled “CT min” in Figure 7), the area will act as a “sink” from December to May. The observed “iso pCO2SW-lines” shift (grey and black isolines in Figure 7) from the “iso pCO2SW-line” at mean CT (red isoline in Figure 7) due to the CT variability over a year induces a temporal change in the status of “source” or “sink” of the upper water masses. Moreover, by considering the accuracy of ± 19 μmol.kg–1 associated to the AT estimation (according to Hassoun et al., 2015a), the uncertainty of the estimated pCO2SW has been calculated (Orr et al., 2018) and ranged between the two “iso pCO2SW-lines” deduced from the maximum and minimum CT values (red area on Figure 7). Although the displacement of the air-sea pCO2 equilibrium might shift considering the AT uncertainty, the temporal succession of the “sink” or “source” status for atmospheric CO2 throughout a year in the NWLB is evidenced. It confirms that the AT content of the surface waters is a significant driver of the air-sea CO2 fluxes in the NWLB.
These are, to the best of our knowledge, the first estimates of the succession of the “sink” and “source” status in the NWLB based on in situ data. Previous estimates based on satellite observations of sea surface properties, and on a model characterising the evolution of the mixed layer pCO2SW (D’Ortenzio et al., 2008; Taillandier et al., 2012) are confirmed by this study. Moreover, coastal observations in the South eastern Levantine basin close to the Israeli shelf have also reported a CO2 source for the atmosphere in summer (from May to December) and a sink of atmospheric CO2 in winter (from January to April) (Sisma-Ventura et al., 2017).
Long Term Temporal Changes in Carbonate Chemistry in the North Western Levantine Basin
Decadal Carbonate Chemistry Trends in Surface Waters in the NWLB
Based on historical observations from the CARIMED dataset and observations from the PERLE cruises, temporal changes in carbonate chemistry between 2001 and 2019 in the surface NWLB have been assessed to study the mechanisms that could explain the carbonate system changes over the last twenty years (Figure 8). The surface layer has been defined to a depth of 50 dbars to include sufficient data. Due to the seasonal changes in surface salinity in the EMed (Grodsky et al., 2019), salinity-normalised AT (NAT39.3) and CT (NCT39.3) were used to facilitate the comparison between the different datasets across space and time. Indeed, due to the strong salinity dependency of alkalinity, by normalising by salinity, a significant part of the seasonal signal for alkalinity is removed.
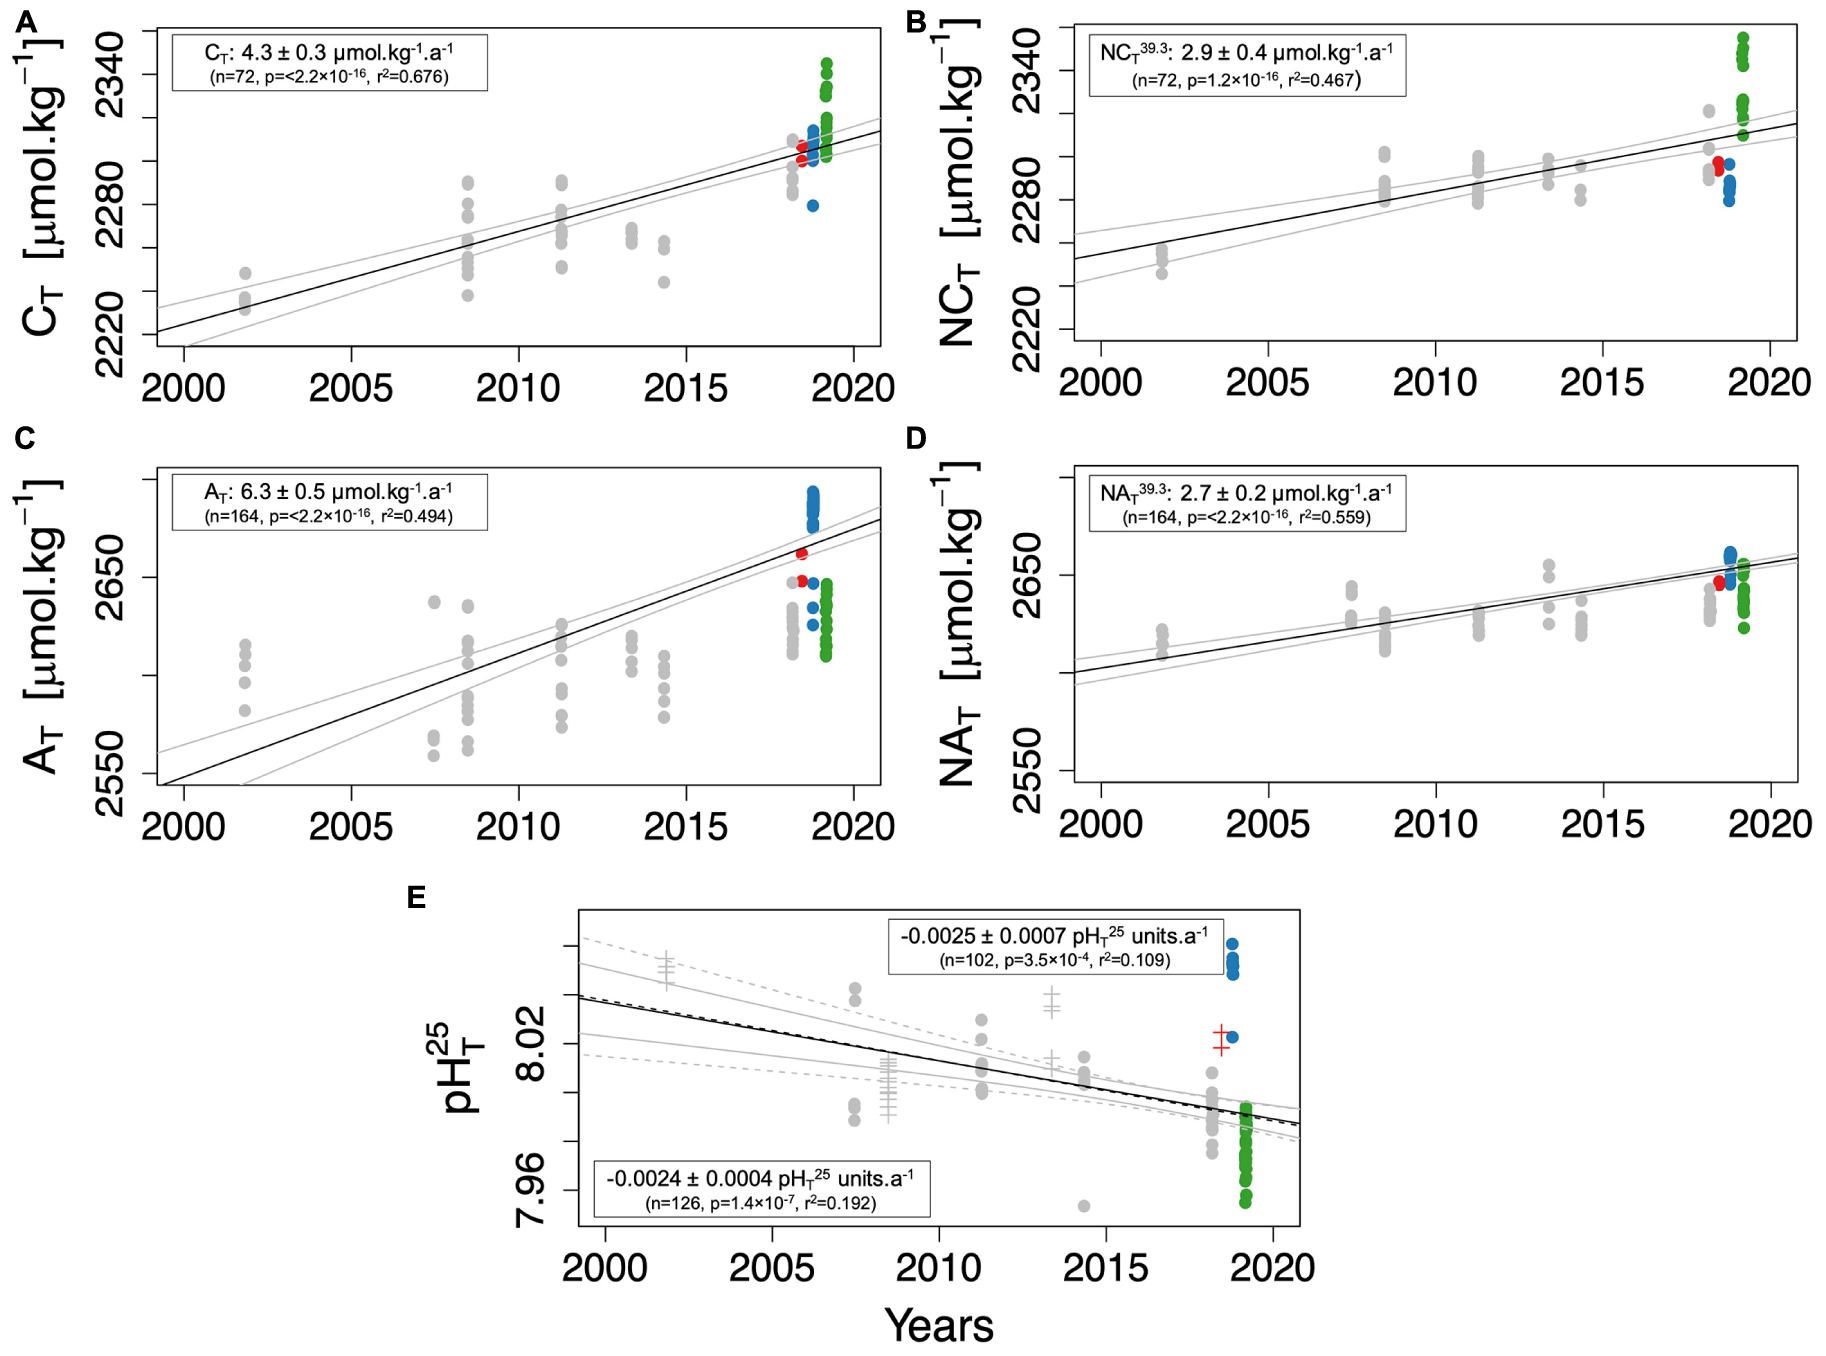
Figure 8. Temporal evolution in the North Western Levantine Basin of total dissolved inorganic carbon (CT–μmol.kg–1; A) and salinity-normalised CT (NCT39.3–μmol.kg–1; B), total alkalinity (AT–μmol.kg–1; C) and salinity-normalised AT (NAT39.3–μmol.kg–1; D) and pHT25 (E) based on the CARIMED dataset (grey dots) and PERLE cruises. The colour code for the dots is the same as in Figure 1. Only data above 50 dbars are used. In (E), full line and dashed lines correspond to the temporal trends calculated according to all pHT25 data [measured (full dots—trend framed in full lines) and calculated (crosses—trend framed in dotted lines)]. Estimated trends are obtained from slope values of a linear regression between the studied parameters and time. The confident interval has been added for each trend with the coefficient of determination (r2), the number of values used (n) and the significance of the trend (p-value).
While being higher (even when salinity-normalised) than the trends observed in the North Western MedSea (i.e., 1.40 ± 0.15 μmol.kg–1.a–1; Merlivat et al., 2018), the temporal CT increase in the NWLB surface waters (Figure 8A) is consistent with other trends measured in the eastern Levantine basin (i.e., 5 ± 2 μmol.kg–1.a–1; Hassoun et al., 2019). However, when compared to other time-series over the global ocean, the trends measured in the surface NWLB waters are 3.7–1.5 times higher (if the NCT39.3 trend is considered) than the global ocean range which lies between 0.78 μmol.kg–1.a–1 (Munida South Pacific time-series) and 1.89 μmol.kg–1.a–1 (CARIOCA time-series; Bates et al., 2014). This suggests that distinct mechanisms explaining the increasing CT trend exist in the NWLB.
While AT is considered insensitive to atmospheric CO2 penetration (Zeebe, 2012), positive trends in CT and negative trends in pHT25 (Figures 8A,E) can be explained, at least partially, by the increase in atmospheric CO2. Indeed, between 2006 and 2018, a mean annual increase of 2.2 ± 0.08 ppm.a–1 in xCO2ATM (mole fraction of CO2) was recorded at the Lampedusa site (equivalent to the trend recorded on a global scale; Dlugokencky et al., 2021). To estimate the sensitivity of the estimated trends to the increase in atmospheric CO2, the increase in xCO2ATM was assumed to be equivalent to a surface ocean increase in pCO2SW. Based on the estimated trends in pCO2SW, NAT39.3, and NCT39.3, annual changes in carbonate chemistry pCO2SW have been calculated by solving thermodynamic equations (Table 3). The observed annual decrease in pHT25 (Figure 8E) and increase in CT (Figure 8A) lies between the values estimated with and without an AT increase. This suggests that an AT increase must exist to compensate for the decrease in pH and the increase in CT or, in other words, that the high observed CT trend is the consequence of the observed AT increase. Although a positive AT trend has been observed elsewhere in a coastal site of the MedSea (Kapsenberg et al., 2017), it remains unexplained. These changes could be related to changes in riverine inputs or changes in Black Sea water inputs (Schneider et al., 2007).
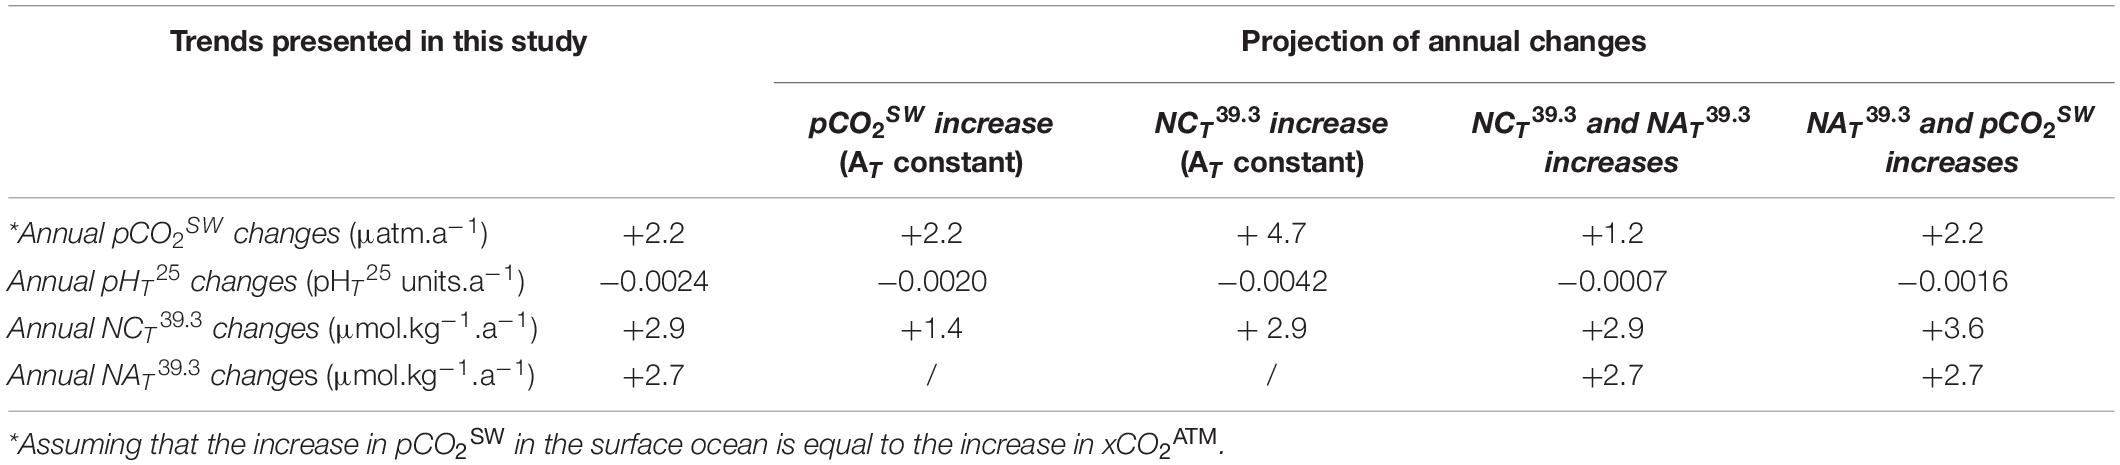
Table 3. Projection of annual changes on the carbonate parameters. Considering the temporal trends calculated in section “Decadal carbonate chemistry Trends in Surface Waters in the NWLB,” changes were calculated by adding the trend values to the mean values estimated for the surface layer (0–50 dbars) of the PERLE area.
It is worth noting that the CARIMED database, by merging data measured over the past 20 years, has a large over-representation of the spring season (Supplementary Figure 1 and Supplementary Table 2). Moreover, the spatial distribution of the sampled stations was different for each cruise. The scarcity of observations in the NWLB precludes the estimation of the seasonal variability on the observed trends. Due to the observed influence of seasonal conditions on the carbonate parameters during the PERLE cruises, time-series that would include observations of the peculiar conditions observed in the late summer (high surface pHT25 associated with high AT values during PERLE1—Figure 2C) or winter could modulate the observed temporal trends. Nonetheless, when data collected during “not spring” cruises are not considered to estimate the trends, despite shifting the temporal trend values, tendencies remain significant for each parameter. Thus, the conclusion that a decadal AT increase must exist to counterbalance the pH decrease associated to the CT increase remains coherent and valid.
Perspectives on the Future Functioning of the Eastern Mediterranean Carbonate System
In the projected warmer MedSea (Nykjaer, 2009), increased stratification but also reduced nutrient inputs from river discharge caused by more frequent drought periods could increase the oligotrophy of the MedSea (e.g., Moon et al., 2016; Pagès et al., 2019, 2020). As this study suggests that the magnitude of the annual CT variation in surface waters is reduced in the EMed due to the low CT vertical gradients, all processes that could decrease primary production in the future could reduce the CT contribution to the air-sea exchanges.
Even if internal thermohaline oscillation needs to be considered to draw solid conclusions about salinity trends, over the past 30 years, a positive long-term trend in salinity for the LSW and LIW has been recorded (Ozer et al., 2017). Because of the salinity impact on alkalinity concentrations (Figure 4) and of the AT impact on the air-sea CO2 fluxes (Figure 7), if the PERLE1 conditions are exacerbated in the future with marine heatwaves extending over longer periods of the year, even more alkaline waters can be expected at the end of the summer. An even greater potential pCO2ATM sink will result when surface seawaters cool. The gyres (such as the IE), which have a higher AT content due to their saltier waters, might be even more efficient at catching atmospheric CO2 when seawater cools. The control of air-sea CO2 exchange by alkalinity that is suggested in this study could be enhanced in a future warmer and less productive EMed. However, as CT and AT are equally affected by evaporation and as, in the future less productive EMed, the CT biological consumption will be less efficient, the mechanisms leading to stable inorganic carbon content described in this study might be altered.
In an attempt to quantify the sensitivity of the carbonate system to future CT and AT changes, estimated buffer factors within the MLD for each PERLE cruise are presented in Table 4. At a comparable period of the year (March–April for PERLE2 cruise), the estimated buffer factors are in good agreement with former estimates (Álvarez et al., 2014) whereas the estimated buffer factors for PERLE0 and PERLE1 cruises during summer are significantly higher. Higher absolute buffer values imply higher buffering capacity and lower changes in [CO2], pH or Ω for a given change in AT or CT. Assuming that the PERLE1 conditions will be exacerbated in the future (Darmaraki et al., 2019), the EMed surface water is moving toward an overall increase in its buffering capacity (relative to changes in AT and CT).
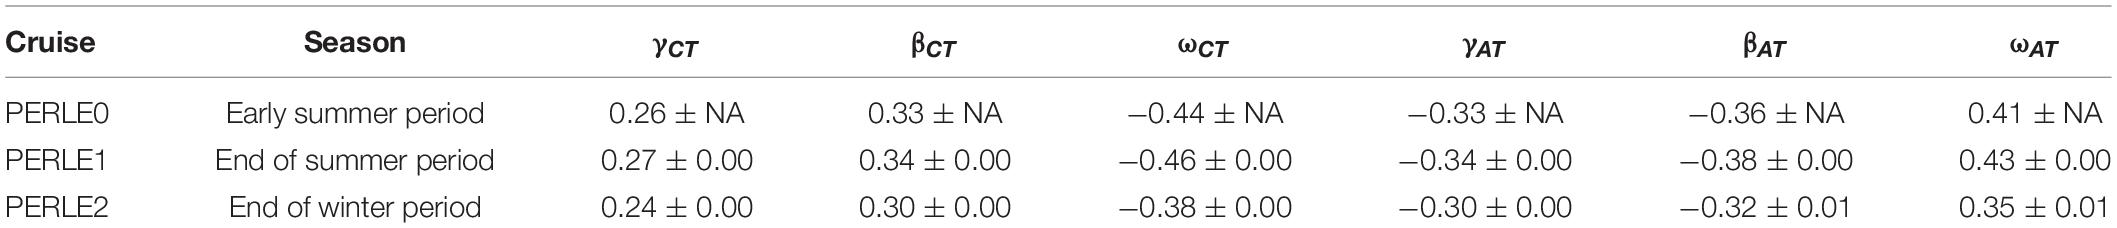
Table 4. Mean values and standard deviations of buffer factors (in mmol.kg–1) during PERLE cruises.
It is worth noting that, when atmospheric CO2 dissolves in seawater, the CO2 concentration in solution changes due to the carbonate ion buffering effect. The future effects of the decadal trends measured in the NWLB on the buffering capacities of the carbonate ion can be discussed using three different perspectives: (1) By considering the observed decrease in pHT25, the carbonate ion availability will decrease accordingly, reducing the atmospheric CO2 uptake by the MedSea. (2) The greater increase in CT in comparison to the increase in AT will reduce the carbonate ion availability, but, nevertheless, will compensate for the impact of a pH decrease on the carbonate ion content, so allowing the CO2 uptake into the atmosphere. (3) The positive trend in AT, and its impact on the CO2 atmospheric uptake and on mitigating the decreasing pH trend, may indirectly increase the CT.
Conclusion
Based on data collected in the EMed over three different seasons of the year, this study provides for the first time, an annual overview of the seasonal dynamics of the carbonate chemistry in the NWLB. In this area, an atypical seasonal range in AT variations compared to the range in CT variations results from the combination of high rates of evaporation and biological processes.
The high AT content at the “end of summer” period has a strong impact on the air-sea exchanges of CO2. In the NWLB, the status of “source” or “sink” for atmospheric CO2 is adjusted by the AT variability more than the CT variability. Over longer time scales, and by compiling historical data, the reported increasing trends in AT and CT impact with divergent effects the observed acidification. These “end of summer” conditions will occur more frequently and lasting longer in the future. This ocean warming up will result in an increased buffer capacity that could mitigate the ocean acidification of the EMed.
Data Availability Statement
The datasets presented in this study can be found in online repositories. The names of the repository/repositories and accession number(s) can be found below: https://mistrals.sedoo.fr/MERMeX/ and http://www.coriolis.eu.org.
Author Contributions
CW-R, TW, and DL initiated and design the study. MÁ provided the CARIMED database and contributed to carbonate chemistry interpretation. PR helped supervising the study. MP-P and PC provided the nutrients database. MF, LC, TM, LN-C, CW-R, and TW performed on board carbonate parameters and oxygen analytical measurements. VT and FD’O provided CTD and ARGO dataset. FD’O, XD, and PC planned and designed the PERLE Research cruises. CW-R, TW, and DL wrote the first draft of the manuscript. All authors contributed to manuscript revision, read, and approved the submitted version.
Funding
This study takes part of the PERLE (Pelagic Ecosystem Response to the Levantine Experiment) of the MISTRALS-MERMEX project. The project leading to this publication has received funding from European FEDER Fund under project 1166-39417. The SNAPO-CO2 service at LOCEAN was supported by the CNRS-INSU and OSU Ecce-Terra.
Conflict of Interest
The authors declare that the research was conducted in the absence of any commercial or financial relationships that could be construed as a potential conflict of interest.
Acknowledgments
We wish to thank the crew members of the R/V “Téthys II” operated by the DT-INSU, for making the PERLE0 (BIO-ARGO-MED2018) cruise possible. We gratefully acknowledge the Délégation Générale de l’Armement which funded the program Protevs II into which the PROTEVS-PERLE1 campaign was scheduled, the French Naval Hydrologic and Oceanographic Service (SHOM) and the crew of the R/V “L’Atalante” (IFREMER) for their contribution to the PROTEVS-PERLE1 campaign. We acknowledge “Flotte Oceanographique Française”, FOF, and the crew of the R/V “Pourquoi Pas?” (IFREMER) for their help in the PERLE2 sampling. The many researchers responsible for the collection of data and quality control are thanked for their contribution. For seawater sample analyses, we also thank the SNAPO-CO2 at LOCEAN, Paris, and in particular J. Fin and N. Metzl. Argo data were collected and made freely available by the Coriolis project and contributing programmes (http://www.coriolis.eu.org). The Argo Program is part of the Global Ocean Observing System. We thank Tracy Lynne Bentley for language editing. The two referees are thanked for helping improve this work.
Supplementary Material
The Supplementary Material for this article can be found online at: https://www.frontiersin.org/articles/10.3389/fmars.2021.649246/full#supplementary-material
References
Álvarez, M., Sanleón-Bartolomé, H., Tanhua, T., Mintrop, L., Luchetta, A., Cantoni, C., et al. (2014). The CO2 system in the mediterranean sea: a basin wide perspective. Ocean Sci. 10:6992. doi: 10.5194/os-10-69-2014
Aminot, A., and Kerouel, R. (2007). Dosage Automatique des Nutriments Dans les Eaux Marines Methodes en Flux Continued. Versailles-Cedex: Ed Ifremer-Quae, 188.
Argo (2000). Argo float data and metadata from global data assembly centre (argo GDAC). SEANOE. doi: 10.17882/42182
Bates, N. R., Astor, Y. M., Church, M. J., Currie, K., Dore, J. E., González-Dávila, M., et al. (2014). A time-series view of changing ocean chemistry due to ocean uptake of anthropogenic CO2 and ocean acidification. Oceanography 27, 126–141. doi: 10.5670/oceanog.2014.16
Bates, N. R., Michaels, A. F., and Knap, A. H. (1996). Seasonal and interannual variability of oceanic carbon dioxide species at the U.S. JGOFS Bermuda Atlantic Time-series Study (BATS) site. Deep Sea Res. Part II Top. Stud. Oceanogr. 43, 347–383. doi: 10.1016/0967-0645(95)00093-3
Bergamasco, A., and Malanotte-Rizzoli, P. (2010). The circulation of the mediterranean sea: a historical review of experimental investigations. Adv. Oceanogr. Limnol. 1:1128. doi: 10.1080/19475721.2010.491656
Borges, A. V., Ruddick, K., Schiettecatte, L.-S., and Delille, B. (2008). Net ecosystem production and carbon dioxide fluxes in the Scheldt estuarine plume. BMC Ecol. 8:15.
Bosc, E., Bricaud, A., and Antoine, D. (2004). Seasonal and interannual variability in algal biomass and primary production in the mediterranean sea, as derived from 4 years of SeaWiFS observations: mediterranean sea biomass and production. Glob. Biogeochem. Cycl. 18:GB1005. doi: 10.1029/2003GB002034
Carritt, D. E., and Carpenter, J. H. (1966). Comparison and evaluation of currently employed modifications of the winkler method for determining dissolved oxygen in seawater; a NASCO report. J. Mar. Res. 24, 286–318.
Christaki, U., Van Wambeke, F., Lefevre, D., Lagaria, A., Prieur, L., Pujo-Pay, M., et al. (2011). Microbial food webs and metabolic state across oligotrophic waters of the Mediterranean Sea during summer. Biogeosciences 8, 1839–1852. doi: 10.5194/bg-8-1839-2011
Clayton, T. D., and Byrne, R. H. (1993). Spectrophotometric seawater pH measurements: total hydrogen ion concentration scale calibration of m-Cresol purple and at-Sea results. Deep Sea Res. Part I Oceanogr. Res. Pap. 40:211529. doi: 10.1016/0967-0637(93)90048-8
Coppola, L., Boutin, J., Gattuso, J.-P., Lefèvre, D., and Metzl, N. (2020). “The carbonate system in the Ligurian Sea,” in The Mediterranean Sea in the Era of Global Change (Volume 1),- Evidence From 30 Years of Multidisciplinary Study of the Ligurian Sea, eds C. Migon, A. Sciandra, and P. Nival (London: ISTE Science Publication LTD), 49–78. doi: 10.1002/9781119706960.ch4
Coppola, L., Diamond Riquier, E., and Carval, T. (2018). Dyfamed Observatory Data. SEANOE. doi: 10.17882/43749
Cossarini, G., Lazzari, P., and Solidoro, C. (2015). Spatiotemporal variability of alkalinity in the Mediterranean Sea. Biogeosciences 12, 1647–1658. doi: 10.5194/bg-12-1647-2015
D’Ortenzio, F., and Ribera d’Alcalà, M. (2009). On the trophic regimes of the Mediterranean Sea: a satellite analysis. Biogeosciences 6, 139–148. doi: 10.5194/bg-6-139-2009
D’Ortenzio, F., Antoine, D., and Marullo, S. (2008). Satellite-driven modelling of the upper ocean mixed layer and air-sea CO2 flux in the Mediterranean Sea. Deep Sea Res. Pt. I 55, 405–434. doi: 10.1016/j.dsr.2007.12.008
D’Ortenzio, F., Iudicone, D., De, C., de Boyer Montégut, C., Testor, P., Antoine, D., et al. (2005). Seasonal variability of the mixed layer depth in the Mediterranean Sea as derived from in situ profiles. Geophys. Res. Lett. 32, 1–4. doi: 10.1029/2005GL022463
D’Ortenzio, F., Taillandier, V., Claustre, H., Coppola, L., Conan, P., Dumas, F., et al. (2020). BGC?Argo floats observe nitrate injection and spring phytoplankton increase in the surface layer of Levantine Sea (Eastern Mediterranean). Geophys. Res. Lett. 48:e2020GL091649. doi: 10.1029/2020GL091649
Darmaraki, S., Somot, S., Sevault, F., Nabat, P., Cabos Narvaez, W. D., Cavicchia, L., et al. (2019). Future evolution of Marine Heatwaves in the Mediterranean Sea. Clim. Dynam. 53, 1371–1392. doi: 10.1007/s00382-019-04661-z
De Carlo, E. H., Mousseau, L., Passafiume, O., Drupp, P. S., and Gattuso, J.-P. (2013). Carbonate chemistry and air–sea CO2 flux in a NW Mediterranean Bay over a four-year period: 2007–2011. Aquat. Geochem. 19, 399–442. doi: 10.1007/s10498-013-9217-4
Dickson, A. G. (1990). Standard potential of the reaction: AgCl(s) + 1/2 H2(g) = Ag(s) + HCl(aq), and the standard acidity constant of the ion HSO4– in synthetic sea water from 273.15 to 318.15 K. J. Chem. Thermodynam. 22:11327. doi: 10.1016/0021-9614(90)90074-Z
Dickson, A. G., and Goyet, C. (1994). ORNL/CDIAC-74 (Ed.), Handbook of Methods for the Analysis of the Various Parameters of the Carbon Dioxide System in Sea Water. Version 2, no 74. Washington, DC: US Department of Energy.
Dickson, A. G., and Millero, F. (1987). A comparison of the equilibrium constants for the dissociation of carbonic acid in seawater media. Deep Sea Res. 34, 1733–1743. doi: 10.1016/0198-0149(87)90021-5
Dickson, A. G., and Riley, J. P. (1979). The estimation of acid dissociation constants in seawater media from potentiometric titrations with strong base, I. The ionic product of water – KW. Mar. Chem. 7, 89–99. doi: 10.1016/0304-4203(79)90001-X
Dickson, A. G., Sabine, C. L., and Christian, J. R. (eds) (2007). Guide to best practices for Ocean CO2 Measurements. PICES Special Publication, Vol. 3. Sidney, BC: North Pacific Marine Science Organisation, 191.
Dlugokencky, E. J., Mund, J. W., Crotwell, A. M., Crotwell, M. J., and Thoning, K. W. (2021). Atmospheric Carbon Dioxide Dry Air Mole Fractions from the NOAA GML Carbon Cycle Cooperative Global Air Sampling Network, 1968-2019, Version: 2021-02. doi: 10.15138/wkgj-f215
Doney, S. C., Fabry, V. J., Feely, R. A., and Kleypas, J. A. (2009). Ocean acidification: the other CO2 problem. Annu. Rev. Mar. Sci. 1, 169–192. doi: 10.1146/annurev.marine.010908.163834
Dore, J. E., Lukas, R., Sadler, D. W., Church, M. J., and Karl, D. M. (2009). Physical and biogeochemical modulation of ocean acidification in the central North Pacific. Proc. Natl. Acad. Sci. U.S.A. 106, 12235–12240. doi: 10.1073/pnas.0906044106
Durrieu de Madron, X., Guieu, C., Sempéré, R., Conan, P., Cossa, D., D’Ortenzio, F., et al. (2011). Marine ecosystems’ responses to climatic and anthropogenic forcings in the Mediterranean. Progr. Oceanogr. 91, 97–166. doi: 10.1016/j.pocean.2011.02.003
Edmond, J. M. (1970). High precision determination of titration alkalinity and total carbon dioxide content of sea water by potentiometric titration. Deep Sea Res. Oceanogr. Abstract. 17:73750. doi: 10.1016/0011-7471(70)90038-0
Egleston, E. S., Sabine, C. L., and Morel, F. M. M. (2010). Revelle revisited: Buffer factors that quantify the response of ocean chemistry to changes in DIC and alkalinity. Glob. Biogeochem. Cycles 24:GB1002. doi: 10.1029/2008GB003407
Feely, R. A., Sabine, C. L., Lee, K., Berelson, W., Kleypas, J., Fabry, V. J., et al. (2004). Impact of anthropogenic CO2 on the CaCO3 system in the oceans. Science 305, 362–366. doi: 10.1126/science.1097329
Flecha, S., Pérez, F. F., Murata, A., Makaoui, A., and Huertas, I. E. (2019). Decadal acidification in Atlantic and mediterranean water masses exchanging at the strait of gibraltar. Sci. Rep. 9:52084. doi: 10.1038/s41598-019-52084-x
Friedlingstein, P., Jones, M. W., O’Sullivan, M., Andrew, R. M., Hauck, J., Peters, G. P., et al. (2019). Global carbon budget 2019. Earth Syst. Sci. Data 11, 1783–1838. doi: 10.5194/essd-11-1783-2019
Garcia, H. E., and Gordon, L. I. (1992). Oxygen solubility in seawater: better fitting equations. Limnol. Oceanogr. 37, 1307–1312. doi: 10.4319/lo.1992.37.6.1307
Gonzaìlez-Daìvila, M., Santana-Casiano, J. M., Petihakis, G., Ntoumas, M., Suárez de Tangil, M., and Krasakopoulou, E. (2016). Seasonal pH variability in the Saronikos Gulf: a year-study using a new photometric pH sensor. J. Mar. Syst. 162, 37–46. doi: 10.1016/j.jmarsys.2016.03.007
Grodsky, S. A., Reul, N., Bentamy, A., Vandemark, D., and Guimbard, S. (2019). Eastern Mediterranean salinification observed in satellite salinity from SMAP mission. J. Mar. Syst. 198:103190. doi: 10.1016/j.jmarsys.2019.103190
Gruber, N., Clement, D., Carter, B. R., Feely, R. A., Van Heuven, S., Hoppema, M., et al. (2019). The oceanic sink for anthropogenic CO2 from 1994 to 2007. Science 363, 1193–1199. doi: 10.1126/science.aau5153
Hainbucher, D., Álvarez, M., Astray, B., Bachi, G., Cardin, V., Celentano, P., et al. (2019). Variability and Trends in Physicial and Biogeochemical Parameters of the Mediterranean Sea, Cruise No. MSM72, March 02, 2018 – April 03, 2019, Iraklion (Greece) – Cádiz (Spain), MED-SHIP2. Bremen: Gutachterpanel Forschungsschiffe, 61. doi: 10.2312/cr_msm72
Hassoun, A. E. R., Fakhri, M., Raad, N., Saab, M. A.-A., Gemayel, E., and De Carlo, E. H. (2019). The carbonate system of the eastern-most mediterranean sea, levantine sub-basin: variations and drivers. Deep Sea Res. Part II Top. Stud. Oceanogr. 164, 54–73. doi: 10.1016/j.dsr2.2019.03.008
Hassoun, A. E. R., Gemayel, E., Krasakopoulou, E., Goyet, C., Saab, M. A.-A., Ziveri, P., et al. (2015a). Modelling of the total alkalinity and the total inorganic carbon in the Mediterranean Sea. J. Water Resourc. Ocean Sci. 4:24. doi: 10.11648/j.wros.20150401.14
Hassoun, A. E. R., Gemayel, E., Krasakopoulou, E., Goyet, C., Saab, M. A.-A., Guglielmi, V., et al. (2015b). Acidification of the Mediterranean Sea from anthropogenic carbon penetration. Deep Sea Res. Pt. I Oceanogr. Res. Pap. 102:115. doi: 10.1016/j.dsr.2015.04.005
Hiscock, W. T., and Millero, F. J. (2006). Alkalinity of the anoxic waters in the western Black Sea. Deep Sea Res. Pt. II 53, 1787–1801. doi: 10.1016/j.dsr2.2006.05.020
Ingrosso, G., Giani, M., Comici, C., Kralj, M., Piacentino, S., De Vittor, C., et al. (2016). Drivers of the carbonate system seasonal variations in a Mediterranean gulf. Estuar. Coast. Shelf Sci. 168, 58–70. doi: 10.1016/j.ecss.2015.11.001
Ioannou, A., Stegner, A., Tuel, A., LeVu, B., Dumas, F., and Speich, S. (2019). Cyclostrophic corrections of AVISO/DUACS surface velocities and its application to mesoscale eddies in the Mediterranean Sea. J. Geophys. Res. Oceans 124, 8913–8932. doi: 10.1029/2019JC015031
IPCC (2018). “Summary for Policymakers,” in Global Warming of 1.5°C. An IPCC Special Report on the Impacts of Global Warming of 1.5°C Above Pre-Industrial levels And Related Global Greenhouse Gas Emission Pathways, In The Context Of Strengthening The Global Response To The Threat Of Climate Change, Sustainable Development, And Efforts To Eradicate Poverty, eds V. Masson-Delmotte, P. Zhai, H.-O. Pörtner, D. Roberts, J. Skea, P. R. Shukla, et al. (Geneva: World Meteorological Organization), 32.
Kapsenberg, L., Alliouane, S., Gazeau, F., Mousseau, L., and Gattuso, J.-P. (2017). Coastal ocean acidification and increasing total alkalinity in the Northwestern Mediterranean Sea. Ocean Sci. 13:41126. doi: 10.5194/os-13-411-2017
Kelley, D., Richards, C., and WG127 SCOR/IAPSO (2017). gsw: Gibbs Sea Water Functions. R package version 1.0-5.
Kroeker, K. J., Kordas, R. L., Crim, R., Hendriks, I. E., Ramajo, L., Singh, G. S., et al. (2013). Impacts of ocean acidification on marine organisms: quantifying sensitivities and interaction with warming. Glob. Change Biol. 19, 1884–1896. doi: 10.1111/gcb.12179
Langdon, C. (2010). Determination of Dissolved Oxygen in Seawater by Winkler Titration Using the Amperometric Technique, no. 14 in IOCCP Report, ICPO Publication. Available online at: www.go-ship.org/HydroMan.html (accessed February 25, 2020).
Lascaratos, A., and Nittis, K. (1998). A high-resolution three-dimensional numerical study of intermediate water formation in the Levantine Sea. J. Geophys. Res. 103, 497–511. doi: 10.1029/98JC01196
Lee, K., Sabine, C. L., Tanhua, T., Kim, T.-W., Feely, R. A., and Kim, H.-C. (2011). Roles of marginal seas in absorbing and storing fossil fuel CO2. Ener. Environ. Sci. 4, 1133–1146. doi: 10.1039/C0EE00663G
Lefèvre, D. (2010). MOOSE (ANTARES). Available online at: https://campagnes.flotteoceanographique.fr/series/233/
Liu, X., Patsavas, M. C., Robert, H., and Byrne, R. H. (2011). Purification and characterisation of meta-cresol purple for spectrophotometric seawater pH measurements. Environ. Sci. Technol. 45, 4862–4868. doi: 10.1021/es200665
Mehrbach, C., Culberson, C. H., Hawley, J. E., and Pytkowicz, R. M. (1973). Measurement of the apparent dissociation constants of carbonic acid in seawater at atmospheric pressure. Limnol. Oceanogr. 18, 897–907. doi: 10.4319/lo.1973.18.6.0897
Merlivat, L., Boutin, J., Antoine, D., Beaumont, L., Melek Golbol, M., and Vellucci, V. (2018). Increase of dissolved inorganic carbon and decrease in pH in near-surface waters in the Mediterranean Sea during the past two decades. Biogeosciences 15, 5653–5662. doi: 10.5194/bg-15-5653-2018
Millot, C., and Taupier-Letage, I. (2005). Circulation in the Mediterranean Sea, in The Handbook of Environmental Chemistry, Vol. 5: Water Pollution, Part K. Berlin: Springer-Verlag, 29–66. doi: 10.1007/b107143
Moon, J.-Y., Lee, K., Tanhua, T., Kress, N., and Kim, I.-N. (2016). Temporal nutrient dynamics in the Mediterranean Sea in response to anthropogenic inputs. Geophys. Res. Lett. 43, 5243–5251. doi: 10.1002/2016GL068788
Moutin, T., and Raimbault, P. (2002). Primary production, carbon export and nutrients availability in western and eastern Mediterranean Sea in early summer 1996 (MINOS cruise). J. Mar. Syst. 3, 273–288. doi: 10.1016/S0924-7963(02)00062-3
Nykjaer, L. (2009). Mediterranean Sea surface warming 1985-2006. Clim. Res. 39, 11–17. doi: 10.3354/cr00794
Olafsson, J., Olafsdottir, S. R., Benoit-Cattin, A., Danielsen, M., Arnarson, T. S., and Takahashi, T. (2009). Rate of Iceland Sea acidification from time series measurements. Biogeosciences 6, 2661–2668. doi: 10.5194/bg-6-2661-2009
Orr, J., Epitalon, J.-M., Dickson, A. G., and Gattuso, J.-P. (2018). Routine uncertainty propagation for the marine carbon dioxide system. Mar. Chem. 207, 84–107. doi: 10.1016/j.marchem.2018.10.006
Owens, W. B., and Millard, R. C. (1985). A New Algorithm for CTD Oxygen Calibration. J. Phys. Oceanogr. 15, 621–631.
Ozer, T., Gertman, I., Kress, N., Silverman, J., and Herut, B. (2017). Interannual thermohaline (1979–2014) and nutrient (2002–2014) dynamics in the Levantine surface and intermediate water masses, SE Mediterranean Sea. Glob. Planet. Change 151, 60–67. doi: 10.1016/j.gloplacha.2016.04.001
Özsoy, E., Hecht, A., and Ünlüata, Ü (1989). Circulation and hydrography of the levantine basin. Results of POEM coordinated experiments 1985–1986. Progr. Oceanogr. 22, 12570. doi: 10.1016/0079-6611(89)90004-9
Pagès, R., Baklouti, M., Barrier, N., Ayache, M., Sevault, F., and Moutin, T. (2020). Projected effects of climate-induced changes in hydrodynamics on the biogeochemistry of the mediterranean sea under the RCP 8.5 regional climate scenario. Front. Marine Sci. 7:957. doi: 10.3389/fmars.2020.563615
Pagès, R., Baklouti, M., Barrier, N., Richon, C., Dutay, J.-C., and Moutin, T. (2019). Changes in rivers inputs during the last decades significantly impacted the biogeochemistry of the eastern Mediterranean basin: a modelling study. Progr. Oceanogr. 181:102242. doi: 10.1016/j.pocean.2019.102242
Palmiéri, J., Orr, J. C., Dutay, J.-C., Béranger, K., Schneider, A., Beuvier, J., et al. (2015). Simulated Anthropogenic CO2 Storage and Acidification of the Mediterranean Sea. Biogeosciences 12:781802. doi: 10.5194/bg-12-781-2015
Petihakis, G., Perivoliotis, L., Korres, G., Ballas, D., Frangoulis, C., Pagonis, P., et al. (2018). An integrated open-coastal biogeochemistry, ecosystem and biodiversity observatory of the eastern Mediterranean – the Cretan Sea component of the POSEIDON system. Ocean Sci. 14, 1223–1245. doi: 10.5194/os-14-1223-2018
Pujo-Pay, M., Conan, P., Oriol, L., Cornet-Barthaux, V., Falco, C., Ghiglione, J.-F., et al. (2011). Integrated survey of elemental stoichiometry (C, N, P) from the western to eastern Mediterranean Sea. Biogeosciences 8, 883–899. doi: 10.5194/bg-8-883-2011
Regaudie-de-Gioux, A., Vaquer-Sunyer, R., and Duarte, C. M. (2009). Patterns in planktonic metabolism in the Mediterranean Sea. Biogeosciences 6, 3081–3089. doi: 10.5194/bg-6-3081-2009
Rivaro, P., Messa, R., Massolo, S., and Frache, R. (2010). Distributions of carbonate properties along the water column in the Mediterranean Sea: spatial and temporal variations. Mar. Chem. 121, 236–254. doi: 10.1016/j.marchem.2010.05.003
Roether, W., Manca, B. B., Klein, B., Bregant, D., Georgopoulos, D., Beitzel, V., et al. (1996). Recent changes in Eastern Mediterranean Deep Waters. Science 271, 333–335. doi: 10.1126/science.271.5247.333
Santana-Casiano, J., and González-Dávila, M. (2010). “pH decrease and effects on the chemistry of seawater (Chapter 5),” in Oceans and the Atmospheric Carbon Content, ed. D. J. M. Santana-Casiano (Berlin: Springer). doi: 10.1007/978-90-481-9821-4_5
Schneider, A., Tanhua, T., Körtzinger, A., and Wallace, D. W. R. (2010). High anthropogenic carbon content in the Eastern Mediterranean. J. Geophys. Res. 115:C12. doi: 10.1029/2010JC006171
Schneider, A., Wallace, D. W. R., and Körtzinger, A. (2007). Alkalinity of the Mediterranean Sea: alkalinity of the Mediterranean Sea. Geophys. Res. Lett. 34:L15608. doi: 10.1029/2006GL028842
Sigman, D. M., and Hain, M. P. (2012). The biological productivity of the Ocean. Nat. Educ. Knowl. 3:21.
Sisma-Ventura, G., Or, B. M., Yam, R., Herut, B., and Silverman, J. (2017). pCO2 variability in the surface waters of the ultra-oligotrophic Levantine Sea: exploring the air-sea CO2 fluxes in a fast warming region. Mar. Chem. 196, 13–23. doi: 10.1016/j.marchem.2017.06.006
Smith, S. V., and Kinsey, D. W. (1978). “Calcification and organic carbon metabolism as indicated by carbon dioxide,” in Coral Reefs: Research Methods: Monographs on Oceanographic Methodology, ed. D. R. Stoddart (Paris: UNESCO), 469–484.
Sokal, R. R., and Rohlf, F. J. (1969). Biometry. The Principles and Practices of Statistics in Biological Research, 2nd Edn. San Francisco, CA: W.H. Freeman.
Taillandier, V., D’Ortenzio, F., and Antoine, D. (2012). Carbon fluxes in the mixed layer of the Mediterranea Sea in the 1980s and the 2000s. Deep Sea Res. I 65, 73–84. doi: 10.1016/j.dsr.2012.03.004
Tanhua, T., van Heuven, S., Key, R. M., Velo, A., Olsen, A., and Schirnick, C. (2010). Quality control procedures and methods of the CARINA database. Earth Syst. Sci. Data 2, 35–49. doi: 10.5194/essd-2-35-2010
Touratier, F., and Goyet, C. (2011). Impact of the Eastern Mediterranean Transient on the Distribution of Anthropogenic CO2 and First Estimate of Acidification for the Mediterranean Sea. Deep Sea Res. Pt. I Oceanogr. Res. Pap. 58:115. doi: 10.1016/j.dsr.2010.10.002
Touratier, F., Guglielmi, V., Goyet, C., Prieur, L., Pujo-Pay, M., Conan, P., et al. (2012). Distributions of the carbonate system properties, anthropogenic CO2, and acidification during the 2008 BOUM cruise (Mediterranean Sea). Biogeosci. Discuss. 9, 2709–2753. doi: 10.5194/bgd-9-2709-2012
Uppström, L. R. (1974). The boron/chlorinity ratio of deep-sea water from the Pacific Ocean. Deep Sea Res. 21, 161–162. doi: 10.1016/0011-7471(74)90074-6
Valladares, J., Fennel, W. I., and Morozov, E. G. (2011). Replacement of EOS-80 with the international thermodynamic equation of seawater-2010 (TEOS-10). Deep Sea Res. 58, 978.
van Heuven, S., Pierrot, D., Rae, J., Lewis, E., and Wallace, D. W. R. (2011). CO2SYS v 1.1, MATLAB Program Developed for CO2 System Calculations. ORNL/CDIAC-105b. Oak Ridge, TN: Oak Ridge National Laboratory.
Velaoras, D., Papadopoulos, V. P., Kontoyiannis, H., Cardin, V., and Civitarese, G. (2019). Water masses and hydrography during April and June 2016 in the cretan sea and cretan passage (Eastern Mediterranean Sea). Deep Sea Res. Pt II Top. Stud. Oceanogr. 164, 25–40. doi: 10.1016/j.dsr2.2018.09.005
Williams, P. J., and Jenkinson, N. W. (1982). A transportable microprocessor-controlled precise winkler titration suitable for field station and shipboard Use1. Limnol. Oceanogr. 27:57684. doi: 10.4319/lo.1982.27.3.0576
Winkler, L. W. (1888). Die bestimmung des im wasser gelösten sauerstoffes. Ber. Dtsch. Chem. Ges. 21, 2843–2854. doi: 10.1002/cber.188802102122
Wong, A., Keeley, R., Carval, T., and The Argo Data Management Team (2020). Argo Quality Control Manual for CTD and Trajectory Data. Available online at: https://archimer.ifremer.fr/doc/00228/33951/
Keywords: carbonate system, Mediterranean Sea, acidification, CO2 fluxes, Levantine Sea, inorganic carbon
Citation: Wimart-Rousseau C, Wagener T, Álvarez M, Moutin T, Fourrier M, Coppola L, Niclas-Chirurgien L, Raimbault P, D’Ortenzio F, Durrieu de Madron X, Taillandier V, Dumas F, Conan P, Pujo-Pay M and Lefèvre D (2021) Seasonal and Interannual Variability of the CO2 System in the Eastern Mediterranean Sea: A Case Study in the North Western Levantine Basin. Front. Mar. Sci. 8:649246. doi: 10.3389/fmars.2021.649246
Received: 04 January 2021; Accepted: 09 April 2021;
Published: 17 May 2021.
Edited by:
Gotzon Basterretxea, Mediterranean Institute for Advanced Studies (IMEDEA), SpainReviewed by:
Siv Kari Lauvset, Norwegian Research Institute (NORCE), NorwayAnne Willem Omta, Massachusetts Institute of Technology, United States
Copyright © 2021 Wimart-Rousseau, Wagener, Álvarez, Moutin, Fourrier, Coppola, Niclas-Chirurgien, Raimbault, D’Ortenzio, Durrieu de Madron, Taillandier, Dumas, Conan, Pujo-Pay and Lefèvre. This is an open-access article distributed under the terms of the Creative Commons Attribution License (CC BY). The use, distribution or reproduction in other forums is permitted, provided the original author(s) and the copyright owner(s) are credited and that the original publication in this journal is cited, in accordance with accepted academic practice. No use, distribution or reproduction is permitted which does not comply with these terms.
*Correspondence: Cathy Wimart-Rousseau, cathy.wimart-rousseau@mio.osupytheas.fr