Intrinsic nano-ductility of glasses: the critical role of composition
 Bu Wang
 Yingtian Yu
 Young Jea Lee
 Mathieu Bauchy
- Department of Civil and Environmental Engineering, University of California Los Angeles, Los Angeles, CA, USA
Understanding, predicting, and eventually improving the resistance to fracture for silicate materials is of primary importance to design tougher new glasses suitable for advanced applications. However, the fracture mechanism at the atomic level in amorphous silicate materials is still a topic of debate. In particular, there are some controversies about the existence of ductility at the nanoscale during crack propagation. Here, we present simulations of fracture of three archetypical silicate glasses, using molecular dynamics. The simulations clearly show that, depending on their composition, silicate glasses can exhibit different degrees of ductility at the nanoscale. Additionally, we show that the methodology used in the present work can provide realistic predictions of fracture energy and toughness.
Introduction
Silicate-based glass is one of the most widely used materials in civil applications. It is, however, known for its brittleness. Mechanical stress caused by impacts, scratches, or vibrations can leads to catastrophic failures. In occasions such as car crashes and broken windows, these brittle fractures can be dangerous and even life threatening. This has long been a major challenge for glasses.
The brittleness of glass comes from a lack of stable shearing mechanism, and, consequently, very poor ductility (Mauro and Zanotto, 2014; Shi et al., 2014). To deal with this problem, many techniques focusing on compositing (Hofmann et al., 2008), inclusion of holes (Mirkhalaf et al., 2014), or surface treatments (Narayanaswamy, 1978) have been proposed and applied. However, they often result in undesirable side effects such as a loss of transparency (Wondraczek et al., 2011). Moreover, the application of glasses is fast expanding into many high-technique areas that demand increasingly stronger mechanical properties, but at the same time have stringent manufacturing requirements (Wondraczek et al., 2011). These applications include, among others, short-haul high-capacity telecommunication and fiber-to-the-home technologies, flexible substrates, and roll-to-roll processing of displays, solar modules, planar lighting devices, the next generation of touch screen devices, large scale and high altitude architectural glazing, and ultra-stiff composites. These applications can benefit tremendously from glasses with high strength, toughness, and stiffness. Yet, the traditional means to increase ductility for glasses are difficult, if not impossible, to apply in these applications.
A more fundamental alternative is to enhance the intrinsic ductility of glasses by tuning their atomic topology, which is mainly a function of their composition. Such intrinsic optimization has been established as a Grand Challenge for glass, as it would not only enable new applications but also lead to a significant reduction of material investment for existing applications, while achieving comparable performances (Mauro, 2014). Fulfillment of this goal requires elucidation of fracture mechanism of glasses at the atomic level. Indeed, although glasses are typically brittle at the macro-scale, there remain controversies about the existence of ductility at the nanoscale. Hence, as opposed to an ideal brittle fracture model, in which cracks would propagate based on a series of chemical bond rupture events (Lawn et al., 1980), it has been suggested that oxide glasses should show plastic deformations at the vicinity of the crack tip (Celarie et al., 2003), although this is still a matter of debate (Guin and Wiederhorn, 2004; Pezzotti and Leto, 2009).
To this regard, we simulated fracture of three glass compositions with molecular dynamics simulations and well-established inter-atomic potentials. The compositions include the simple amorphous silica (S) and two common base compositions for many modern industrial glasses, sodium silicate (NS) and calcium aluminosilicate (CAS). We also present a general methodology based on the work of Brochard et al. (2013), which allows us to compute realistic fracture toughness and critical energy release rate from molecular dynamics simulations. The results clearly show composition-dependent ductility at the nanoscale in NS and CAS. We hope that the methodology and results presented here will facilitate the understandings of the composition-dependent fracture mechanism in glasses, and promote further studies to identify advanced glass compositions.
Simulation Details
Preparation of the Glasses
To examine the fracture behavior with molecular dynamics simulations, we select three different silicate glasses: (1) pure silica, (2) a sodium silicate glass of molar composition (Na2O)0.30(SiO2)0.70, and (3) a CAS glass of composition (SiO2)0.60(Al2O3)0.10(CaO)0.30. These three compositions (hereafter denoted as S, NS, and CAS, respectively) cover the structural basis for all silicate glasses (S), two-component alkali silicate glass that is the base material for glasses strengthened by ion-exchange (NS), and alkali-free glass with multiple glass formers that has been used as the base material for display glasses (CAS). Selecting these glass compositions allows us to examine the effects on the fracture behavior resulting from the depolymerization of the silica network by alkali ions and from the inclusion of multiple network formers. It is worth noting that including alkaline or alkaline earth modifiers would lead to a higher degree of inhomogeneity in the structure, manifested by larger spread in the Si–O ring size distribution (Cormier et al., 2003; Du and Cormack, 2004). This could also have an effect on the fracture behavior.
To ensure that the molecular dynamics simulation can predict realistic values of toughness and energetic properties during fracture, three sets of well-established inter-atomic potentials are used. For silica, we use a modified BKS potential (Vollmayr et al., 1996; Roder et al., 2001), which has been found to offer a realistic mechanism for the mode I failure of silica (Yuan and Huang, 2014). The sodium silica glass is simulated with a Buckingham potential parameterized by Teter (Cormack et al., 2002), which has been shown to provide excellent results for structure, dynamics, and mechanics (Du and Cormack, 2004; Pedone et al., 2007; Bauchy and Micoulaut, 2011; Bauchy, 2012; Bauchy et al., 2013). Finally, the CAS glass is prepared using the potential of Matsui (1996), reparametrized by Jakse et al. (Bouhadja et al., 2013), based on ab initio calculations (Jakse et al., 2012). The ability of this potential to predict a realistic structure and good mechanical properties has recently been reported (Bauchy, 2014).
These three glasses are prepared in a consistent way using the LAMMPS package (Plimpton, 1995). The integration time-step is set to 1 fs. Coulomb interactions are evaluated by the Ewald summation method, with a cutoff of 12 Å. The short-range interaction cutoff is chosen at 8.0 Å for NS and CAS, and at 5.5 Å for S, following the protocol reported in previous studies (Pedone et al., 2007; Bauchy, 2014; Yuan and Huang, 2014). A slab containing around 18,000 randomly placed atoms is first generated. The system is then melted at 5000 K in the NPT ensemble for 1 ns to assure the loss of the memory of the initial configuration. Glasses are formed by linear cooling of the glass-forming liquids from 5000 to 300 K, with a cooling rate of 1 K/ps. Once formed, glasses are relaxed at zero pressure and 300 K for 1 ns in the NPT ensemble. The entire glass-forming process is performed under zero pressure.
It should be noted that the cooling rate has been shown to affect the fracture behavior of both metallic and silicate glasses (Kumar et al., 2013; Shi et al., 2014). Although the cooling rate of 1 K/ps used in this study is substantially higher than the experimental value due to the technical constraints inherent to molecular dynamics, it is slow as compared to some previous simulations, in which realistic glass structures and properties have been obtained for similar glasses (Pedone et al., 2007; Bauchy, 2014; Yuan and Huang, 2014). In this study, we also ensure that the structures for the three selected glasses are adequately produced, by comparing the total pair distribution function (PDF) and the neutron structure factor to available experimental data. Details of the method used for these calculations can be found in Bauchy (2014) and its references. Mechanical properties are also examined to ensure reasonable agreement with the experimental data. Regardless, more in-depth studies of the effect of cooling rate on the fracture behavior of glasses could be conducted in the future.
Simulations of Fracture
Recently, Brochard et al. (2013) introduced a new method to determine fracture properties at the atomic scales based on molecular dynamics simulations. This approach relies on the energetic theory of fracture mechanics (Griffith, 1921; Leblond, 2003; Anderson, 2005) and involves integrating thermodynamic properties during crack propagation. This method does not make any assumption regarding the fracture behavior of the material and therefore can capture fracture properties of both brittle and ductile systems (Brochard et al., 2013).
In the present study, we focus on fracture in mode I, i.e., fracture with an opening and a load normal to the crack plane. As illustrated in Figures 1–3, a crack is first created in the molecular samples. Such cracks are expected to exist naturally in real materials. Also note that, as in experiments, starting from a pre-cracked system is necessary to perform fracture toughness measurements in a controlled fashion. The initial crack is created by removing atoms located inside an elliptic volume along the x direction. To induce a strong stress concentration at the crack tips, the ellipse is created to be five times larger in the y direction than in the z direction. Its length is chosen to be around 50 Å, slightly adjusted in each case to ensure the charge neutrality. Note that the initial length must be sufficiently long for the hole to be stable, but at the same time it must be as small as possible compared to the box length in the y direction (the typical system size is 16 Å × 150 Å × 100 Å in the x, y, z directions, respectively).
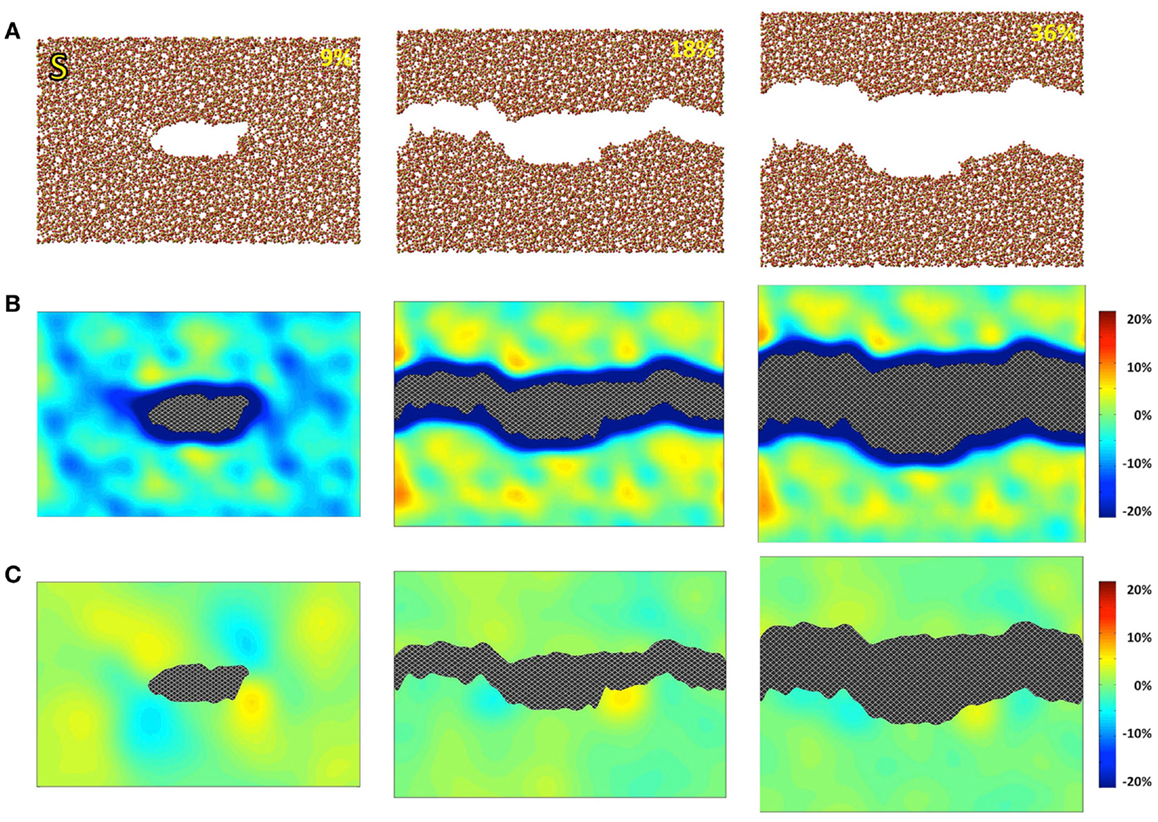
Figure 1. Simulated silica (S) under 9, 18, and 36% strains. (A) Snapshots of the atomic configurations. Silicon and oxygen atoms are in gold and red, respectively; (B) local density change in percentage compared with the bulk density; (C) local shear strain.
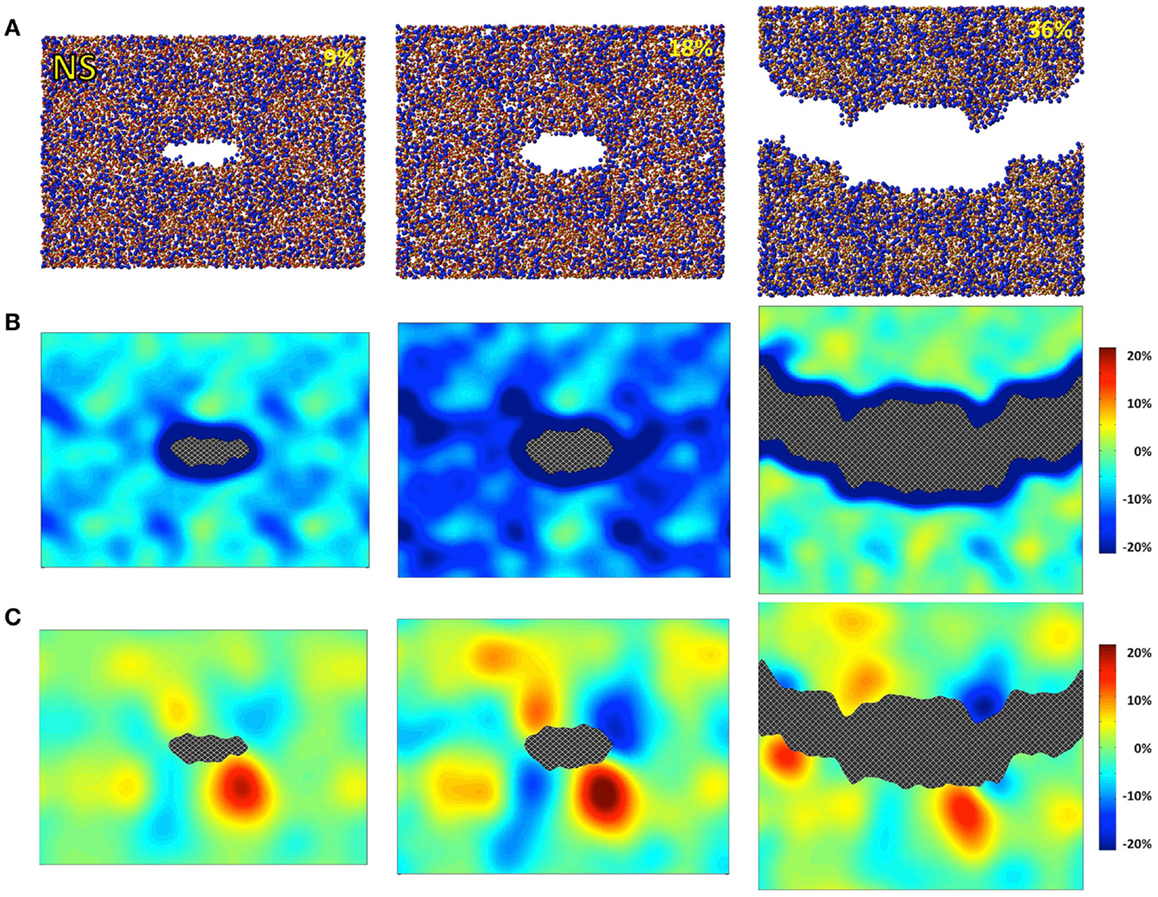
Figure 2. Simulated sodium silicate (NS) under 9, 18, and 36% strains. (A) Snapshots of the atomic configurations. Silicon, sodium, and oxygen atoms are in gold, blue, and red, respectively; (B) local density change in percentage compared with the bulk density; (C) local shear strain.
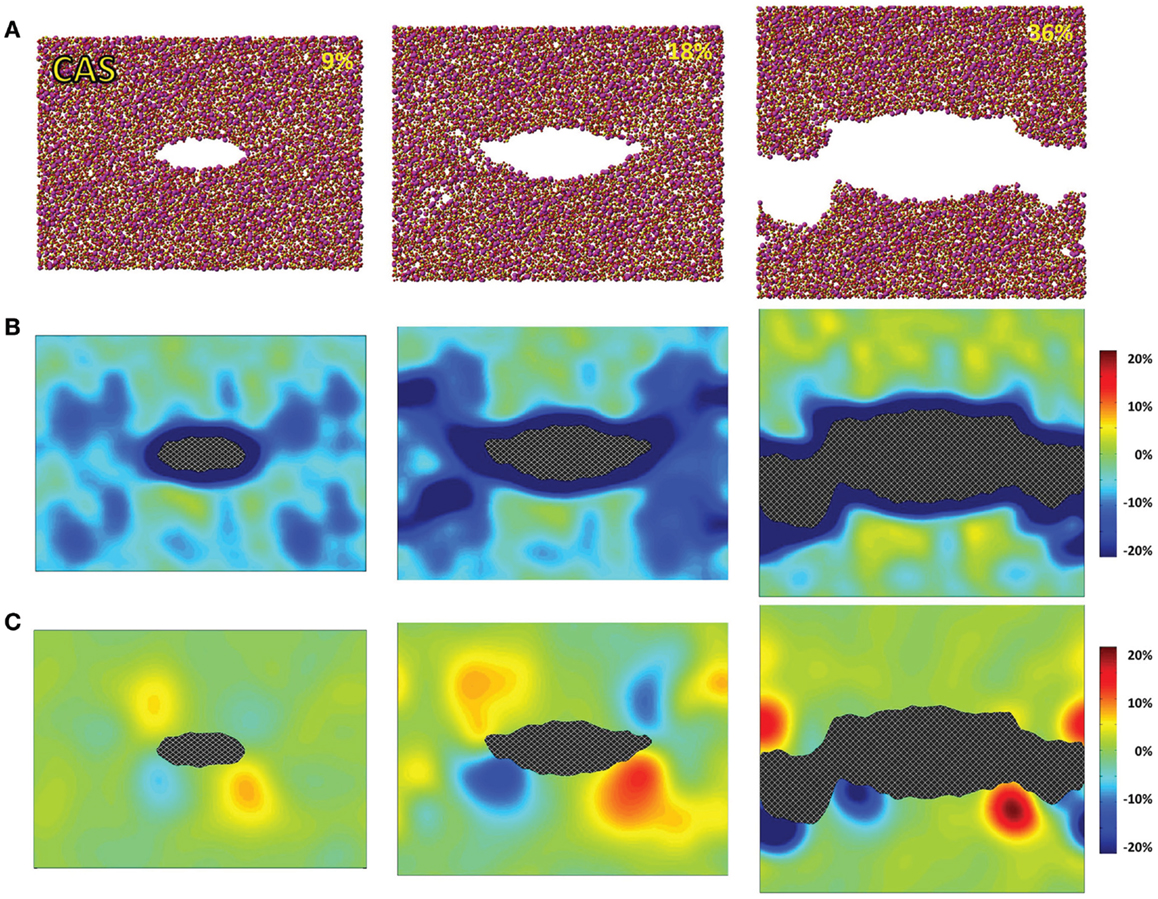
Figure 3. Simulated calcium aluminosilicate (CAS) under 9, 18, and 36% strains. (A) Snapshots of the atomic configurations. Silicon, alumina, calcium, and oxygen atoms are in gold, yellow, magenta, and red, respectively; (B) local density change in percentage compared with the bulk density; (C) local shear strain.
Before any tension is applied, the system is fully relaxed to be stress-free, so that its mechanical energy, P, which is related with strain, becomes 0. The procedure then consists of stretching the size of the system in the direction orthogonal to the initial crack, LZ in this case, until the crack is fully propagated along the y axis. LZ is incremented stepwise by 1% from its initial, unstressed value LZ0 until it reaches 1.5 LZ0. During each step, the system was relaxed for 50 ps, followed by another 50 ps that were used for statistical averaging of the properties. During the statistical averaging phase, the stress along the z direction, σZ, is computed with the virial equation (Allen and Tildesley, 1987).
Note that the entire fracture simulation is operated within the canonical NVT ensemble, in which the temperature is controlled with a Nosé–Hoover thermostat (Nosé, 1984; Hoover, 1985). Hence, information regarding the potential heat transfers during the fracture is lost. In fact, this procedure is not designed to model the kinetics of crack propagation. On the contrary, thermodynamic quantities are always integrated at equilibrium, at each strain step. The phonons that arise during the fracture are annealed by the thermostat and, therefore, are not included in the following thermodynamic integration. This is appropriate within the scope of this study.
As the crack starts to propagate, some elastic energy P is released to create new surfaces. This is captured by the energy release rate G:
where A is the crack area. When propagation occurs, the energy release rate is equal to the critical energy release rate GC, which is considered as a property of the material. Once the crack propagation is complete, the system becomes unstressed again, so that P returns to 0, and the mechanical energy has been completely released by crack propagation. The integration of σZ over the whole process, i.e., the external work, thus can be used to calculate the critical energy release rate GC:
where F is the free energy of the system and ΔA∞ = A∞ − A0 is the total area of surface created at the end of the fracture, when the crack has fully propagated. This formula is a direct consequence of Griffith theory of fracture (Griffith, 1921). It is worth noting that evaluating the crack area at the end of the fracture may not be straightforward as the created surfaces usually show some roughness. To make an accurate estimate of the critical energy release rate, the real surface area is calculated using the procedure outlined in Brochard et al. (2013).
As an alternative to the energetic properties, the notion of fracture toughness KIc is usually used in engineering applications. This quantity was introduced by Irwin (1958) as the maximum stress intensity at the crack tip a solid can withstand, below which propagation cannot occur. The relationship between KIc and GC is given by the Irwin formula (Irwin, 1958):
where ηI is given in Barenblatt (1962) for transversely isotropic solids and can be written in terms of the stiffness constants Cij, using Voigt notations, as:
in plane strain, as is the case of the current study. Note that, although the energetic approach employed here does not assume a brittle fracture, we keep in mind that the relation between GC and KIc was derived in the context of linear-elastic fracture mechanics (LEFM). The full stiffness tensor Cij is computed by applying small strain perturbations on the bulk system, before the introduction of the initial crack. The elements of the stiffness tensor are obtained by calculating the curvature of the potential energy U with respect to small strain deformations ε (Pedone et al., 2007):
where V is the volume of the system. Young’s modulus and Poisson’s ratio (the opposite of the ratio of the transverse and axial strains) are then evaluated from the components of the stiffness tensor.
For isotropic materials, which are the case of the glass structures in the present study, Eq. 3 reduces to the usual Irwin formula (Leblond, 2003):
where E is the Young’s modulus. Hence, this method provides an indirect computation of KIc using a purely energetic approach. The results obtained for the three considered glasses are then analyzed and compared to available experimental data. During the simulations, the local density and shear strain are also computed and monitored.
Results
Figures 4 and 5 show the computed neutron structure factors and total PDFs, compared with experimental data from neutron diffraction measurements (Grimley et al., 1990; Wright et al., 1991; Cormier et al., 2000; Ganster et al., 2004). Since they are linked through Fourier transformations, the structure factor at low Q and PDFs at large r reflect the medium-range structure, and vice versa for short-range structure. We note that fairly good agreement is achieved at both medium and short-range for all three compositions. Overall, the level of agreement from our simulations is comparable to that from previous studies using the same inter-atomic potentials (Horbach et al., 2001; Yuan and Cormack, 2001; Du and Corrales, 2005). The computed Young’s moduli and Poisson’s ratios are reported in Table 1. Both properties are somewhat overestimated for S, a known issue of the BKS potential (Mantisi et al., 2012; Yuan and Huang, 2014). Fairly good agreements are achieved for both NS and CAS.
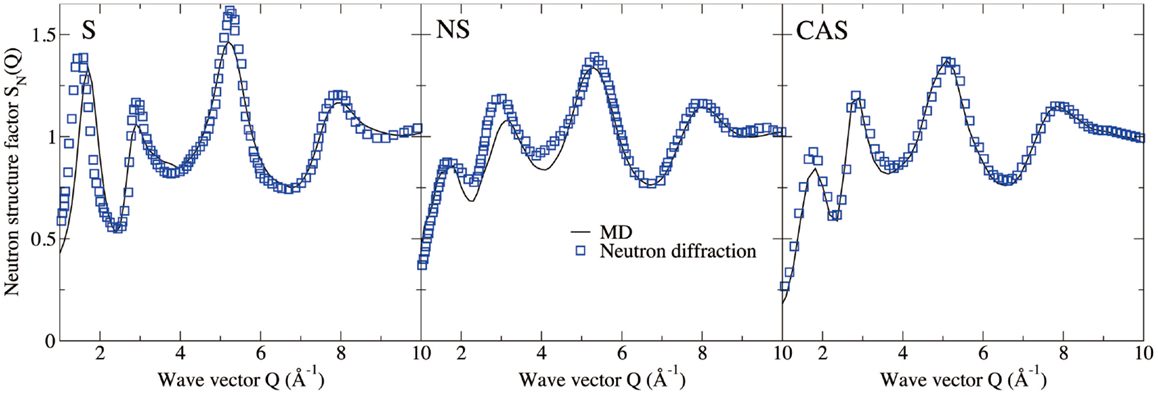
Figure 4. Computed neutron structure factor of silica (S), sodium silicate (NS), and calcium aluminosilicate (CAS), compared with neutron diffraction measurements (Grimley et al., 1990; Wright et al., 1991; Cormier et al., 2000; Ganster et al., 2004).
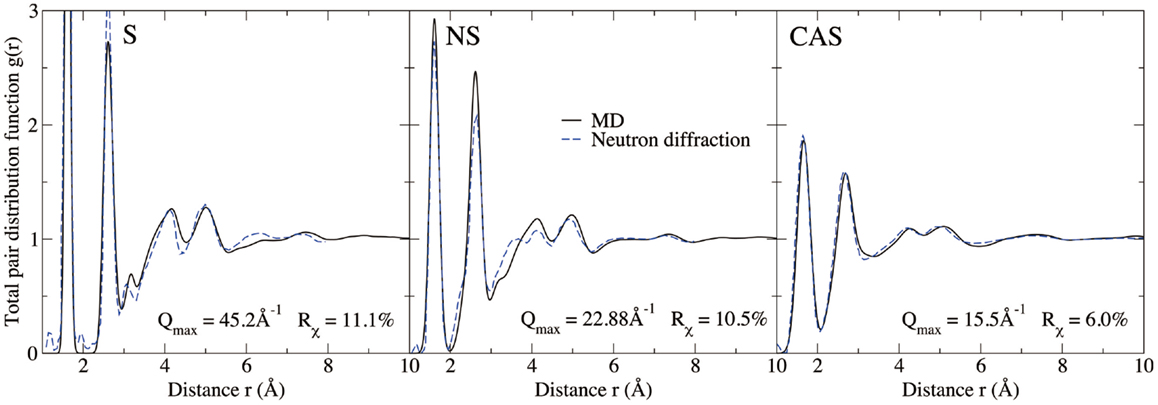
Figure 5. Computed total pair distribution functions of silica (S), sodium silicate (NS), and calcium aluminosilicate (CAS), compared with neutron diffraction measurements (Grimley et al., 1990; Wright et al., 1991; Cormier et al., 2000; Ganster et al., 2004).
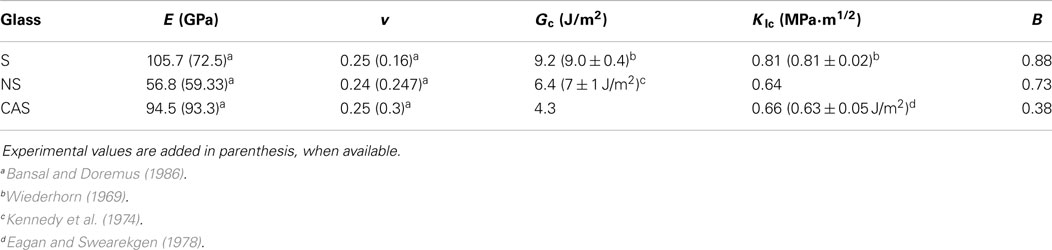
Table 1. Computed Young’s modulus (E), Poisson’s ratio (v), fracture energy (GC), elastic fracture energy (Gel), fracture toughness (KIc), and brittleness index (B) for silica (S), sodium silicate (NS), and calcium aluminosilicate (CAS).
The atomic structures, as obtained from the fracture simulations, along with local density and shear strain maps, are presented in Figures 1–3 for S, NS, and CAS, respectively. The density maps clearly show different behaviors between the three compositions under large strains. Elastic deformation is evident, as all three glasses display lower overall density before the crack propagates through the structures. However, the decrease in density is much more uniform in the case of S. For the other two compositions, especially in the case of CAS, the decrease of density nucleates. Some “weak spots” in the structure, at which the density decrease concentrated, can be easily identified from the density map in Figure 3. We can also see that these weak spots do not necessarily align with the initial crack plane. This causes the fracture to diverge from the initial crack plane as the crack preferentially propagates through these regions. This leads to considerable differences in the roughness of the final fracture surfaces. It is worth noting that these changes in the density under strain are not retained after the fracture, with exception of some areas in CAS. This suggests that these weak spots may not result from the straining, but rather pre-exist in the bulk glass structure. Nonetheless, the presence of inhomogeneity in NS and CAS would certainly cause more complex fracture behavior, which will be reflected in the stress–strain relationship that will be discussed.
The local shear strain is also calculated and presented in Figures 1–3. As expected, during fracture, the shear strain concentrates at the tip of crack in all three cases. Overall, S shows the minimum amount of shear strain, which is an indication of structural rigidity. Also, minimal residual strain in S is observed after the fracture, while both NS and CAS retain substantial residual strain near the surface. From the final shear strain maps, we can see that these areas with significant residual strain have sizes at the level of tens of nanometers.
Figure 6 shows the computed stress–strain curves (stress σZ with respect to the tensile strain ε) for the three glasses. At low strain (up to 12, 9, and 18% for S, NS, and CAS, respectively), the mechanical response is fairly linear elastic. The stress increases linearly with the strain, up to around 9 GPa, with the slope related to the Young’s modulus of the system. During this stage, which is observed for the three glasses, the crack does not propagate and the free energy of the system is stored in the form of mechanical elastic energy only.
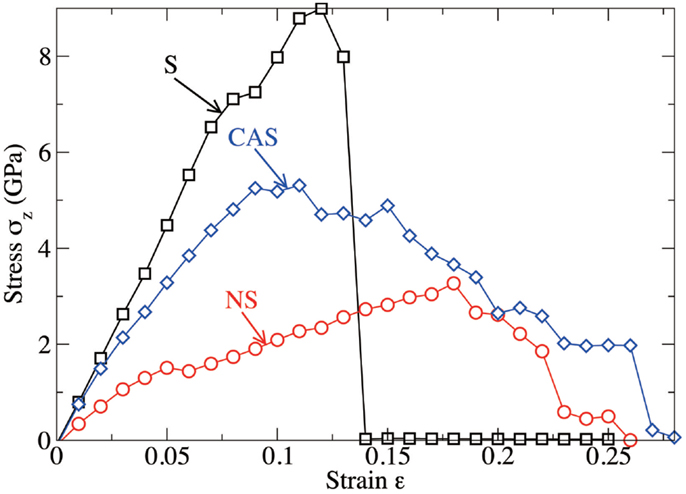
Figure 6. Computed stress as a function of the tensile strain imposed to the system, for silica (S), sodium silicate (NS), and calcium aluminosilicate (CAS) glasses, respectively.
At larger strain, the crack starts to propagate. As shown in Figure 6, silica shows characteristics of brittle fracture, as the crack suddenly propagates above a critical strain of 13%. This manifests by a drop of the tensile stress to 0, which is comparable to what has been observed for quartz (Brochard et al., 2013). On the contrary, NS and CAS glasses break in more ductile way, in the sense that the crack does not propagate instantly after a given critical strain. The glasses eventually break at 26 and 28% for NS and CAS, respectively. Some interesting details resembling the microscopic necking deformation can be observed in CAS at the late stage of fracture. An example is shown in Figure 7, where atomic rearrangement is evident near the crack tip, in response to the strain increase from 26 to 27%.
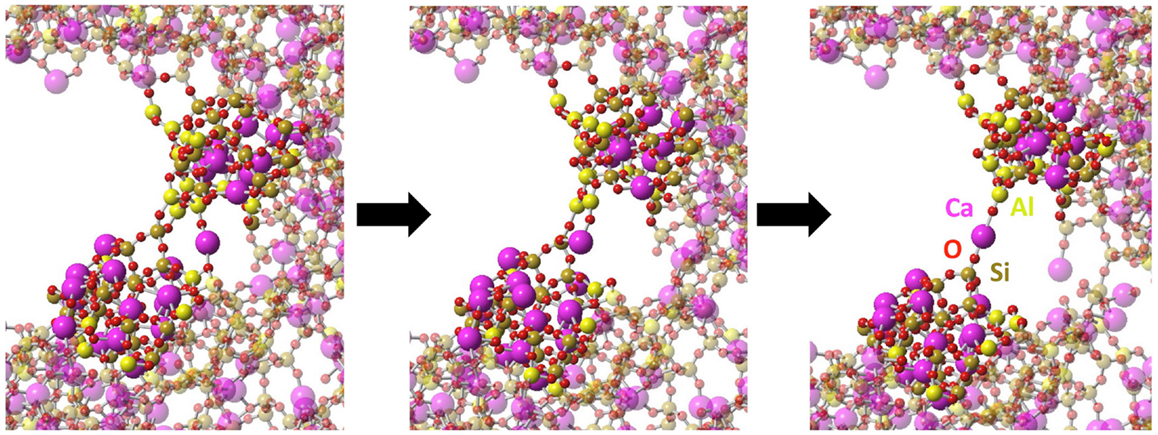
Figure 7. Necking at molecular level observed during the fracture of CAS. The left figure shows the stable structure near the crack tip at 26% strain, the middle shows the structure immediately after the strain is increased to 27%, and the right shows the further equilibrated structure under 27% strain. Atomic types are marked on the last frame.
The ductile behaviors that are observed for NS and CAS require an extra care; indeed, as the crack propagates, irreversible processes, such as plasticity, occur inside a process zone around the crack tip. An estimated length of this plasticity zone rpl can be evaluated using the Dugdale–Barenblatt formula (Dugdale, 1960; Barenblatt, 1962; Lemm, 1962):
where σZ is the plastic yield stress of the material.
At the end of the fracture, the process zones located at both sides of the crack eventually overlap because of the periodic boundary conditions. As suggested in Brochard et al. (2013), this feature can be taken into account by replacing in Eq. 2, the real crack area ΔA∞ by an effective area given by ΔA∞,eff = ΔA∞−Lx rpl/2.
The final values of the fracture energy and toughness, after all the corrections have been made, are reported in Table 1. Although it is known that measured values of fracture toughness are very sensitive to the method used, the preparation of the glass, and the environment (dry or in presence of water), we obtain a remarkably good agreement between computed and experimental data for the three glasses. Note that the CAS glass shows lower fracture energy than that of NS, but a higher fracture toughness, which results from its higher Young’s modulus.
Discussion
Although glasses are typically brittle materials at the macro-scale, there remains some controversy about the existence of ductility at the nanoscale. Hence, as opposed to an ideal brittle fracture model, in which cracks would propagate based on a series of chemical bond rupture events (Lawn et al., 1980), it has been suggested that oxide glasses should show plastic deformations at the vicinity of the crack tip (Celarie et al., 2003), although this is still a matter of debate (Guin and Wiederhorn, 2004; Pezzotti and Leto, 2009). The intrinsic brittleness or ductility of glass appears to strongly depend on the composition and the structure, and has recently been shown to correlate with the Poisson’s ratio (Yuan and Huang, 2014).
Ductility depends on the ability of the material to rearrange its structure through plastic deformation in response to mechanical strain. Such behaviors can be clearly identified in NS and CAS by the residual shear strain after the fracture. Especially for CAS, the atomic rearrangement at the late stage of fracture (shown in Figure 7) resembles remarkably the macroscopic necking deformation for ductile materials. Therefore, our simulation results support the existence of nano-ductility in glasses. We also want to stress that, at the nanoscale, it may not be entirely appropriate to treat multi-component glasses as homogeneous materials, as can be seen from the non-homogeneous response to the strain. This could have significant effect on the fracture behavior and should always be kept in mind.
On the other hand, the composition dependence is also evident in our simulations. In contrast to NS and CAS, pure silica shows rapid fracture propagation and minimal residual strain, indicating a high-level of brittleness. Since the silica network serves as the backbone for the silicate glass structures, its rigidity could be a limiting factor for the scale and degree of ductility. The inclusion of modifiers such as sodium and calcium depolymerizes the silica network, reducing the overall rigidity, and therefore leads to a higher degree of ductility. The presence of additional network formers, such as aluminum, may also have significant effect on the ductility, which may explain the substantially higher ductility of CAS comparing to NS. This, however, warrants more detailed studies, especially as to the role of calcium, since it has been reported that calcium can play a complicated role in glass formation comparing to the alkali modifiers (Petkov et al., 2000). Nonetheless, the simulations here show that the fracture behavior at nanoscale can vary drastically depending on the composition. This, among other factors, may have contributed to the experimental discrepancies regarding the nano-ductility. Experiments on amorphous silica do not find evidence of ductile fracture (Guin and Wiederhorn, 2004; Pezzotti and Leto, 2009), agreeing with our results, whereas some level of ductility is reported for an aluminosilicate glass (Celarie et al., 2003). It can be seen that the compositional dependence of fracture behavior is an important topic that warrants continued attention from the glass research. A fundamental understanding could provide outstanding opportunities for tuning the intrinsic ductility of silicate glasses.
Question still remains how to quantify relative ductility at the atomic scale for glasses. To this end, we calculated the critical energy release rate GC as follows:
where Gel is the elastic contribution to the fracture energy, i.e., arising from the stress accumulated in the linear-elastic regime, and Gdiss captures all forms of dissipated energy linked to irreversible processes and would be equal to 0 for a perfectly brittle material. Gel is evaluated by integrating the stress–strain curves up to the strain at which the maximum stress is obtained. This allows us to quantify the ductility of each by computing a brittleness parameter B = Gel/GC, which is equal to 1 for a perfectly brittle material. The computed values of B are reported in Table 1. We observe that, with such a definition of the brittleness, none of the considered glass is perfectly brittle at the atomic scale. If pure silica is the closest to show an ideal brittleness, NS and CAS clearly show a high ductility. This agrees with the qualitative observations discussed earlier.
Conclusion
A selection of three silicate glasses has been simulated by molecular dynamics in order to evaluate their respective fracture behaviors. While pure silica appears to be highly brittle, both sodium silicate and CAS exhibit significant ductility at the nanoscale. Based on an energetic approach, fracture energy, fracture toughness, and relative brittleness of the three glasses are evaluated. A good agreement is observed between computed values and available experimental data. We believe that the methodology is able to provide realistic trends of fracture toughness and energies, especially with respect to composition, for a given family of glass. This allows the details of such relationships to be further investigated in the future.
Conflict of Interest Statement
The authors declare that the research was conducted in the absence of any commercial or financial relationships that could be construed as a potential conflict of interest.
References
Anderson, T. L. (2005). Fracture Mechanics: Fundamentals and Applications. Boca Raton: CRC Press I LLC.
Barenblatt, G. I. (1962). Advances in applied mechanics. Adv. Appl. Mech. 7, 55–129. doi: 10.1016/S0065-2156(08)70121-2
Bauchy, M. (2012). Structural, vibrational, and thermal properties of densified silicates: insights from molecular dynamics. J. Chem. Phys. 137, 044510. doi:10.1063/1.4738501
Pubmed Abstract | Pubmed Full Text | CrossRef Full Text | Google Scholar
Bauchy, M. (2014). Structural, vibrational, and elastic properties of a calcium aluminosilicate glass from molecular dynamics simulations: the role of the potential. J. Chem. Phys. 141, 024507. doi:10.1063/1.4886421
Pubmed Abstract | Pubmed Full Text | CrossRef Full Text | Google Scholar
Bauchy, M., Guillot, B., Micoulaut, M., and Sator, N. (2013). Viscosity and viscosity anomalies of model silicates and magmas: a numerical investigation. Chem. Geol. 346, 47–56. doi:10.1016/j.chemgeo.2012.08.035
Bauchy, M., and Micoulaut, M. (2011). From pockets to channels: density-controlled diffusion in sodium silicates. Phys. Rev. B 83, 184118. doi:10.1103/PhysRevB.83.184118
Bouhadja, M., Jakse, N., and Pasturel, A. (2013). Structural and dynamic properties of calcium aluminosilicate melts: a molecular dynamics study. J. Chem. Phys. 138, 224510. doi:10.1063/1.4809523
Pubmed Abstract | Pubmed Full Text | CrossRef Full Text | Google Scholar
Brochard, L., Hantal, G., Laubie, H., Ulm, F., and Pellenq, R. (2013). Fracture Mechanisms in Organic-Rich Shales: Role of Kerogen. Reston: American Society of Civil Engineers, 2471–2480.
Celarie, F., Prades, S., Bonamy, D., Ferrero, L., Bouchaud, E., Guillot, C., et al. (2003). Glass breaks like metal, but at the nanometer scale. Phys. Rev. Lett. 90, 075504. doi:10.1103/PhysRevLett.90.075504
Pubmed Abstract | Pubmed Full Text | CrossRef Full Text | Google Scholar
Cormack, A. N., Du, J., and Zeitler, T. R. (2002). Alkali ion migration mechanisms in silicate glasses probed by molecular dynamics simulations. Phys. Chem. Chem. Phys. 4, 3193–3197. doi:10.1039/B201721K
Cormier, L., Ghaleb, D., Neuville, D. R., Delaye, J.-M., and Calas, G. (2003). Chemical dependence of network topology of calcium aluminosilicate glasses: a computer simulation study. J. Non Cryst. Solids 332, 255–270. doi:10.1016/j.jnoncrysol.2003.09.012
Cormier, L., Neuville, D. R., and Calas, G. (2000). Structure and properties of low-silica calcium aluminosilicate glasses. J. Non Cryst. Solids 274, 110–114. doi:10.1016/S0022-3093(00)00209-X
Du, J., and Cormack, A. (2004). The medium range structure of sodium silicate glasses: a molecular dynamics simulation. J. Non Cryst. Solids 349, 66–79. doi:10.1016/j.jnoncrysol.2004.08.264
Du, J., and Corrales, L. R. (2005). First sharp diffraction peak in silicate glasses: structure and scattering length dependence. Phys. Rev. B 72, 092201. doi:10.1103/PhysRevB.72.092201
Dugdale, D. (1960). Yielding of steel sheets containing slits. J. Mech. Phys. Solids 8, 100–104. doi:10.1016/0022-5096(60)90013-2
Eagan, R. J., and Swearekgen, J. C. (1978). Effect of composition on the mechanical properties of aluminosilicate and borosilicate glasses. J. Am. Ceram. Soc. 61, 27–30. doi:10.1111/j.1151-2916.1978.tb09222.x
Ganster, P., Benoit, M., Kob, W., and Delaye, J.-M. (2004). Structural properties of a calcium aluminosilicate glass from molecular-dynamics simulations: a finite size effects study. J. Chem. Phys. 120, 10172–10181. doi:10.1063/1.1724815
Pubmed Abstract | Pubmed Full Text | CrossRef Full Text | Google Scholar
Griffith, A. A. (1921). The phenomena of rupture and flow in solids. Philos. Trans. R. Soc. Lond. A 221, 163–198. doi:10.1098/rsta.1921.0006
Grimley, D. I., Wright, A. C., and Sinclair, R. N. (1990). Neutron scattering from vitreous silica IV. Time-of-flight diffraction. J. Non Cryst. Solids 119, 49–64. doi:10.1016/0022-3093(90)90240-M
Guin, J.-P., and Wiederhorn, S. M. (2004). Fracture of silicate glasses: ductile or brittle? Phys. Rev. Lett. 92, 215502. doi:10.1103/PhysRevLett.92.215502
Pubmed Abstract | Pubmed Full Text | CrossRef Full Text | Google Scholar
Hofmann, D. C., Suh, J.-Y., Wiest, A., Duan, G., Lind, M.-L., Demetriou, M. D., et al. (2008). Designing metallic glass matrix composites with high toughness and tensile ductility. Nature 451, 1085–1089. doi:10.1038/nature06598
Pubmed Abstract | Pubmed Full Text | CrossRef Full Text | Google Scholar
Hoover, W. G. (1985). Canonical dynamics: equilibrium phase-space distributions. Phys. Rev. A 31, 1695–1697. doi:10.1103/PhysRevA.31.1695
Horbach, J., Kob, W., and Binder, K. (2001). Structural and dynamical properties of sodium silicate melts: an investigation by molecular dynamics computer simulation RID F-3155-2010. Chem. Geol. 174, 87–101. doi:10.1016/S0009-2541(00)00309-0
Jakse, N., Bouhadja, M., Kozaily, J., Drewitt, J. W. E., Hennet, L., Neuville, D. R., et al. (2012). Interplay between non-bridging oxygen, triclusters, and fivefold Al coordination in low silica content calcium aluminosilicate melts. Appl. Phys. Lett. 101, 201903. doi:10.1063/1.4766920
Kennedy, C. R., Bradt, R. C., and Rindone, G. E. (1974). “Fracture mechanics of binary sodium silicate glasses,” in Fracture Mechanics of Ceramics, eds. R. C. Bradt, D. P. H. Hasselman, and F. F. Lange (New York: Springer), 883–893. doi:10.1007/978-1-4615-7014-1_29
Kumar, G., Neibecker, P., Liu, Y. H., and Schroers, J. (2013). Critical fictive temperature for plasticity in metallic glasses. Nat. Commun. 4, 1536. doi:10.1038/ncomms2546
Pubmed Abstract | Pubmed Full Text | CrossRef Full Text | Google Scholar
Lawn, B. R., Hockey, B. J., and Wiederhorn, S. M. (1980). Atomically sharp cracks in brittle solids: an electron microscopy study. J. Sci. Mater. 15, 1207–1223. doi:10.1007/BF00551810
Mantisi, B., Tanguy, A., Kermouche, G., and Barthel, E. (2012). Atomistic response of a model silica glass under shear and pressure. Eur. Phys. J. B 85, 1–13. doi:10.1140/epjb/e2012-30317-6
Matsui, M. (1996). Molecular dynamics study of the structures and bulk moduli of crystals in the system CaO-MgO-Al2O3-SiO2. Phys. Chem. Miner. 23, 345–353. doi:10.1007/BF00199500
Mauro, J. C. (2014). Grand challenges in glass science. Glass Sci. 1, 20. doi:10.3389/fmats.2014.00020
Mauro, J. C., and Zanotto, E. D. (2014). Two centuries of glass research: historical trends, current status, and grand challenges for the future. Int. J. Appl. Glass Sci. 5, 313–327. doi:10.1111/ijag.12087
Mirkhalaf, M., Dastjerdi, A. K., and Barthelat, F. (2014). Overcoming the brittleness of glass through bio-inspiration and micro-architecture. Nat. Commun. 5, 3166. doi:10.1038/ncomms4166
Pubmed Abstract | Pubmed Full Text | CrossRef Full Text | Google Scholar
Narayanaswamy, O. S. (1978). Stress and structural relaxation in tempering glass. J. Am. Ceram. Soc. 61, 146–152. doi:10.1111/j.1151-2916.1978.tb09259.x
Pubmed Abstract | Pubmed Full Text | CrossRef Full Text | Google Scholar
Nosé, S. (1984). A molecular dynamics method for simulations in the canonical ensemble. Mol. Phys. 52, 255–268. doi:10.1080/00268978400101201
Pedone, A., Malavasi, G., Cormack, A. N., Segre, U., and Menziani, M. C. (2007). Insight into elastic properties of binary alkali silicate glasses; prediction and interpretation through atomistic simulation techniques. Chem. Mater. 19, 3144–3154. doi:10.1021/cm062619r
Petkov, V., Billinge, S. J. L., Shastri, S. D., and Himmel, B. (2000). Polyhedral units and network connectivity in calcium aluminosilicate glasses from high-energy X-ray Diffraction. Phys. Rev. Lett. 85, 3436–3439. doi:10.1103/PhysRevLett.85.3436
Pubmed Abstract | Pubmed Full Text | CrossRef Full Text | Google Scholar
Pezzotti, G., and Leto, A. (2009). Contribution of spatially and spectrally resolved cathodoluminescence to study crack-tip phenomena in silica glass. Phys. Rev. Lett. 103, 175501. doi:10.1103/PhysRevLett.103.175501
Pubmed Abstract | Pubmed Full Text | CrossRef Full Text | Google Scholar
Plimpton, S. (1995). Fast parallel algorithms for short-range molecular dynamics. J. Comput. Phys. 117, 1–19. doi:10.1006/jcph.1995.1039
Roder, A., Kob, W., and Binder, K. (2001). Structure and dynamics of amorphous silica surfaces. J. Chem. Phys. 114, 7602–7614. doi:10.1063/1.1360257
Shi, Y., Luo, J., Yuan, F., and Huang, L. (2014). Intrinsic ductility of glassy solids. J. Appl. Phys. 115, 043528. doi:10.1063/1.4862959
Vollmayr, K., Kob, W., and Binder, K. (1996). Cooling-rate effects in amorphous silica: a computer-simulation study. Phys. Rev. B 54, 15808–15827. doi:10.1103/PhysRevB.54.15808
Wiederhorn, S. M. (1969). Fracture surface energy of glass. J. Am. Ceram. Soc. 52, 99–105. doi:10.1111/j.1151-2916.1969.tb13350.x
Wondraczek, L., Mauro, J. C., Eckert, J., Kühn, U., Horbach, J., Deubener, J., et al. (2011). Towards ultrastrong glasses. Adv. Mater. Weinheim 23, 4578–4586. doi:10.1002/adma.201102795
Pubmed Abstract | Pubmed Full Text | CrossRef Full Text | Google Scholar
Wright, A. C., Clare, A. G., Bachra, B., Sinclair, R. N., Hannon, A. C., and Vessal, B. (1991). “Neutron diffraction studies of silicate glasses,” in Symposium on the Structural Chemistry of Silicates (Toledo, OH: American Crystallographic Association), 239–254.
Yuan, F., and Huang, L. (2014). Brittle to ductile transition in densified silica glass. Sci. Rep. 4, 5035. doi:10.1038/srep05035
Pubmed Abstract | Pubmed Full Text | CrossRef Full Text | Google Scholar
Keywords: silicate glass, crack propagation, ductility, fracture toughness, fracture energy
Citation: Wang B, Yu Y, Lee YJ and Bauchy M (2015) Intrinsic nano-ductility of glasses: the critical role of composition. Front. Mater. 2:11. doi: 10.3389/fmats.2015.00011
Received: 12 December 2014; Accepted: 29 January 2015;
Published online: 12 February 2015.
Edited by:
Morten M. Smedskjaer, Aalborg University, DenmarkReviewed by:
Xiaoju Guo, Corning Inc., USAMathieu Hubert, CelSian Glass & Solar B.V., Netherlands
Punit Boolchand, University of Cincinnati, USA
Copyright: © 2015 Wang, Yu, Lee and Bauchy. This is an open-access article distributed under the terms of the Creative Commons Attribution License (CC BY). The use, distribution or reproduction in other forums is permitted, provided the original author(s) or licensor are credited and that the original publication in this journal is cited, in accordance with accepted academic practice. No use, distribution or reproduction is permitted which does not comply with these terms.
*Correspondence: Mathieu Bauchy, 5731B Boelter Hall, Department of Civil and Environmental Engineering, University of California Los Angeles, Los Angeles, CA 90095-1593, USA e-mail: bauchy@ucla.edu