Methods for measurement and statistical analysis of the frangibility of strengthened glass
 Zhongzhi Tang
 Yihong Z. Mauro
Christopher Gee
Delena L. J. Duffy
Timothy E. Meyer
Yihong Z. Mauro
Christopher Gee
Delena L. J. Duffy
Timothy E. Meyer
 Matthew B. Abrams
Kimberly A. Walker
Matthew B. Abrams
Kimberly A. Walker  John C. Mauro*
- Science and Technology Division, Corning Incorporated, Corning, NY, USA
Chemically strengthened glass features a surface compression and a balancing central tension (CT) in the interior of the glass. A greater CT is usually associated with a higher level of stored elastic energy in the glass. During a fracture event, release of a greater amount of stored energy can lead to frangibility, i.e., shorter crack branching distances, smaller fragment size, and ejection of small fragments from the glass. In this paper, the frangibility and fragmentation behaviors of a series of chemically strengthened glass samples are studied using two different manual testing methods and an automated tester. Both immediate and delayed fracture events were observed. A statistical method is proposed to determine the probability of frangible fracture for glasses ion exchanged under a specific set of conditions, and analysis is performed to understand the dependence of frangibility probability on sample thickness, CT, and testing method. We also propose a more rigorous set of criteria for qualifying frangibility.
Introduction
With the development of touch technology on personal portable electronic devices, such as smartphones, tablets, and laptops, chemically strengthened glass is widely used as the primary interface between humans and computing devices. Hence, the mechanical reliability of these devices and the associated cover glass is of vital concern (Wondraczek et al., 2011; Tandia et al., 2012a,b; Vargheese et al., 2014). Chemical strengthening of glass is achieved through the ion-exchange process, wherein a compressive stress is developed on the surface of the glass by replacing smaller ions in the glass, such as Li+ or Na+, with larger ions such as K+ (Acloque and Tochon, 1961; Kistler, 1962; Gy, 2008; Karlsson et al., 2010; Varshneya, 2010). This process inevitably installs a central tension (CT) in the glass to satisfy the force balance condition (Bouyne and Gaume, 2002). The release of stored tensile energy plays a key role in controlling the nature of fracture (Zijlstra and Burggraaf, 1968; Tandon and Glass, 2005, 2015), especially in the case of delayed failure, where the initial impact energy does not contribute to the fracture event (Tang et al., 2014). Generally, a larger CT will lead to release of greater tensile energy, and hence, a greater probability for frangible fracture. Frangibility involves shorter crack branching distances, smaller fragments, and larger ejection distances for these fragments. Controlling the frangibility behavior is an important consideration in designing strengthened glass. The desired degree of frangibility depends on the application. For instance, some window panels used in automotive applications are designed to be frangible; there are regulations that require a minimum number of fragments per area for this application (ECE Regulation R43, 2012).
Several previous studies demonstrate correlation of frangibility (i.e., fracture pattern or fragment count) with CT (Bouyne and Gaume, 2002; Tandon and Glass, 2005; Kooi et al., 2008; Lee et al., 2012). However, only a few samples were tested in these studies. Due to the inherent fluctuation of stress installation and process errors, a large variation of frangibility can be observed in nominally identical sets of strengthened glass. In addition, none of the previously mentioned studies has addressed the effect of impact force, which can introduce another source of error. With such variability, a small number of samples are inadequate to perform any statistical analysis. In this article, a total of more than 2000 samples with various thicknesses and ion-exchange conditions were fractured. Different techniques were used to initiate fracture and various criteria were considered during data analysis. The effects of testing methods, fracture timing, fragment count, etc., on determining frangibility are addressed. In concluding this paper, the authors make recommendations on the testing methods and rigorous data analysis methods for quantifying the frangibility of strengthened glass.
Experimental Procedure
Sample Preparation
The glass used in this study is a sodium aluminosilicate glass. Three thicknesses (0.4, 0.7, and 1.0 mm) of glass sheets are cut to 50 mm × 50 mm in size, and strengthened in refined grade KNO3 (Sigma-Aldrich) salt baths for three different durations of time in order to achieve three distinct CT levels for each thickness. The salt bath treatment treats are adjusted depending on the glass thickness but are on the order of several hours. The surface compression stress (CS) and depth of layer (DOL) of the compressive stress are measured using a front surface stress measuring device FSM-6000 (manufactured by Orihara Manufacturing Co., Ltd.). The CT is calculated using the following equation:
where t is the thickness of the sample. It is worth noting that this equation uses a linear approximation of the real stress profile shape, as assumed by the FSM-6000 device. Since the frangible/non-frangible transition range is of the greatest interest for this study, the ion-exchange process is designed to target stress profiles near the CT threshold of frangibility (Allan et al., 2010; Barefoot et al., 2012).
Sample Fracturing
The fracturing of the sample is more difficult than many would expect. One can break a glass by striking with a hammer, but with this technique the resulting fracture pattern would be dominated by the external impact force and not by release of the internally stored elastic tensile energy in the glass. Usually, large impact force will create multiple radial cracks from the impact point and the fracture will follow a “star-burst” pattern, where the number of radial cracks is positively correlated with the impact force (Vandenberghe et al., 2013). In the work of Tandon and Glass (2005), the main difference between the fracture patterns of 450°C–3 h and 450°C–6 h is actually the number of radial cracks, which can be attributed primarily to the increased indentation loads that are required to break samples with longer ion-exchange time. It is important to separate the effect of impact force from the effect of CT. The only straightforward way to do this is to rely on a delayed fracture mechanism where the final Stage III crack propagation is governed by the release of internally stored energy in the glass. To induce a delayed fracture event, a well-controlled flaw is introduced just deep enough to barely penetrate the CT region, i.e., just after the zero crossing point of the stress profile. The flaw initially grows slowly leading to failure in a delayed manner. Such delayed fracture has been thoroughly discussed in our previous paper (Tang et al., 2014). With delayed fracture, the impact energy is dissipated long before the final fracture event; hence, the final fracture pattern will be governed by the release of internally stored tensile energy rather than by the externally applied impact energy. In contrast, when fracture occurs immediately after the external impact event, both impact energy and stored elastic energy are released during fracture, making it difficult to separate the effects of these two sources of energy on the final fragmentation pattern.
In this study, both automated frangibility testing (Tang et al., 2014) and manual testing (Barefoot et al., 2012) methods are used. Also, a modified version of manual testing is employed involving multiple strikes. The purpose of using three testing methods is (a) to demonstrate consistency among different techniques when performing a rigorous statistical analysis of fracture data and (b) to determine the effect of multiple strikes vs. single strikes before fracture.
Automated Frangibility Testing Apparatus
The automated method is described in our previous work (Tang et al., 2014). It has been developed to measure the frangibility and fragmentation pattern of strengthened glass. This method utilizes a gravity-driven drop of a tungsten carbide tip (TOSCO® FISHER #13378) attached to a stainless steel rod to deliver the impact. An air bushing (by New Way Air Bearings) is used to guide the rod to ensure that the impact is orthogonal to the sample surface. The impact force can be adjusted by changing the drop height of the rod. A pneumatic fork is used to lift up the rod instantly after the first strike to prevent double strike. Figure 1 shows the schematic design of the automated frangibility testing device.
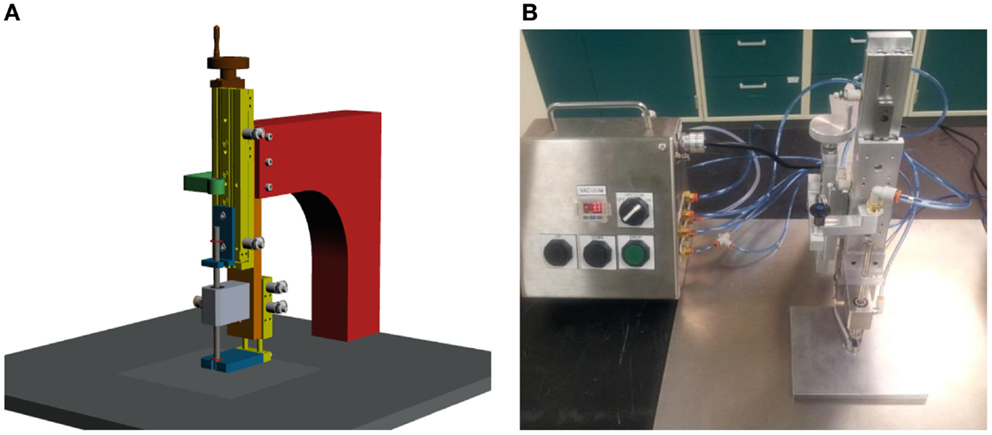
Figure 1. (A) Schematic diagram and (B) photograph of the automated frangibility testing apparatus.
A glass sample (50 mm × 50 mm) is placed on a 100 mm × 100 mm knitted polyester lab wipe, supplied by POLX®. This lab wipe creates a cushion between the sample and the hard surface, thereby increasing the probability of delayed fracture. The operator adjusts the drop height and makes several test strikes on samples until an optimized drop height is achieved. An optimized drop height means that the sample has a high probability of exhibiting delayed fracture (>50% yield), i.e., the drop height must be high enough to penetrate the compressive stress layer of the glass but not so high as to penetrate too deeply into the tensile region. Then, keeping the drop height constant, the operator tests each sample by striking the center of the strengthened glass sample. The operator records whether the sample fails immediately. If immediate failure is not observed, the operator continues to observe the sample for 1 min to see if it exhibits delayed failure. If the sample does not fail after 1 min of waiting, the operator continues striking the sample in 1 min intervals until the sample has failed. After failure, the operator records the following information: number of attempts the operator has made to try to break the sample, whether the sample fails immediately or in a delayed manner, how many fragments were produced, whether there are any fragments ejected outside of a 50 mm radius from the center of the sample.
Manual Single Strike
In the manual single strike method, the operator holds a tungsten carbide scribe (TOSCO® FISHER #13378) as if holding a pen, positions the scribe perpendicular to the sample surface at the center of the sample. The operator strikes the center of the sample using an appropriate force, which leads to a delayed or immediate fracture of the sample, without causing a star-burst pattern. The test procedure for repeating is the same as when using the automated frangibility testing device, and the same data are recorded for each sample.
Manual Multiple Strike
The only difference between manual multiple strike and manual single strike methods is that in the multiple strike method the operator quickly strikes five times on a sample instead of just once for each striking attempts. This is to increase the efficiency of the testing process, since samples are more likely to exhibit delayed fracture with fewer attempts. The effect of existing flaw on the frangibility will also be discussed.
Data Recording
As described in previous sections, there are three different thicknesses, three different ion-exchange conditions, and three different testing methods in this experiment. So, there are 27 different conditions in total. Table 1 shows the raw data of 1 of the 27 different conditions as an example. The chosen condition is 0.7 mm thick glass using the manual multiple strike method detailed above.
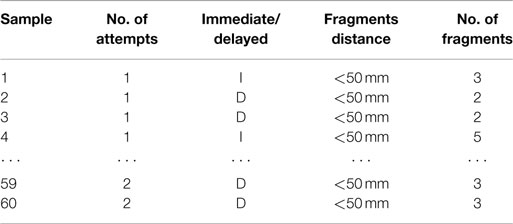
Table 1. Example of collected raw data.
Data Analysis
Criteria for Determining Frangibility
To determine whether a sample is frangible, it is necessary to have a set of criteria, which might be application specific. We begin with the same criteria that has been published previously (Allan et al., 2010; Barefoot et al., 2012), viz., a frangible sample is a specimen sized 50 mm × 50 mm that fractures into at least five fragments, and at least one fragment is ejected outside a radius of 50 mm from the center of the sample. This criterion is referred to as C1. This definition can be simply summarized in Table 2, where n1 is the number of non-frangible (N-F) samples and n2 is the number of frangible samples (F).
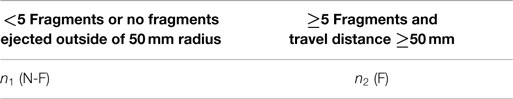
Table 2. Criteria 1 (C1).
There is an obvious problem with including ejection of glass fragments as part of the criteria for frangibility, since that depends strongly on the friction between the glass and the testing surface. Hence, the previously used criteria for frangibility should be modified to exclude any requirements on fragment ejection distances. As indicated in our previous publication (Tang et al., 2014), the true frangibility of a glass is an intrinsic property of the sample. Hence, the criteria C1 are modified to C2, in which the ejection distance requirement is removed (Table 3).
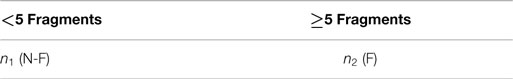
Table 3. Criteria 2 (C2).
However, neither of these sets of criteria account for the possibility of having an artificially large fragment count due to excess applied energy, i.e., they do not distinguish between immediate and delayed failure events. If enough extra energy is applied when impacting the glass, even an unstrengthened sample without any CT may break into many fragments. Hence, if a glass fails immediately upon impact, the externally applied energy may be contributing to the fragmentation pattern. In our case, if a glass fails immediately into ≥5 fragments, the true frangibility is unknown, since it is not known to what degree that final fracture pattern is due to the release of internally stored tensile energy. On the other hand, if a sample fractures immediately into <5 fragments, it is certain to be non-frangible, since excess applied energy can only lead to “false positives” and not false negatives for frangibility. Accounting for this factor, the criteria of frangibility becomes C3, as shown in Table 4, where n1 and n3 cases are both known to be non-frangible, n2 is known to be frangible, and the frangibility of n4 is unknown.

Table 4. Criteria 3 (C3).
Another unknown factor is the possible effect of surface flaws as a result of multiple strike attempts before the glass exhibits failure. Such surface flaws might influence crack branching and lead to a false positive for frangibility. Accounting for this uncertainty, the criterion of frangibility becomes C4, as shown in Table 5. Here, there are two additional unknown cases, n6 and n8, where multiple attempts are required to induce what is an apparently frangible fracture.
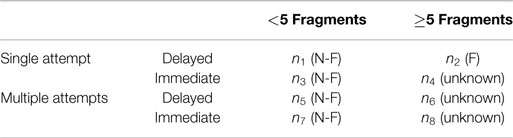
Table 5. Criteria 4 (C4).
Finally, we should consider variation in the threshold for fragment count, since the critical number 5 is a somewhat arbitrary choice. Criteria 5 are similar to Criteria 3, except that the tested samples are grouped into <4 fragments or ≥4 fragments, instead of <5 fragments or ≥5 fragments, as shown in Table 6.
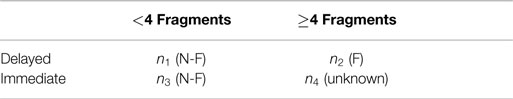
Table 6. Criteria 5 (C5).
Data Process and Statistical Analysis
As described in the previous section, the calculation of frangibility probability for criteria C1 and C2 is quite straightforward. The frangibility probability can be estimated as the proportion of frangible samples:
For C3, C4, and C5, as shown in Tables 3–5, some cases fall into the “unknown” category. In two extreme cases, one might consider the “unknown” samples to be entirely non-frangible (N-F) or entirely frangible (F) such that the frangibility is calculated, for C3 and C5:
For C4:
The above calculation gives a range for the actual frangibility probability, , i.e., . However, depending on the relative fraction of “unknown” samples, this range can be too big to provide any meaningful information. A more sophisticated approach is to partition the “unknown” samples into frangible or non-frangible groups based on Bayes rule (James et al., 2013), where we estimate the posterior frangibility probability for I (Immediate) and D (Delayed) groups as the proportion of frangible samples in each group.
Then, we assume that this probability remains the same across the I and D groups, i.e., for C3 and C5,
For C4:
Therefore, the final frangibility probability estimated for C3 and C5 is:
For C4:
Results
The various criteria (C1–C5) can be used to determine whether or not a sample is frangible. We use the data from the previous section to calculate a frangibility probability for each condition under study. Table 7 shows the calculated frangibility probability based on different criteria (C1–C5) after partitioning “unknown” data using the method described in the previous section.
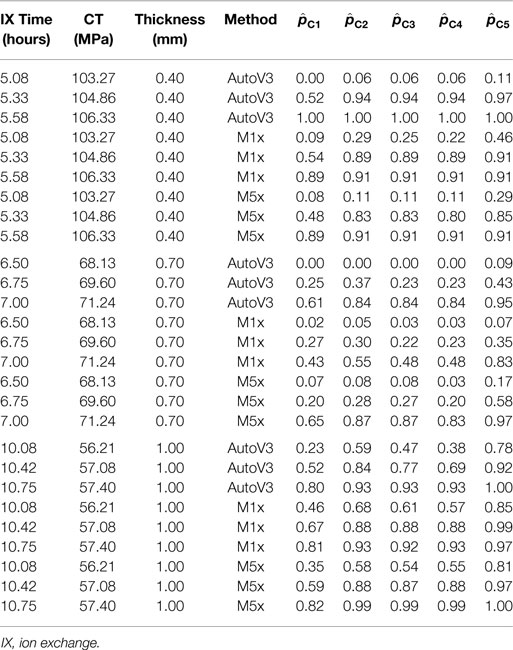
Table 7. Calculated frangibility probability based on various criteria.
Figure 2 shows the scatter plots of the calculated frangibility probability based on different criteria, as a function of CT for each test method used to test glass with a thickness of (a) 0.4 mm, (b) 0.7 mm, and (c) 1.0 mm. From the plot, it can be observed that CT seems to have large impact on frangibility and test method seem to have no obvious impact on frangibility. Moreover, the calculated frangibility probability using different criteria behaves differently.
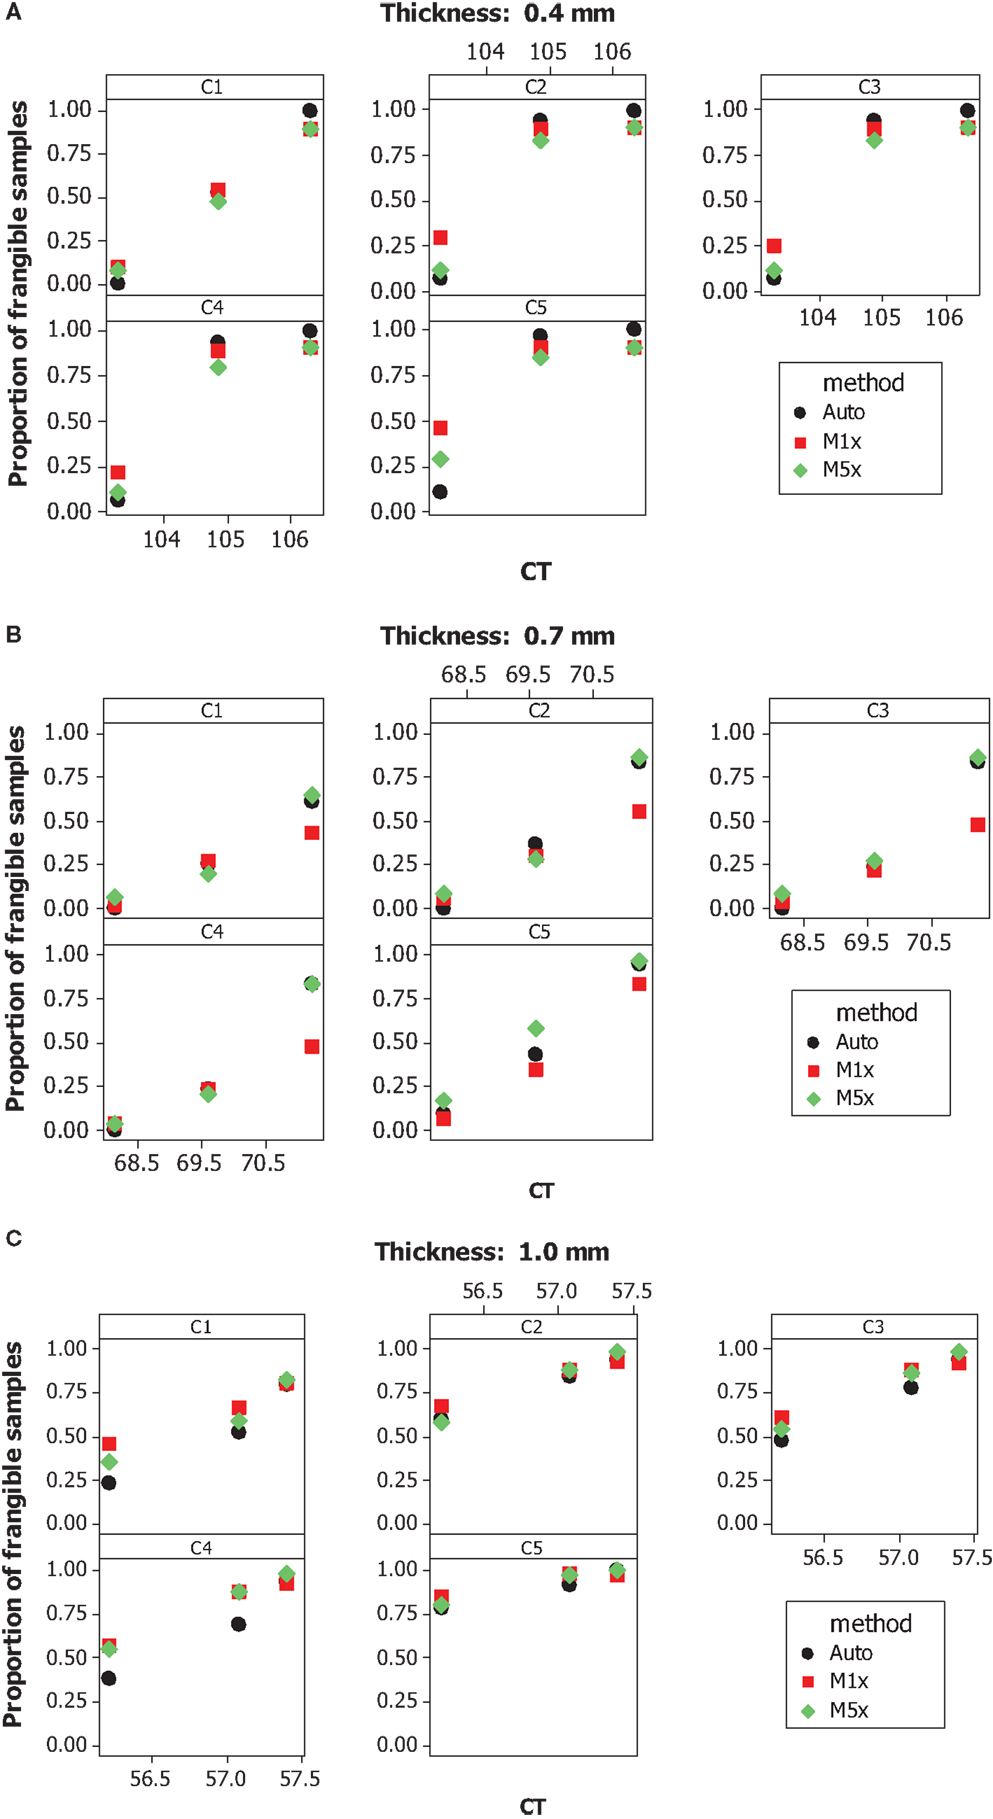
Figure 2. The calculated frangibility probability based on different criteria as a function of central tension (CT) in MPa for various test method on (A) 0.4 mm, (B) 0.7 mm, and (C) 1.0 mm glasses.
Since the calculated frangibility probability is a proportion of frangible samples for each condition and proportion-type data typically do not have a uniform variance pattern, the response variable, i.e., the calculated frangibility probability values (i.e., the response values denoted Y) were transformed using to stabilize the variance (James et al., 2013). Then, the analysis of variance, which is based on a partitioning of total variability in the response variable, was performed to test significance of the predictor variables.
The statistical results in Table 8 present an example of the analysis-of-variance test. In this example, we find that CT has statistically significant impact on the frangibility probability with small p-value of 0.002 (<0.05), while the test method does not have statistically significant impact on the frangibility probability with p-value of 0.222 (>0.05). Here, the p-value or observed significance level of a statistical test is the smallest value of significance level α for which the null hypothesis (H0: βj = 0, βj’s are the regression coefficients) can be rejected. It is the actual risk of committing a Type I error, if H0 is rejected based on the observed values of the test statistic (F statistic). It measures the strength of the evidence against H0. If the p-value is less than or equal to a preassigned α (usually 0.05); then, the null hypothesis can be rejected and you can report that the results are statistically significant at level of α. The p-values smaller than 0.05 are in bold, indicating the statistical significance.
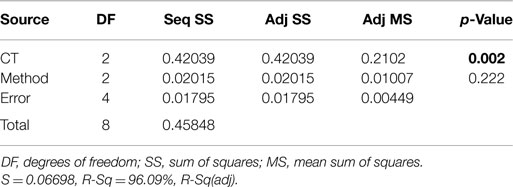
Table 8. An example of analysis-of-variance table for testing the significance of CT and test method.
A similar analysis was performed for glasses with different thicknesses. Table 9 shows the p-values from this analysis. The p-values smaller than 0.05 are in bold, indicating the statistical significance. It can be observed that CT has statistically significant impact on frangibility for all criteria and thicknesses and test method does not have significant impact on frangibility for most criteria and thicknesses.
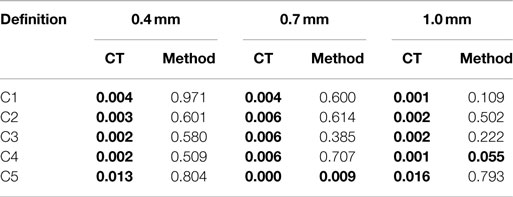
Table 9. The p-values of analysis-of-variance test for glasses with different thicknesses.
Next, the differences of frangibility probability between criteria, i.e., C2–C1, C2–C3, C3–C4, C5–C3, were calculated. Pair t-test can be used to determine whether or not the average of these differences is statistically different from 0, indicated by a small p-value (<0.05). The MINITAB program output in Table 10 presents an example of a pair t-test. In this example, the small p-value <0.001 indicates that C2 is statistically different from C1.
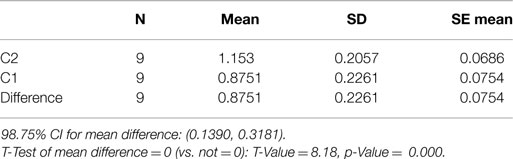
Table 10. An example of pair t-test: C2-C1.
More pair t-tests were performed for glasses with different thicknesses and Table 11 shows the p-values from this analysis. The p-values smaller than 0.05 are in bold, indicating the statistical significance. It can be observed that frangibility based on C2 is statistically different from frangibility based on C1 for all three glass thicknesses, i.e., considering ejection distance or not in the frangibility criteria makes a statistical difference in frangibility. Frangibility based on C2 is statistically different from frangibility based on C3 for all glass thickness of 0.7 and 1 mm, i.e., considering delayed fracture or not in the frangibility criteria makes statistical difference in frangibility. However, frangibility based on C3 is not statistically different from frangibility based on C4, i.e., considering single strike or multiple strikes in the frangibility criteria makes no difference in frangibility. The number of fragments in criteria also has statistically significant impact on frangibility, using threshold of 5 fragments (C3) or 4 fragments (C5) results in statistically different frangibility probability. This will be discussed in greater detail in the following Section.
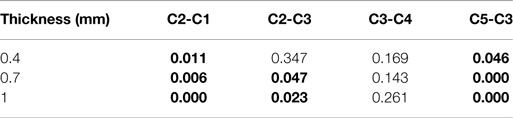
Table 11. The p-values of pair t-test for glasses with different thicknesses.
Discussion
The Effect of Testing Method
From Table 8, we can see that test method does not have significant impact on frangibility for most criteria and thicknesses. This indicates that all three methods are good for assessing the frangibility probability. In this paper, the manual testing is performed by a well-trained technician, who managed to deliver consistent impact force that ensures a yield rate (percentage of delayed fracture to all fracture) of more than 50%. If the manual testing generates too many immediate fractures, it will lead to artificially high-frangibility probability, especially if the frangibility criterion is like C1 and C2, which do not require the fracture to be delayed. Using frangibility criterion like C3, C4, and C5 (require fracture to be delayed) will eliminate the effect of different yield rate generated by different testing methods.
The Effect of Different Criteria
Fragment Travel Distance
It is expected that the change of criteria will change the frangibility probability. The difference between C1 and C2 is the requirement of fragment travel distance. The travel distance not only depends on the energy released in the fracture but also depends on the friction between the fragments and the substance. Without specifying the materials and the finish of the substance, the requirement of fragment travel distance should be removed from the frangibility requirement.
Immediate vs. Delayed Fracture
The difference between C2 and C3 is the requirement of delayed fracture. The importance of using delayed fracture data is discussed several times in this paper and our previous paper (Tang et al., 2014). The statistical analysis presented herein confirms this conclusion.
Number of Impacts
In an ideal condition, one simple impact can create a flaw that is just big enough to allow delayed fracture within a reasonable waiting time for a multiple sample test (~1 min). However, due to the natural stochasticity of flaw introduction, there are always samples that will not break within 1 min after impact. The statistical analysis shows that the existing flaw does not have significant impact on the frangibility probability.
Number of Fragments
The number of fragments generated in a fracture is one of the most important requirements in a frangibility criterion. In an extreme case, one can use 2 as the number of fragments for determining frangibility; however, under such criterion, all samples will be frangible or the frangibility probability is always 1, which does not have any practical meaning. So, picking an appropriate number for the frangibility criteria is important. When varying the number, the frangibility probability also varies. In Figure 3, we use the sample set of “0.4 mm, Auto V3, CT 103.27” as an example to plot the frangibility probability as a function of the number of fragments used in the frangibility criteria (C3 and C5 is also noted in the figure). The threshold is determined mainly after the application of the product and the sample size used in the testing. The criterion used in this paper for C1–C4 is at least five fragments for a 50 mm × 50 mm square sample. This criterion is suitable for a cell phone cover glass because the samples size is comparable to the product size and fragment numbers are somewhat conservative: A non-frangible glass under this criterion is allowed to have one bifurcation event when two cracks are initiated from the center of the glass. Any further crack branching will produce ≥5 fragments that will be categorized as “frangible.”
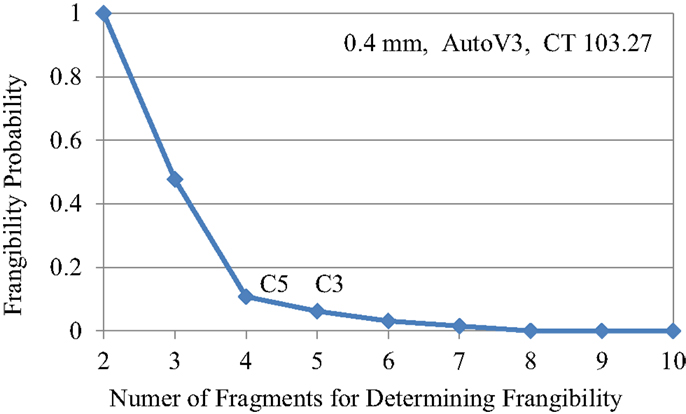
Figure 3. The calculated frangibility probability as a function of number of fragments.
Summary
This paper provides the guidelines for the testing methods and the statistical analysis procedure for assessing frangibility and fragmentations of chemically strengthened glass samples. Three different testing methods were used to test the frangibility and fragmentations of glass samples with different thicknesses and different levels of CT. Statistical analysis suggests that the frangibility probability greatly depends on CT, and that all three methods are equally capable of assessing frangibility probability, especially when the criteria of frangibility includes delayed fracture requirement. However, this experiment does not take into effect of long time consistency. It is expected that the automatic frangibility testing device delivers impacts with better consistency over time compared to the manual testing methods and hence is recommended.
Frangibility probabilities are calculated for various criteria of frangibility. The results show that the travel distance of fragments, fracture timing (Immediate vs. Delayed), and number of fragments have significant impact on the frangibility probability. Hence, they are important factors to take into account when determining the criteria for frangibility. The number of impacts does not have significant effect on the frangibility probability. Hence, it does not need to be considered in the criteria for frangibility. We recommend using Criteria 3: a sample is frangible when at least five fragments are produced in a delayed fracture event. The number of fragments and the size of the sample are subject to change for different applications.
Conflict of Interest Statement
The authors declare that the research was conducted in the absence of any commercial or financial relationships that could be construed as a potential conflict of interest.
Acknowledgments
The authors are grateful for valuable support from J. T. Kohli, A. J. Ellison, D. C. Allan, and J. M. Jacobs of Corning Incorporated.
References
Acloque, P., and Tochon, J. (1961). Measurement of Mechanical Resistance of Glass after Reinforcement. Florence: Colloquium on Mechanical Strength of Glass and Ways of Improving It, 687.
Allan, D. C., Ellison, A. J., and Gomez, S. (2010). Glass with Compressive Surface for Consumer Applications. Patent No. US 0009154A1.
Barefoot, K. L., Price, J. J., Quintal, J. M., and Stewart, R. L. (2012). Strengthened Glass Articles and Methods of Making. Patent No. US 0111057A1.
Bouyne, E., and Gaume, O. (2002). Fragmentation of thin chemically tempered glass plates. Glass Technol. 43C, 300.
ECE Regulation R43. (2012). Available at: http://www.unece.org/fileadmin/DAM/trans/main/wp29/wp29regs/R043r3e.pdf
James, G., Witten, D., Hastie, T., and Tibshirani, R. (2013). An Introduction to Statistical Learning. New York: Springer. doi: 10.1007/978-1-4614-7138-7
Karlsson, S., Jonson, B., and Stålhandske, C. (2010). The technology of chemical glass strengthening – a review. Glass Technol. Eur. J. Glass Sci. Technol. A 51, 41–54.
Kistler, S. S. (1962). Stresses in glass produced by nonuniform exchange of monovalent ions. J. Am. Ceram. Soc. 45, 59. doi:10.1111/j.1151-2916.1962.tb11081.x
Kooi, J. E., Tandon, R., Glass, S. J., and Mecholsky, J. J. Jr. (2008). Analysis of macroscopic crack branching patterns in chemically strengthened glass. J. Mater. Res. 23, 214–225. doi:10.1557/JMR.2008.0020
Lee, H., Cho, S., Yoon, K., and Lee, J. (2012). Glass thickness and fragmentation behavior in stressed glasses. New J. Glass Ceram. 2, 116–121. doi:10.4236/njgc.2012.24020
Tandia, A., Vargheese, K. D., and Mauro, J. C. (2012a). Elasticity of ion stuffing in chemically strengthened glass. J. Non Cryst. Solids 358, 1569. doi:10.1016/j.jnoncrysol.2011.09.034
Tandia, A., Vargheese, K. D., Mauro, J. C., and Varshneya, A. K. (2012b). Atomistic understanding of the network dilation anomaly in ion-exchanged glass. J. Non Cryst. Solids 358, 316. doi:10.1016/j.jnoncrysol.2011.09.034
Tandon, R., and Glass, S. J. (2005). Controlling the fragmentation behavior of stressed glass. Fract. Mech. Ceram. 14, 77. doi:10.1007/978-0-387-28920-5_7
Tandon, R., and Glass, S. J. (2015). Fracture initiation and fragmentation in chemically tempered glass. J. Eur. Ceram. Soc. 35, 285–295. doi:10.1016/j.jeurceramsoc.2014.07.031
Tang, Z., Abrams, M. B., Mauro, J. C., Venkataraman, N., Meyer, T. E., Jacobs, J. M., et al. (2014). Automated apparatus for measuring the frangibility and fragmentation of strengthened glass. Exp. Mech. 54, 903–912. doi:10.1007/s11340-014-9855-5
Vandenberghe, N., Vermorel, R., and Villermaux, E. (2013). Star-shaped crack pattern of broken windows. Phys. Rev. Lett. 110, 174302. doi:10.1103/PhysRevLett.110.174302
Vargheese, K. D., Tandia, A., and Mauro, J. C. (2014). Molecular dynamics simulations of ion-exchanged glass. J. Non Cryst. Solids 403, 107–112. doi:10.1016/j.jnoncrysol.2014.07.025
Varshneya, A. K. (2010). Chemical strengthening of glass: lessons learned and yet to be learned. Int. J. Appl. Glass Sci. 1, 131–142. doi:10.1111/j.2041-1294.2010.00010.x
Wondraczek, L., Mauro, J. C., Eckert, J., Kuhn, U., Horbach, J., Deubener, J., et al. (2011). Towards ultrastrong glasses. Adv. Mater. 23, 4578. doi:10.1002/adma.201102795
Keywords: frangibility, fracture, strengthened glass, statistical analysis
Citation: Tang Z, Mauro YZ, Gee C, Duffy DLJ, Meyer TE, Abrams MB, Walker KA and Mauro JC (2015) Methods for measurement and statistical analysis of the frangibility of strengthened glass. Front. Mater. 2:50. doi: 10.3389/fmats.2015.00050
Received: 24 April 2015; Accepted: 08 June 2015;
Published: 24 June 2015
Edited by:
Ashutosh Goel, Rutgers, The State University of New Jersey, USAReviewed by:
Stefan Karlsson, Linnaeus University, SwedenVincenzo M. Sglavo, University of Trento, Italy
Copyright: © 2015 Tang, Mauro, Gee, Duffy, Meyer, Abrams, Walker and Mauro. This is an open-access article distributed under the terms of the Creative Commons Attribution License (CC BY). The use, distribution or reproduction in other forums is permitted, provided the original author(s) or licensor are credited and that the original publication in this journal is cited, in accordance with accepted academic practice. No use, distribution or reproduction is permitted which does not comply with these terms.
*Correspondence: John C. Mauro, Science and Technology Division, Corning Incorporated, Corning, NY 14831, USA, mauroj@corning.com