Nanoindentation of functionally graded polymer nanocomposites: assessment of the strengthening parameters through experiments and modeling
 Tommaso Nardi
 Chad Hammerquist2
 John A. Nairn
 Yves Leterrier
- 1Laboratoire de Technologie des Composites et Polymères (LTC), École Polytechnique Fédérale de Lausanne (EPFL), Lausanne, Switzerland
- 2Department of Wood Science and Engineering, Oregon State University, Corvallis, OR, USA
- 3Laboratoire de Physique de la Matière Complexe (LPMC), École Polytechnique Fédérale de Lausanne (EPFL), Lausanne, Switzerland
Nanoindentation tests were carried out on the surface of polymer nanocomposites exhibiting either graded or homogeneous distributions of Fe3O4@silica core-shell nanoparticles in a photocurable polymeric matrix. The results reveal a complex interplay between graded morphology, indentation depth, and calculated modulus and hardness values, which was elucidated through numerical simulations. First, it was experimentally shown how for small (1 μm) indentations, large increases in modulus (up to +40%) and hardness (up to +93%) were obtained for graded composites with respect to their homogeneous counterparts, whereas at a larger indentation depth (20 μm), the modulus and hardness of the graded and homogeneous composites did not substantially differ from each other and from those of the pure polymer. Then, through a material point method approach, experimental nanoindentation tests were successfully simulated, confirming the importance of the indentation depth and of the associated plastic zone as key factors for a more accurate design of graded polymer nanocomposites whose mechanical properties are able to fulfill the requirements encountered during operational life.
Introduction
Nanoindentation is a well-established characterization technique widely applied to metallic (Nair et al., 2011), ceramic (Woirgard et al., 1998), and polymeric materials (Chen and Diebels, 2014). Although challenging, the extraction of material properties by this method has been successfully carried out for macroscopically homogeneous samples, such as polycrystalline solids (Dao et al., 2001), amorphous solids (Rodríguez et al., 2012), and even nanocomposite structures (Penumadu et al., 2011; Díez-Pascual et al., 2015). On the contrary, less attention has been paid to the analysis of graded structures. Available studies were devoted to graded metal–polymer films (Nunes and Piedade, 2013) and graded bioactive ceramic coatings (Roop Kumar and Wang, 2002a,b). However, these works lack systematic studies of the effect of the gradient morphology on the obtained properties, when it was made clear that the properties directly reflect the concentration gradients of the constitutive elements (Nardi et al., 2014a). The attractiveness of such materials derives from their intrinsic ability to combine different and apparently incompatible features in a single body, making them appealing candidates for applications, such as coatings for either oxidation (Smeacetto et al., 2002), corrosion (Alegría-Ortega et al., 2012), or abrasion protection (Qureshi et al., 2013). Although a general increment of the mechanical properties (e.g., hardness) is desirable for many applications, a more precise design of the gradient morphology could lead to materials that perform better under loading conditions encountered during their operational life. In other words, the performance of graded structures synthesized via concentration of reinforcing elements in a soft matrix [e.g., nanoparticles (NPs) in a polymer] is strongly affected by the loads to which these materials are subjected, both at their final application stage and during testing (Reshetnyak and Kübarsepp, 1997; Mann and Arya, 2002; Jeong et al., 2003; Sevim and Barlas Eryurek, 2006).
In this work, two graded structures synthesized through the application of an external magnetic field gradient to a suspension of Fe3O4@SiO2-MPS core-shell NPs in a photocurable polymeric matrix (Nardi et al., 2014b) were analyzed by means of nanoindentation, alongside with their two homogeneous counterparts and the pure polymeric matrix. The employment of core-shell NPs was motivated by the possibility to tune the properties of the nanocomposite depending on the characteristics of the shell, while maintaining the magnetic properties typical of the core. In this particular study, silica was chosen as the constituent of the shell for its remarkable hardness [2.8 GPa (Nardi et al., 2014a)] and stiffness [20 GPa (Nardi et al., 2014a)] in order to generate considerable gradients in mechanical properties within the final graded nanocomposite. Silica is also transparent to light contrary to magnetite, enabling photopolymerization of the graded nanocomposite (Nardi et al., 2013). Moreover, the surface of the employed core-shell NPs was functionalized with an appropriate acrylated ligand (3-methacryloyloxy propyltrimethoxysilane, MPS) that had the specific role of reducing the viscosity of the nanosuspension and speed-up the magnetophoretic process, as explained in a previous publication (Nardi et al., 2014a). The key question, which is sketched in Figure 1, is whether there exist an optimal gradient, which maximizes the hardness of the graded composite for a given average particle volume fraction and a given indentation load. Indentations performed on the NP-enriched surfaces revealed how the obtained elastic moduli and hardnesses do not always reflect the local increment of reinforcing elements, but are strongly affected by the indentation depth. Despite the approximations given by the utilized approach (Oliver and Pharr, 1992), experimental results have been successfully reproduced by material point method (MPM) simulations. Unlike previous publications that mostly deal either with the nanoindentation of homogeneous amorphous materials (Rodríguez et al., 2012) or with the effect of the substrate during the tests (Nunes and Piedade, 2013), the present work clarifies the relationship between the mechanical properties obtained by indentation and the morphology of graded polymer composites, constituting a useful tool for a smarter design of functionally graded nanocomposites showing improved performances under the loading conditions of interest.
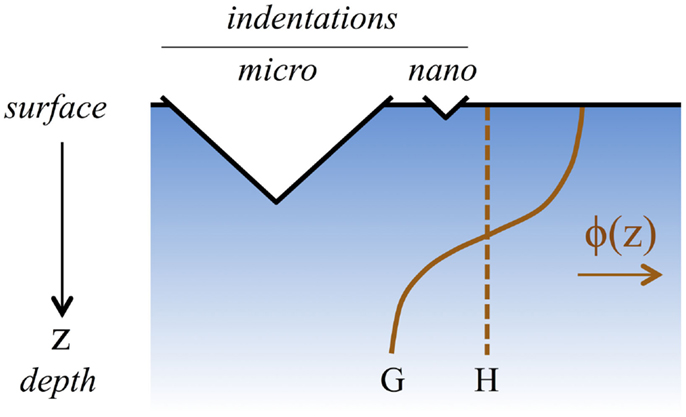
Figure 1. For a given average particle volume fraction ϕ and a given indentation load (micro and nano), which composite (homogeneous particle fraction, H, or graded particle fraction, G) is the hardest?
Experimental
Materials
Iron (III) acetyacetonate (Fe(acac)3, 99+%) and benzyl ether (99%) were purchased from Acros. Oleylamine (Tech.70%), polyoxyethylene(5)non-ylphenyl ether (Igepal CO-520), 3-(Methacryloyloxy)propyltrimethoxysilane (MPS, 98%), ethanol (≥99.5%), and the epoxy embedding medium kit were purchased from Aldrich. Cyclohexane (p.A.) was purchased from Applichem. Ammonia solution (25% min) and tetraethylorthosilicate (TEOS, ≥99%) were purchased from VWR and Merck, respectively. The hyperbranched polyester acrylated oligomer (HBP, commercial name CN2302) was purchased from Sartomer, whereas the photo-initiator (Lucirin TPO) was purchased from BASF.
Synthesis of Fe3O4@SiO2-MPS Nanoparticles
The synthetic procedure for MPS-functionalized Fe3O4@SiO2 NPs has been reported in previous publications (Zhichuan et al., 2009; Nardi et al., 2014b). Briefly, Fe3O4 NPs were synthesized dissolving Fe(acac)3 in a mixture of benzyl ether and oleylamine (Zhichuan et al., 2009). The solution was heated to 260°C and aged at this temperature for 1 h. After that, ethanol was added to precipitate the nanocrystals, which were then separated by centrifugation and dispersed in cyclohexane. In a typical synthesis of Fe3O4@SiO2-MPS NPs, the dispersion of oleylamine-coated Fe3O4 NPs in cyclohexane was added to cyclohexane and mixed with Igepal CO-520. The pH was adjusted to 10 through the addition of ammonium hydroxide and the formation of a transparent brown microemulsion was ensured with the aid of a sonicator. Then, TEOS was added and the reaction was stirred at room temperature for 24 h, when the desired amount of MPS was also added. Hence, the reaction was continued for 24 additional hours.
Preparation of Nanocomposites for Indentation
As described earlier (Nardi et al., 2013), the photo-initiator was first dissolved in the HBP in a 6 wt% fraction and subsequently the selected amount of MPS-functionalized Fe3O4@SiO2 core-shell NPs was added. A certain amount of as-prepared nanocomposites was placed between two UV-transparent polystyrene sheets (16 mm × 16 mm × 0.3 mm, made by hot pressing polystyrene beads) kept at a distance of 150 μm by two plastic spacers (16 mm × 3 mm × 0.15 mm), which ensured a constant thickness of the final polymer composite films. Graded composites were synthesized placing the 150 μm thick nanoparticulate films containing 1 or 8 vol% of homogeneously distributed Fe3O4@SiO2-MPS NPs under the effect of the magnetic field gradient generated by two magnets in repulsion configuration (i.e., with the magnetizations opposing each other) (Nardi et al., 2014a). The polymerization process was then performed on the homogeneous and graded samples irradiating them from both sides using two identical 200 W high-pressure mercury UV lamps (OmniCure 2000, Exfo, Canada). Using a calibrated radiometer (Silver Line, CON-TROL-CURE, Germany), the measured UV-A light intensity on the sample surface ensured by each lamp was around 190 mW⋅cm−2. The films were then detached from the two polystyrene sheets with a razor blade and glued to a metallic support that fit the sampling slots of the nanoindenter.
Methods
The morphology of the silica-coated magnetic NPs was characterized using a Philips FEI CM12 microscope at an accelerating voltage of 120 kV. Typically, few drops of a diluted suspension of the NPs in ethanol were deposited on carbon filmed copper grids (200 mesh, Plano GmbH). The concentration gradient was investigated analyzing the Si content (i.e., from the SiO2 shell of the particles) on cross-sections of composite coatings by energy-dispersive X-ray spectroscopy in a scanning electron microscope (FEI XLF-30 FEG) at an accelerating voltage of 13 kV and constant working distance of 11 mm and spot size of 4. The elemental composition of the samples throughout the 150 μm thickness of the coating was obtained by data averaging over a 120 μm wide window.
Quasi-static tensile tests were performed on the pure HBP matrix and on the nanocomposites, after curing, using a Linkam TST 350 tensile testing machine at a temperature of 24 ± 0.1°C and at a constant tensile strain rate of 3.3 10−4 s−1. The yield stress was determined from the intersect between the tangents to the stress–strain curves at zero strain and at failure.
Nanoindentation measurements were performed on the particle-enriched surfaces of the samples using a Nano Indenter XP™(MTS Nano Instruments) with a three-sided diamond Berkovich indenter. For all tests, the indenter tip approached the surface from a distance of 1000 nm at a rate of 10 nm/s, and the maximum penetration depth into the sample was set either to 1 or 20 μm. The possible influence of the metallic substrate was disregarded since the maximum indentation depth of 20 μm was only 13% of the coating thickness of 150 μm. A minimum of five indentations were performed on each type of material. Hardness and Young’s modulus were determined from the unloading part of the test using the Oliver and Pharr’s analysis method (Oliver and Pharr, 1992).
The numerical modeling was done using the MPM. This particle-based method has advantages dealing with large deformations (Sulsky et al., 1994) that might occur under the indenter top. Furthermore, MPM works well for problems with contact that were needed here for modeling contact forces between the tip and the films (Bardenhagen et al., 2001; Lemiale et al., 2010; Nairn, 2013). Figure 2 shows the geometry for an axisymmetric model of the nanoindentation experiment. Both axisymmetric (with a conical indenter, Figure 2B) and 3D (with a Berkovich, three-side pyramidal indenter, Figure 2C) simulations were performed, revealing sufficiently close results. Being faster and having the possibility to be run at higher resolution, focus was hence laid on axisymmetric simulations. For the best analogy between axisymmetric and 3D, an effective cone angle was determined by equating contact area as a function of depth between conical and Berkovich indenters. For a Berkovich indenter with θb = 65.3° tip angle, the equivalent cone has a tip half-angle of θc = 70.2°(Oliver and Pharr, 1992).
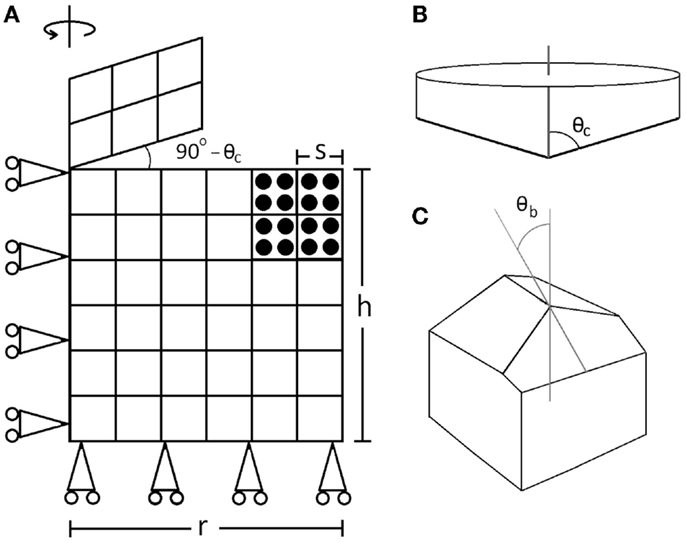
Figure 2. (A) Schematic view of the axisymmetric MPM model. The bulk object has background grid of regular cells with four particles per cell. (B) A conical indenter. (C) Tip of a Berkovich indenter.
The indenter was modeled as a rigid material that moved at constant velocity up to a specified displacement (or force) and then retracted at the same speed. The material points in the tip of the indenter were placed on the grid to match the surface of the indenter (see Figure 2A). The bulk material was modeled as a large-deformation neo-Hookean solid with elastic properties E and ν, that plastically deforms by non-linear hardening implemented by J2 plasticity with hardening law (Aimene and Nairn, 2015):
where σy0 is initial yield stress, ε is the strain and K and n are dimensionless hardening parameters. For modeling of gradient films, all properties were adjusted as a function of depth to represent homogenized properties for filled polymer given the filler concentration as a function of depth. The determination of material properties is discussed in the modeling results section. The first tasks were to select size of the modeled region (r and h in Figure 2A), determine required particle resolution, and choose the indenter speed. The experimental film was 150 μm thick, but to save analysis time, some modeling was restricted to a smaller region around the indenter tip. We varied r and h until we found dimensions such that the results were insensitive to model size (r = h = 50 μm for the 1 μm indents and r = h = 150 μm for the 20 μm indents). In MPM, the particles are placed on a background grid of regular cells using four particles per cell (see Figure 2A). Because MPM contact calculations are done on the grid, the size of the grid cells can affect those calculations. The loading portion of the indentation curves in Figure 3 for a 900 nm indentation shows results at two different resolutions. At low resolutions (1 μm cells), the curves showed periodic ridges corresponding to grid dimension. These ridges were significantly reduced at higher resolutions (0.15 μm cells). All 1 μm indentation calculations used this higher resolution, which corresponded to 75 nm diameter material points. Because of the larger total displacement for 20 μm indentations, the cell size could be larger; for these simulations, we used 2 μm cells corresponding to 1 μm material points. The indenter speed was set to minimize inertial effects such that we could run simulations without needing artificial damping. The unloading curves in Figure 3 show results at two different speeds. At high speed (10 m/s), the reversal of load after reaching maximum displacement acted as an impact event causing an abrupt jump in the results. At low loading rates (1 m/s), the results showed only very small inertial effects. Thus, all simulations were performed at 1 m/s. Although this speed is much higher than actual experiments, the material model used had no time dependence. In other words, elimination of inertial effects implies that the results when using a rate-independent material model are equivalent to quasi-static loading.
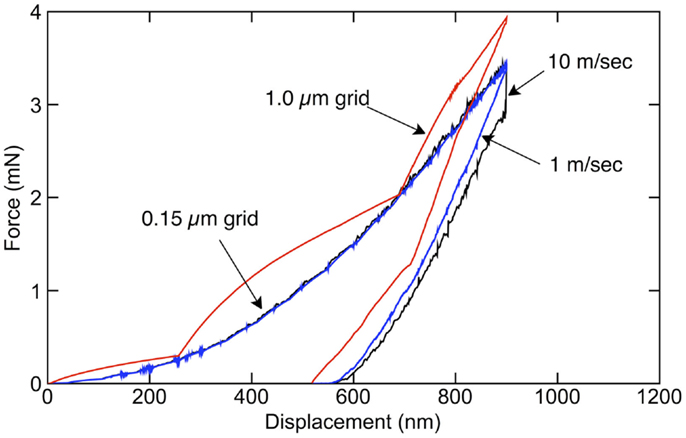
Figure 3. Simulated nanoindentation curves for force as a function of indentation depth showing the effects of MPM resolution and of indenter loading rate.
The output of the simulation was given as total force on the indenter, calculated in the contact algorithm, as a function of time (or depth). On each time step, the multimaterial MPM algorithm separately updates position of the rigid particles and both momentum and position of the bulk material (Bardenhagen et al., 2001). Moreover, for any nodes containing information from both types of materials, the contact methods change the momentum of the bulk material to be consistent with position of the rigid particles (Lemiale et al., 2010; Nairn, 2013). Although various contact laws can be implanted, in this work all simulations used frictionless contact. Contact force was derived by the imposed change in momentum (per unit time) and the total force of the indenter on the object was obtained by summing these forces over all nodes. Using the constant loading and unloading rates, the original force vs. time output could be converted into a force vs. displacement output. Modulus and hardness were then determined from the simulated force vs. displacement curves by the same nanoindentation methods described in Oliver and Pharr (1992) to treat experimental results.
Results and Discussion
Tensile Behavior of Homogeneous Nanocomposites
Figure 4 shows the tensile behavior of the HBP and the homogeneous composites with 1 and 8 vol% of particles. The polymer was rather ductile with a yield stress equal to 26 MPa and a strain at failure of 9%. The addition of 1 vol% of particles slightly increased the yield stress to 28 MPa and the composite failed at 6% strain. The composite with 8%vol of particles was brittle with a stress and strain at break of 22 MPa and 1.5%, respectively. The increase in stress after yielding could be fit well using the hardening law in Eq. 1.
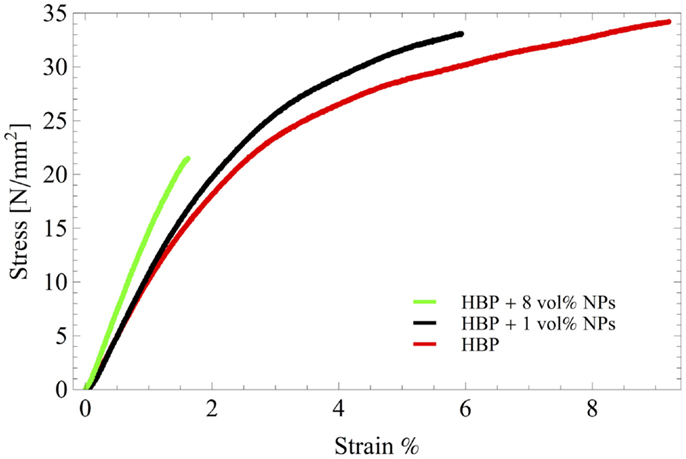
Figure 4. Tensile behavior of the HBP and the homogeneous composites with 1 and 8 vol% of particles.
Graded Nanocomposite Morphology
TEM analysis on MPS-functionalized Fe3O4@SiO2 core-shell NPs shown in Figure 5 evidenced a log-normal particle size distribution with a mean diameter of 23.7 nm and SD 6.2 nm. Experimental and numerical nanoindentation tests were performed on the pure HBP, on the homogeneous composites containing 1 and 8 vol% Fe3O4@SiO2-MPS NPs, and on the graded structures synthesized through the application of an external magnetic field gradient on the above-mentioned homogeneous particulate suspensions (Nardi et al., 2014a). The NP distribution of the four analyzed nanocomposite materials was determined from the cross-sectional SEM–EDX analysis of the composite coatings showing the Si content (from the SiO2 shell) of the analyzed materials. The results shown in Figure 6 are compared with the indentation depths, represented by the red (1 μm) and the blue (20 μm) lines, and demonstrate the good dispersion of the NPs in the polymeric matrix. Notice that the lines for the average particle concentrations are not exactly at 1 and 8 vol% and these slight variations correspond to the experimental average distribution of a finite volume element of the samples, deduced from the SEM–EDX analysis.
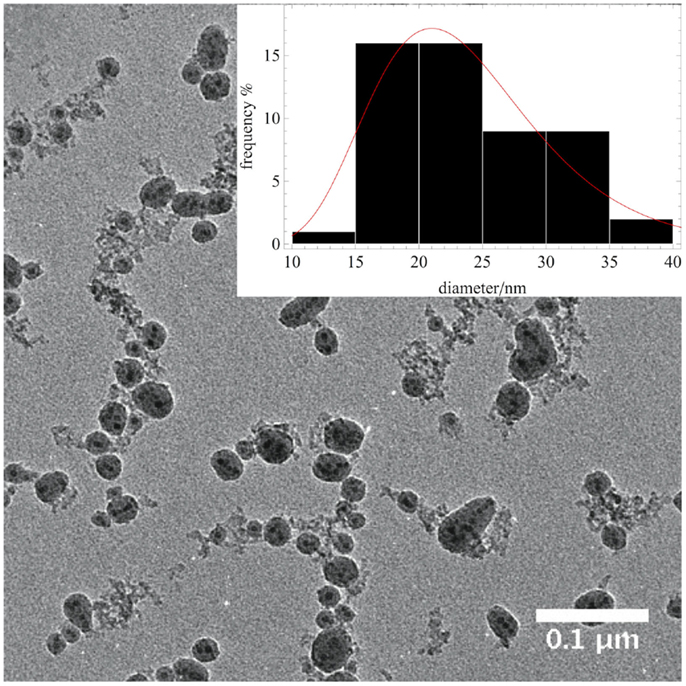
Figure 5. TEM micrograph of Fe3O4@SiO2-MPS core-shell nanoparticles with the corresponding particle size distribution.
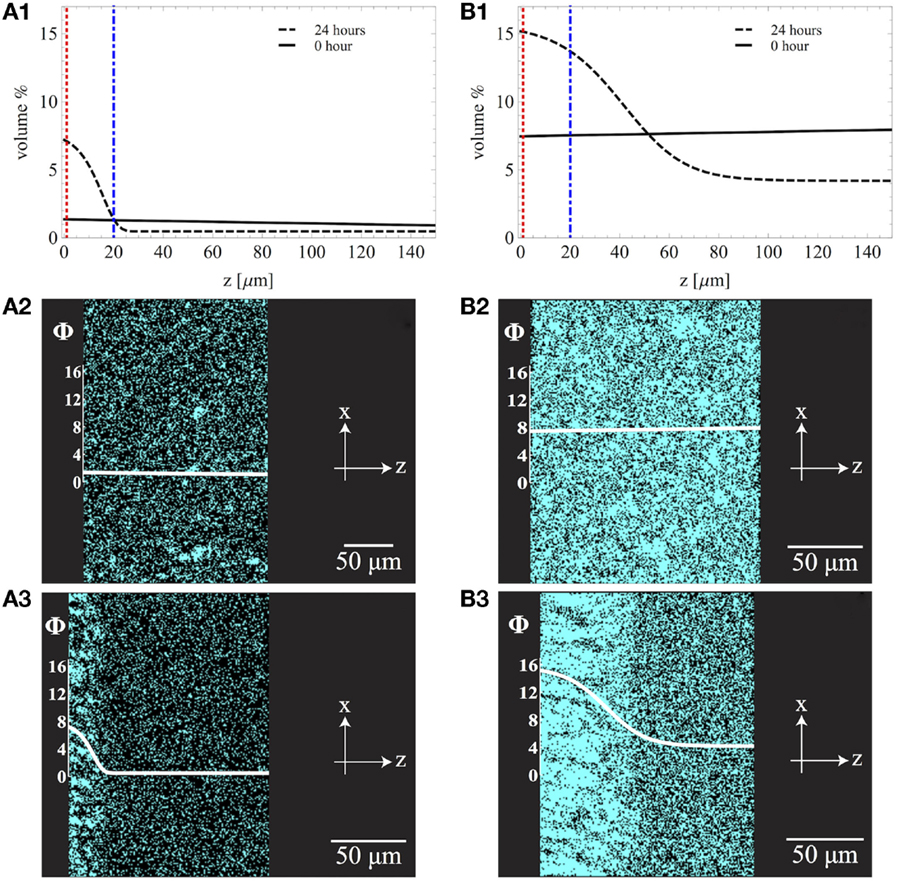
Figure 6. Nanoparticle volume fraction as a function of the position z along the thickness of the film for nanocomposites with average particle concentrations of 1 vol% (A1) and 8 vol% (B1). For both nanocomposite systems, the homogeneous case (“0 h”) and the gradient morphology after 24 h of magnetic field application are shown. The two vertical lines represent the two nanoindentation depths (1 and 20 μm) examined in this study. The corresponding cross-sectional SEM–EDX spectral images showing the Si content are also reported for the nanocomposite containing 1 vol% of nanoparticles (A2,A3) and 8 vol% of nanoparticles (B2,B3).
Numerical Modeling
This section describes numerical modeling results for the properties of gradient films. First, the parameters E, σy0, K, and n (see Eq. 1) were determined from homogeneous control films at constant NP fraction. Although the tensile behavior of the films (Figure 4) was accurately fitted by Eq. 1, the derived properties did not correspond well with those found from the nanoindentation experiments. Our hypothesis was that the effective properties under the indenter tip are different than those from thin-film tests. Hence, the following approach made use of Eq. 1, but determined the parameters by fits to nanoindentation experiments for three different particle volume fractions – 0, 1, and 8%. The fitting process used a derivative-free optimization algorithm provided by optim function in the R software package in order to minimize the sum-squared cost function between load curves of the experiments and the simulations. Optimization was performed over elasticity E, strain hardening exponent n, plastic modulus K, and yield stress σy0. Due to the high-colinearity between plasticity parameters, the yield stress was fixed to σy0 = 20 MPa and the optimization process was performed over E, n, and K. The fitting results by particle volume fraction Vf are given in Table 1. Because of possible indenter effects on effective properties, Table 1 includes fitting results derived separately from 1 to 20 μm nanoindentation experiments on homogeneous films. A sample comparison between 1 and 20 μm depth experiments and nanoindentation modeling for the homogeneous 8 vol% composite is given in Figure 7. It is evident that the experiments were stable with smooth increase of the force during loading, whereas the simulations appeared to be noisy because they were reaction forces at contact points from an explicit, dynamic code. The steps and “noise” at 1 μm were due to use of contact physics to get force and relation between total depth of penetration and the background grid. Both greatly reduce at the deeper depth of penetration. Such “noise” in numerical results can be removed by damping, be we preferred to avoid dealing with damping terms. The jumps in simulation curves are tied to resolution and particles crossing between elements (see Figure 3 for larger effects).
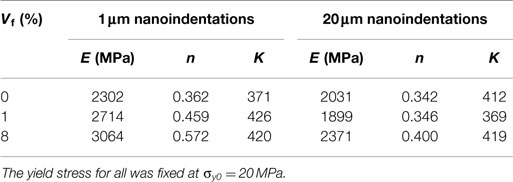
Table 1. Homogenized properties of the film as determined by fitting nanoindentation simulations to experimental results as a function of filler content and depth of nanoindentation.
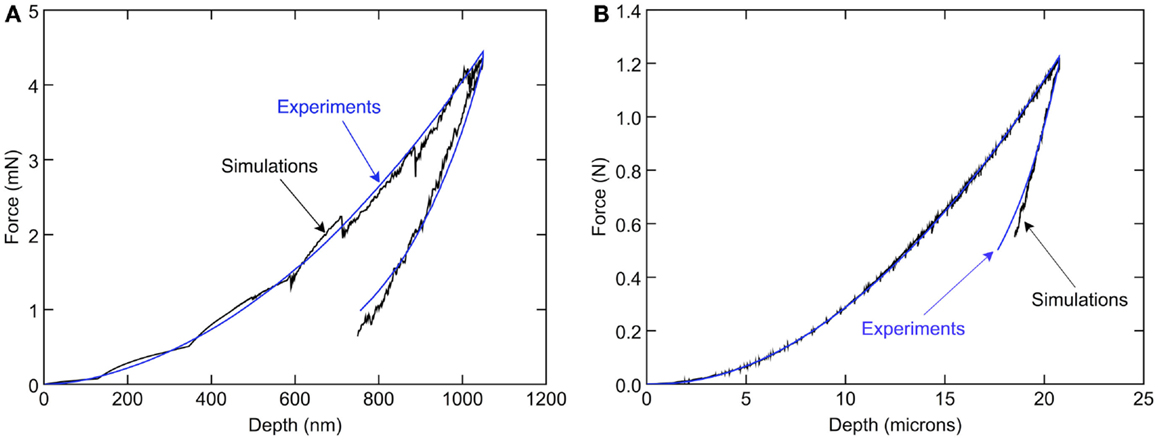
Figure 7. Comparison of simulated nanoindentation to experimental results for 8 vol% homogeneous control films and indentation depth of 1 μm (A) and 20 μm (B) using properties in Table 1.
To model gradient composites, the vertical axis of the film was divided into 40 layers, each 1.25 μm thick. For each layer, the volume percent of filler particles was determined from experimental measurements shown in Figure 6. To determine material properties as a function of filler content, the fitting parameters in Table 1 were linearly extrapolated to local filler content (i.e., each property was set to a Vf + b, where a and b were determined from properties in Table 1). In multimaterial MPM, each material uses its own velocity field (Bardenhagen et al., 2001), but for our purpose only contact between the indenter and all other materials combined was needed. As a refinement to standard MPM, all materials in the bulk film were set to share the same velocity field. In this way, the film acts as a bulk continuum, albeit with position-dependent properties, while the indenter interacts with that bulk by contact mechanics.
Experimental and Numerical Properties
Figure 8 compares the experimental and numerical modulus and hardness values for the HBP and the homogeneous and graded composites. The fitting procedure described in the previous section for the properties of the pure HBP led to an excellent match between experimental and modeled data, with modulus comprised between 2.2 and 2.5 GPa and hardness between 0.14 and 0.15 GPa.
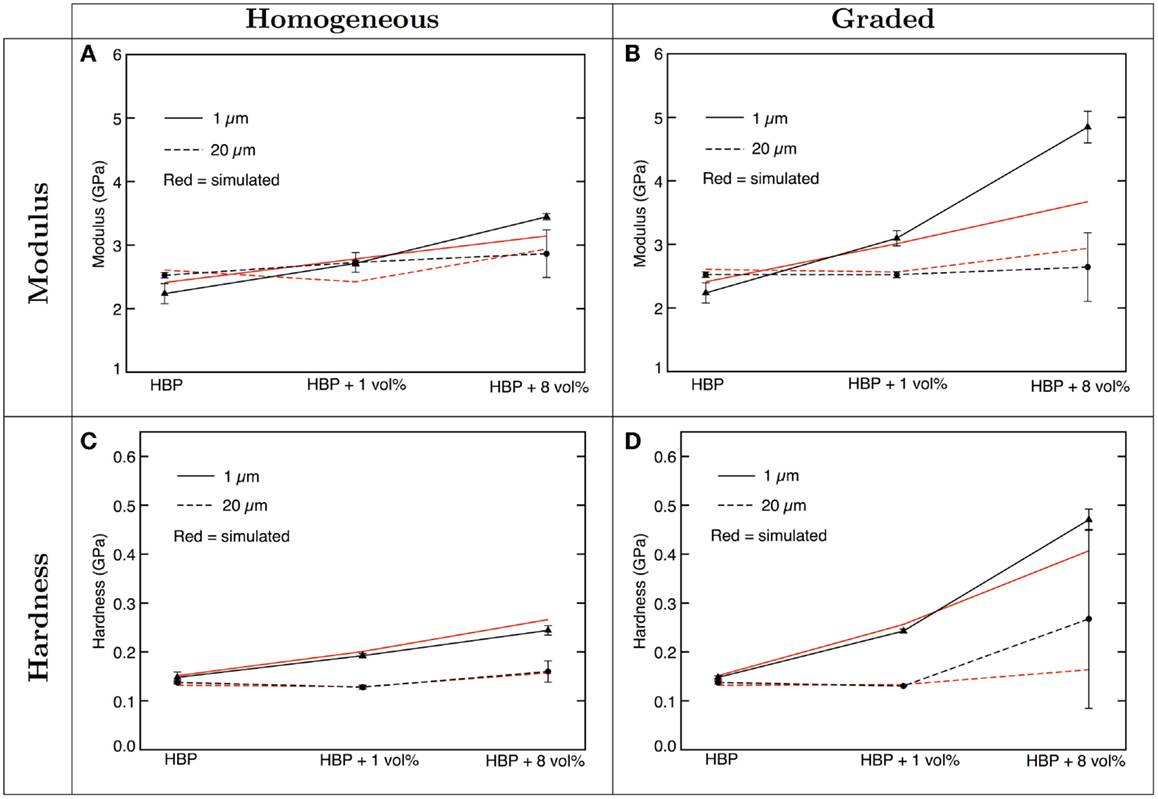
Figure 8. Modulus (A,B) and hardness (C,D) derived by the unloading part of the load-displacement curves for experimental (black) and numerical (red) tests. The results for the homogeneous (A,C) and graded (B,D) materials are shown as a function of the nanoparticle content for 1 μm (solid lines) and 20 μm (dotted lines) indentation depths.
For the homogeneous composites (Figures 8A,C), the modulus derived from the unloading part of the load–displacement curves was substantially independent of the indentation depth, and equal to ~2.7 GPa (1 vol%) and around 3 GPa (8 vol%). Comparable increments in modulus with increasing NP content were indeed measured at both indentations depths, for both experimental and numerical tests. Experimental hardness values, successfully reproduced by numerical simulations, were higher when the indentation depth was kept at 1 μm (0.24 GPa) rather than 20 μm (0.16 GPa). Similar increases were reported for aluminum and titanium, which was attributed to surface hardening, whereas the hardness of fragile materials, such as quartz and glass, were found to be independent of indentation load (Oliver and Pharr, 1992). The plastic energy fields for the 1 and 20 μm indentations in HBP graded composites with 8 vol% of particles were considerably different, as shown in Figure 9. The present finding reflects the intrinsic softening effect arising from correspondingly large deformations (Figure 4) (Lam and Chong, 1999) and specific strain gradients associated with the Berkovich geometry (Alisafaei et al., 2014), rather than an indentation size effect, which usually manifests itself for shallow, sub-micron penetration depths (Pharr et al., 2010). The observed hardness increases at small indentation depth, however, were negligible compared to the considerable variations in mechanical properties encountered for graded composites, especially when indented at different depths.
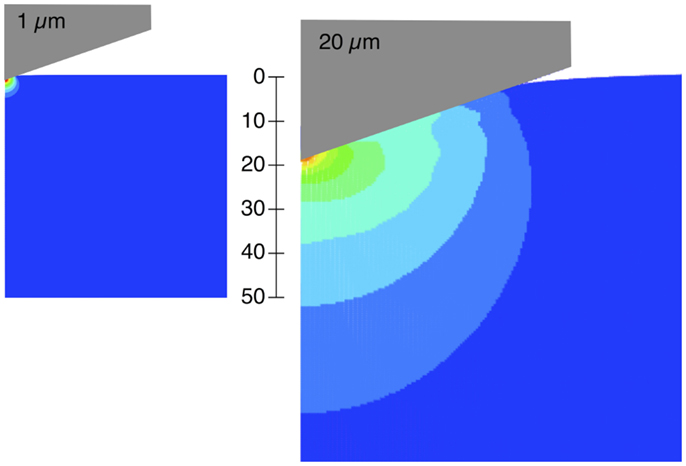
Figure 9. Plastic energy fields for 1 and 20 μm indentations in HBP with 8 vol% filler and graded composition. The plastic energy ranges from 0 (blue) to 3 kJ/m3 (red).
Indeed, for the graded composite containing 1 vol% of NPs and for 1 μm indentations, the modulus and hardness increased by as much as 14 and 27%, respectively, compared with its homogeneous analog, whereas for 20 μm indentations, these two properties were equal to those of the pure HBP within experimental scatter (Figures 8A,B). Notice that, in this case, the indentation depth was comparable with the size of the gradient (Figure 6). A similar response was obtained for the graded composite with 8 vol% of NPs, with rather small increases for 20 μm indentations, but very large increases for 1 μm indentations, as high as 40% for the modulus and 93% for the hardness compared with the homogeneous composite. These latter results are interesting: for a 1 μm indentation on the graded composite, the plastic zone extended to ~5 μm below the indenter tip (Figure 9), which hence only probed the material with about 15 vol% particles (Figure 6B1). By contrast, for a 20 μm indentation the plastic zone extended more than 60 μm below the surface, hence far beyond the gradient area. Therefore, the properties at this level of indentation would be some average of the homogeneous material properties over the particle concentration range of 5–15 vol%.
Clearly, already at 1 vol% of NPs, smaller indentation depths led to both stiffening, going from 2.52 GPa at 20 μm to 3.10 GPa at 1 μm, and hardening, going from 0.13 GPa at 20 μm to 0.24 GPa at 1 μm. At 8 vol% of NPs, this effect became even larger, producing variations on the order of 83% (4.84 vs. 2.64 GPa) and 81% (0.47 vs. 0.26 GPa) in terms of modulus and hardness, respectively. Simulations run on the same graded structures evidenced similar trends at the two different indentation depths. Considerable increments in both modulus (3.67 vs. 2.64 GPa) and hardness (0.41 vs. 0.16 GPa) were indeed obtained when films filled with 8 vol% NPs were indented at 1 μm rather than 20 μm (Figures 8B,D). Moreover, one should point out the very high hardness values of the graded nanocomposites under 1 μm indentations, which were close to 500 MPa.
In light of the good agreement between experiments and simulations (Figure 8), virtual experiments on films with different gradients but with a total NP content of 8 vol% were performed. Figure 10 shows the four investigated morphologies together with the Boltzmann sigmoidal function utilized to represent them. For the graded structures, the parameters of the sigmoidal function were adjusted to either fit experimentally developed gradients (“Grade 1”), or to generate hypothetical graded morphologies (“Grade 2,” “Grade 3”) with higher superficial NP volume fractions but with a constant global NP content. From a qualitative standpoint, an indentation performed on the blue gradient with a depth of 20 μm would almost entirely penetrate the part of the material with enhanced filler content, and the associated plastic zone would affect a large amount of unfilled polymer.
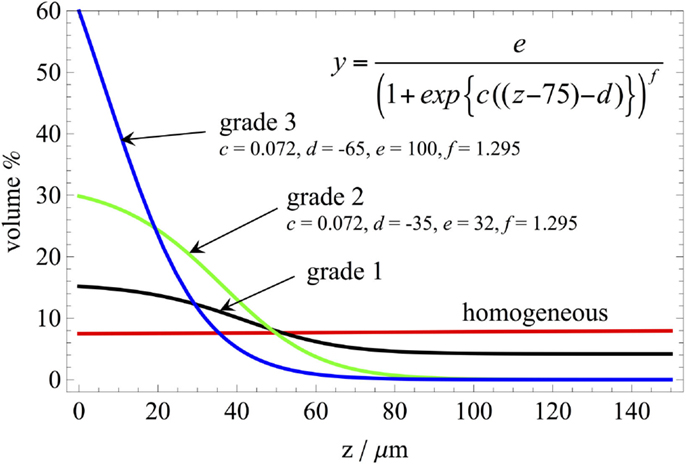
Figure 10. Homogeneous and graded morphologies with average nanoparticle volume fraction of 8%. “Grade 1” is the experimental gradient already shown in Figure 5, whereas “Grade 2” and “Grade 3” were created for numerical simulation purposes using the equation and parameters shown in the figure. “Grade 2” goes from a minimum particle fraction of 0 at depths z > 100 μm to a maximum particle fraction of 30% on the surface (z = 0). “Grade 3” goes from a minimum particle fraction of 0 at depths z > 80 μm to a maximum particle fraction of 60% on the surface (z = 0), close to the random packing fraction for monodispersed spheres of ~64% (Desmond and Weeks, 2009).
We ran nanoindentation simulations for all four gradients for both 1 and 20 μm indentation depths. When we extrapolated the 1 μm mechanical properties from Table 1 to 60 vol% on the surface for the blue Grade 3, it gave plasticity properties that were likely unrealistic (e.g., hardening power law n > 1). The properties from 20 μm experiments, however, gave more reasonable extrapolations. We therefore ran all these virtual experiments using extrapolated 20 μm properties from Table 1. The results are in Figure 11. Note that the results at 1 μm depth in Figure 11 differ from corresponding results in Figure 8 because of the use of different mechanical properties.
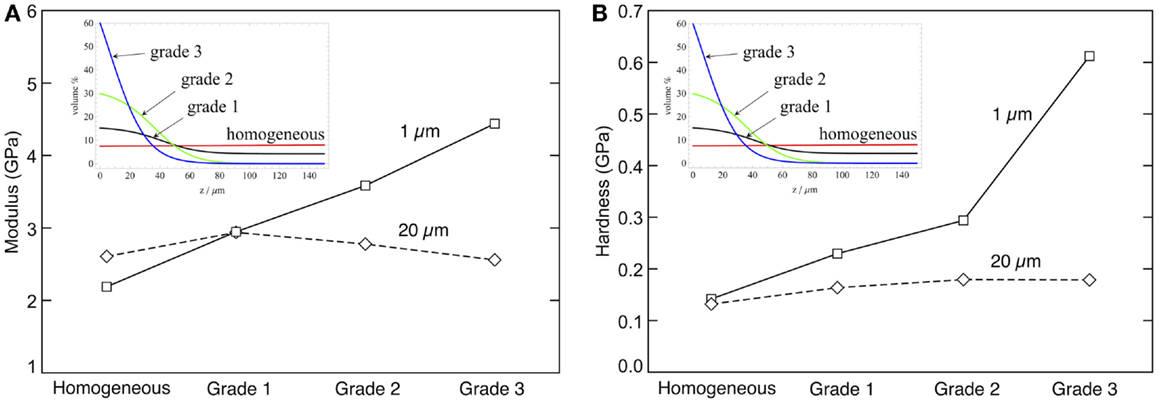
Figure 11. Simulated nanoindentation experiments for modulus (A) and hardness (B) at both 1 and 20 μm indentation depths. The “Homogeneous,” “Grade 1,” “Grade 2,” and “Grade 3” refer to the black, red, green, and blue gradients in the inset, respectively.
The simulations clarified the role of the gradient on the properties measured at different indentation depths. For 1 μm indentations, both modulus and hardness continued to increase as the surface layer was enriched with NPs, confirming that at this indentation depth results are sensitive only to the properties near the surface. On the contrary, the modulus derived from 20 μm indentations peaked for experimental “Grade 1” and then decreased. Similarly, the hardness stopped increasing after “Grade 2.” These results point out that the optimum gradient for enhanced modulus and toughness strongly depends on the indentation depth experienced in a given application, and more specifically on the size of the plastic zone below the indenter. The present analysis suggests that there exists an optimal concentration gradient that maximizes the stiffness and hardness of polymer nanocomposite for a given indentation load, although additional work would be useful to improve the design of such optimal gradients.
Conclusion
The modulus and hardness of graded polymer nanocomposites were found to depend on enhanced concentrations of particles near the surface and on the indentation depth. For small (1 μm) indentations, large increases in modulus (+40%) and hardness (+93% to very high values close to 500 MPa) were obtained for graded composites with an average 8%vol of NPs, compared with their homogeneous counterparts. At larger indentation depth (20 μm, comparable with the size of the composition gradient), however, the modulus and hardness of the graded and homogeneous composites were almost the same, and equal to those of the pure polymer.
Through a MPM approach, a tool for the interpretation and the prediction of the mechanical properties obtained from nanoindentation tests was developed. With this tool, experimental nanoindentation tests were successfully simulated, confirming the importance of the indentation depth and associated plastic zone as key factors toward the determination of the material properties. It turned out that very high-surface concentrations of hard NPs do not necessary lead to the hardest nanocomposites. On the contrary, the performance of a certain concentration gradient should also be defined in conjunction with the indentation load to which it is subjected. The present approach is thus particularly effective to design and prepare hard polymer nanocomposites through the generation of a controlled concentration gradient from a dilute suspension of particles.
Conflict of Interest Statement
The authors declare that the research was conducted in the absence of any commercial or financial relationships that could be construed as a potential conflict of interest.
Acknowledgments
The authors acknowledge the Swiss National Science Foundation (project 200020_155888) for financial support. Two authors (CH and JN) acknowledge support by a National Institute of Food and Agriculture (NIFA) award #2013-34638-21483, of the United States Department of Agriculture (USDA).
References
Aimene, Y. E., and Nairn, J. A. (2015). Simulation of transverse wood compression using a large-deformation, hyperelastic-plastic material model. Wood Sci. Technol. 49, 21–39. doi: 10.1007/s00226-014-0676-6
Alegría-Ortega, J. A., Ocampo-Carmona, L. M., Suárez-Bustamante, F. A., and Olaya-Flórez, J. J. (2012). Erosion-corrosion wear of Cr/CrN multi-layer coating deposited on AISI-304 stainless steel using the unbalanced magnetron (UBM) sputtering system. Wear 29, 149–153. doi:10.1016/j.wear.2012.04.007
Alisafaei, F., Han, C.-S., and Lakhera, N. (2014). Characterization of indentation size effects in epoxy. Polym. Test. 40, 70–78. doi:10.1016/j.polymertesting.2014.08.012
Bardenhagen, S. G., Guilkey, J. E., Roessig, K. M., Brackbill, J. U., Witzel, W. M., and Foster, J. C. (2001). An improved contact algorithm for the material point method and application to stress propagation in granular material. CMES 2, 509–522. doi:10.3970/cmes.2001.002.509
Chen, Z., and Diebels, S. (2014). Nanoindentation of soft polymers: modeling, experiments and parameter identification. Tech. Mech. 34, 166–189.
Dao, M., Chollacoop, N., Van Vliet, K. J., Venkatesh, T. A., and Suresh, S. (2001). Computational modeling of the forward and reverse problems in instrumented sharp indentation. Acta Mater. 49, 3899–3918. doi:10.1016/S1359-6454(01)00295-6
Desmond, K. W., and Weeks, E. R. (2009). Random close packing of disks and spheres in confined geometries. Phys. Rev. E Stat. Nonlin. Soft Matter Phys. 80, 051305. doi:10.1103/PhysRevE.80.051305
Díez-Pascual, A. M., Gómez-Fatou, M. A., Ania, F., and Flores, A. (2015). Nanoindentation in polymer nanocomposites. Prog. Mater. Sci. 67, 1–94. doi:10.1016/j.pmatsci.2014.06.002
Jeong, D. H., Erb, U., Aust, K. T., and Palumbo, G. (2003). The relationship between hardness and abrasive wear resistance of electrodeposited nanocrystalline Ni-P coatings. Scr. Mater. 48, 1067–1072. doi:10.1016/S1359-6462(02)00633-4
Lam, D. C. C., and Chong, A. C. M. (1999). Indentation model and strain gradient plasticity law for glassy polymers. J. Mater. Res. 14, 3784–3788. doi:10.1557/JMR.1999.0512
Lemiale, V., Hurmane, A., and Nairn, J. A. (2010). Material point method simulation of equal channel angular pressing involving large plastic strain and contact through sharp corners. Comput. Model. Eng. Sci. 70, 41–66. doi:10.3970/cmes.2010.070.041
Mann, B. S., and Arya, V. (2002). An experimental study to correlate water jet impingement erosion resistance and properties of metallic materials and coatings. Wear 253, 650–661. doi:10.1016/S0043-1648(02)00118-7
Nair, A. K., Cordill, M. J., Farkas, D., and Gerberich, W. W. (2011). Nanoindentation of thin films: simulations and experiments. J. Mater. Res. 24, 1135–1141. doi:10.1557/jmr.2009.0136
Nairn, J. A. (2013). Modeling of imperfect interfaces in the material point method using multimaterial methods. Comput. Model. Eng. Sci. 92, 271–299. doi:10.3970/cmes.2013.092.271
Nardi, T., Leterrier, Y., Karimi, A., and Månson, J.-A. E. (2014a). A novel synthetic strategy for bioinspired functionally graded nanocomposites employing magnetic field gradients. RSC Adv. 4, 7246–7255. doi:10.1039/c3ra46731g
Nardi, T., Leterrier, Y., and Månson, J.-A. E. (2014b). Bioinspired functionally graded nanocomposites synthesized through magnetophoretic processes for tailored stress reduction. MRS Online Proc. Libr. 1685. doi:10.1557/opl.2014.608
Nardi, T., Sangermano, M., Leterrier, Y., Allia, P., Tiberto, P., and Månson, J.-A. E. (2013). UV-cured transparent magnetic polymer nanocomposites. Polymer 54, 4472–4479. doi:10.1016/j.polymer.2013.06.052
Nunes, J., and Piedade, A. P. (2013). Nanoindentation of functionally graded hybrid polymer/metal thin films. Appl. Surf. Sci. 284, 792–797. doi:10.1016/j.apsusc.2013.08.009
Oliver, W. C., and Pharr, G. M. (1992). An improved technique for determining hardness and elastic modulus using load and displacement sensing indentation experiments. J. Mater. Res. 7, 1564–1583. doi:10.1557/JMR.1992.1564
Penumadu, D., Dutta, A., Pharr, G. M., and Files, B. (2011). Mechanical properties of blended single-wall carbon nanotube composites. J. Mater. Res. 18, 1849–1853. doi:10.1557/JMR.2003.0258
Pharr, G. M., Herbert, E. G., and Gao, Y. F. (2010). The indentation size effect: a critical examination of experimental observations and mechanistic interpretations. Annu. Rev. Mater. Res. 40, 271–292. doi:10.1146/annurev-matsci-070909-104456
Qureshi, S. S., Zheng, Z., Sarwar, M. I., Félix, O., and Decher, G. (2013). Nanoprotective layer-by-layer coatings with epoxy components for enhancing abrasion resistance: toward robust multimaterial nanoscale films. ACS Nano 7, 9336–9344. doi:10.1021/nn4040298
Reshetnyak, H., and Kübarsepp, J. (1997). Structure sensitivity of wear resistance of hardmetals. Int. J. Refract. Metals Hard Mater. 15, 89–95. doi:10.1016/S0263-4368(96)00018-2
Rodríguez, M., Molina-Aldareguía, J. M., González, C., and Llorca, J. (2012). Determination of the mechanical properties of amorphous materials through instrumented nanoindentation. Acta Mater. 60, 3953–3964. doi:10.1016/j.actamat.2012.03.027
Roop Kumar, R., and Wang, M. (2002a). Modulus and hardness evaluations of sintered bioceramic powders and functionally graded bioactive composites by nano-indentation technique. Mater. Sci. Eng. A 338, 230–236. doi:10.1016/S0921-5093(02)00080-1
Roop Kumar, R., and Wang, M. (2002b). Functionally graded bioactive coatings of hydroxyapatite/titanium oxide composite system. Mater. Lett. 55, 133–137. doi:10.1016/S0167-577X(01)00635-8
Sevim, I., and Barlas Eryurek, I. (2006). Materials & design effect of abrasive particle size on wear resistance in steels. Mater. Des. 27, 173–181. doi:10.1016/j.matdes.2005.03.009
Smeacetto, F., Salvo, M., and Ferraris, M. (2002). Oxidation protective multilayer coatings for carbon-carbon composites. Carbon N. Y. 40, 583–587. doi:10.1016/S0008-6223(01)00151-8
Sulsky, D., Chen, Z., and Schreyer, H. L. (1994). A particle method for history-dependent materials. Comput. Methods Appl. Mech. Eng. 118, 179–186. doi:10.1016/0045-7825(94)90112-0
Woirgard, J., Tromas, C., Girard, J. C., and Audurier, V. (1998). Study of the mechanical properties of ceramic materials by the nanoindentation technique. J. Eur. Ceram. Soc. 18, 2297–2305. doi:10.1016/S0955-2219(98)00083-1
Keywords: nanoindentation, functionally graded material, polymer nanocomposite, hardness, Young’s modulus, simulation, material point method
Citation: Nardi T, Hammerquist C, Nairn JA, Karimi A, Månson J-AE and Leterrier Y (2015) Nanoindentation of functionally graded polymer nanocomposites: assessment of the strengthening parameters through experiments and modeling. Front. Mater. 2:57. doi: 10.3389/fmats.2015.00057
Received: 02 February 2015; Accepted: 30 July 2015;
Published: 12 August 2015
Edited by:
Edith Mäder, Leibniz-Institut für Polymerforschung Dresden e. V., GermanyReviewed by:
Kalappa Prashantha, École des Mines de Douai, FranceShanglin Gao, Leibniz-Institut für Polymerforschung Dresden e. V., Germany
Copyright: © 2015 Nardi, Hammerquist, Nairn, Karimi, Månson and Leterrier. This is an open-access article distributed under the terms of the Creative Commons Attribution License (CC BY). The use, distribution or reproduction in other forums is permitted, provided the original author(s) or licensor are credited and that the original publication in this journal is cited, in accordance with accepted academic practice. No use, distribution or reproduction is permitted which does not comply with these terms.
*Correspondence: Yves Leterrier, Laboratoire de Technologie des Composites et Polymères (LTC), École Polytechnique Fédérale de Lausanne (EPFL), Station 12, Lausanne CH-1015, Switzerland, yves.leterrier@epfl.ch