Trends in Effective Diffusion Coefficients for Ion-Exchange Strengthening of Soda-Lime-Silicate Glasses
 Stefan Karlsson
 Lothar Wondraczek
 Sharafat Ali
 Bo Jonson3
- 1RISE Research Institutes of Sweden, RISE Glass section, Växjö, Sweden
- 2Otto Schott Institute of Materials Research, Friedrich Schiller University of Jena, Jena, Germany
- 3Faculty of Technology – Glass Group, Linnaeus University, Växjö, Sweden
- 4Science and Technology Division, Corning Incorporated, Corning, NY, USA
Monovalent cations enable efficient ion-exchange processes due to their high mobility in silicate glasses. Numerous properties can be modified in this way, e.g., mechanical, optical, electrical, or chemical performance. In particular, alkali cation exchange has received significant attention, primarily with respect to introducing compressive stress into the surface region of a glass, which increases mechanical durability. However, most of the present applications rely on specifically tailored matrix compositions in which the cation mobility is enhanced. This largely excludes the major area of soda-lime-silicates (SLS) such as are commodity in almost all large-scale applications of glasses. Basic understanding of the relations between structural parameters and the effective diffusion coefficients may help to improve ion-exchanged SLS glass products, on the one hand in terms of obtainable strength and on the other in terms of cost. In the present paper, we discuss the trends in the effective diffusion coefficients when exchanging Na+ for various monovalent cations (K+, Cu+, Ag+, Rb+, and Cs+) by drawing relations to physicochemical properties. Correlations of effective diffusion coefficients were found for the bond dissociation energy and the electronic cation polarizability, indicating that localization and rupture of bonds are of importance for the ion-exchange rate.
Introduction
Monovalent cations exhibit pronounced mobility in silicate glasses. This enables highly effective ion-exchange processes. In this context, ion exchange has long been known as a useful tool to modify the surface of glass products (Schulze, 1913; Stern, 1966). Numerous properties can be modified in this way, including mechanical, optical, electrical, and chemical performance. In particular, alkali cation exchange has received significant attention throughout the years, primarily with respect to introducing compressive stresses into the surface layer, which increases mechanical durability (Gy, 2003; Karlsson et al., 2010a; Varshneya, 2010a,b). This specific subject has been developing into a large market, where ion exchange strengthened glasses are now used in displays, handheld electronic devices, pharmaceutical packaging, and many other areas. Monovalent cation exchange has also received much attention for tailoring the refractive index profile of the surface layer, i.e., so as to create microstructured planar or buried waveguides or optical lenses with graded refractive index (Ramaswamy and Srivastava, 1988; Opilski et al., 2000; Honkanen et al., 2006; Tervonen et al., 2011).
The ion-exchange process can be described as an interdiffusion reaction where the rate of reaction is described by Fick’s laws of diffusion (Nordberg et al., 1964). While usually, the concentration gradient (∂c/∂x) is considered, the actual driving force for ionic transport is the gradient in chemical potential (∂μ/∂x) between the different ionic media (Schaeffer, 2012) (which in many cases, correlates linearly with the gradient in chemical composition). The transport coefficient is usually concentration-dependent (Doremus, 1964),
where in a simplistic approximation, D1 and D2 are the coefficients of self-diffusion of contributing species 1 and 2, N1 and N2 are the corresponding relative atomic fractions, and is the effective diffusion coefficient.
In the present understanding of ion-exchange kinetics, the transport coefficient is governed by many different parameters, such as salt-bath composition (the diffusion reservoir), glass composition (the structure and free volume of the matrix), exchanging ion species (size and charge), temperature, pressure, etc. The glass composition has received much attention over the years and the specific components of alumina (Burggraaf, 1966), phosphate (Bartholomew and Garfinkel, 1980), and zirconia (Nordberg et al., 1964) have been shown to have beneficial effects on chemical strengthening through acting on free volume, oxygen packing density, and degree of cross-linking of the structural backbone. Transport properties and the relation to glass composition are mostly understood on the basis of conductivity/diffusion paths across which the considered ions are transported, as originally proposed by Greaves (1985). The presence of such paths was later indicated by, e.g., AFM analyses by Frischat et al. (2004), see Figure 1. For each alkali charge that is added to the glass composition, one non-bridging oxygen (NBO) is created so that the network is depolymerized. The NBOs are negatively charged and are charge-compensated by the positively charged alkali ions. This is what leads to the postulated creation the mentioned paths of mobility. There are various models that aim to describe transport properties in glasses, including the strong electrolyte approach (Anderson and Stuart, 1954) or the weak electrolyte approach (Ravaine and Souquet, 1977). Despite their disadvantages (Martin and Angell, 1986), these models provide a decent understanding that by changing the glass composition (e.g., through introduction of Al2O3, B2O3, and/or P2O5), the number of NBOs is varied. This is discussed by Grandjean et al. (2007) and Smedskjaer et al. (2011) where the latter suggests that the alkali ions diffuse faster when acting as charge compensators to, e.g., Al3+ or B3+, as opposed to acting as a creator of NBO. The model then rationalizes attractive reactions among cation species and their effect on the overall activation energy. Major additional factors which then affect the transport properties (Bunde et al., 1996) include site mismatch, site relaxation (frequently called structural relaxation), interionic interaction, and the mixed-modifier effect (Maass et al., 1992; Karlsson et al., 2015; Poletto Rodrigues et al., 2016; Griebenow et al., 2017).
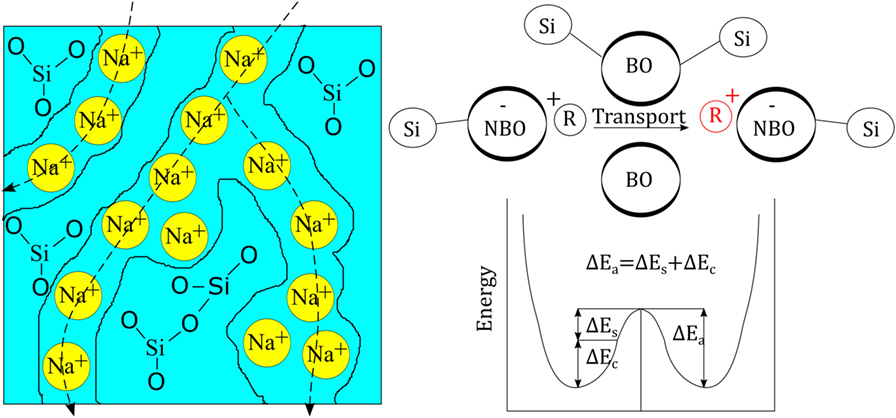
Figure 1. (Left) Schematic view of the glass structure of soda silicate glass as originally proposed by Greaves (1985). (Right) Schematic view of the principle energy landscape for cationic transport (R+ denoting a monovalent cation), redrawn from Martin and Angell (1986). ΔEs stands for network strain energy and ΔEc for Coulomb energy (chemical binding energy).
Industrially, the ion-exchange strengthening process is typically performed on rolled or drawn sheet glass by immersing the glass for a prolonged time into appropriate salt melts (Karlsson et al., 2010a). Employed glass compositions are typically chosen for high ion mobility and high conversion to compressive stress, e.g., alkali-aluminosilicates (Burggraaf and Cornelissen, 1964; Burggraaf, 1966; Ragoen et al., 2017), aluminoborosilicates (Morozumi et al., 2015), and, more recently, aluminophosphosilicates (Zeng et al., 2016). The salt composition is then selected from a trade-off between desired exchange species, high treatment temperature, low vapor pressure, target depth of layer and surface stress, and cost. In the present paper, we discuss trends in the effective diffusion coefficients when exchanging Na+ for various monovalent cations (K+, Cu+, Ag+, Rb+, and Cs+) in the surface of soda-lime-silicate (SLS) float glass. Knowing more about what affects the effective diffusion coefficients can potentially help to improve the diffusivity in chemically strengthened glasses or planar waveguides. For this, we reconsider previously published data (Karlsson et al., 2010b, 2012, 2013).
Materials and Methods
Data used in this report are collected from studies which have previously been published by us (Karlsson et al., 2010b, 2012, 2013). For clarification, we provide a summarized overview of the experimental procedures. In all studies, the employed glass was a commercial SLS float glass (Pilkington Floatglas AB, Halmstad, Sweden), see the nominal composition in Table 1.
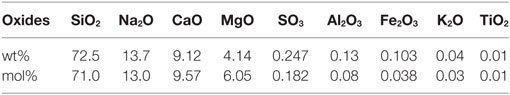
Table 1. Nominal chemical composition of the investigated float glass.
Other than in the regular immersion technique, for ion exchange, a different approach was used where the salt mixture was applied directly onto the float glass surface as a solid paste before melting and heat treatment. Experimental information on the salts and thermal treatments are summarized in Table 2. Salts were applied on the air-side of the glass and the ion exchange itself was performed over a time of 10 h, following the heating procedure to the target temperature, which took 1 h. Subsequent cooling was done at approximate rates of 2 K/min.
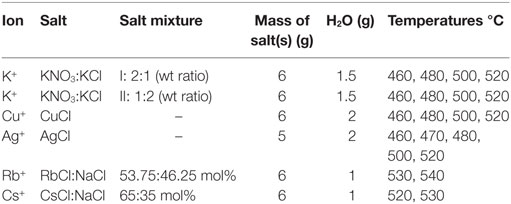
Table 2. Ion-exchange treatments.
The resulting surface concentration profiles were measured by different techniques, UV-VIS spectrophotometry, atomic absorption spectroscopy (AAS), and energy dispersive spectroscopy in Scanning Electron Microscopy. Wet-chemical surface ablation (SAC) was employed before chemical analysis using UV-VIS and AAS. The surface ablation cell (SAC) technique was developed and tested in a round-robin project of Technical Committee 2 of the International Commission on Glass as an efficient tool for multielement determination of glass surface chemistry with scalable matrix dependence, see Figure 2 (Sundberg et al., 2010). More details on the handling of the SAC and analytical procedures can be found in previous reports (Karlsson et al., 2010b, 2012; Sundberg et al., 2010; Karlsson, 2012). In this way, depth-resolved concentration data were obtained for the various species in the glass.
Figure 2. Layout of the Surface Ablation Cell (Sundberg et al., 2010).
The effective diffusion coefficient was then calculated using Eq. 2, frequently called Green’s function, but really a fundamental solution of Fick’s second law for a semi-infinite planar situation with finite diffusion reservoir, a starting surface concentration of 100% in an infinitely thin surface layer, and a starting matrix concentration of zero (Karlsson et al., 2010b).
The analyzed concentration (C) and the calculated depth (x) were plotted by ln(C) vs. x2, yielding the slope . This calculation is based on the mathematical assumption that the effective diffusion coefficient is independent of the concentration of diffusing ions and also independent of time. It is further mathematically assumed that the effective diffusion coefficient in the salt is equal to the effective diffusion coefficient in the glass, see Figure 3 (Crank, 1975; Karlsson et al., 2010b).
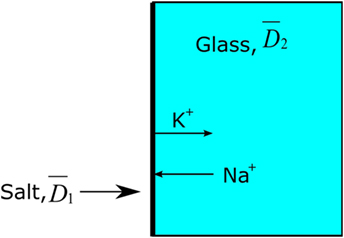
Figure 3. Principal model of Green’s function, . The thick black line represents the salt layer with 100% concentration of, e.g., K+.
Calculations of the activation energy, Ea (kJ/mol), for ionic interdiffusion were made by use of the Arrhenius equation, Eq. 3. Plotting ln vs. T−1 gives the slope k = −Ea/R and the intercept m = ln D0. This assumes that the activation energy is independent of temperature (Frischat, 1975).
The cation field strength (CFS) is calculated through Eq. 4 (Vogel, 1994), where the z is the charge of the cation and r is the effective ionic radius in ångström of the cation and anion as given by Dietzel (1942). The ionic radii data were taken from Shannon (1976).
The electronic cation polarizability (α) was calculated using the Lorentz–Lorenz relation (Eq. 5), and values of molar refractivity (A) as calculated by Pauling (1927). N denotes the amount of polarizable ions normally assumed to be equal to Avogadro’s number (NA).
Trends in Effective Diffusion Coefficients
The employed approach provides a simplistic approximation of the practical diffusion rate, expressed through the effective diffusion coefficient according the Green’s function. It has been shown before that the obtained values are in reasonable agreement with other published data (Pask and Parmelee, 1943; Shaisha and Cooper, 1981; Gonella et al., 1998; Liu and Pun, 2004; Karlsson et al., 2010b, 2012). In a practical consideration, the effective diffusion coefficient represents the efficiency of the ion-exchange reaction, in other words, the rate of the ion exchange. The effective diffusion coefficients are calculated from the concentration vs. depth profile data. In the present case, the penetration depths of K+ for the two salt mixtures on the air-side of float glass are exceeding or equal to 25–30 μm for all temperatures after 10 h of ion exchange (Karlsson et al., 2010b). The penetration depth is approximately 8–10 μm for Rb+ (Karlsson et al., 2012). In the periodic table, Rb is the next element in the group after potassium. Despite the considerably larger ionic radius, it is possible to perform ion exchange thermally with Rb+. Cs+ has an even larger ionic radius than Rb+, but still, also Cs+-Na+ ion exchange is possible. The corresponding penetration depth of Cs+ was found at approximately 5–7 μm. Compared to Rb+-Na+ ion exchange, much smaller concentrations of Cs2O were found in the surface layers (Karlsson et al., 2012). The determined concentration vs. depth profiles of copper ion exchange revealed that the total copper concentration, expressed as mol% [Cu], is relatively high at the top surface layers, but decreases substantially in the top ~5 μm of the samples. Deeper in the sample, the slope of the concentration profile appears to change, indicating a change in the underlying transport mechanism. According to our previous interpretation (Karlsson et al., 2012), the shape of the diffusion profile suggests that for a depth of >5 μm, copper diffusion is unaffected by variations of the chemical composition. From it is indicated that in the range of 0 to ~5 μm, the profile is controlled by sodium outward-diffusion and whereas beyond ~5 μm, it is controlled by the movement of Cu+ species. The reason for this is that Na+ will eventually be depleted at the top surface whereas the opposite is the case for the interior (Karlsson et al., 2012). The copper ion exchanged air-sides were transparent and uncolored after the treatment. This indicates that no substantial amounts of Cu2+ or nanoparticles (Cu0 or Cu2O) were formed and that most of the copper is incorporated as Cu+ ions in the glass (Karlsson et al., 2012) as compared to treatments on the tin-side (Karlsson et al., 2013). The diffusion of Ag+ in glass is known to be relatively high, confirmed by the data in Table 3. The penetration depth of Ag+ ion exchange ranges from 80–100 μm for samples treated at 460°C to 150–200 μm for samples treated at 520°C. The Ag+-Na+ ion exchanged samples were colored yellowish after treatment. The corresponding profiles and discussions of ion exchange with noble metal ions can be found in Karlsson et al. (2010b, 2012). All effective diffusion coefficients from our previous work are summarized in Table 3. Note that these data are in good agreement with the data published by others, thus the below described trends should be regarded as general observations.
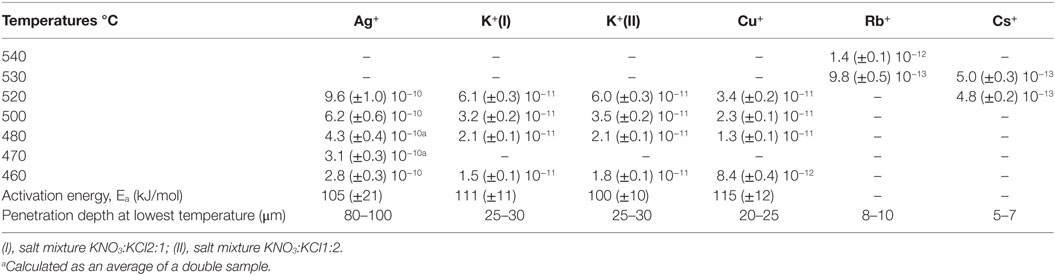
Table 3. Overview of effective diffusion coefficients (cm2s−1) of several monovalent cations in commercial float glass during 10 h of ion exchange (Karlsson et al., 2010b, 2012, 2013).
The diffusivities of the studied monovalent cations follow the order Ag+ > K+ > Cu+ > Rb+ > Cs+. This is in accordance with the order of ionic radii for the alkali ions (K+ < Rb+ < Cs+). However, an opposite pattern is found for the noble metal ions, where the ionic radii Cu+ < Ag+. This trend is evident in Figure 4, where ln is plotted vs. CFS. A similar trend is seen when plotting ln vs. ionic radii as the value of CFS is physically equivalent to the ionic radius when charge and anion species are of equivalent ionic radius. Several different values of the ionic radii were used for calculating CFS, depending on the coordination numbers (CN), see Table 4. When assuming CN6, K+, Rb+, Cs+, and Ag+ seem to follow a relatively linear relationship. However, for the commonly assumed CN2 of noble metal ions in silicate glass, this trend cannot be seen. CN for Cu+ are given in Kamiya et al. (1992), d’Acapito et al. (1997), Lee et al. (2000), Gonella et al. (2005), Arletti et al. (2006), Farges et al. (2006), Gliozzo et al. (2010), and Klysubun et al. (2011) and for Ag+ in Houde-Walter et al. (1993), Dubiel et al. (1997), Yang et al. (2003), and Yang and Dubiel (2007).
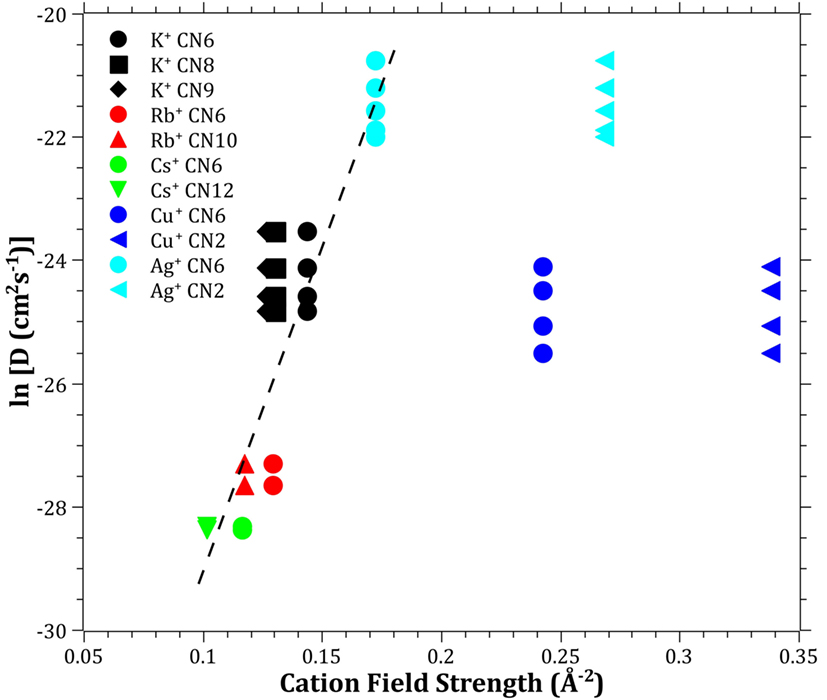
Figure 4. Logarithm of the effective diffusion coefficient vs. cation field strength. Data calculated from ionic radii data (Shannon, 1976) according to Eq. 3 (Dietzel, 1942). The dashed line is a guide to the eye.
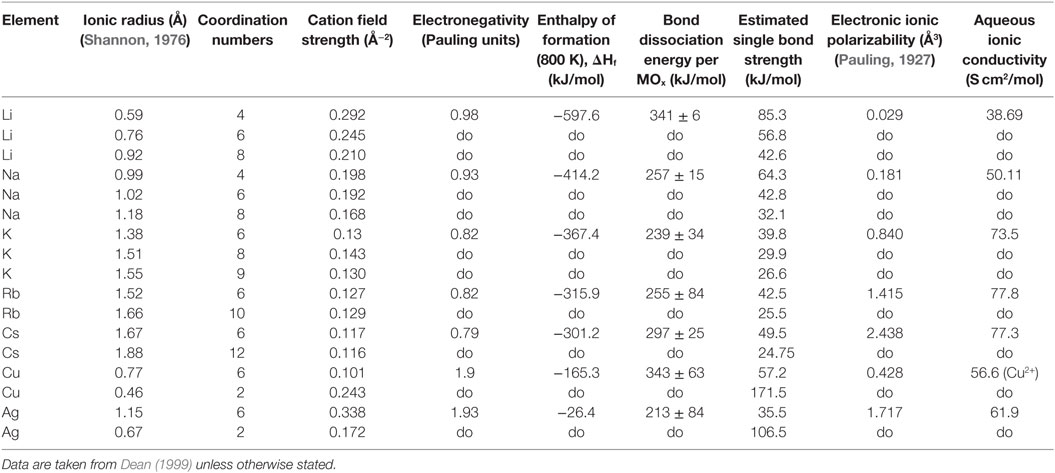
Table 4. Data collected for understanding trends in the effective diffusion coefficients, following a representation in Vogel (1994).
The coordination environment of different cations is complex. Na+ cations have been reported with a mean CN in the range of 4–6 (Greaves, 1981; Greaves et al., 1981; Vessal et al., 1992; Houde-Walter et al., 1993; Cormack and Du, 2001; Du and Cormack, 2004; Bernasconi et al., 2012; Kreski et al., 2012) in silicate glass, but also lower (Dubiel et al., 1997) or higher (McKeown et al., 1985; George and Stebbins, 1996; Weigel et al., 2008) values have been mentioned, depending on compositional changes. K+ cations have been reported to most likely have a CN of 8–10 (Jackson et al., 1987; Cormier et al., 2010; Kreski et al., 2012), but here as well, 4–6 have also been reported (Greaves et al., 1991; Kamijo et al., 1996), again depending on composition. Rb+ (Vessal et al., 1992) and Cs+ (Greaves et al., 1991) cations have been reported to have a CN of 5–6, apart from the study of Stefanovsky and Purans (2012) in nuclear waste glasses where Cs+ was found to have CNs of 6–12. Finally, similar versatility is found in literature for Li+, with CN of 3–4 (Uhlig et al., 1996; Zhao et al., 1998) and 3–6 (Xu and Stebbins, 1995). As can be seen in Table 4, the effects of the CN differences for the alkalis are not as strong as for the noble metal ions.
The Pauling electronegativity of the elements vs. ln does not give the same trend (Ag+ fitting-in with the alkali metal ions) as was the case for ionic radii and CFS, see Figure 5. It also does not give any further insight as to why Ag+ is faster diffusing than Cu+. The noble metal cations have considerably higher ionization energies than the alkalis and, thereby, higher electronegativity. Tabulated electronegativity values do not provide a reasonable answer to this, and one reason can be that the electronegativity may also change depending on the environment of the cation. The enthalpy of formation, ΔHf, of the oxides, gives a decreasing exponential trend for the alkali down in the group and it does not fit with neither Cu2O nor Ag2O, see Figure 6. The Gibbs free energy of formation gives a similar trend as enthalpy of formation, which is perfectly reasonable as it includes the enthalpy of formation. The dissociation energy of the bond to oxygen, on the other hand (Figure 7), gives a rather linear relationship between the alkali species and Ag-O. Cu-O has a considerably higher bond dissociation energy than the others, which perhaps offers the best explanation as to why Cu+ is diffusing slower than Ag+. The bond dissociation energy includes all oxide bonds in the cation coordination sphere, in contrast to single bond strengths that can be estimated from the bond dissociation energy divided by the coordination number (Varshneya, 2006). It shall be noted that the bond dissociation energy shows a minimum for K+ in the alkali series, see Table 3, indicating that K+ is efficient for ion-exchange strengthening. The electronic ionic polarizability is a measure of the effect that surrounding atoms in the vitreous network has on the dipole moment or orbital structure of the mobile species that we are considering. It is not just important for the optical properties (Karlsson et al., 2016) but also important for transport properties as electric fields are constantly changing as the ions diffuses in the glass (Frischat, 1975). The logarithm of the effective diffusion coefficient as a function of the electronic ionic polarizability is given in Figure 8, where Cu+ fits into the trend with the alkali ions, while Ag+ with relatively high polarizability has an unusually high effective diffusion. High electronic ionic polarizability can be argued to be a positive property on the activation energy of the diffusion as the ions are deformable during the diffusion, a concept that is considered when choosing materials as solid electrolytes (Cao et al., 2014). As for comparison, the ionic conductivity in aqueous solution as a function of the logarithmic effective diffusion coefficient also gives a similar trend as for the bond dissociation energy (Figure 9). While data for Cu+ was not found in literature, the other species clearly follow the order Ag+ > K+ > Rb+ > Cs+. The simple reason for the lack of data on Cu+ is probably that it is difficult to stabilize Cu+ in aqueous solutions.
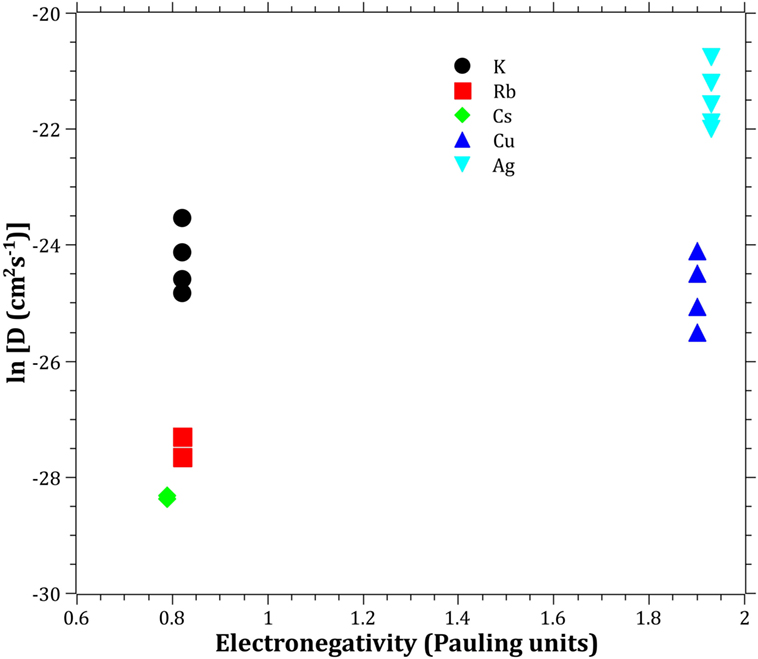
Figure 5. Logarithm of the effective diffusion coefficient vs. electronegativity. Data taken from Dean (1999).
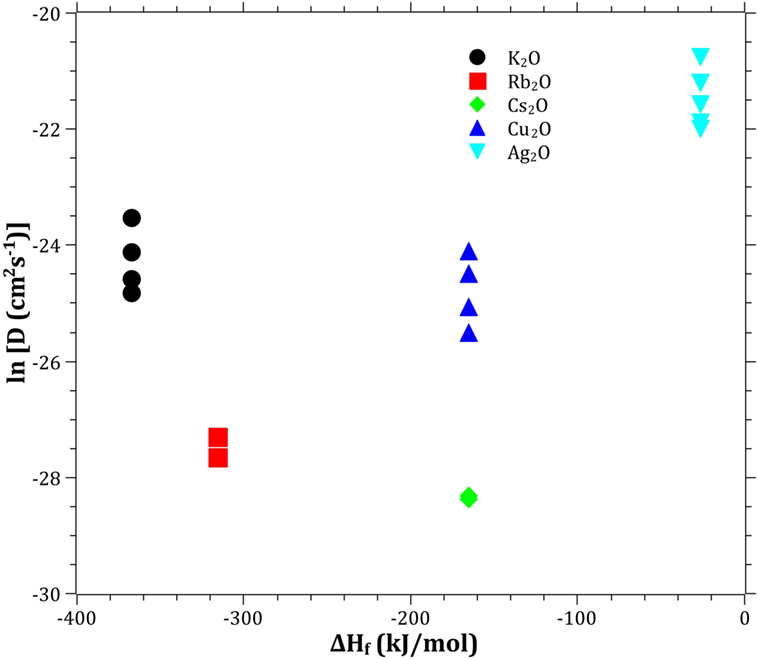
Figure 6. Logarithm of the effective diffusion coefficient vs. enthalpy of formation. Data taken from Dean (1999).
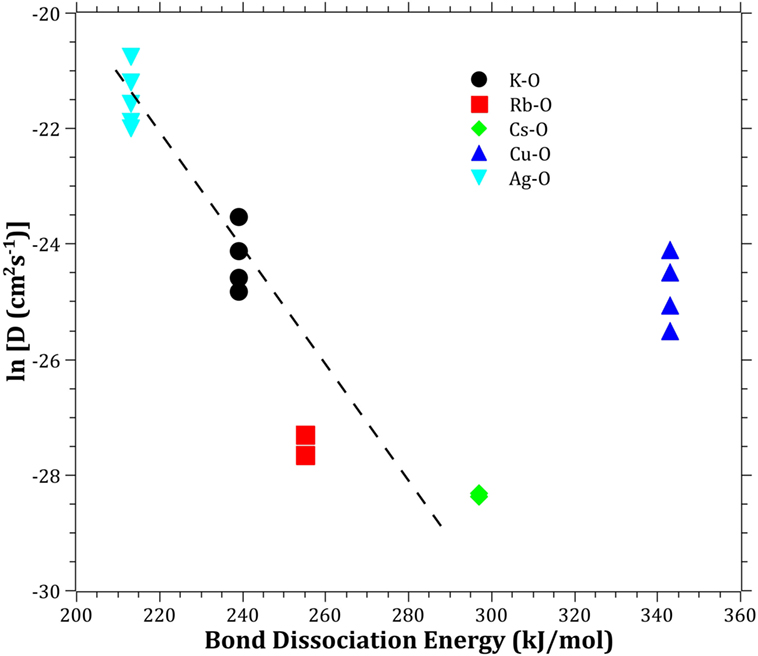
Figure 7. Logarithm of the effective diffusion coefficient vs. bond dissociation energy. Data taken from Dean (1999). The dashed line is a guide to the eye.
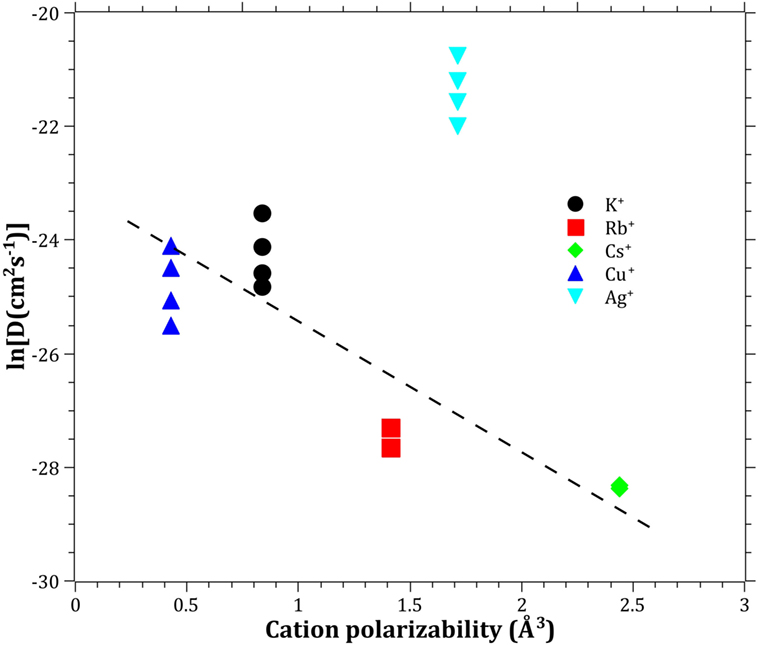
Figure 8. Logarithm of the effective diffusion coefficient vs. electronic cation polarizability. Molar refraction data taken from Pauling (1927). The dashed line is a guide to the eye.
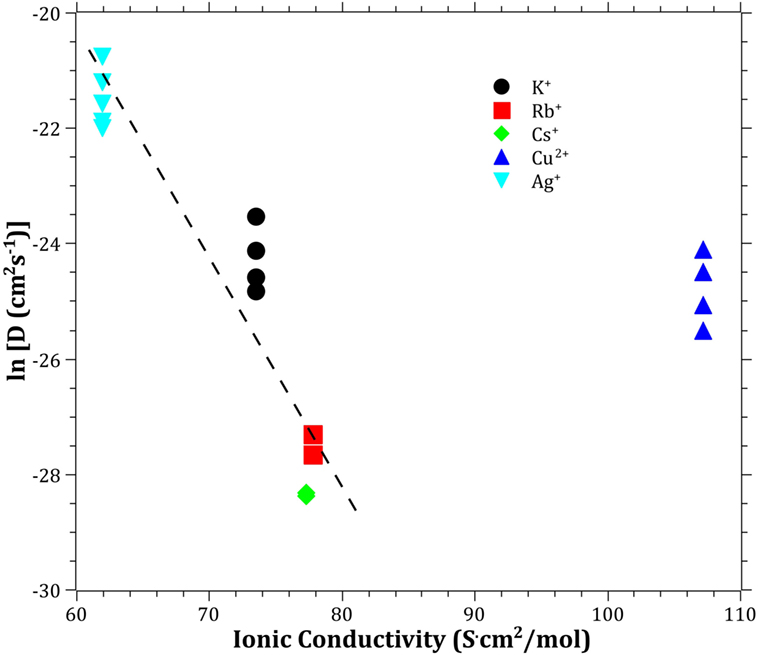
Figure 9. Logarithm of the effective diffusion coefficient vs. aqueous ionic conductivity. Data taken from Dean (1999). The dashed line is a guide to the eye.
Discussion
To understand and ultimately design glasses with increased mobility for chemically strengthening of glass, it is likely important to learn from the experiences in the field of solid electrolytes (Cao et al., 2014). The structural properties are of much importance, hence the following criteria should be considered: (i) large enough structural transport channels (c.f. Figure 1), (ii) disordered mobile ion sub-lattice, (iii) highly polarizable mobile ions and anion sub-lattices, and (iv) size of the ions in the vitreous network. The effective diffusion coefficients will always be a complex trade-off between different properties; however, in the current paper, we have found a correlation using bond dissociation energy and electronic cation polarizability. The unusually high effective diffusion coefficient of Ag+ as compared to Cu+ can at least partly be explained by Ag+ having a comparable bond dissociation energy and a high cation polarizability, while Cu+ have a high bond dissociation energy and a comparable cation polarizability. This indicates that the breakage of bonds and structural deformability are keys to improving the ion-exchange rate. By identifying the key properties, it will give the possibility for modeling the diffusion by topological, atomistic, or quantum mechanics modeling (Mauro et al., 2016). One should bear in mind that the mobile cations are only one component in the creations of bonds and polarizability in the vitreous network. The anions, most often consisting of oxygen, can also be exchanged for other anions (Wondraczek et al., 2011), such as nitrogen (Becher et al., 2011; Ali et al., 2015) or carbon (Renlund et al., 1991). The understanding that the bond dissociation energy and the polarizability can be correlated to the effective diffusion coefficient also provides a perspective how ionic diffusion and ion-exchange strengthening behave in different types of glasses, including, e.g., chalcogenide or chalcohalide glasses (Calvez et al., 2009). Furthermore, it provides the insight that the alkali ions bond less strongly when charge compensating Al3+, B3+, or P5+ than when creating NBO, i.e., likely a significant difference in the type of bonding, in accordance with (Smedskjaer et al., 2011).
Concluding Remarks
The effective diffusivities of the studied monovalent cations follow the order Ag+ > K+ > Cu+ > Rb+ > Cs+. This is in accordance with the order of ionic radii for the alkali ions (K+ < Rb+ < Cs+). However, an opposite pattern is found for the noble metal ions, where the ionic radii Cu+ < Ag+. The Cu+ cation behaves with respect to its small ionic radius peculiar compared to the other ions. The bond dissociation energy offers the best explanation as to why Cu+ is slower than Ag+. The polarizability of ions adds another dimension by offering increased structural deformability, which can be a route to enhance the ionic transport. A better understanding of ionic diffusion in glass can give rise to stronger and less expensive chemically strengthened glasses, using adapted combinations of diffusing species. Correlations between bond dissociation energies and polarizability provide an understanding of how different anions in glass affect effective diffusion coefficients and how ionic diffusion in different types of glasses may be tailored.
Author Contributions
SK and LW perceived the idea of the paper. SK wrote the draft of the manuscript. All authors were involved in the discussions and elaborating the manuscript text.
Conflict of Interest Statement
The authors declare that the research was conducted in the absence of any commercial or financial relationships that could be construed as a potential conflict of interest.
Funding
Funding from Vinnova (Grant No. 2013-04343 for SK and 2015-04809 for SA) co-funded by Marie Curie Actions FP7-PEOPLE-2011-COFUND (GROWTH 291795) is greatly acknowledged.
References
Ali, S., Jonson, B., Pomeroy, M. J., and Hampshire, S. (2015). Issues associated with the development of transparent oxynitride glasses. Ceram. Int. 41(3, Part A), 3345–3354. doi: 10.1016/j.ceramint.2014.11.030
Anderson, O. L., and Stuart, D. A. (1954). Calculation of activation energy of ionic conductivity in silica glasses by classical methods. J. Am. Ceram. Soc. 37, 573–580. doi:10.1111/j.1151-2916.1954.tb13991.x
Arletti, R., Dalconi, M. C., Quartieri, S., Triscari, M., and Vezzalini, G. (2006). Roman coloured and opaque glass: a chemical and spectroscopic study. Appl. Phys. A 83, 239–245. doi:10.1007/s00339-006-3515-2
Bartholomew, R. F., and Garfinkel, H. M. (1980). “Chemical strengthening of glass,” in Glass Science and Technology Vol 5 Elasticity and Strength in Glasses, eds D. R. Uhlmann and N. J. Kreidl (New York: Academic Press), 217–270.
Becher, P. F., Hampshire, S., Pomeroy, M. J., Hoffmann, M. J., Lance, M. J., and Satet, R. L. (2011). An overview of the structure and properties of silicon-based oxynitride glasses. Int. J. Appl. Glass Sci. 2, 63–83. doi:10.1111/j.2041-1294.2011.00042.x
Bernasconi, A., Dapiaggi, M., Pavese, A., Bowron, D. T., and Imberti, S. (2012). Local structure of Si-Al-Ca-Na-O glasses from coupled neutron and X-ray total scattering data. J. Phys. Chem. B 116, 13114–13123. doi:10.1021/jp306697w
Bunde, A., Funke, K., and Ingram, M. D. (1996). A unified site relaxation model for ion mobility in glassy materials. Solid State Ionics. 86–88(Part 2), 1311–1317. doi:10.1016/0167-2738(96)00307-4
Burggraaf, A. J. (1966). The strengthening of glass by ion exchange part 2: stress formation and stress relaxation after ion exchange in alkali aluminosilicate glasses in connection with structural changes in the glass. Phys. Chem. Glasses 7, 166–177.
Burggraaf, A. J., and Cornelissen, J. (1964). The strengthening of glass by ion exchange part 1: stress formation by ion diffusion in alkali aluminosilicate glass. Phys. Chem. Glasses 5, 123–129.
Calvez, L., Rozé, M., Ma, H. L., Sangleboeuf, J. C., Guin, J.-P., and Zhang, X. H. (2009). Strengthening of chalco-halide glasses by ion exchange. J. Non Oxide Glasses 1, 30–37.
Cao, C., Li, Z.-B., Wang, X.-L., Zhao, X.-B., and Han, W.-Q. (2014). Recent advances in inorganic solid electrolytes for lithium batteries. Front. Energy Res. 2:25. doi:10.3389/fenrg.2014.00025
Cormack, A. N., and Du, J. (2001). Molecular dynamics simulations of soda-lime-silicate glasses. J. Non Cryst. Solids 293–295, 283–289. doi:10.1016/S0022-3093(01)00831-6
Cormier, L., Calas, G., and Cuello, G. J. (2010). Structural study of Ca-Mg and K-Mg mixing in silicate glasses by neutron diffraction. J. Non Cryst. Solids 356, 2327–2331. doi:10.1016/j.jnoncrysol.2010.02.023
d’Acapito, F., Colonna, S., Mobilio, S., Gonella, F., Cattaruzza, E., and Mazzoldi, P. (1997). Local atomic environment of Cu ions in ion-exchanged silicate glass waveguides: an x-ray absorption spectroscopy study. Appl. Phys. Lett. 71, 2611–2613. doi:10.1063/1.120156
Dietzel, A. (1942). Die Kationenfeldstärken und ihre Beziehungen zu Entglasungsvorgängen, zur Verbindungsbildung und zu den Schmelzpunkten von Silicaten. Z. Elektrochem. Angew. Phys. Chem. 48, 9–23. doi:10.1002/bbpc.19420480104
Doremus, R. H. (1964). Exchange and diffusion of ions in glass. J. Phys. Chem. 68, 2212. doi:10.1021/j100790a031
Du, J., and Cormack, A. N. (2004). The medium range structure of sodium silicate glasses: a molecular dynamics simulation. J. Non Cryst. Solids 349, 66–79. doi:10.1016/j.jnoncrysol.2004.08.264
Dubiel, M., Brunsch, S., Kolb, U., Gutwerk, D., and Bertagnolli, H. (1997). Experimental studies investigating the structure of soda-lime glasses after silver-sodium ion exchange. J. Non Cryst. Solids 220, 30–44. doi:10.1016/S0022-3093(97)00230-5
Farges, F., Etcheverry, M.-P., Scheidegger, A., and Grolimund, D. (2006). Speciation and weathering of copper in “copper red ruby” medieval flashed glasses from the Tours cathedral (XIII century). Appl. Geochem. 21, 1715–1731. doi:10.1016/j.apgeochem.2006.07.008
Frischat, G. H., Poggemann, J. F., and Heide, G. (2004). Nanostructure and atomic structure of glass seen by atomic force microscopy. J. Non Cryst. Solids 345-346, 197–202. doi:10.1016/j.jnoncrysol.2004.08.022
George, A. M., and Stebbins, J. F. (1996). Dynamics of Na in sodium aluminosilicate glasses and liquids. Phys. Chem. Miner. 23, 526–534. doi:10.1007/bf00242002
Gliozzo, E., Santagostino Barbone, A., D’Acapito, F., Turchiano, M., Turbanti Memmi, I., and Volpe, G. (2010). The sectilia panels of Faragola (Ascoli Satriano, Southern Italy): a multi-analytical study of the green, marbled (green and yellow), blue and blackish glass slabs. Archaeometry 52, 389–415. doi:10.1111/j.1475-4754.2009.00493.x
Gonella, F., Caccavale, F., Bogomolova, L. D., D’Acapito, F., and Quaranta, A. (1998). Experimental study of copper-alkali ion exchange in glass. J. Appl. Phys. 83, 1200–1206. doi:10.1063/1.366816
Gonella, F., Quaranta, A., Padovani, S., Sada, C., D’Acapito, F., Maurizio, C., et al. (2005). Copper diffusion in ion-exchanged soda-lime glass. Appl. Phys. A Mater. Sci. Process. 81, 1065–1071. doi:10.1007/s00339-004-2949-7
Grandjean, A., Malki, M., Simonnet, C., Manara, D., and Penelon, B. (2007). Correlation between electrical conductivity, viscosity, and structure in borosilicate glass-forming melts. Phys. Rev. B 75, 054112. doi:10.1103/PhysRevB.75.054112
Greaves, G. (1981). Sodium environments in glass. J. Phys. Colloq. 42, C4–C225. doi:10.1051/jphyscol:1981447
Greaves, G. N. (1985). EXAFS and the structure of glass. J. Non Cryst. Solids 71, 203–217. doi:10.1016/0022-3093(85)90289-3
Greaves, G. N., Fontaine, A., Lagarde, P., Raoux, D., and Gurman, S. J. (1981). Local structure of silicate glasses. Nature 293, 611–616. doi:10.1038/293611a0
Greaves, G. N., Gurman, S. J., Catlow, C. R. A., Chadwick, A. V., Houde-Walter, S., Henderson, C. M. B., et al. (1991). A structural basis for ionic diffusion in oxide glasses. Philos. Mag. A 64, 1059–1072. doi:10.1080/01418619108204878
Griebenow, K., Hoppe, U., Möncke, D., Kamitsos, E. I., and Wondraczek, L. (2017). Transition-metal incorporation and Co-Sr/Mn-Sr mixed-modifier effect in metaphosphate glasses. J. Non Cryst. Solids 460, 136–145. doi:10.1016/j.jnoncrysol.2017.01.022
Gy, R. (2003). Stress corrosion of silicate glass: a review. J. Non Cryst. Solids 316, 1–11. doi:10.1016/S0022-3093(02)01931-2
Honkanen, S., West, B. R., Yliniemi, S., Madasamy, P., Morrell, M., Auxier, J., et al. (2006). Recent advances in ion exchanged glass waveguides and devices. Phys. Chem. Glasses 47, 110–120.
Houde-Walter, S. N., Inman, J. M., Dent, A. J., and Greaves, G. N. (1993). Sodium and silver environments and ion-exchange processes in silicate and aluminosilicate glasses. J. Phys. Chem. 97, 9330. doi:10.1021/j100139a013
Jackson, W. E., Brown, G. E., and Ponader, C. W. (1987). X-ray absorption study of the potassium coordination environment in glasses from the NaAlSi3O8-KAlSi3O8 binary. J. Non Cryst. Solids 93, 311–322. doi:10.1016/S0022-3093(87)80177-1
Kamijo, N., Handa, K., and Umesaki, N. (1996). Soft X-ray XAFS studies on the local structure of K2O-SiO2 glasses. JIM Mater. Trans. 37, 927–931. doi:10.2320/matertrans1989.37.927
Kamiya, K., Okasaka, K., Wada, M., Nasu, H., and Yoko, T. (1992). Extended X-ray absorption fine structure (EXAFS) study on the local environment around copper in low thermal expansion copper aluminosilicate glasses. J. Am. Ceram. Soc. 75, 477–478. doi:10.1111/j.1151-2916.1992.tb08205.x
Karlsson, S. (2012). Doctoral Thesis: Modification of Float Glass Surfaces by Ion Exchange. Ph.D., Linnaeus University.
Karlsson, S., Ali, S., Limbach, R., Strand, M., and Wondraczek, L. (2015). Alkali salt vapour deposition and in-line ion exchange on flat glass surfaces. Glass Technol. Eur. J. Glass Sci. Technol. A 56, 203–213. doi:10.13036/1753-3546.56.6.203
Karlsson, S., Grund Bäck, L., Kidkhunthod, P., Lundstedt, K., and Wondraczek, L. (2016). Effect of TiO2 on optical properties of glasses in the soda-lime-silicate system. Opt. Mater. Expr. 6, 1198–1216. doi:10.1364/ome.6.001198
Karlsson, S., Jonson, B., Reibstein, S., and Wondraczek, L. (2013). Surface ruby colouring of float glass by sodium – copper ion exchange. Eur. J. Glass Sci. Technol. A Glass Technol. 54, 100–107.
Karlsson, S., Jonson, B., and Stålhandske, C. (2010a). The technology of chemical glass strengthening – a review. Eur. J. Glass Sci. Technol. A Glass Technol. 51, 41–54.
Karlsson, S., Jonson, B., Sundberg, P., and Stålhandske, C. (2010b). Surface analysis of float glass using surface ablation cell (SAC) part 2: determination of the diffusion characteristics of K+-Na+ Ion exchange. Eur. J. Glass Sci. Technol. A Glass Technol. 51, 55–62.
Karlsson, S., Jonson, B., and Wondraczek, L. (2012). Copper, silver, rubidium and caesium ion exchange in soda-lime-silicate float glass by direct deposition and in line melting of salt pastes. Eur. J. Glass Sci. Technol. A Glass Technol. 53, 1–7.
Klysubun, W., Thongkam, Y., Pongkrapan, S., Won-in, K., T-Thienprasert, J., and Dararutana, P. (2011). XAS study on copper red in ancient glass beads from Thailand. Anal. Bioanal. Chem. 399, 3033–3040. doi:10.1007/s00216-010-4219-1
Kreski, P. K., Varshneya, A. K., and Cormack, A. N. (2012). Investigation of ion-exchange ‘stuffed’ glass structures by molecular dynamics simulation. J. Non Cryst. Solids 358, 3539–3545. doi:10.1016/j.jnoncrysol.2012.05.025
Lee, J., Yano, T., Shibata, S., Nukui, A., and Yamane, M. (2000). EXAFS study on the local environment of Cu+ ions in glasses of the Cu2O–Na2O–Al2O3–SiO2 system prepared by Cu+/Na+ ion exchange. J. Non Cryst. Solids 277, 155–161. doi:10.1016/S0022-3093(00)00330-6
Liu, K., and Pun, E. Y. B. (2004). Single-mode Rb+-K+ ion-exchanged BK7 glass waveguides with low losses at 1550 nm. IEEE Photonics Technol. Lett. 16, 120–122. doi:10.1109/LPT.2003.818921
Maass, P., Bunde, A., and Ingram, M. D. (1992). Ion transport anomalies in glasses. Phys. Rev. Lett. 68, 3064–3067. doi:10.1103/PhysRevLett.68.3064
Martin, S. W., and Angell, C. A. (1986). Dc and ac conductivity in wide composition range Li2O-P2O5 glasses. J. Non Cryst. Solids 83, 185–207. doi:10.1016/0022-3093(86)90067-0
Mauro, J. C., Tandia, A., Vargheese, K. D., Mauro, Y. Z., and Smedskjaer, M. M. (2016). Accelerating the design of functional glasses through modeling. Chem. Mater. 28, 4267–4277. doi:10.1021/acs.chemmater.6b01054
McKeown, D. A., Waychunas, G. A., and Brown, G. E. (1985). Exafs and xanes study of the local coordination environment of sodium in a series of silica-rich glasses and selected minerals within the Na2O∙Al2O3∙SiO2 system. J. Non Cryst. Solids 74, 325–348. doi:10.1016/0022-3093(85)90078-X
Morozumi, H., Nakano, H., Yoshida, S., and Matsuoka, J. (2015). Crack initiation tendency of chemically strengthened glasses. Int. J. Appl. Glass Sci. 6, 64–71. doi:10.1111/ijag.12089
Nordberg, M. E., Mochel, E. L., Garfinkel, H. M., and Olcott, J. S. (1964). Strengthening by ion exchange. J. Am. Ceram. Soc. 47, 215–219. doi:10.1111/j.1151-2916.1964.tb14399.x
Opilski, A., Rogoziński, R., Gut, K., Błachut, M., and Opilski, Z. (2000). Present state and perspectives involving application of ion exchange in glass. Opto-Electron. Rev. 8, 117–127.
Pask, J. A., and Parmelee, C. W. (1943). Study of diffusion in glass. J. Am. Ceram. Soc. 26, 267. doi:10.1111/j.1151-2916.1943.tb15214.x
Pauling, L. (1927). The theoretical prediction of the physical properties of many-electron atoms and ions. Mole refraction, diamagnetic susceptibility, and extension in space. Proc. R. Soc. Lond. Ser. A Containing Pap. Math. Phys. Character 114, 181–211. doi:10.1098/rspa.1927.0035
Poletto Rodrigues, B., Deubener, J., and Wondraczek, L. (2016). Modifier interaction and mixed-alkali effect in bond constraint theory applied to ternary alkali metaphosphate glasses. Front. Mater. 3:25. doi:10.3389/fmats.2016.00025
Ragoen, C., Sen, S., Lambricht, T., and Godet, S. (2017). Effect of Al2O3 content on the mechanical and interdiffusional properties of ion-exchanged Na-aluminosilicate glasses. J. Non Cryst. Solids 458, 129–136. doi:10.1016/j.jnoncrysol.2016.12.019
Ramaswamy, R. V., and Srivastava, R. (1988). Ion-exchanged glass waveguides: a review. J. Lightwave Technol. 6, 984. doi:10.1109/50.4090
Ravaine, D., and Souquet, J. (1977). Thermodynamic approach to ionic conductivity in oxide glasses; I, correlation of the ionic conductivity with the chemical potential of alkali oxide in oxide glasses. Phys. Chem. Glasses 18, 27–31.
Renlund, G. M., Prochazka, S., and Doremus, R. H. (1991). Silicon oxycarbide glasses: part II. Structure and properties. J. Mater. Res. 6, 2723–2734. doi:10.1557/JMR.1991.2723
Schaeffer, H. A. (2012). Transport phenomena and diffusion anomalies in glass. Mater. Ceram. 64, 156–161.
Schulze, G. (1913). Versuche über die diffusion von silber in glas. Ann. Phys. 345, 335–367. doi:10.1002/andp.19133450208
Shaisha, E. E., and Cooper, A. R. (1981). Ion exchange of soda-lime glass with univalent cations. J. Am. Ceram. Soc. 64, 278–283. doi:10.1111/j.1151-2916.1981.tb09602.x
Shannon, R. (1976). Revised effective ionic radii and systematic studies of interatomic distances in halides and chalcogenides. Acta Crystallogr. A Cryst. Phys. Diffr. Theor. Gen. Crystallogr. 32, 751–767. doi:10.1107/S0567739476001551
Smedskjaer, M. M., Zheng, Q., Mauro, J. C., Potuzak, M., Mörup, S., and Yue, Y. (2011). Sodium diffusion in boroaluminosilicate glasses. J. Non Cryst. Solids 357, 3744–3750. doi:10.1016/j.jnoncrysol.2011.07.008
Stefanovsky, S. V., and Purans, J. J. (2012). Cesium speciation in nuclear waste glasses. Phys. Chem. Glasses 53, 186–190.
Sundberg, P., Karlsson, S., Brochot, D., Strubel, C., and Simons, J. (2010). Surface analysis of float glass using surface ablation cell (SAC) part 1: initial collaboration and comparison with SIMS. Eur. J. Glass Sci. Technol. A Glass Technol. 51, 13–21.
Tervonen, A., West, B. R., and Honkanen, S. (2011). Ion-exchanged glass waveguide technology: a review. Opt. Eng. 50, 071107. doi:10.1117/1.3559213
Uhlig, H., Hoffmann, M. J., Lamparter, H.-P., Aldinger, F., Bellissent, R., and Steeb, S. (1996). Short-Range and medium-range order in lithium silicate glasses, part I: diffraction experiments and results. J. Am. Ceram. Soc. 79, 2833–2838. doi:10.1111/j.1151-2916.1996.tb08716.x
Varshneya, A. K. (2006). Fundamentals of Inorganic Glasses. Sheffield, UK: Society of Glass Technology.
Varshneya, A. K. (2010a). Chemical strengthening of glass: lessons learned and yet to be learned. Int. J. Appl. Glass Sci. 1, 131–142. doi:10.1111/j.2041-1294.2010.00010.x
Varshneya, A. K. (2010b). The physics of chemical strengthening of glass: room for a new view. J. Non Cryst. Solids 356, 2289–2294. doi:10.1016/j.jnoncrysol.2010.05.010
Vessal, B., Greaves, G. N., Marten, P. T., Chadwick, A. V., Mole, R., and Houde-Walter, S. (1992). Cation microsegregation and ionic mobility in mixed alkali glasses. Nature 356, 504–506. doi:10.1038/356504a0
Weigel, C., Cormier, L., Calas, G., Galoisy, L., and Bowron, D. T. (2008). Nature and distribution of iron sites in a sodium silicate glass investigated by neutron diffraction and EPSR simulation. J. Non Cryst. Solids 354, 5378–5385. doi:10.1016/j.jnoncrysol.2008.09.030
Wondraczek, L., Mauro, J. C., Eckert, J., Kühn, U., Horbach, J., Deubener, J., et al. (2011). Towards ultrastrong glasses. Adv. Mater. Weinheim 23, 4578–4586. doi:10.1002/adma.201102795
Xu, Z., and Stebbins, J. F. (1995). 6Li nuclear magnetic resonance chemical shifts, coordination number and relaxation in crystalline and glassy silicates. Solid State Nucl. Magn. Reson. 5, 103–112. doi:10.1016/0926-2040(95)00026-M
Yang, X. C., and Dubiel, M. (2007). XAFS studies of silver environments in ion-exchanged glasses. AIP Conf. Proc. 882, 457–459. doi:10.1063/1.2644557
Yang, X. C., Dubiel, M., Brunsch, S., and Hofmeister, H. (2003). X-ray absorption spectroscopy analysis of formation and structure of Ag nanoparticles in soda-lime silicate glass. J. Non Cryst. Solids 328, 123–136. doi:10.1016/S0022-3093(03)00469-1
Zeng, H., Wang, L., Ye, F., Yang, B., Chen, J., Chen, G., et al. (2016). Mechanical–structural investigation of chemical strengthening aluminosilicate glass through introducing phosphorus pentoxide. Front. Mater. 3:53. doi:10.3389/fmats.2016.00053
Keywords: ion exchange in glass, float glass, soda-lime-silicate, effective diffusion coefficients, bond dissociation energy, electronic cation polarizability
Citation: Karlsson S, Wondraczek L, Ali S and Jonson B (2017) Trends in Effective Diffusion Coefficients for Ion-Exchange Strengthening of Soda-Lime-Silicate Glasses. Front. Mater. 4:13. doi: 10.3389/fmats.2017.00013
Received: 10 February 2017; Accepted: 31 March 2017;
Published: 24 April 2017
Edited by:
Sylwester Janusz Rzoska, Polish Academy of Sciences, PolandCopyright: © 2017 Karlsson, Wondraczek, Ali and Jonson. This is an open-access article distributed under the terms of the Creative Commons Attribution License (CC BY). The use, distribution or reproduction in other forums is permitted, provided the original author(s) or licensor are credited and that the original publication in this journal is cited, in accordance with accepted academic practice. No use, distribution or reproduction is permitted which does not comply with these terms.
*Correspondence: Stefan Karlsson, stefan.karlsson@ri.se