3D Architecture of Trabecular Bone in the Pig Mandible and Femur: Inter-Trabecular Angle Distributions
 Yehonatan Ben-Zvi
 Natalie Reznikov
 Ron Shahar
 Steve Weiner
- 1Department of Structural Biology, Weizmann Institute of Science, Rehovot, Israel
- 2Imperial College London, London, United Kingdom
- 3Faculty of Agriculture, Food and Environment, Koret School of Veterinary Medicine, The Hebrew University of Jerusalem, Rehovot, Israel
Cancellous bone is an intricate network of interconnected trabeculae, to which analysis of network topology can be applied. The inter-trabecular angle (ITA) analysis—an analysis of network topological parameters and regularity of network-forming nodes—was previously carried out on human proximal femora and showed that trabecular bone follows two main principles: sparsity of the network connectedness (prevalence of nodes with low connectivity in the network) and maximal space spanning (angular offset of connected elements is maximal for their number and approximates the values of geometrically symmetric shapes). These observations suggest that 3D organization of trabecular bone, irrespective of size and shape of individual elements, reflects a tradeoff between minimal metabolic cost of maintenance and maximal network stability under conditions of multidirectional loading. In this study, we validate the ITA application using additional 3D structures (cork and 3D-printed metal lattices), analyze the ITA parameters in porcine proximal femora and mandibles, and carry out a spatial analysis of the most common node type in the porcine mandibular condyle. The validation shows that the ITA application reliably detects designed or evolved topological parameters. The ITA parameters of porcine trabecular bones are similar to those of human bones. We demonstrate functional adaptation in the pig mandibular condyle by showing that the planar nodes with three edges are preferentially aligned in relation to the muscle forces that are applied to the condyle. We conclude that the ITA topological parameters are remarkably conserved, but locally do adapt to applied stresses.
Introduction
Trabecular bone (also known as cancellous or spongey bone) is a lightweight porous material that fills the interior spaces of most bones. In some cases, such as the vertebrae, it comprises almost the entire bone, as the outer compact bone shell is relatively thin. By contrast, in long bones such as the femur and humerus, cancellous bone is found mostly in the articulating ends. Much effort has been made to characterize the 3D architecture and network organization of trabecular bone, both to understand how trabecular bone functions normally and when it is compromised by pathology (Odgaard, 1997; Müller et al., 1998; Keaveny et al., 2001; Boyde, 2003; Zysset, 2003; Ryan and Krovitz, 2006; Stauber and Müller, 2007; Allen et al., 2008).
Many analytical techniques in trabecular bone research are based on histomorphometric (2D) procedures (Odgaard, 1997). The utilization of three-dimensional (3D) imaging of bone makes it possible to better characterize the architecture (Odgaard, 1997; An and Freidman, 1998; Müller, 2009; Kivell, 2016). Current micro-CT-based analyses of trabecular bone characterize its organization in terms of textural structural features within a region of interest [mean trabecular thickness (Tb.Th), mean inter-trabecular distance, bone volume-total volume ratio (BV/TV), and degree of anisotropy (DA)] (Odgaard, 1997; Bouxsein et al., 2010). BV/TV and Tb.Th parameters significantly account for the tissue stiffness and strength (Ascenzi et al., 2011). A higher DA was found to contribute to trabecular bone strength in the case of non-uniform stress by leveling out local strains (Bayraktar and Keaveny, 2004). However, a higher DA was also found in bone samples from donors who sustained a fragility fracture (Ciarelli et al., 2000). The connectivity and continuity of a trabecular network is another determinant of tissue stability (Mosekilde et al., 1987; Kinney and Ladd, 1998). It is noteworthy; however, that network connection density is a parameter independent of bone volume fraction or Tb.Th. From an ontogenetic perspective, the network connection density and the archetypal 3D plan are established early in development—around birth in humans (Roschger et al., 2001). After that the process of trabecular network coarsening continues until the stage of skeletal maturity (Ryan and Krovitz, 2006). Throughout adulthood, material texture undergoes further refinement, as seen by increased alignment of collagen fibrils and mineral crystallites along individual trabeculae (Roschger et al., 2001).
Unlike morphology, the study of forms and metric spaces of objects, topology is concerned with objects’ continuity, compactness, connectedness, boundaries, etc. These are the fundamental properties of objects that do not change with deformations, transformations, and scaling (Kahn, 1975). A network is defined as a set of nodes connected via a set of edges. A special class of networks is “partially connected networks,” in which nodes are connected only to adjacent nodes (neighbors), so that the network is fully connected without the cost of maintaining the maximal possible number of edges. Saha et al. (2000) paved the way for studying trabecular bone topology—the manner in which individual elements collectively form a 3D network—by suggesting a method of uncoupling trabecular morphology from the 3D organization of the axes, or centroids, of trabeculae in a sample (edges). The topological approach itself helps explain the mechanical properties and might well determine the 3D architectural blueprint, or archetype, of trabecular bone that has been optimized throughout evolution and allows for further functional adaptation (i.e., local Tb.Th, DA, and bone volume fraction being superimposed on topological parameters such as connectedness and continuity). Network regularity and network distortion stand apart from morphology (trabecular shape and size) and topology (trabecular network continuity and connectedness). Network regularity and network distortion, Jensen et al. (1990) showed that randomization of the regular lattice/network may decrease its stability by a factor of 5 or even 10, while the density (or connectedness) of the network is preserved. Although the authors clearly indicate that a regular artificial lattice is not equivalent to trabecular bone tissue, the network topology (i.e., connectedness) and network regularity (configuration of the network nodes) must be taken into account. From the engineering perspective, Deshpande et al. (2001) illustrates that the number of connections between the network-forming nodes is crucial for the network rigidity: in a 3D network with node connectedness exceeding 12, bending deformations are eliminated and the loading of the structure becomes stretching-dominated. This is an important observation, as most natural and artificial materials are at least an order of magnitude stronger when loaded axially (in tension or compression) in comparison to bending or shear (Wainwright et al., 1976). The high connectedness of the 3D network provides its rigidity by “triangulation” of interconnected elements. A complete triangulation, however, is incompatible with the shock-absorbing properties of the structure, and the latter is often desirable in biological materials (Deshpande et al., 2001). Hence, it might be reasonable to expect that the topological plan, or blueprint, of trabecular bone incorporates 3D architectural features that optimally combine both the stability of the 3D network and its physiological compliance.
Reznikov et al. (2016) introduced a new parameter for the analysis of μCT scans of trabecular bone, namely the inter-trabecular angle (ITA). The ITA is defined as the angles between two adjacent trabeculae emanating from the same node, and the angle is calculated for each pair of trabeculae connected at a node in the entire volume of interest. This parameter is, therefore, determined for a large number of pairs (typically, in 1 cm3 of trabecular bone tissue there are 10,000 to 40,000 ITAs).
Reznikov et al. (2016) studied different areas within the human proximal femur in adults of varying age and found remarkable similarities. First, the trabecular network is a partially connected network, which is reflected in the low connectedness of nodes. More than two-thirds of the nodes have three connecting trabeculae (three-neighbor node, 3-N), followed by one-quarter of all the nodes with four emanating trabeculae (four-neighbor node, 4-N) and about one twelfth of nodes with five connecting trabeculae (five-neighbor node, 5-N). The nodes of higher connectedness are sparse. Significantly, the proportions of 3-N, 4-N, and 5-N nodes are conserved between three areas within the proximal femur and among the individuals roughly as 12:4:1 or 10:3:1. Furthermore, the mean ITA values of nodes with three connecting trabeculae are close to 120° and nodes with 4 connecting trabeculae have a mean ITA close to 109.5°. Thus, ITA mean values are close to the angles that characterize threefold and fourfold symmetrical geometrical motifs with the maximal angular offset of the edges (Thompson, 1942). The prevalence of nodes with low connectedness and the mean ITA values typical of the maximal angular offset possibly indicate a compromise between minimizing of metabolic cost (or achieving sufficient shock dissipation) and maximizing sufficient network stability in multidirectional loading of trabecular bone tissue (Deshpande et al., 2001). Reznikov et al. (2017) have applied the ITA analysis approach to the study of functional adaptation of trabecular bone in the human calcaneus by comparing normal feet and museum specimens of feet subjected to foot binding (historical cultural practice of foot deformation). They found that while the anisotropy pattern in the calcaneus closely reflects the pattern of loading and follows the tensile and compressive force vectors, the aforementioned ITA parameters in the calcanei of the two groups were nearly identical.
We were surprised to find that the various ITA parameters are so similar in bones that fulfill different mechanical functions and are subjected to different loading regimes. The overall objective of this study is to better understand the biological factors that influence ITA properties. To this end, we carried out this follow-up study in which we (i) tested the validity of our custom written application for ITA analysis by using engineered space-filling lattices and a natural lattice; (ii) performed ITA analysis of pig proximal femora, as well as three different areas in the pig mandible, and compared them to the previously published ITA analysis of human proximal femora; and (iii) studied the spatial distributions of 3-N nodes in different regions within the pig mandibular condyle to determine whether or not topological parameters are affected by locally varying mechanical functions.
Materials and Methods
For details see Reznikov et al. (2016).
Materials
We analyzed selected parts of the mandible and the head of the femur (Figure 1) acquired from three mature 2.5-year-old domestic female pigs. The pigs were provided by Lahav C.R.O (Kibbutz Lahav, Israel). Pigs are considered to be a good non-human model for better understanding human skeletal and dental questions such as osteonecrosis of the femoral head, bone fractures, bone growth, and development, as well as for evaluating new dental implant designs (Buser et al., 1991; An and Freidman, 1998; Terheyden et al., 1999; Nkenke et al., 2003). While porcine bones in general have a denser trabecular network than human trabecular networks (Mosekilde et al., 1993), porcine bone shows similarities to human bone in terms of bone biology (modeling and remodeling), as well as bone mineral density (Mosekilde et al., 1993). The study was approved by Institutional Animal Care and Use Committee at the Weizmann Institute of Science. We also analyzed one cork specimen as an example of natural porous solid of non-animal origin that functions under different mechanical constraints and does not remodel. As examples of engineered 3D structures, we used two types of 3D-printed metal lattices. A rhombic dodecahedron honeycomb structure (here referred to as the D-lattice) in the form of a cylinder 15 mm in diameter and 15 mm in height, a strut thickness of 0.9–1.0 mm and the node connectedness was strictly configured by the design (unit cell of rhombic dodecahedron with three intersecting twofold axes) as 4-N, 6-N, and 12-N in an infinite array. This D-lattice contained about 1000 struts connected at 250 nodes, of which approximately 50% were partially truncated at the surface. The stochastic lattice (here referred to as the S-lattice) was also manufactured in a cylindrical shape of 15 mm in diameter and 15 mm in height, but contained a higher number (around 20,000) of fine connected elements of 150–250-µm thick. In the stochastic lattice, the nodes were randomly positioned in 3D and were stochastically interconnected to form a partially connected network with the average number of neighbors given as 4, as described by Ghouse et al. (2017).
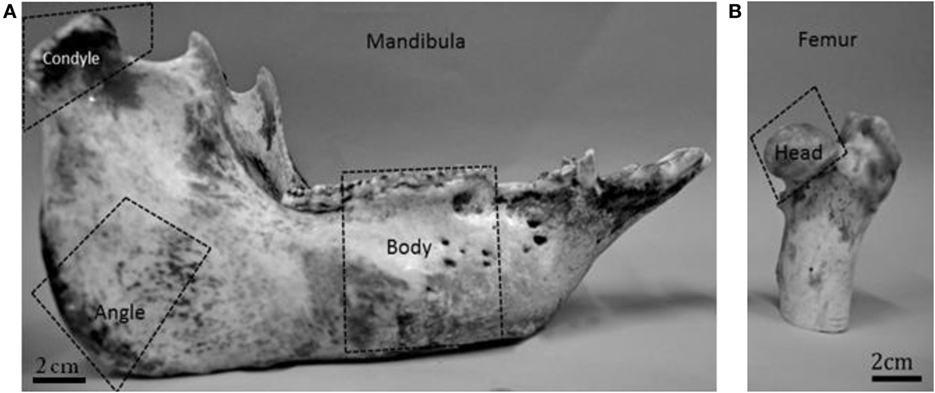
Figure 1. Domestic pig mandible (A) and the proximal part of the pig femur (B). The dotted lines indicate the areas that were selected for the analysis.
Methods
The fresh porcine mandibles were cut in half at the symphyseal region using a water cooled rotary diamond saw (Buehler, IsoMet 1000 Precision saw, USA). Each hemi-mandible was sectioned further to obtain three anatomically distinct areas, namely the mandibular condyle, the angle, and the body (Figure 1). For specimens P1 and P2 both the right and the left hemi-mandibles were analyzed. In the case of P3, only the right hemi-mandible was analyzed (Table 1). The proximal part of the femur from each pig was also examined.
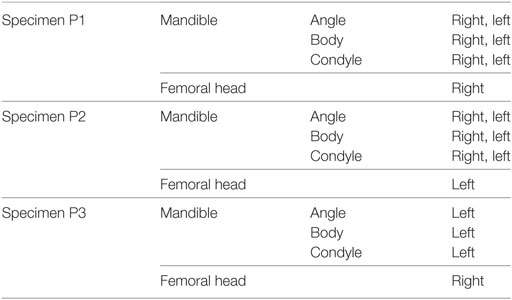
Table 1. List of examined parts from each of the specimens.
A cylindrical cork specimen of 5 mm in diameter was collected by trephine drilling of the outer bark layer (phloem) of a cork oak, Quercus suber, in the direction perpendicular to the trunk natural surface. The cork specimen was not further modified. The engineered lattices were created using computer-aided design software Rhinoceros 5.0 (McNeel Europe, Barcelona, Spain) and 3D-printed using selective laser sintering of commercially pure titanium (Renishaw AM250, Renishaw Additive Manufacturing, UK) for an unrelated study.
Micro-CT Analysis
The bones were scanned using a micro-CT (Micro XCT-400, Zeiss X-ray microscopy, CA, USA) at 40 kV and 200 mA with a voxel size between 38 and 42 µm. The voxel size variability was due to minor differences in specimen sizes. For optimal resolution, the voxel size was selected in such a way that the average Tb.Th would incorporate at least five voxels. Once the scans were reconstructed, the cortical shell surrounding the trabecular interior was digitally removed in each of the selected parts (Avizo, FEI, OR, USA). In the case of the mandibular body, both the cortical shell and the teeth were removed digitally.
The cork specimen was scanned using the same set up with the voxel size of 0.8 µm for the same consideration of having each structural element resolved with at least five voxels. No artificial contrasting of the cork sample was performed. The engineered lattices were imaged using Nikon Metrology HMX ST 225 scanner (Nikon, Tring, UK), tube peak voltage 180 kV, and current 170 mA. The voxel size was the same as for bone samples, 38 µm.
Calculation of the ITA
Following the protocol described in detail by Reznikov et al. (2016), the reconstructed 3D images of all specimens were converted to a continuous networks of edges of one voxel thickness, using a skeletonization (thinning) algorithm (Fiji, Skeletonize3D plugin http://fiji.sc/Skeletonize3D) (Lee et al., 1994) (Figure 2). The resulting network of edges was analyzed further using the AnalyzeSkeleton plugin, Fiji, http://fiji.sc/AnalyzeSkeleton (Arganda-Carreras et al., 2010). The output of AnalyzeSkeleton is a set of vectors (hence referred to as “edges”) represented by (x, y, z) coordinates of start points and end points. The junctions of three or more edges were defined as “nodes.” The matrices of edge coordinates were analyzed using the ITA application in Matlab R2015b (MathWorks, USA). The application identifies the type of each node by the number of edges emanating from it and classifies the nodes into categories of 3-N, 4-N, 5-N, or more. The ITA value is calculated for each pair of connected trabeculae and the distributions of many ITA values are reported separately for each node type. Very short edges (<5 pixels for all samples or 35 pixels in the coarse D-lattice) between two closely positioned nodes were replaced by a single node because such edges were shorter than the average Tb.Th. Short edges not connected at one end, which result from the skeletonization of oddly-shaped trabeculae, were also removed following the same principle of being shorter than the average Tb.Th in pixels. The abundance of different node types and the corresponding ITA distributions were exported in Excell (Microsoft, USA) and plotted.
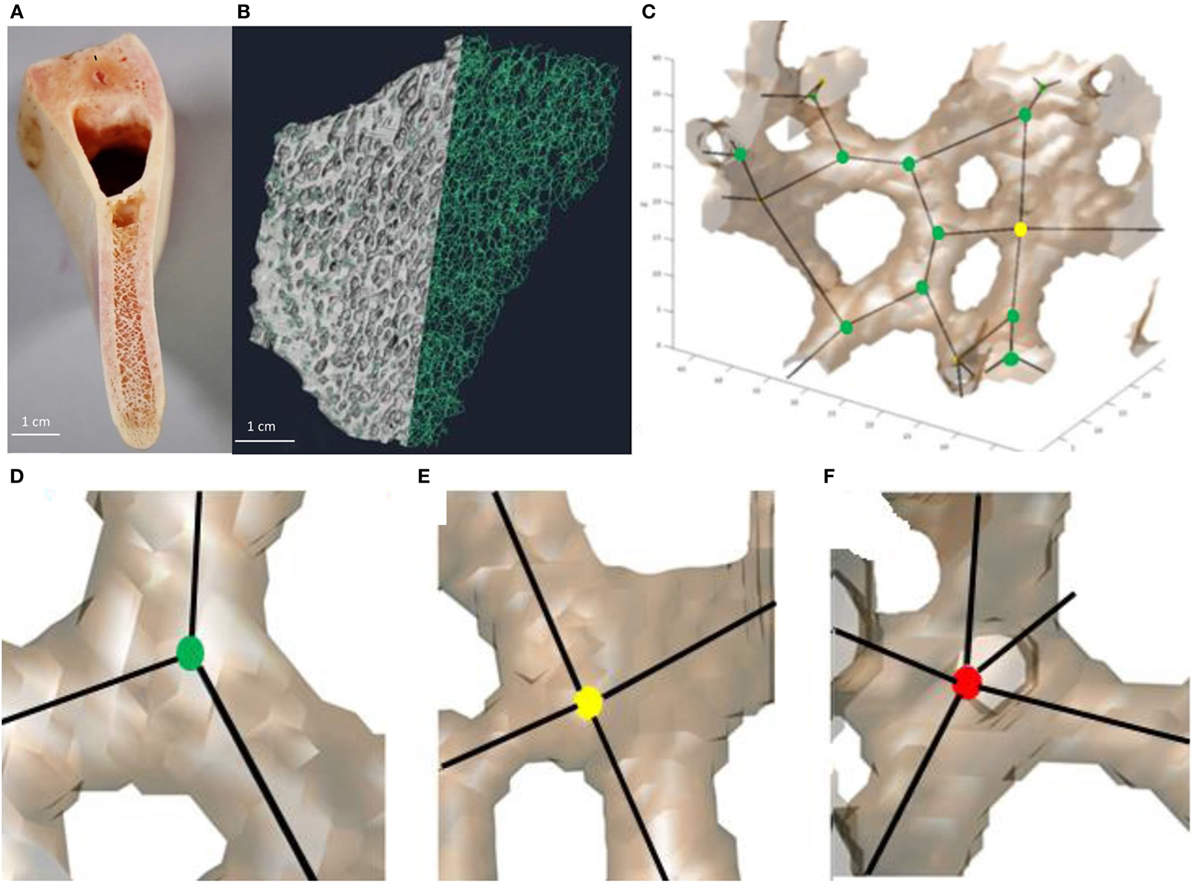
Figure 2. Workflow of bone analysis using inter-trabecular angle application. (A) Fragment of the pig mandible that shows the trabecular interior of the mandible body. (B) Smaller fragment of trabecular bone in which trabeculae on the left-hand side were replaced by thin lines (edges, referred to as skeletonization). (C) Group of connected trabeculae with straight edges and nodes inscribed. (D–F) Examples of nodes with different connectedness: (D) 3-N node, (E) 4-N node, and (F) 5-N node.
The ITA application for Matlab 2015b is available at the following link: http://www.weizmann.ac.il/Structural_Biology/Weiner/ita-app.
Node Planarity Analysis
The previously reported angular offset between the edges of 3-N nodes suggests that many of them are planar: it is impossible to spread three connected edges by 120° without confining them to a single plane. However, while all maximally offset 3-N nodes are planar, not all planar nodes necessarily have their edges maximally offset (for illustration as in the planar capital letter “T,” compared to “Y”). Since the ITA distribution of 3-N nodes was rather broad (i.e., incorporating ITA values smaller or larger than 120°), the actual confinement of 3-N nodes to planes was analyzed. An auxiliary plane was constructed through three points on each of the three edges. Each point was located at the same unit distance from the node. We define planarity by the angle between the edges and this plane (which is the same for all three edges). We refer to a “planar” node as a 3-N node with an average angle between connecting trabeculae and the auxiliary plane of less than 4°. Non-planar nodes for this study are defined as those with an average angle of more than 20°. Next, we mapped and quantified the spatial distributions of planar and non-planar 3-N nodes in the pig mandibular condyle. We compared the number of nodes and their types per unit volume in different regions in the mandibular condyle.
Analysis of the Spatial Distributions and Orientations of the Planar and Non-Planar 3-N Nodes in the Head and Neck of the Condyle
The coordinates of the 3-N planar (within 4° of being perfectly planar) are compared to 3-N nodes that are distinctly non-planar. We, therefore, chose nodes in which the angle between the plane and the edge is greater than 20°. Each of the examined 3-N nodes (planar and non-planar) was also plotted in 3D space as a reciprocal vector perpendicular to the auxiliary plane that was used to define the planarity. Visualization of the vectors in 3D was done in Avizo (Avizo, FEI, OR, USA). The 3D volume of reciprocal vectors was anatomically aligned. In this orientation, the medial pterygoid muscle is approximately in the anterior-superior to inferior-posterior direction. A snapshot image of the vectors was recorded in this anatomical position. All images were then analyzed using the ImageJ (Fiji) fast Fourier transform (FFT) application. The FFT pattern of aligned elements creates a streak, the definition of which is proportional to the extent of alignment of these elements and the direction of which is orthogonal to that of the aligned elements. Therefore, the orientation of a well-defined streak in an FFT is reciprocal to the plot of the planarity vectors and, thus, coincides with the orientation of the planes of the 3-N nodes.
Analysis Using the Morphometric Bone Structure Parameters
For this type of analysis the plugin BoneJ in ImageJ (Fiji) application was used (Doube et al., 2010). All examined regions of interest were of equal volume. For each volume we calculated the bone volume fraction (BV/TV), mean trabecular separation (Tb.Sp), mean Tb.Th, and DA. DA is a measure of preferential orientation of substructures in a volume http://bonej.org/anisotropy (Odgaard, 1997).
Results
Validation of the ITA Application
Engineered 3D Lattices
Rhombic Dodecahedron Honeycomb Structure (D-Lattice)
The rhombic dodecahedron honeycomb structure design (Figure 3A) includes only even-edge nodes (such as 4-N and 6-N) by design. The odd-edge nodes are at the periphery of the specimen and are due to cropping of the infinite lattice to the cylindrical shape. The algorithm detected the mean angle of 4-N nodes as 106° (expected 109.5°) and the mean angle of 6-N nodes as 88° (expected 90°). The observed ITA distributions are sharp (Figures 4A,B). Some broadening of the peaks at their base results from the lattice truncation, from the minor imperfections of 3D-printing and of the skeletonization process. Analysis results show that the volume contains 246 nodes, while the expected number is 250. The expected number of intact 4-N nodes is 33% and the measured number is 39%. The expected number of intact 6-N nodes is 10% and the measured number is 13%. The number of expected truncated nodes (located at the specimen surface) is 50% and their measured number (the sum of 3-N, 5-N, and others) is 48%. Figure 4 shows that the ITA software does calculate the most frequent angle for the 4-N and 6-N nodes very close to the designed values. Since the features identified by the ITA application are either in agreement with the design or can be fully explained by the surface cropping, we conclude that the ITA software faithfully identifies the node connectedness and correctly calculates the ITA angles. It is noteworthy that the angles detected by the application were consistently several degrees smaller than those of the in silico design.
Figure 3. Three-dimensional structures that were used for ITA validation, as reconstructed μCT images. (A) Dodecahedron-based metal lattice (D-lattice). (B) Stochastic metal lattice (S-lattice). (C) Cork viewed in the same plane as the natural surface of the tree, note hexagonal honeycomb-like structure in that projection. (D) Cork viewed in the radial direction. Note preferential alignment of cells in that projection.
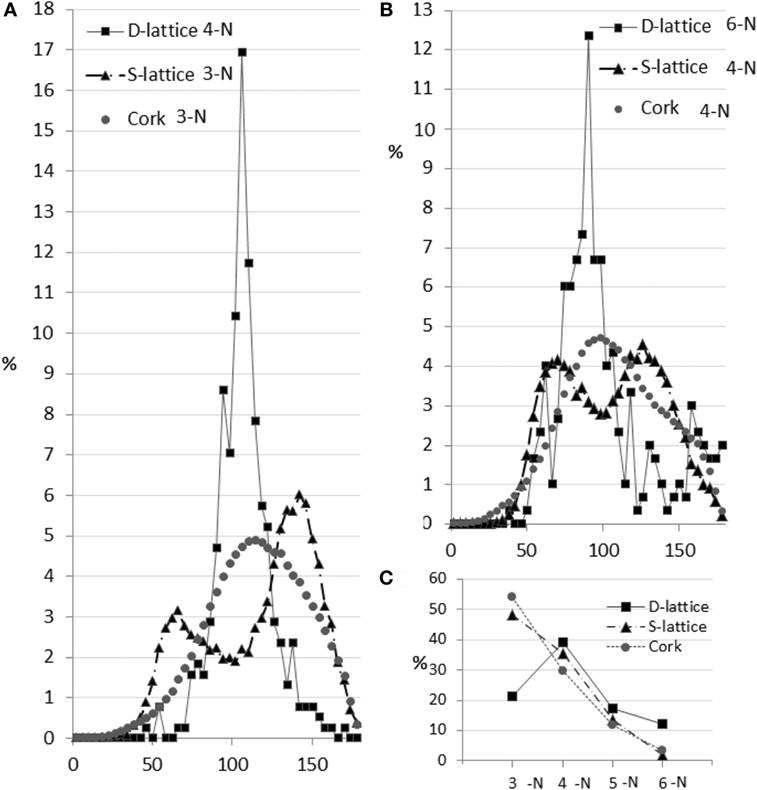
Figure 4. Topological characteristics of the three examined structures. Panel (A) shows ITA distributions of the most abundant node (4-N in D-lattice and 3-N in S-lattice and cork). In the D-lattice, the distribution is very narrow, reflecting the fact that this is a designed configuration. In the S-lattice the ITA distribution forms two distinct peaks, one at 60° and another, twice as tall, at 150°. Since the sum of such angles is 360°, these 3-N nodes are planar, but do not possess maximal offset of the edges. In cork, the ITA distribution is unimodal, centered around 116° and, therefore, these nodes in cork approximate a planar shape. Panel (B) shows the ITA distributions in the second most abundant nodes for three test samples. D-lattice demonstrates a narrow peak centered as expected based on its design. Note the higher count of ITA at the large angle values (explained in the Section “Discussion”). The S-lattice has a bimodal distribution with equal counts of values around 60° and 120°, which is consistent with a planar structure with non-uniform offset of edges. The cork ITA distribution is similar to bone in shape and width and centers around 107°. That is indicative of the maximal angular offset. Panel (C) shows the node abundance as a function of the number of neighbors. The cork trend decays exponentially and is similar to bone; the S-lattice node abundance decays linearly; the D-lattice trend is consistent with the design and the surface cropping effects.
Stochastic 3D Lattice (S-Lattice)
The S-lattice is shown in Figures 3B. As per the original design, the average network connectedness was found to be 4; the abundance of nodes declines as the number of their neighbors increases. The ratio of nodes 3-N:4-N:5-N was approximately 4:3:1, which is different from 8:3:1 typically seen in bone. Both 3-N and 4-N nodes generated bimodal ITA distributions. The peak values in these distributions suggest planar node configuration: 3-N nodes resemble the capital letters “Y” (mean angles centered around 60° and twice as abundant around 150°, that sum up to 360°); 4-N nodes resemble the capital letter “X” (equal height of two distributions centered around 60° and 120°, that in the case of four angles sum up to 360°). The angles that were previously reported for trabecular bone and formed unimodal distributions were not identified. Moreover, the presence of bimodal distributions indicates that the principle of maximal angular offset for a given number of connected elements is not observed in the S-lattice. The higher connectedness of the network and the defiance of the maximal angular offset principle may indicate that there is either no metabolic cost pressure to form a “simpler” network, and/or there are no mechanical requirements for more pronounced stress dissipation within the structure, as indeed could be expected from an artificially produced construct. We, therefore, conclude that the software is sensitive to network connectedness and differences in node configurations in 3D.
Cork
Cork is a component of the cork oak bark (Quercus suberus). Cork is a tough protective dead tissue, impermeable to gases and water. The honeycomb structure of cork is very fine compared to trabecular bone with an average cell wall thickness around 4–5 µm and cell size about 20–30 µm. Cork is an anisotropic structure: when viewed along the radial direction with respect to the tree trunk, a hexagonal honeycomb structure is apparent; when viewed in the tangential direction with respect to the tree trunk, the preferred radial alignment of the cell walls is clearly visible (Figures 3C,D). Although cork is a plant tissue with the size of its elements at least 20 times smaller than in bone, its ITA analysis demonstrates high similarity to bone 3D organization, namely the relatively low network connectedness and similar distributions of the ITA values. Although the node abundance declines with the increasing node connectedness, the trend is less pronounced than in trabecular bone, with the ratio of 5-N:4-N:3-N nodes being 6:3:1. This indicates a somewhat higher network connectedness than in trabecular bone, although lower than in the engineered stochastic lattice.
ITA Analysis of Pig Mandibles and Femora: Possibility of Adaptation at the Topological Level
Node Abundances and Proportions
Figure 5 shows the abundances of the different node types for the pig mandible samples and the pig femoral head. In general, the proportions of the 3:4:5-N nodes are similar to those reported for the human femur, such as 10:3:1.
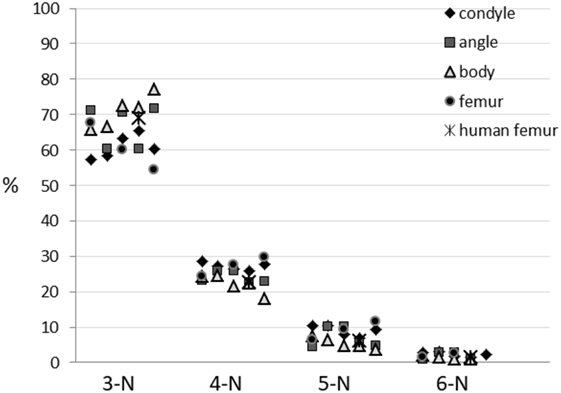
Figure 5. Abundances of different nodes types in the examined areas of the pig mandibular condyle (five specimens), mandibular angle (five specimens), mandibular body (five specimens), pig proximal femur (three specimens) and human proximal femur [average of five specimens is taken from Reznikov et al. (2016)].
Figure 6 shows the ITA distribution values for each of the three most abundant node types in bins of 4° for the pig samples. The abundances (in percent) of ITA values (in degrees) are plotted after normalizing to the total number of measurements, which were between about 3,000 (for the least abundant node) and about 110,000 (for the most abundant node) for each volume analyzed. Reznikov et al. (2016) estimated the errors for the 3-N, 4-N, and 5-N bins. The largest error for samples with about 3,000 nodes is around 20%. We, therefore, conclude that the ITA distributions of the different porcine samples are remarkably similar to each other, and TO TH to the human femoral heads.
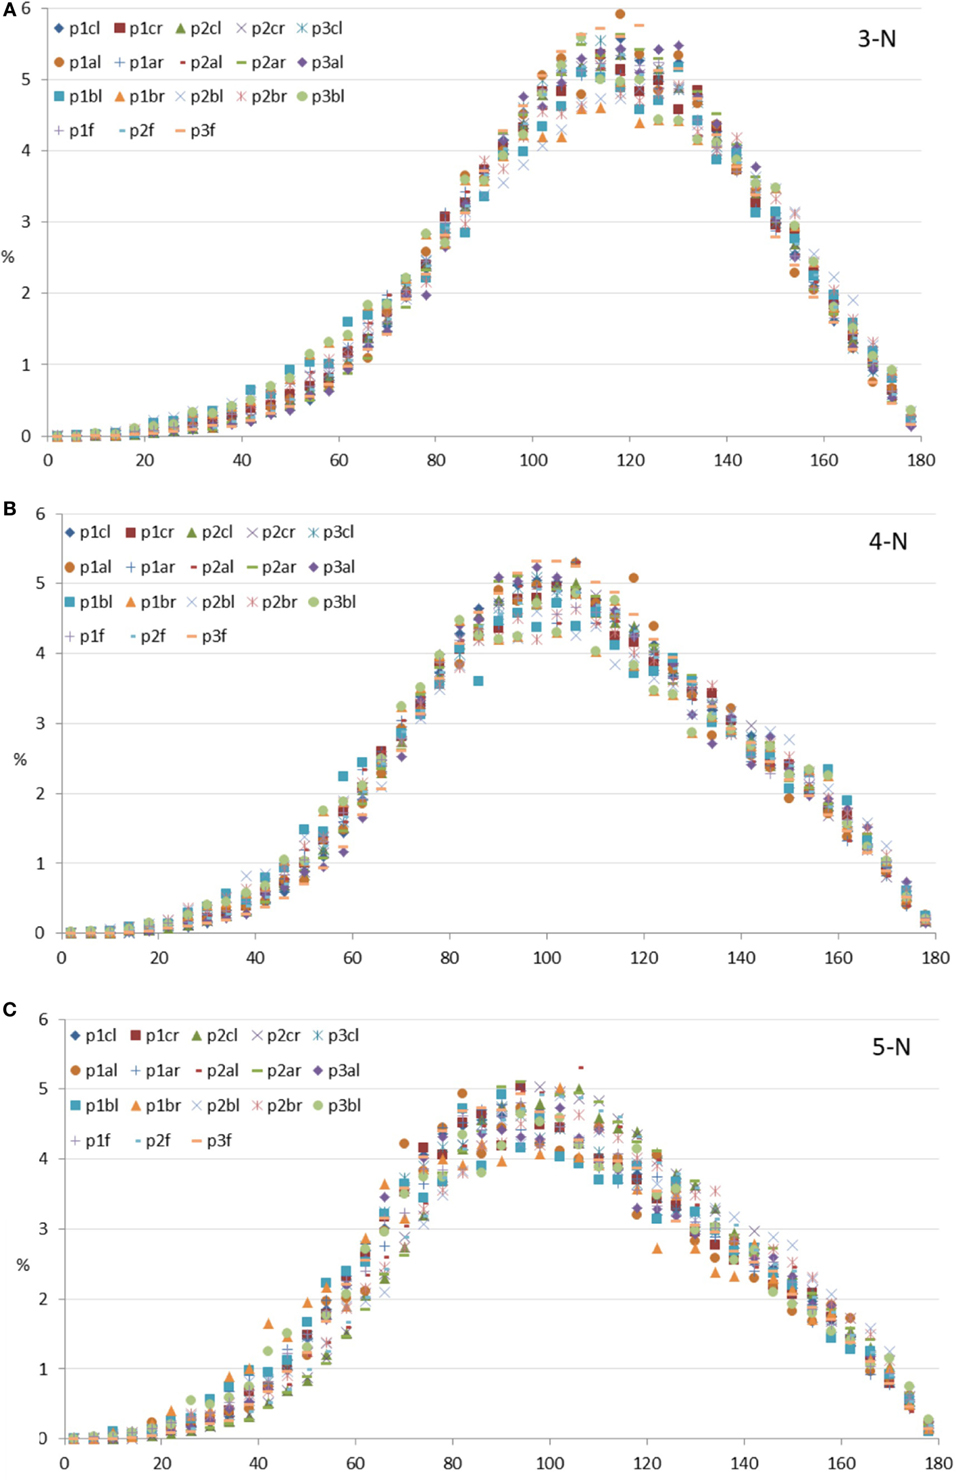
Figure 6. Inter-trabecular angle (ITA) distributions of all specimens measured per node type. Frequencies of binned ITA values are given in percent of the total number measured; horizontal axes show ITA values in degrees. (A) 3-N nodes; (B) 4-N nodes; (C) 5-N nodes. Legends: first row, all condyles; second row, all mandibular angles; third row, all mandibular bodies; fourth row, all pig femoral heads.
We also calculated the mean ITA distribution values for all the pig samples analyzed (Table 2). These mean values are plotted for the different node types in Figure 7 where they are also compared to the human femoral heads. Again the differences are small. We also note that about one-third of all the ITA values in each distribution falls within 10° on either side of the mean. In other words, ±10°, on either side of the mean values represents a third of all the values of a sample.
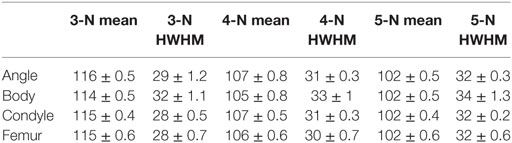
Table 2. Mean values of ITA distributions per node type, averaged for the samples measured and half width at half maximum (HWHM) of ITA distributions per node type, averaged for the samples measured.
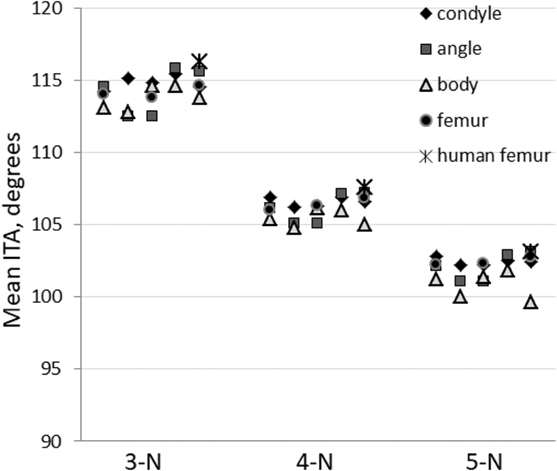
Figure 7. Inter-trabecular angle mean values for the three most abundant node types. All measurements are presented: five values of porcine mandibular condyle, angle and body and three values for porcine proximal femur. Human proximal femur values are averaged (five individuals) and shown for reference (Reznikov et al., 2016).
All the above observations clearly show that the ITA value abundances and distributions are remarkably similar when comparing the different regions within the pig mandible, the pig femoral head and the human femoral head (Reznikov et al., 2016). These ITA characteristics are, thus, conserved between two different bones and two different mammals: pigs and humans. We do, however, note that based on the validation tests that we performed this conclusion is well substantiated for rod-shaped trabeculae, but because of the inherent difficulties of obtaining reliable skeletonization products for flat objects (Stauber and Müller, 2007), this conclusion may be biased to some unknown extent against plate-shaped trabeculae. We do, however, note that in the case of the cork sample, which is inherently platy as it consists mainly of cell walls, only about 12% of the edges were not connected and hence eliminated. Such unconnected edges mainly arise due to the skeletonization of plate-shaped elements. So we expect the bias in the bone samples after eliminating unconnected edges mainly from plates, to be less than 12%.
ITA Analysis of 3-N Nodes in the Mandibular Condylar Head and Neck
As distinct parts of the mandible are subjected to different loading patterns, we expected these differences to be reflected in the spatial distributions of the nodes within the trabecular network. We, therefore, chose to carry out a site-specific study of node spatial distributions in the condylar head and neck, as the head is subjected to strains mainly in the sagittal plane as part of the temporomandibular joint (TMJ; Liu and Herring, 2000a,b; Herring et al., 2002).
Node Distributions within the Mandibular Condyle
The head and the upper part of the neck of the condyle of specimen P1 is shown in Figure 8. The dotted line shows the anatomical boundary between the head and the neck (Figure 8A), P1 condyle showing only the outer surfaces. The nomenclature for orientation is also shown. The arrows show the directions of the prevailing principal stresses following Liu and Herring (2000a,b). Sagittal section of P1 condyle is represented in Figures 8B, the white dots show the 3D distribution of all the 3-N nodes (Figures 8C). All the nodes in the volume are projected onto one plane. This projection shows that there are more 3-N nodes closer to the articular surface of the condylar head as compared to the other areas.
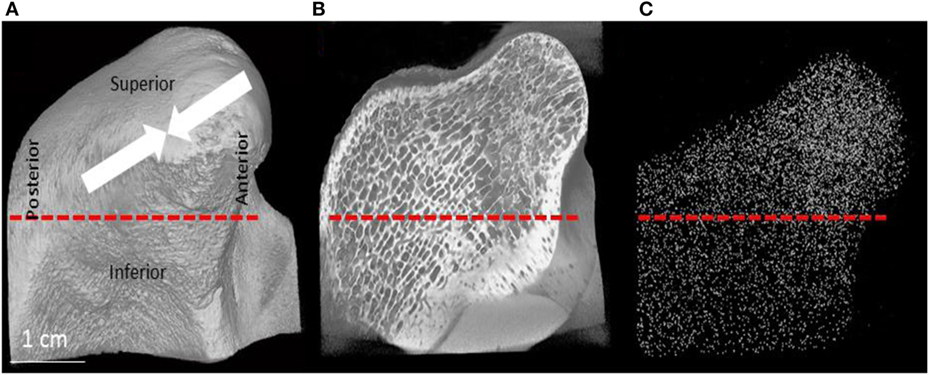
Figure 8. (A) μCT image of the condylar head and neck of the pig. The arrows show the major compressive stress trajectories, as shown by Liu and Herring (2000a,b). (B) Section through the 3D μCT image of the condylar head and neck and (C) is a plot of the locations of all the 3-N nodes in the whole volume of the scan projected onto this plane. (C) Visually demonstrates that there are more 3-N nodes in the condylar head as compared to the neck.
In order to obtain quantitative data on the density of the nodes in different regions, we analyzed the number of nodes per unit volume in the articular portion of the condylar head and compared this value to the number of nodes in the same volume in the condylar neck. The same selected equal volumes taken from the head of the condyle and the neck were used for evaluating mean Tb.Th and separation, trabecular volume fraction and the DA. Table 3 combines these morphometric parameters with the results of the topological analysis. It shows that the total number of nodes per unit volume in the articular portion of the condylar head is between 2.0 and 2.6 times higher than in the condylar neck. This is consistent with the visual presentation of the 3-N nodes in the condylar head and neck. As it is also visually clear, the trabecular meshwork is finer in the head than in the neck of the condyle. There are also proportionately more 4-N and 5-N nodes compared to 3-N nodes in the head compared to the neck, which is consistent with the higher network connectedness.
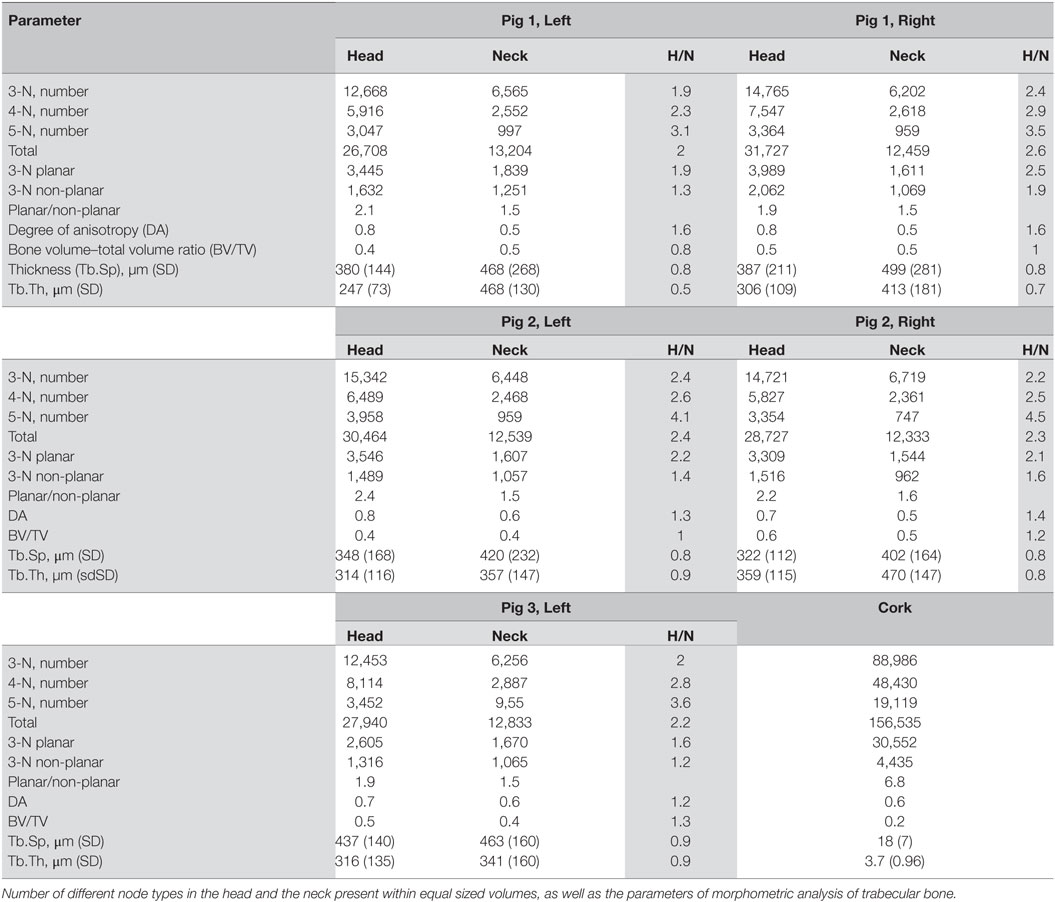
Table 3. Morphometric and topological parameters in the trabecular network of the pig mandible, condylar head (H), and neck (N), and their ratio.
Alignment of Planar 3-N Nodes in the Condyle Head
We calculated the planarity of the 3-N nodes in all the pig samples analyzed here (Figure 9). Thirty to 35% of the 3-N nodes are within 4° of being perfectly planar. A similar observation was made for human femoral heads (Reznikov et al., 2016).
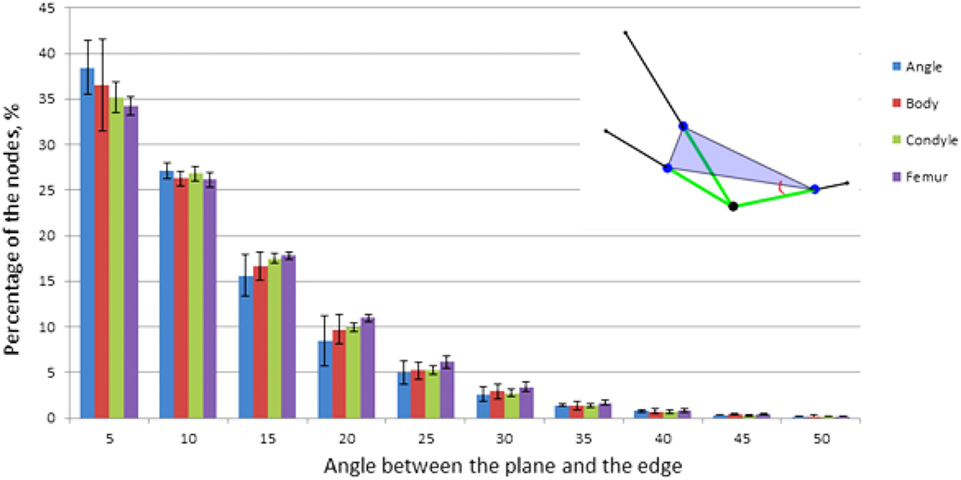
Figure 9. Planarity of 3-N nodes. Percentage of nodes is plotted versus the angle between one of the edges and the plane. Insert: the measured angle, red; auxiliary plane, purple; edges, green.
Since the condylar head of the pig mandible demonstrates a higher content of planar nodes along with the higher DA, we plotted the orientation of the planar 3-N nodes in the condyle in the same projection, as shown in Figure 8, which means in the direction of principal stresses. In Figure 10, the planes of planar 3-N nodes are shown by reciprocal vectors, perpendicular to those planes. Fast Fourier transform is generated from the image of the vectors and, also reciprocally, illustrates the co-alignment of vectors. Figure 10 show that the vectors from the planar 3-N nodes do have a preferred orientation. The preferential orientation of the planar nodes, as revealed from the FFT, is aligned parallel to the principal directions of loading shown in Figure 8A.
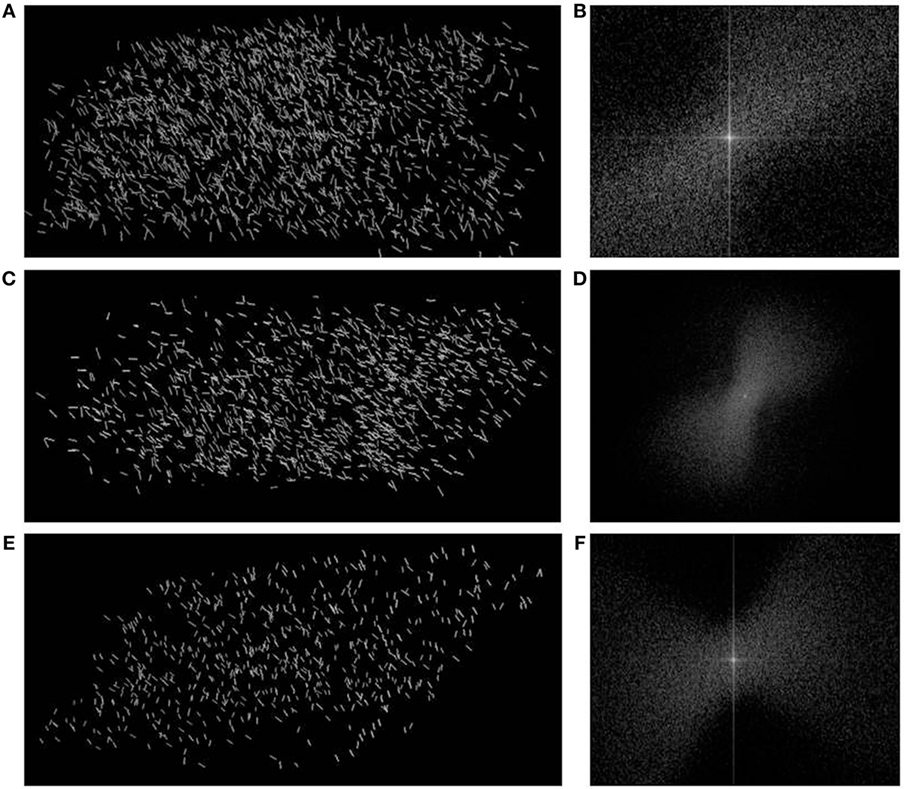
Figure 10. Vector orientations of the 3-N planar nodes from specimen P1, P2, P3 represented in the right part of the figure (A,C,E) and the FFT analyses of images are represented in the left side (B,D,F).
Discussion
Here, we show that the node abundances, the angular distributions, and mean ITA values in three different parts of the pig mandible and the pig proximal femur are principally similar to other previously analyzed bone samples [of the human proximal femur (Reznikov et al., 2016) and two differently loaded groups of human calcanei (Reznikov et al., 2017) in terms of node type proportions and the maximal angular offset of connected elements]. These results, therefore, clearly show that ITA values are conserved even between species from different mammalian taxonomic groups and between bones that carry out different mechanical functions. We, therefore, conclude that the topological parameters reflect functionally important aspects of trabecular bone structure.
ITA Analysis Validation
The results of the validation of ITA analysis show that for a reticulate network comprised of rod-shaped elements (“trabeculae”) with known ITAs, the software accurately calculates the abundance of node types, accurately detects the mean ITA angles incorporated by design and realistically estimates the number of nodes truncated at the edges and their 3D configurations. Furthermore a stochastic reticulate structure produces distributions totally different from those reported for trabecular bone by Reznikov et al. (2016), showing that the software does not generate the same result regardless of structure.
In natural structures, as opposed to engineered structures the mean ITA values tend to be very close to angles in symmetrical geometric motifs, i.e., 120° for 3-N nodes and 109° for 4-N nodes. In these symmetrical motifs, the connecting edges are offset as far as possible from each other. In this way, the trabeculae can optimally cover 3D space with the least number of connecting elements. Together with the prevalence of simple nodes in the partially connected network, this results in an optimized combination of minimal metabolic cost of the structure and maximal stability to multidirectional loading. The width of the ITA distributions accounts for inherent irregularity of biological structures. Interestingly, both living animal tissue (bone) and dead plant tissue (cork) follow the same principles of network simplicity and maximal volume spanning, despite the different size scale of their networks. This observation stems from the fact that the ITA application analyzes topological determinants of the structure, uncoupled from their size, shape, and global orientation. Since the results obtained from the cork sample were close to the ITA parameters observed in bone, one sample of cork was deemed sufficient for validation. This observation, however, requires a thorough study of plant tissues and other similar biological lattices.
ITA and Functional Adaptation
We noticed that as the number of node neighbors increases, the ITA distributions become skewed: the 3-N distribution can be accounted for with a single Gaussian curve, as is expected from a natural continuous distribution of independent values. The distributions of 4-N and 5-N nodes, however, require a minor Gaussian curve in the region of high ITA values, for a satisfactory coefficient of determination (Figure 11). The contribution of the minor Gaussian curve is higher in the case of the 5-N distribution (the height of the minor peak is 25% from the height of the 4-N general distribution, and the height of the minor peak in the 5-N distribution is around 40%). A probable explanation for the presence of the minor Gaussian curves could be that the application detects not only the angles between the near branches of a node but also between remote branches in the same node of high connectivity. Indeed, in Figures 4B, the plot of the D-lattice demonstrates higher values in the region 150–180°. This is a plot of 6-N nodes. In a 6-N node of perfect threefold symmetry all 6 edges are oriented at 90° to one another and form 12 right angles between the near edges. However, there are also 3 angles of 180° between remote edges of the same node. Nodes of three neighbors can have only three near-edge angles; 4-N nodes also can have only near-edge angles (as it has six possible pairs of near edges between which an angle can be measured). However, a 5-N node necessarily incorporates one angle between remote edges, along with nine pairs of near edges. Therefore, starting from the node complexity N-5 or higher, a bimodal ITA distribution can be expected, in which the major peak corresponds to the mean angle for pairs of near edges, and the minor peak corresponds to the angle for the only pair of remote edges. The minor peak position can be expected close to 180°. The fact that in trabecular bone ITA distribution the minor Gaussian peak is present to some extent in the 4-N ITA distribution can be possibly explained by life-long bone remodeling, when some nodes may lose one of their original branches.
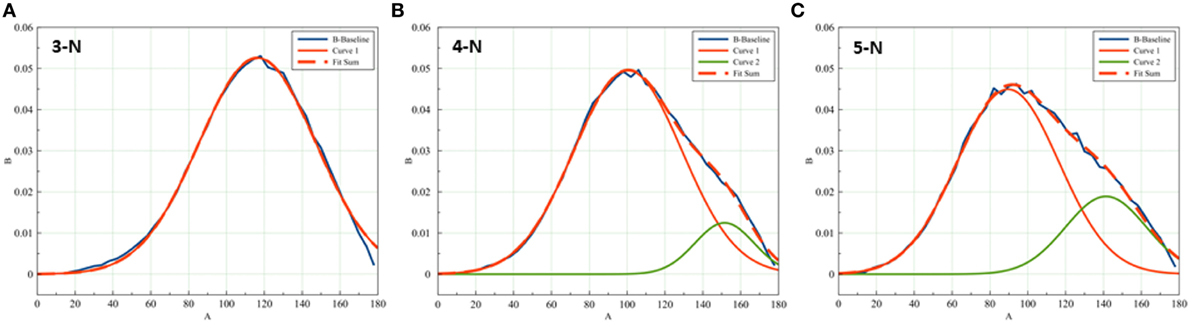
Figure 11. Skewness of the ITA distribution increases with node connectedness. While (A) 3-N distribution can be fitted with a single Gaussian distribution, the distributions of (B) 4-N and (C) 5°-N ITA values require a minor Gaussian curve for a good fit. The minor distributions center around 150–160°.
The finding of highly conserved ITA properties may seem to clash with the well-established connection between trabecular bone texture and function. This connection was originally described in the work of Julius Wolff, who suggested that individual trabeculae of the proximal human femur are aligned along the principal stress directions (Wolff, 1892). Many studies examined this premise (Enlow, 1968; Bertram and Swartz, 1991; Currey, 2012), including several experimental studies that directly demonstrate this connection. Studies of trabecular bone in the knee joint of guinea fowl showed that the fine trabecular bone in the distal femur has a high degree of correspondence between the changes in joint angle and trabecular orientation (Pontzer et al., 2006). A study of the distal radius in a sheep model also supported the finding that trabecular bone adjusts and realigns in response to change in loading direction (Barak et al., 2011). The study of the calcaneus in normal and deformed human feet shows that consistent long-term loading results in the formation of a reproducible anisotropy pattern of trabecular bone. However, there is no real conflict between the fact that bone is capable of functional adaptation and the invariance of the ITA parameters in the analyzed samples. The difference between the traditionally analyzed morphometric parameters and the topological parameters reported here is that the ITA analysis is blind to the local thickness and form of the elements and only considers the trabecular network determinants. The universal topology of a trabecular network can be viewed as the 3D archetype on which various changes in size and shape can be superimposed. Thus, the topology observed in trabecular bone can adopt a multitude of different texture parameters such as increase in Tb.Th, without negating the principles of network simplicity and maximal spanning of the 3D space.
A detailed comparison of the nodes within the condylar head and neck did, however, reveal an alternative form of adaptation that does not involve trabecular shape, but also does not breach the topology. A higher DA was identified in all five condylar heads analyzed, in comparison with the condylar neck. Along with that the average Tb.Th and its SD are consistently lower in the condylar head, and the trabecular spacing and its SD are also lower. These observations are in accord with a finer and denser network. In addition, the total number of nodes and the proportions of 4-N and 5-N nodes were higher in the condylar head than in the condylar neck, further indicating that the fine trabecular network of the condylar head is densely connected. One way to achieve a higher DA is by network coarsening and thickening of the trabeculae that are co-oriented with the principal stress trajectories (Ryan and Krovitz, 2006). But the opposite is observed in the fine and densely connected network of the condylar head. Significantly, the ratio of planar 3-N nodes to non-planar 3-N nodes is consistently larger in the head than in the neck. Moreover, the orientation of the planes of these flat 3-N nodes was found along the physiological stress trajectory. Therefore, the higher anisotropy can be achieved by local transformation of the network elements that does not amend the general topology, but also allows retaining the scale and shape of the network elements.
The mandibular condyle is one of the components of the TMJ. The condylar head is subjected to forces in well-defined directions (Liu and Herring, 2000a,b; Herring et al., 2002; Cornish et al., 2006) as this is a paired joint that has limited freedom around the sagittal or vertical axes, and primarily allows movement around the transverse axis. Since consistent and repetitive loading of bones results in increasing their anisotropy, the structure of trabecular bone in the condylar head is expected to adapt accordingly, consistent with our results and with previous studies (Gosen, 1974; Hekneby, 1974; Teng and Herring, 1995; Kim et al., 2013). Interestingly, the higher anisotropy in the condylar head is achieved by transformation of the network motifs (preferred orientation of the planar 3-N nodes), and the fine scale of the network remains unaltered. We speculate that the biological rationale for that might be the preservation of a higher compliance of the fine trabecular tissue. Indeed, increased anisotropy combined with higher bone volume density provides the highest stiffness of trabecular bone (Maquer et al., 2015). On the other hand, it was shown that higher stiffness of trabecular bone is associated with degenerative disease of articular cartilage (Li and Aspden, 1997a,b; Hurwitz et al., 2001). We also speculate that increasing trabecular bone anisotropy by network transformation (and not by trabecular coarsening and stiffening in certain orientations) might be Nature’s strategy to preserve articular cartilage from untimely wear and tear. This observation opens new insights into two important problems in bone research, namely joint degeneration (perhaps, adaptation to stereotypical loading by increased anisotropy with trabecular network coarsening, rather than co-alignment of some topological elements) and bone fragility (i.e., inability to stably cope with loads low in magnitude, but unusual in direction).
The analysis presented here certainly pertains to rod-shaped trabeculae; its validity with regard to plate-shaped trabeculae needs to be studied, as the skeletonization procedure currently used in our ITA analysis code may have some difficulties in properly identifying and separately representing plate-shaped trabeculae. Analysis results will, therefore, be more valid and mechanically significant in those instances where the majority of the trabeculae are rod shaped, like the bodies of vertebrae (Parkinson and Fazzalari, 2013).
Conclusion
The ITA application reliably detects the topological characteristics of natural and artificial 3D structures.
The ITA parameters are remarkably conserved between two mammalian species and between different bones.
In the TMJ and the mandibular condyle, where conflicting requirements for higher anisotropy and finer network co-exist, the topological level of functional adaptation is preferential, as reflected by co-alignment of planar 3-N nodes.
Ethics Statement
The study was approved by Institutional Animal Care and Use Committee at the Weizmann Institute of Science.
Author Contributions
Design the study—YB-Z, NR, RS, and SW. Performed the study—YB-Z. Analyzed the results—YB-Z, NR, RS, and SW. Wrote the manuscript—YB-Z, NR, RS, and SW. YB-Z and NR had equal contribution to the paper.
Conflict of Interest Statement
The authors declare that the research was conducted in the absence of any commercial or financial relationships that could be construed as a potential conflict of interest.
Acknowledgments
We thank Dr. Vlad Brumfeld, Ms. Victoria Tarle, Ms. Hila Chase, and Ms. Maria Pierantoni for their invaluable help in this project. We thank Mr. Shaaz Ghouse, Imperial College London, UK, for kindly providing the 3D-printed honeycomb lattices for validation of the ITA algorithm. This research was supported by the ISRAEL SCIENCE FOUNDATION (grant numbers 29/12 and 875/15). SW holds the Dr. Walter and Dr. Trude Borchardt Professorial Chair in Structural Biology.
References
Allen, M. R., Gineyts, E., Leeming, D. J., Burr, D. B., and Delmas, P. D. (2008). Bisphosphonates alter trabecular bone collagen cross-linking and isomerization in beagle dog vertebra. Osteoporos. Int. 19, 329–337. doi: 10.1007/s00198-007-0533-7
An, Y. H., and Freidman, R. J. (1998). Animal Models in Orthopaedic Research. Boca Raton, FL: CRC Press.
Arganda-Carreras, I., Fernández-González, R., Muñoz-Barrutia, A., and Ortiz-De-Solorzano, C. (2010). 3D reconstruction of histological sections: application to mammary gland tissue. Microsc. Res. Tech. 73, 1019–1029. doi:10.1002/jemt.20829
Ascenzi, M.-G., Hetzer, N., Lomovtsev, A., Rude, R., Nattiv, A., and Favia, A. (2011). Variation of trabecular architecture in proximal femur of postmenopausal women. J. Biomech. 44, 248–256. doi:10.1016/j.jbiomech.2010.10.017
Barak, M. M., Lieberman, D. E., and Hublin, J.-J. (2011). A Wolff in sheep’s clothing: trabecular bone adaptation in response to changes in joint loading orientation. Bone 49, 1141–1151. doi:10.1016/j.bone.2011.08.020
Bayraktar, H. H., and Keaveny, T. M. (2004). Mechanisms of uniformity of yield strains for trabecular bone. J. Biomech. 37, 1671–1678. doi:10.1111/j.1469-185X.1991.tb01142.x
Bertram, J. E., and Swartz, S. M. (1991). The ‘law of bone transformation’: a case of crying Wolff? Biol. Rev. 66, 245–273. doi:10.1111/j.1469-185X
Bouxsein, M. L., Boyd, S. K., Christiansen, B. A., Guldberg, R. E., Jepsen, K. J., and Müller, R. (2010). Guidelines for assessment of bone microstructure in rodents using micro-computed tomography. J. Bone Miner. Res. 25, 1468–1486. doi:10.1002/jbmr.141
Boyde, A. (2003). Improved digital SEM of cancellous bone: scanning direction of detection, through focus for in-focus and sample orientation. J. Anat. 202, 183–194. doi:10.1046/j.1469-7580.2003.00146.x
Buser, D., Schenk, R., Steinemann, S., Fiorellini, J., Fox, C., and Stich, H. (1991). Influence of surface characteristics on bone integration of titanium implants. A histomorphometric study in miniature pigs. J. Biomed. Mater. Res. 25, 889–902. doi:10.1002/jbm.820250708
Ciarelli, T., Fyhrie, D. P., Schaffler, M., and Goldstein, S. A. (2000). Variations in three-dimensional cancellous bone architecture of the proximal femur in female hip fractures and in controls. J. Bone Miner. Res. 15, 32–40. doi:10.1359/jbmr.2000.15.1.32
Cornish, R. J., Wilson, D. F., Logan, R. M., and Wiebkin, O. W. (2006). Trabecular structure of the condyle of the jaw joint in young and mature sheep: a comparative histomorphometric reference. Arch. Oral. Biol. 51, 29–36. doi:10.1016/j.archoralbio.2005.04.004
Currey, J. D. (2012). The structure and mechanics of bone. J. Mater. Sci 47, 41–54. doi:10.1007/s10853-011-5914-9
Deshpande, V., Ashby, M., and Fleck, N. (2001). Foam topology: bending versus stretching dominated architectures. Acta Mater. 49, 1035–1040. doi:10.1016/S1359-6454(00)00379-7
Doube, M., Kłosowski, M. M., Arganda-Carreras, I., Cordelières, F. P., Dougherty, R. P., Jackson, J. S., et al. (2010). BoneJ: free and extensible bone image analysis in ImageJ. Bone 47, 1076–1079. doi:10.1016/j.bone.2010.08.023
Enlow, D. H. (1968). Wolff’s law and the factor of architectonic circumstance. Am. J. Orthod. 54, 803–822. doi:10.1016/0002-9416(68)90001-8
Ghouse, S., Babu, S., Van Arkel, R. J., Nai, K., Hooper, P. A., and Jeffers, J. (2017). The influence of laser parameters and scanning strategies on the mechanical properties of a stochastic porous material. Mater. Design. 131, 498–508. doi:10.1016/j.matdes.2017.06.041
Gosen, A. (1974). Mandibular leverage and occlusion. J. Prosthet. Den. 31, 369–376. doi:10.1016/0022-3913(74)90144-9
Hekneby, M. (1974). The load of the temporomandibular joint: physical calculations and analyses. J. Prosthet. Den. 31, 303–312. doi:10.1016/0022-3913(74)90201-7
Herring, S. W., Decker, J. D., Liu, Z. J., and Ma, T. (2002). Temporomandibular joint in miniature pigs: anatomy, cell replication, and relation to loading. Anat. Rec. 266, 152–166. doi:10.1002/ar.10049
Hurwitz, D. E., Sumner, D. R., and Block, J. A. (2001). Bone density, dynamic joint loading and joint degeneration. Cells Tissues Organs 169, 201–209. doi:10.1159/000047883
Jensen, K., Mosekilde, L., and Mosekilde, L. (1990). A model of vertebral trabecular bone architecture and its mechanical properties. Bone 11, 417–423. doi:10.1016/8756-3282(90)90137-N
Kahn, D. W. (1975). Topology: An Introduction to the Point-Set and Algebraic Areas. Baltimore, MD: Williams & Wilkins Co.
Keaveny, T. M., Morgan, E. F., Niebur, G. L., and Yeh, O. C. (2001). Biomechanics of trabecular bone. Annu. Rev. Biomed. Eng. 3, 307–333. doi:10.1146/annurev.bioeng.3.1.307
Kim, J.-E., Shin, J.-M., Oh, S.-O., Yi, W.-J., Heo, M.-S., Lee, S.-S., et al. (2013). The three-dimensional microstructure of trabecular bone: analysis of site-specific variation in the human jaw bone. Imaging Sci. Dent. 43, 227–233. doi:10.5624/isd.2013.43.4.227
Kinney, J., and Ladd, A. (1998). The relationship between three-dimensional connectivity and the elastic properties of trabecular bone. J. Bone Miner. Res. 13, 839–845. doi:10.1359/jbmr.1998.13.5.839
Kivell, T. L. (2016). A review of trabecular bone functional adaptation: what have we learned from trabecular analyses in extant hominoids and what can we apply to fossils? J. Anat. 228, 569–594. doi:10.1111/joa.12446
Lee, T.-C., Kashyap, R. L., and Chu, C.-N. (1994). Building skeleton models via 3-D medial surface axis thinning algorithms. Graph. Model. Img. Process. 56, 462–478. doi:10.1006/cgip.1994.1042
Li, B., and Aspden, R. M. (1997a). Composition and mechanical properties of cancellous bone from the femoral head of patients with osteoporosis or osteoarthritis. J. Bone Miner. Res. 12, 641–651. doi:10.1359/jbmr.1997.12.4.641
Li, B., and Aspden, R. M. (1997b). Mechanical and material properties of the subchondral bone plate from the femoral head of patients with osteoarthritis or osteoporosis. Ann. Rheum. Dis. 56, 247–254. doi:10.1136/ard.56.4.247
Liu, Z., and Herring, S. W. (2000a). Bone surface strains and internal bony pressures at the jaw joint of the miniature pig during masticatory muscle contraction. Arch. Oral. Biol. 45, 95–112. doi:10.1016/S0003-9969(99)00127-2
Liu, Z., and Herring, S. W. (2000b). Masticatory strains on osseous and ligamentous components of the temporomandibular joint in miniature pigs. J. Orofac. Pain 14, 265–278.
Maquer, G., Musy, S. N., Wandel, J., Gross, T., and Zysset, P. K. (2015). Bone volume fraction and fabric anisotropy are better determinants of trabecular bone stiffness than other morphological variables. J. Bone Miner. Res. 30, 1000–1008. doi:10.1002/jbmr.2437
Mosekilde, L., Mosekilde, L., and Danielsen, C. (1987). Biomechanical competence of vertebral trabecular bone in relation to ash density and age in normal individuals. Bone 8, 79–85. doi:10.1016/8756-3282(87)90074-3
Mosekilde, L., Weisbrode, S. E., Safron, J. A., Stills, H. F., Jankowsky, M. L., Ebert, D. C., et al. (1993). Calcium-restricted ovariectomized Sinclair S-1 minipigs: an animal model of osteopenia and trabecular plate perforation. Bone 14, 379–382. doi:10.1016/8756-3282(93)90167-9
Müller, R. (2009). Hierarchical microimaging of bone structure and function. Nat. Rev. Rheumatol. 5, 373–381. doi:10.1038/nrrheum.2009.107
Müller, R., Van Campenhout, H., Van Damme, B., Van der Perre, G., Dequeker, J., Hildebrand, T., et al. (1998). Morphometric analysis of human bone biopsies: a quantitative structural comparison of histological sections and micro-computed tomography. Bone 23, 59–66. doi:10.1016/S8756-3282(98)00068-4
Nkenke, E., Lehner, B., Weinzierl, K., Thams, U., Neugebauer, J., Steveling, H., et al. (2003). Bone contact, growth, and density around immediately loaded implants in the mandible of mini pigs. Clin. Oral. Implants Res. 14, 312–321. doi:10.1034/j.1600-0501.2003.120906.x
Odgaard, A. (1997). Three-dimensional methods for quantification of cancellous bone architecture. Bone 20, 315–328. doi:10.1016/S8756-3282(97)00007-0
Parkinson, I. H., and Fazzalari, N. L. (2013). “Characterisation of trabecular bone structure,” in Skeletal Aging and Osteoporosis: Biomechanics and Mechanobiology, ed. M. J. Silva (Berlin; Heidelberg: Springer), 31–51.
Pontzer, H. L., Lieberman, D. E., Momin, E., Devlin, M. J., Polk, J. D., Hallgrimsson, B., et al. (2006). Trabecular bone in the bird knee responds with high sensitivity to changes in load orientation. J. Exp. Biol. 209, 57–65. doi:10.1242/jeb.01971
Reznikov, N., Chase, H., Ben Zvi, Y., Tarle, V., Singer, M., Brumfeld, V., et al. (2016). Inter-trabecular angle: a parameter of trabecular bone architecture in the human proximal femur that reveals underlying topological motifs. Acta Biomater. 44, 65–72. doi:10.1016/j.actbio.2016.08.040
Reznikov, N., Phillips, C., Cooke, M., Garbout, A., Ahmed, F., and Stevens, M. M. (2017). Functional adaptation of the calcaneus in historical foot binding. J. Bone Miner. Res. 32, 1915–1925. doi:10.1002/jbmr.3185
Roschger, P., Grabner, B., Rinnerthaler, S., Tesch, W., Kneissel, M., Berzlanovich, A., et al. (2001). Structural development of the mineralized tissue in the human L4 vertebral body. J. Struct. Biol. 136, 126–136. doi:10.1006/jsbi.2001.4427
Ryan, T. M., and Krovitz, G. E. (2006). Trabecular bone ontogeny in the human proximal femur. J. Hum. Evol. 51, 591–602. doi:10.1016/j.jhevol.2006.06.004
Saha, P. K., Gomberg, B. R., and Wehrli, F. W. (2000). Three-dimensional digital topological characterization of cancellous bone architecture. Int. J. Imaging Syst. Technol. 11, 81–90. doi:10.1002/(SICI)1098-1098(2000)11:1<81:AID-IMA9>3.0.CO;2-1
Stauber, M., and Müller, R. (2007). A sensitivity analysis of the volumetric spatial decomposition algorithm. Comput. Methods Biomech. Biomed. Engin. 10, 25–37. doi:10.1080/10255840601090053
Teng, S., and Herring, S. W. (1995). A stereological study of trabecular architecture in the mandibular condyle of the pig. Arch. Oral. Biol. 40, 299–310. doi:10.1016/0003-9969(94)00173-9
Terheyden, H., Jepsen, S., Möller, B., Tucker, M. M., and Rueger, D. C. (1999). Sinus floor augmentation with simultaneous placement of dental implants using a combination of deproteinized bone xenografts and recombinant human osteogenic protein-l. A histometric study in miniature pigs. Clin. Oral. Implants Res. 10, 510–521. doi:10.1034/j.1600-0501.1999.100609.x
Wainwright, S. A., Biggs, W. D., Currey, J. D., and Gosline, J. M. (1976). Mechanical Design in Organisms. Princeton: Princeton University Press.
Keywords: trabecular bone, inter-trabecular angle, topology, anisotropy, micro-CT
Citation: Ben-Zvi Y, Reznikov N, Shahar R and Weiner S (2017) 3D Architecture of Trabecular Bone in the Pig Mandible and Femur: Inter-Trabecular Angle Distributions. Front. Mater. 4:29. doi: 10.3389/fmats.2017.00029
Received: 28 June 2017; Accepted: 11 September 2017;
Published: 27 September 2017
Edited by:
Gianluca Tozzi, University of Portsmouth, United KingdomReviewed by:
Peter Zioupos, Cranfield University, United KingdomAntonio DiCarlo, CECAM–IT–SIMUL Node, Italy
Copyright: © 2017 Ben-Zvi, Reznikov, Shahar and Weiner. This is an open-access article distributed under the terms of the Creative Commons Attribution License (CC BY). The use, distribution or reproduction in other forums is permitted, provided the original author(s) or licensor are credited and that the original publication in this journal is cited, in accordance with accepted academic practice. No use, distribution or reproduction is permitted which does not comply with these terms.
*Correspondence: Steve Weiner, steve.weiner@weizmann.ac.il
†These authors have contributed equally to this work.