New Challenges for the Pressure Evolution of the Glass Temperature
 Sylwester J. Rzoska
- Institute of High Pressure Physics Polish Academy of Sciences, Warsaw, Poland
The ways of portrayal of the pressure evolution of the glass temperature (Tg) beyond the dominated Simon–Glatzel-like pattern are discussed. This includes the possible common description of Tg(P) dependences in systems described by dTg/dP > 0 and dTg/dP < 0. The latter can be associated with the maximum of Tg(P) curve hidden in the negative pressures domain. The issue of volume and density changes along the vitrification curve is also discussed. Finally, the universal pattern of vitrification associated with the crossover from the low density (isotropic stretching) to the high density (isotropic compression) systems is proposed. Hypothetically, it may obey any glass former, from molecular liquids to colloids.
Introduction
Liquids on cooling solidify in the ordered crystalline state when passing the melting temperature (Tm). However, the fluidity can be also preserved below melting, down to the glass temperature Tg ≪ Tm, where the solidification from the metastable ultraviscous/ultraslowing liquid to the solid amorphous glass state occurs (Donth, 2000; Rzoska et al., 2010; Berthier and Ediger, 2016). There are also numerous semi-crystalline systems where the vitrification is related to the solidification of one or few elements of symmetry: as examples can serve orientationally disordered crystals (plastic crystals) (Drozd-Rzoska et al., 2006a,b) or liquid crystals (Drozd-Rzoska, 2006, 2009). For many systems, passing Tm without crystallization is associated with an extreme temperature quench (Donth, 2000). However, there are also numerous glass formers where entering the metastable ultraviscous/ultraslowing domain is possible at any practical experimental cooling rate (Donth, 2000; Rzoska et al., 2010; Berthier and Ediger, 2016). Turnbull (Turnbull, 1969; Angell, 2008) formulated the broadly used empirical Glass-Forming Ability (GFA) rule distinguishing poor (Tg/Tm < 2/3) and good glass formers (Tg/Tm > 2/3) and linking Tg and Tm. Notwithstanding, there is a notable difference between melting and vitrification: melting is related to the “sudden and almost non-signaled” fusion on cooling whereas the glass transition is hallmarked by far previtreous super-Arrhenius (SA) changes of viscosity η(T), primary relaxation time τ(T), or other related dynamic properties (Avramov and Milchev, 1988; Donth, 2000; Rzoska et al., 2010; Berthier and Ediger, 2016). This opens the possibility of estimating the glass temperature from the analysis of previtreous effects well above Tg: as the general reference values η(Tg) = 1013 Poise for viscosity or τ(Tg) = 100 s for the primary (alpha, structural) relaxation time are assumed, since they correlate with the thermodynamic estimation (heat capacity or density scan) of Tg related to 10 K/min cooling rate (Donth, 2000; Rzoska et al., 2010). Although the ultimate form of τ(T,P) or η(T, P) portrayal in previtreous ultraviscous/ultraslowing liquids on approaching Tg remains puzzling (Martinez-Garcia et al., 2013, 2014, 2015), most often the Vogel–Fulcher–Tammann (VFT) relation is used (Tammann, 1903; Vogel, 1921; Fulcher, 1925; Donth, 2000; Rzoska et al., 2010; Martinez-Garcia et al., 2013; Berthier and Ediger, 2016):
where τ0 = 10−14±2 is the prefactor, T0 < Tg is the VFT singular temperature, and DT denotes the fragility strength coefficient linked to fragility metric via the empirical dependence DT = 590/(m + log10 τ0/log10(Tg)) (Böhmer et al., 1993), in which τ0 = 10−14 s is assumed.
The pressure counterpart of the VFT equation was first proposed for the analysis of viscosity changes in glycerol by Johari and Whalley (1972) and later for the primary relaxation time in dibutyl phthalate (Paluch et al., 1996):
where: T = const, and denote prefactors, the amplitude A = const and P0 > Pg is the “VFT-like” singular pressure.
However, Eq. 2 can reliably portray experimental data only for “strong” (weakly non-Arrhenius) glass formers, assuming that measurements terminates at Pmax ≪ P0. In Paluch et al. (1998), the relation able to portray the previtreous dynamics for an arbitrary glass former and range of pressure was proposed:
In this relation the amplitude is pressure dependent A = A(P) = DPP, and the pressure fragility strength coefficient DP was introduced. It is notable that for the basic VFT Eq. 1 the prefactor is “approximately universal,” i.e., τ0 ≈ 10−14±2 s, whereas for Eqs 2 and 3, it ranges between and (Drozd-Rzoska and Rzoska, 2006; Drozd-Rzoska et al., 2008). Such enormous discrepancy results from the location of the τ(P) isotherm selected for τ(P) or η(P) tests in the respect to Tg(P) curve. This can be illustrated via the “general” SA equation:
The comparison of Eqs 3 and 4 yields Ea(T) = RDT/(1T0 − 1/T) and Va(P) = TDPR/(P0 − P) for “VFT-type estimations” of the activation energy and activation volume, respectively. Notwithstanding, the general and model-free forms of Ea(T) and Va(P) dependencies are still not known. The solution of the problem of the poorly defined prefactor in Eqs 2 and 3 was proposed in Drozd-Rzoska and Rzoska (2006) and Drozd-Rzoska et al. (2008) by introducing the equation:
This dependence takes into account that the liquid state terminates at the absolute stability limit pressure (spinodal PSp), in negative pressures domain. The ultimate description needs both positive (isotropic compression, hydrostatic pressures, P > 0) and negative pressures (isotropic stretching, P < 0) domains (Angell and Quing, 1989, Imre et al., 2002). For Eq. 5, the prefactor is approximately the same, , for any isotherm. When comparing Eqs 3 and 5 worth noting is that the latter can penetrate negative pressures domain but the fragility strength coefficients changes: (Drozd-Rzoska and Rzoska, 2006; Drozd-Rzoska et al., 2008).
The characterization of Tg(P) dependence has a notable impact on the behavior under atmospheric pressure, being included via the coefficient dTg(P)/dP in numerous relations (Drozd-Rzoska et al., 2007a,b; Rzoska et al., 2010; Donth, 2000; Rzoska and Mazur, 2007; Floudas et al., 2011). The reliable knowledge of Tg(P) description seems to be essential for silicate glasses, in which practically important features are created due to the high pressure—high temperature annealing with induced “exotic” features preserved after decompressing. They are, for instance: (i) the notable increase of density, (ii) the increase of hardness, and (iii) the anty-cracking ability (Smedskjaer et al., 2014; Januchta et al., 2016, 2017; Svenson et al., 2017). Still puzzling is the description of Tg(P) behavior in systems where dTg/dP < 0 (Donth, 2000; Drozd-Rzoska et al., 2007a,b, 2008).
All above show that the reliable and effective portrayal of the pressure evolution of the glass temperature can constitute one of milestones in dealing with the glass transition. This report presents the resume of this issue, supplemented by some extensions beyond the current state-of-the art.
Parameterization of the Pressure Evolution of Melting and Glass Temperatures
There are several relations for describing the pressure evolution of melting temperature: the most popular is the Simon–Glatzel (SG) equation due to its simple form and the limited number of fitted parameters (Simon and Glatzel, 1929; Skripov and Faizulin, 2006):
where T0, a, and b are adjustable parameters.
It can be derived from the Clausius–Clapeyron (C–C) equation dT/dP = TΔV/ΔH = ΔV/ΔS, where ΔV, ΔH, and ΔS are for the volume, enthalpy, and entropy changes at the transition, assuming (dT/dP)fusion = a + bP (Skripov and Faizulin, 2006). This relation is used for the description of melting, where the “sudden and sharp” change of volume or density (ΔV, Δρ) and entropy takes place. However, the C–C equation can be linked to any fusion phenomenon, provided it is associated with detectable changes in entropy and volume/density. This occurs also for the glass transition temperature, although the transformation is “stretched” in temperature or pressure and occurs between the disordered (ultravisous) liquid and the disordered solid (glass), as shown in Figure 1.
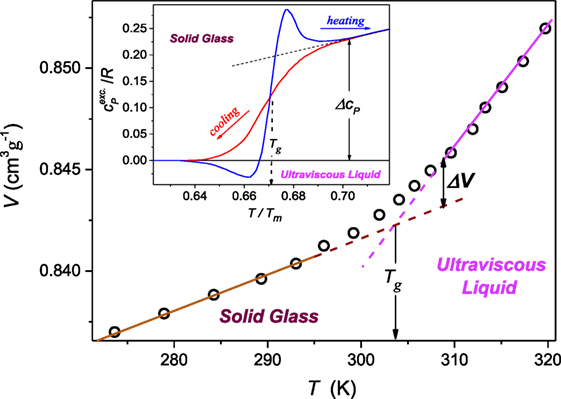
Figure 1. The temperature dependence (P = 0.1 MPa) of the proper volume V = 1/ρ, ρ denotes density, for polyvinyl acetate in the ultraviscous and solid amorphous phases. Dashed lines show extrapolations of the experimental behavior remote from the “stretched” glass transition domain Tg. The apparent discontinuity of the volume can be estimated as ΔV ′ = 0.0021 cm3g−1 and ΔV ″ = 0.0030 cm3g−1 (double arrows in the plot). The inset, based on data from McKinney and Goldstein (1974), Roland and Casalini (2003), and Tropin et al. (2012) is for the excess of the specific heat , over the behavior in the solid stated remote from Tg described the behavior well below. The resulting discontinuity Δcp(T)/R = 0.23. Data in this figure are for 10 K/min. cooling/heating rate.
As mentioned above the “reasonable” metric of the glass transition is the isochronal or isoviscous condition τ(Tg, Pg) = 100 s or η(Tg, Pg) = 1013 Poise (Donth, 2000). Generally, such condition is absent along the melting curve within the P-T plane (Skripov and Faizulin, 2006). However, the isochronal condition for Tm(P) is clearly fulfilled if melting is associated with only one element of symmetry, as for the isotropic-nematic transition in liquid crystals (Roland et al., 2008). Heuristic similarities between melting and vitrification can be strengthen recalling the empirical link between Tg and Tm, used as the indicator of the GFA: Tg/Tm > 2/3 (near-spherical molecules) and Tg/Tm > 1/2 (elongated molecules) (Turnbull, 1969; Donth, 2000; Angell, 2008). Consequently, one can expect that the pressure dependence of Tm can be paralleled by Tg(P) evolution. Regarding the vitrification, S. Peter Andersson and Ove Andersson (AA) introduced the SG-type relation for describing the pressure evolution of the glass temperature in poly(propylene) glycol (Andersson and Andersson, 1998):
where k1, k2, and k3 are empirical, adjustable parameters.
The AA equation has become the key tool for describing Tg(P) experimental data till nowadays (Roland et al., 2005; Drozd-Rzoska et al., 2007a; Rzoska and Mazur, 2007; Rzoska et al., 2010; Floudas et al., 2011). This success was notably strengthen by its derivation within the Avramov–Milchev (AM) phenomenological model for the vitrification (Avramov and Milchev, 1988; Roland and Casalini, 2003; Hu et al., 2017):
where the coefficient ε = [30log10(e)/(log10(τ(Tg)) − log10τ0)]1/α.
Notable is some discrepancy between Eqs 7 and 8 because the coefficient ε ≫ 1. Worth recalling is also the criticism (Martinez-Garcia et al., 2013, 2014) regarding the basic AM model (Avramov and Milchev, 1988) output relation τ(T) = τ0 exp(A/TD) or η(T) = η0 exp(A/TD), for P = const.
It is worth stressing that for SG Eq. 6 and AA Eqs 7 and 8 always dTg,m/dP > 0, i.e., Tm(P) and Tg(P) have to increase permanently with rising pressure. However, there are also systems dTg,m/dP < 0, although the experimental evidence for such glass formers is still limited: some of them are collected in Table 1.
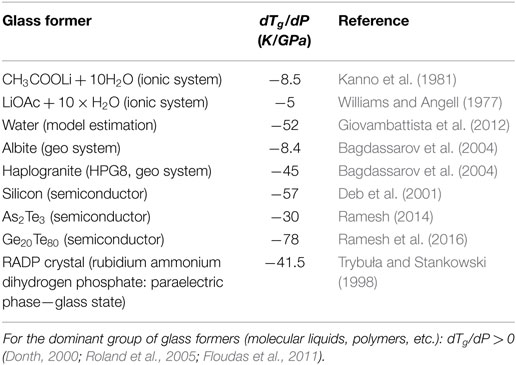
Table 1. Systems in which the application of pressure decreases the glass temperature (dTg/dP < 0).
It seems that such behavior may occur only for some strongly bonded glass formers. Notwithstanding, taking into account the clear evidence of systems with Tm(P) maximum (Kechin, 1995, 2001; Tonkov and Ponyatovsky, 2004), the similar behavior can be expected for Tg(P) curves. It is notable, that already a century ago it was indicated that the reversal melting can be the general phenomenon (Tammann, 1903), although it can be hidden in the negative pressures domain or its emergence can be stopped by a phase transition. The description of the reversal melting phenomenon was first clearly proposed by Rein and Demus (RD) (Demus and Pelzl, 1988; Rein and Demus, 1992) and subsequently by Kechin (K) (Kechin, 1995, 2001):
where a, b and a1 are adjustable parameters. R(P) denotes the SG-type “rising” term and D(P) is for the “damping term.”
In subsequent decades Eq. 9, most often recalled as the “Kechin equation,” became the key tool for describing experimental data associated with melting curve maximum (Drozd-Rzoska, 2005; Skripov and Faizulin, 2006; Drozd-Rzoska et al., 2007a; Rzoska and Mazur, 2007; Rzoska et al., 2010). Regarding the meaning of parameters in Eqs 6–9 one can generalize the reasoning of Burakovsky et al. (Burakowsky et al., 2000; Burakovsky et al., 2003), who considered the volume-related compression factor (modulus): η′ = ΔV0/ΔV = (V(π) − V(P0))/(V(P) − V(P0)) and linked it to the bulk (compressibility) modulus via B = − ΔV(d(ΔP)/d(ΔV)) = η′d(ΔP)/dη′, with the pressure dependence given as and ΔP = P − P0:
where the index “0” is related to the reference point (T0, P0).
Hence, taking the atmospheric pressure as the reference one can indicate the following meaning of parameters in Eqs 6–9 and for the power exponent . For SG and AA Eqs 6 and 7, as well as K&RD Eq. 8, the reference has to be taken as T0 = Tg,m(P0 = 0) ≈ Tg,m(P0 = 0.1MPa). Other selections of T0 yields non-optimal and effective values of fitted coefficients. In Skripov and Faizulin (2006) as the general reference the triple point was proposed: and the T0 = Ttriple and P →ΔP = P − Ptriple in the SG Eq. 6. Such reference cannot be implemented for the glass transition. Drozd-Rzoska (Drozd-Rzoska, 2005; Drozd-Rzoska et al., 2007a, 2008) proposed as the reference arbitrary values (T0, P0) along melting or vitrification curves, assuming ΔP = P − P0. Subsequently, considering the Clausius–Clapeyron equation along the melting or vitrification curve the following relation was derived (Drozd-Rzoska, 2005):
where ΔP = P − P0, −π is the extrapolated negative pressure value for which Tg,m(P → −π) → 0: it correlates with the onset of TSp(PSp) absolute stability limit curve in negative pressures domain; c is the damping pressure coefficient.
For small or moderate pressures one obtains the SG or AA-type equation (Drozd-Rzoska, 2005; Drozd-Rzoska et al., 2007a, 2008):
Equation 11 is able to portray systems with the maximum of melting or vitrification curve, even if they are hidden in the negative pressures domain. It can be also applied for systems were dTg,m/dP < 0. Equation 12 can describe experimental data if dTg,m(P)/dP > 0 and the set of data is well below the maximum of Tg,m(P) curve. Both relations can be implemented in the negative pressures domain. Applying results of Burakowsky et al. (2000), one obtains: and and then . The latter equation is in agreement with the empirical relation for the pressure evolution of the bulk modulus recalled above (Murnaghan, 1944). It is notable that both the basic AA Eq. 7 and the extended Eq. 12 are able to portray experimental data in the negative pressures domain. For Eq. 7 such portrayal was successfully applied in Adrjanowicz et al. (2015). However, for Eq. 7, one has to assume T0(P = 0) as the reference. Moreover, the direct substitution of negative pressures, is not possible if hallmarks of the reversal vitrification (Tg(P) maximum) appears: Demus–Rein–Kechin (Eq. 9) is not able to portray experimental data if substituting P < 0, contrary to Drozd-Rzoska et al. (Eq. 11).
There are few other approaches considering Tm(P) evolution which start from the C–C or related Lindemann relations (Skripov and Faizulin, 2006). They are briefly presented below, with indications of their applicability for the glass formation. Schlosser et al. (1989) starting from the Lindemann relation Tm = CV2/3ΘD (C is a constant, ΘD is the Debye reduced temperature) (Lindemann, 1910; Skripov and Faizulin, 2006) and the definition of the Grüneisen parameter as γ = (∂ΘD/∂V)T = − ∂lnΘD/∂lnV (Grüneisen, 1912) obtained the relation focusing on the volume dependence of the melting temperature. Generalizing this dependence for the arbitrary fusion process one obtains:
where the index “0” is for the zero-pressure (~atmospheric pressure) reference.
Assuming for the X2 ≈ 1 − 2ΔV/3V0 ≈ exp(− 2ΔV/3V0) following relation was derived (originally for melting):
One may expect that it is able to portray systems described both by dTg,m/dP > 0 and dTg,m/dP < 0. For small/moderate pressures Eq. 14 can be reduced to the Kraut–Kennedy relation (Kraut and Kennedy, 1966; Schlosser et al., 1989), originally developed for melting:
It can be converted to the density related dependence along melting or vitrification curves:
Linking Eqs 12 and 15 one obtains the relation for pressure-induced volume changes along melting or vitrification curve:
This relation is in fair agreement with the Murnaghan equation, broadly used is earth sciences (Murnaghan, 1944; Poirier, 2000; Skripov and Faizulin, 2006). Recalling the dependence ΔV/V0 = ln(1 + βP)/α, where α = B′ + 1 and Eq. 15 can be converted to the SG- or AA-type equation (Schlosser et al., 1989):
It this relation the SG exponent , i.e., it differs from Burakovsky (Burakovsky et al., 2003) predictions.
Kumari and Dass (Kumari and Dass, 1988; Dass, 1995) also applied the framework of the Lindemann criterion (Lindemann, 1910) and workout the relation originally focused on the pressure evolution of the melting temperature, focusing on alkali metals:
where α = (γ′/B′)P0, T0, , , γ, γ,′ and B, B′ stands for the Grüneisen parameter, bulk modulus and their first derivatives.
This relation can describe systems notably diverging from the SG pattern, including the crossover dTg,m/dP > 0 → dTg,m/dP < 0. It can be also converted to the form coincided with Rein and Demus and Kechin Eq. 8:
The coefficient α = γ′/B′, what makes it possible to define the “damping pressure” parameter in DR Eq. 11: c = B′/2γ′. Equation 20 can be reduced to the SG or AA forms assuming α = 0 (Dass, 1995), i.e., γ(P) = const in the given range of pressures:
It is also notable that Eq. 19 makes it possible to estimate the location of the maximum of Tg,m(P) curves as . Taking into account the form of the exponent C worth recalling is Lindemann–Gilvary law (Gilvarry, 1966) dTm/dP = Tm[2(γ − 1/2)/B], what indicates the pressure dependence of the power exponent in the SG-type Eq. 21. Schlosser et al. Equation 13 and Kumari–Dass Eq. 19 and can be extended to the negative pressures domain when introducing the reference related to the absolute stability limit in the negative pressures domain: P →ΔP = P − PSp, V →ΔV = V − VSp, ρ →ρ − ρSp.
The formal base of above relations, including the Andersson–Andersson equation, are the extended C–C relation or/and the Grüneissen parameter definition. Their implementations are related to different pressure dependences of the volume and the modules in neighboring phases. The latter give rise to the nonlinear dependence of the enthalpy. For melting at the well-defined temperature such behavior is easily detectable in neighboring phases. For the glass transition there are “stretched” gradual changes of mentioned properties over the transition region between coexisting ultraviscous/ultraviscous and solid states. Notwithstanding, also for the glass transition one can define the equivalents of “jumps” for ΔV and ΔS, or equivalently ΔH (Figure 1).
The Analysis of Experimental Data
When considering the parameterization of Tg(P) or Tm(P) experimental data, some basic problems emerges:
(i) Does the selected equation is proper for portraying the given set of data?
(ii) What is the pressure range of applicability of the description?
(iii) Is it possible to estimate optimal values of parameters, avoiding the uncertainty associated with the number of parameter and the nonlinear fitting?
To address these questions, in Drozd-Rzoska (2005), Drozd-Rzoska and Rzoska (2006), and Drozd-Rzoska et al. (2007a), the preliminary derivative-based and distortions-sensitive analysis of Tm(P) and Tg(P) experimental data was proposed: Tg(P) ⇒ [d(lnTg,m)/dP]−1. For SG/AA or DR Eqs 6, 7, and 12, one obtains the linear behavior of transformed experimental data (Drozd-Rzoska, 2005; Drozd-Rzoska et al., 2007a):
It is visible that the description via DR and SG/AA relations overlaps and both can be extended into the negative pressures domain. However, such possibility for the AA and SG relation may be casual since it does not takes place for Rein and Demus and Kechin Eq. 9, for Kumari and Dass Eq. 19 or for pressure counterparts of the VFT relation (Eqs 2 and 3).
Regarding the “general” DR Eq. 11, the following transformation of experimental data was proposed to test the domain of its validity (Drozd-Rzoska et al., 2007a, 2008):
For the optimal selection of the damping pressure coefficient c one obtains the linear behavior of transformed experimental data and the linear regression fit yields optimal values of π, b, and c coefficients. Subsequently, they can be substituted to Eq. 11, avoiding the nonlinear fitting.
Concluding, Eqs 22 and 23 define the way of the preliminary transformation and analysis of experimental Tg,m(P) via the plot d lnTg,m/dP vs. P, which indicates the domain of the domain of validity of the given description and optimal values of parameters. The derivative-based and distortions-sensitive preliminary analysis can reveal even “weakly emergent” hallmarks of approaching dTg,m/dP > 0 ⇔ dTg,m/dP < 0 crossover, hardly “eye-detectable.” Below, practical applications of above reasoning are discussed. First, they are focused on melting of germanium (dTm/dP < 0) (Vaidya et al., 1969; Porowski et al., 2015) and subsequently for the “soft” material, P4MP1 polymer, with Tm(P) maximum (Höhne, 1999; Höhne et al., 2000). It is worth stressing that for the vast majority of systems tested so far dTm/dP > 0 (Kechin, 1995, 2001; Skripov and Faizulin, 2006) and there is much lesser number of systems where dTm/dP < 0 (see Table 1). Figure 2 presents such data for germanium, which can be well portrayed by DR Eq. 11, with parameters obtained from the pre-analysis of experimental data via Eq. 23, as shown in the inset. Notable, is the possible maximum of Tm(P) curve hidden in the negative pressures domain at Pmax ≈ −0.32 GPa.
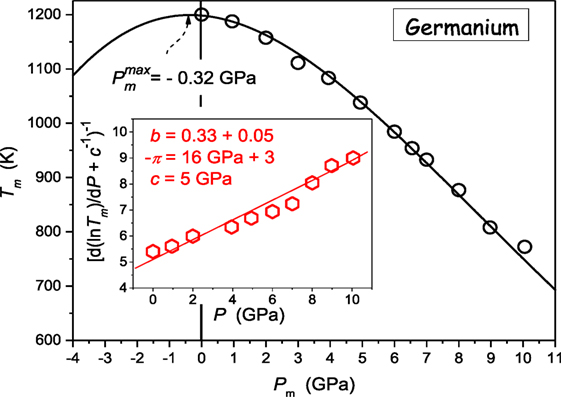
Figure 2. Pressure dependence of melting temperature of germanium [based on data from ref. Vaidya et al. (1969), Porowski et al. (2015)]. Experimental data are portrayed by DR Eq. 11, with the support of the preliminary derivative-based analysis (Eq. 23) yielding also optimal values of parameters: this is shown in the inset.
Figure 3 presents the unique “soft matter system” where the crossover dTm/dP > 0 ⇔ dTm/dP < 0 takes place at relatively low pressures: Pmax ≈ 150 MPa. Recalling the Kumari–Dass model (Dass, 1995; Kumari and Dass, 1988) such small value of Pmax may result from the strong pressure dependence of the Grüneissen parameter.
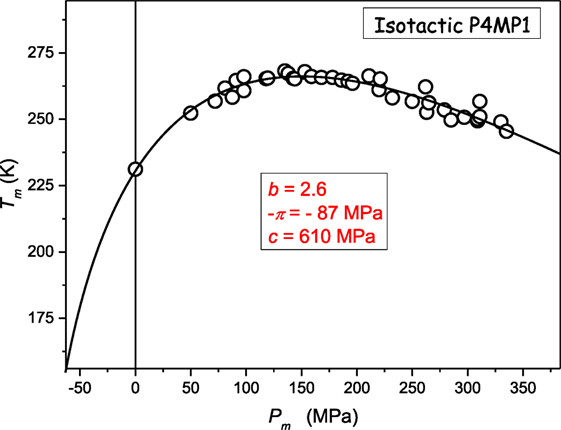
Figure 3. The evolution of melting temperature in poly(4-methyl-pentene-1): isotactic P4MP1 polymer: based on data from ref. (Höhne, 1999; Höhne et al., 2000) The results from Eq. 11, with parameters derived due to the preliminary analysis of data via Eq. 23.
One can expect that different types of Tm(P) dependences should be paralleled by Tg(P) behavior, taking into account the form of GFA factor. Unfortunately, the number of experimental data for Tg(P) is very limited.
Figure 4 shows the compilation of Tg(P) and Tm(P) experimental data available for selenium. It is notable that a single DR Eq. 11 curve can describe the whole set of Tm(P) data, without a hallmark of passing a liquid I–liquid II (L–L) transition (Imre and Rzoska, 2010). This issue is worth stressing because often dTm/dP discontinuity is reported when passing the L–L transition (Imre and Rzoska, 2010). The value of the ratio Tg/Tm changes from Tg/Tm(P = 0.1MPa) ≈ 2/3 → Tg/Tm(P ≈ Pmax) ≈ 1/2 (Drozd-Rzoska et al., 2007a, 2008). When entering the negative pressures domain the GFA factor Tg/Tm → 1, i.e., the system becomes extremely good glass former.
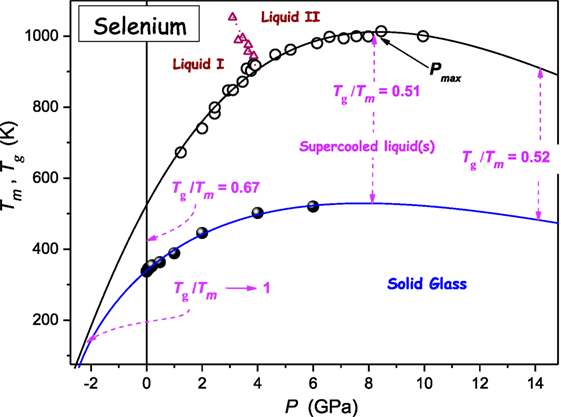
Figure 4. The pressure evolution of melting and glass temperature for selenium. The change of Tg/Tm value is indicated. Solid curves are described by DR Eq. 11: parameters were derived from the preliminary analysis based on Eq. 23. Experimental data were taken from refs. (Deaton and Blum, 1965; Tanaka, 1984; Ford et al., 1988; Katayama et al., 2000; Caprion and Schober, 2002).
Glycerol belongs to the group of the most “classical” glass-forming ultraviscous liquids (Donth, 2000; Rzoska and Mazur, 2007; Rzoska et al., 2010; Berthier and Ediger, 2016) Figure 5 shows the compilation of data from the authors’ broad band dielectric spectroscopy pressure studies and the analysis of the primary relaxation time τ(T, P) via Eq. 5 supplemented by earlier Tg(P) estimations (Drozd-Rzoska, 2005; Drozd-Rzoska et al., 2007a). Notable is the emergence of two types of Tg(P) evolution. The first one leads to the maximum of Tg(P) curve at and it is followed by a hypothetical reversal vitrification associated with dTg(dP < 0). However, prior to reaching the maximum, at P ≈ 6.5 GPa the “crossover” to the another form of Tg(P) evolution, described by dTg/dP > 0 takes place. The dashed curve shows the extrapolation of the solid blue curve, with the indication of a hypothetical “hidden” maximum of Tg(P) curve. The inset in Figure 2 shows changes of (dTg/dP) coefficient on rising pressure, additionally distinguishing two different types of Tg(P) evolution.
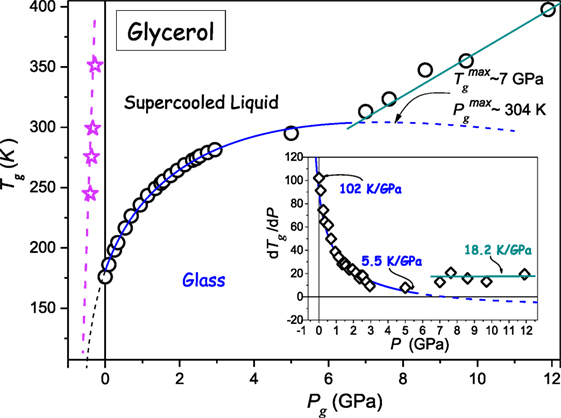
Figure 5. The pressure evolution of the glass temperature for glycerol. The solid blue curve, with “dotted” and “dashed” parts is related to DR Eq. 11 and the preliminary analysis via Eq. 23. Experimental data are from author’s measurements and from Cook et al. (1994), Drozd-Rzoska (2005), Drozd-Rzoska et al. (2007a), Pronin et al. (2010). The dashed line and stars (in magenta) in the negative pressures domain denotes the possible absolute stability limit location: this was determined from the analysis of τ(P) experimental data via Eq. 5. The inset shows the pressure evolution of dTg/dP coefficient.
Generally, the experimental evidence of glass formers characterized by dTg/dP < 0 is very limited (see Table 1). Such behavior seems to be characteristic for some strongly bonded systems. Figure 6 shows results of such studies for albite, a geophysically important material, which can be well portrayed by Eq. 11, revealing the maximum of Tg(P) curve “hidden” in negative pressures domain.
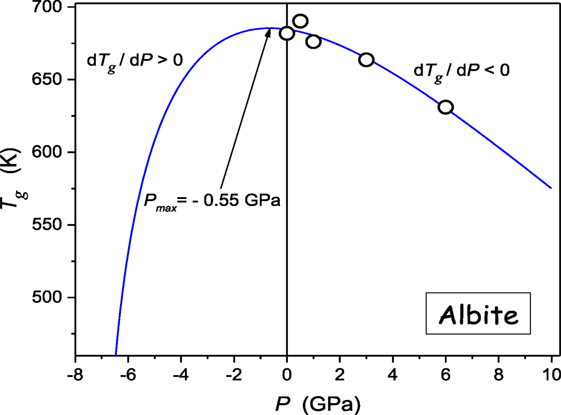
Figure 6. The pressure evolution of the glass temperature in albite (NaAlSi3O8), the component of magmatic, metamorphic rocks. The plot bases on experimental data from ref. (Bagdassarov et al., 2004). The solid curve is related to Eq. 11.
Universal Aspects of the Pressure Evolution of the Glass Temperature
The above discussion indicated the possible common phenomenological description of Tg(P) evolution in glass formers described by dTg(P)/dP > 0 and/or dTg(P)/dP < 0. The question arises of the more microscopic insight. Voigtmann (2006a) analyzed the vitrification within frames of the square-well (SW) model associated with the relatively simple potential: U(r) = ∞ for distances r < d supplemented with an SW attraction within the range δ, U(r) = − U0 for d < r < d(1 + δ), and U(r) = 0 beyond was analyzed. The SW approach proved its superior ability for describing colloidal glass formers, which can be thus considered as a kind of archetypical experimental glass-forming model system. In Voigtmann (2006a), the possibility of the common description of glass-forming molecular liquids and colloids was shown, using the plot and , where the “natural units,” i.e., model normalized glass pressure and temperature were used: and . In Voigtmann (2006b), the similar plot was tested for the model fluid associated with the Lennard–Jones (LJ) VLJ = 4 ∈ [(r/σ)−12 − (r/σ)−6] potential analyzed within the mode-coupling theory approximation. In Voigtmann (2006a), Tg(P) experimental data for glycerol, dibutyl phthalate, o-terphenyl, and epoxy resin EPON 828 were analyzed (dTg/dP > 0). In Roland and Casalini (2003), only glycerol was discussed, for the clarity of reasoning. This report also focuses on glycerol, but for the notably enhanced range of pressures, basing on data from Figure 5. This is supplemented by experimental data for albite, where dTg/dP < 0 (Figure 6). In Voigtmann (2006a), the SW model units were used for scaling, namely and and in Voigtmann (2006b), the LJ model units, i.e., and : numbers are given for glycerol. In Voigtmann (2006b), the partial agreement between predictions of SW and LJ model was obtained after ad hoc shifting T* → 1.5 T*. It is notable that so far experiments in colloids are carried out under atmospheric pressure and obtained phase diagrams are presented using the volume fraction (ϕ)—interaction strength or temperature axes. Such data were model-mapped into the pressure–temperature plane in Voigtmann (2006a). Figure 7 recalls results of Voigtmann (2006a) for: (i) the colloid with the addition of polymer increasing attraction and causing the “re-entrant” vitrification (Pham et al., 2002), (ii) glycerol (dTg/dP > 0) for experimental data taken from Figure 5, (iii) albite for which dTg/dP < 0 (Figure 6), and (iv) the SW model predictions for δ = 0.04 and δ = 0.12 values of the key parameter, (v) the model using LJ potential with and without the attraction. This is supplemented by results of fitting via DR Eq. 11 for glycerol and albite. One of key findings of Voigtmann (2006a,b) was the “generic steep” anomaly with exactly defined singularity, the same for any molecular glass former: for SW model units and for the LJ model. These led to the conclusion that there are three general regimes of glass formation resulted from Tg(P) evolution (Voigtmann, 2006a,b):
Regime I—for : glass formers approach the hard sphere limit. Following Voigtmann (2006a,b) in this domain: .
Regime II—for : there is a universal “generic steep” anomaly and this regime is characteristic for molecular glass formers.
Regime III—for the low density and weak interactions domain occurs. It is available for colloidal glass formers and does not accessible for molecular ones.
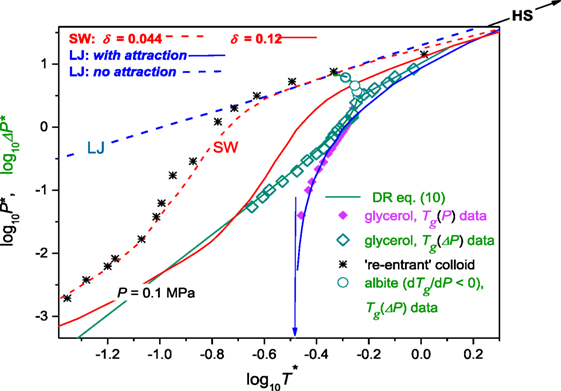
Figure 7. The pressure dependence of the glass temperature, summarizing the model discussion (Voigtmann, 2006a,b): SW is for the square-well potential model, LJ—the Lennard–Jones potential model and HS is for the hard spheres model. For details see the text of the given paragraph and refs. (Voigtmann, 2006a). Experimental data for glycerol are taken from Figure 5: they are present in the “natural scaled” units. Data for albite are from Figure 6. Note that for open green diamonds (glycerol) and open circles (albite) the reference pressure was takes into account: P → ΔP = P + π. Data for the polymer mediated colloid are from Pham et al. (2002) and Voigtmann (2006a). For details see comments in the given paragraph. Note the disappearance of the “generic steep” anomaly (indicated by the vertical arrow) and the ability for describing arbitrary glass former. For scaling model values see the text below.
In Voigtmann (2006a,b), glass-forming systems for which dTg/dP < 0 were not discussed.
One of the most striking features of Voigtmann (2006a,b) is the “generic steep” anomaly, presumably occurring only for molecular glass formers. However, this unique phenomenon has few surprising features. First, it is very strong and associated with exactly the same “singular” value of for arbitrary molecular glass former. Well above the singularity experimental data for all molecular glass formers overlaps. Second, the “generic” anomaly appears in the log–log scale but no hallmarks of such behavior appears in the linear scale for any “native” Tg(P) data (Johari and Whalley, 1972; Andersson and Andersson, 1998; Donth, 2000; Roland et al., 2005; Drozd-Rzoska et al., 2007a, 2008; Rzoska and Mazur, 2007; Floudas et al., 2011). Third, although real high pressure results for colloidal glass formers are still not available, one can easily show that such data also will follow the same “generic steep anomaly” pattern, in disagreement with “re-calculated” data shown in Figure 7 (stars).
Following all these, one can conclude that the “generic steep” anomaly is the consequence of P → 0 (i.e., in practice P → 0.1 MPa) within the plot applying the log–log scale. This is not a real physical phenomenon. Any fluid can be smoothly crossovered from the hydrostatic pressures region (P > 0) to the isotropically stretched, negative pressures domain (P > 0) (Imre et al., 2002). Experimental evidences clearly show the lack of any hallmarks of passing P = 0, also for supercooled molecular glass formers (Angell and Quing, 1989; Sciortono et al., 1995; Imre et al., 2002). The natural termination of the liquid state is the absolute stability limit spinodal in negative pressures domain, where any liquid “breaks” and the homogeneous cavitation occurs. Taking this as the reference one should consider the “universal plot” based on the scale vs. instead of log10 P* vs. plot.
Following refs. (Voigtmann, 2006a,b) the model parameters are related to the LJ potential, which is considered as a realistic interaction model in liquids: VLJ(r) = 4U0[(r/σ)−12 − (r/σ)−6], for which the model temperature and pressure T* = kBT/U0 and P* = Pσ3/U0. To correlate experimental and model data the “arbitrary” scale shift is also used (see for comparison: Voigtmann, 2006a,b). Following scaling values were assumed: and for glycerol and and for albite.
Consequently, the “generic steep” anomaly disappears and Tg(P) experimental data for molecular glass formers can be mapped also to the low density (T* → 0) domain. When linking such analysis with Eq. 11 one also obtains the possibility of describing systems characterized by dTg/dP < 0, as shown for the extrapolated behavior for glycerol and for albite in Figure 7. Figure 7 also shows that the re-entrant glass-forming colloids mapped from experimental studies under atmospheric pressure to the P-T plane are related to the case dTg/dP < 0.
For glycerol, for very high pressures, the behavior described by emerges and the evolution approaches the hard sphere limit pattern (Voigtmann, 2006a). One of arguments for the generic importance of the “steepness” anomaly in Voigtmann (2006a,b) was the possibility of it reproduction by the model-fluid with LJ potential containing properly adjusted attraction term. However, for the analysis of in such model-fluid the absolute stability limit have to be taken into account: after the transformation P → ΔP the “generic steep anomaly” disappears also for the LJ model fluid.
Concluding, the plot vs. offers a nice frame for the “universal” presentation and comparison Tg(P) experimental and model based data. The crossover from dTg/dP > 0 → dTg/dP < 0 seems to be associated with and in such plot. This is the key feature of the intermediate regime II. There are no unique “generic” steep anomalies. Finally, worth indicating is the general difference between vs. data taken from “concentrational” experiment under atmospheric pressure (1) and from the real high-pressure experiment (2) for colloidal glass formers. The case (1) for re-entrant colloidal glass former can be linked to the group of systems where dTg/dP < 0. The characterization of the solvent is constant but the number of colloidal particles and distances between them can change when “decreasing pressure” (ϕ → 0). For such system the problem of the absolute stability limit is absent: it is naturally related to and the negative pressures domain does not exist. For the case (2), compressing changes notably not only not only distances between colloidal particles but also properties of the solvent. Changes of density of the solvent (typically ~ 30% for P ≈ 1 GPa) are associated with very strong changes in dynamics, particularly near the glass temperature. In this case “rarefication” associated with the isotropic stretching and entering pressures domain can yield even stronger changes for the solvent. Stretching is terminated by the absolute stability limit spinodal in negative pressures domain. All these show that for the case (1) properties of the colloidal glass former are dominated almost exclusively by colloidal particles. In the case (2), at least equally important is the impact of the solvent.
Figure 7 indicates the clear link between molecular and colloidal glass formers: they follow the same patter the plot vs. . Model fluids based on SW and LJ potentials offer the nice frame for getting the fundamental insight into experimental data within such presentation.
Concluding Remarks
This report presents proposals of few equations for describing the pressure evolution of the glass temperature beyond the dominated SG/AA pattern. They make the description of glass-forming systems where both dTg/dP > 0 and dTg/dP < 0 possible. The ways of portrayal were extended also for the evolution of Tg(V, ρ) and Pg(V, ρ). The basic relevance of including into the analysis negative pressures and the preliminary derivative-based and distortions-sensitive analysis has been shown. From results presented the possible general pattern for Tg(P) evolution for glass-forming systems ranging from low molecular weight liquids, resins, polymer melt, liquid crystals to colloidal fluids emerges.
In the low density region the extended SG-type equation can describe experimental data. On increasing pressures, for intermediate densities, the gradual inclusion of the “damping term” can lead to the reversal (re-entrant, dTg/dP < 0) vitrification. However, for strongly compressed and high density systems the crossover to the second, HS-type, dependence takes place. The crossover to this second type of vitrification can occur before reaching the maximum of Tg(P) as for glycerol or well beyond the maximum. For the model-normalized “universal” plot vs. such general characterization is manifested as the less or more marked S-shape. It is notable that this picture may be valid both for molecular and colloidal glass formers, although for the latter real high-pressure experiments are still required. For the dominated group of systems where dTg,m/dP > 0 most often the SG/AA-type (Tg,m(P)), Kraut–Kennedy type (Tg,m(V, ρ)) or Murnaghan type (Pg,m(V, ρ)) dependences are used. The discussion for the latter (Poirier, 2000; Skripov and Faizulin, 2006) indicates that notable distortions appears for ΔV/V0 → 1/2. Taking into account the compressibility of typical molecular liquids such domain starts for P ~ 1.5 GPa. In the opinion of the authors, equally important can be the distance of the reference point from the possible maximum of Tg(P), even if it is “hidden” by a phase transition or crossover to another form of vitrification.
Finally, we would like to stress the significance of the above discussion for the glass transition physics, material engineering and geophysical and planetary studies (Donth, 2000; Poirier, 2000, Berthier and Ediger, 2016; Rodríguez-Tinoco et al., 2016; Svenson et al., 2017).
Author Contributions
This is the inaugural paper of the Associate Editor of Frontiers in Materials: Glass Science. SR is the only author of the given paper but the author is grateful to Aleksandra Drozd-Rzoska for her impact on experiments recalled and discussions shaping the final form of the paper.
Conflict of Interest Statement
The author declares that the research was conducted in the absence of any commercial or financial relationships that could be construed as a potential conflict of interest.
Acknowledgments
The author is grateful to reviewers for their comments, which improved the clarity of few important issues within the paper.
Funding
This report was prepared due to the support of the National Centre for Science [Narodowe Centrum Nauki (NCN), Poland] grant ref. UMO-2016/21/B/ST3/02203.
References
Adrjanowicz, K., Kamiński, K., Koperwas, K., and Paluch, M. (2015). Negative pressure vitrification of the isochorically confined liquid in nanopores. Phys. Rev. Lett. 115, 265702. doi:10.1103/PhysRevLett.115.265702
Andersson, S. P., and Andersson, O. (1998). Relaxation studies of poly(propylene glycol) under high pressure. Macromolecules 31, 2999–3006. doi:10.1021/ma971282z
Angell, C. A. (2008). Glass-formers and viscous liquid slowdown since David Turnbull: enduring puzzles and new twists. MRS Bull. 33, 544–555. doi:10.1557/mrs2008.108
Angell, C. A., and Quing, Z. (1989). Glass in a stretched state formed by negative-pressure vitrification: trapping in and relaxing out. Phys. Rev. B 39, 8784–8787. doi:10.1103/PhysRevB.39.8784
Avramov, I., and Milchev, A. (1988). Effect of disorder on diffusion and viscosity in condensed systems. J. Non-Cryst. Solids 104, 253–260. doi:10.1016/0022-3093(88)90396-1
Bagdassarov, N. S., Maumus, J., Poe, B., Slutskiy, A. B., and Bulatov, V. K. (2004). Pressure dependence of Tg in silicate glasses from electrical impedance measurement. Phys. Chem. Glasses 45, 197–214.
Berthier, L., and Ediger, M. D. (2016). Facets of the glass transition. Phys. Today 69, 40–46. doi:10.1063/PT.3.3052
Böhmer, R., Ngai, K. L., Angell, C. A., and Plazek, D. J. (1993). Nonexponential relaxations in strong and fragile glass formers. J. Chem. Phys. 99, 4201–4217. doi:10.1063/1.466117
Burakovsky, L., Greeff, C., and Preston, D. (2003). Analytic model of the shear modulus at all temperatures and densities. Phys. Rev. B 67, 094107. doi:10.1103/PhysRevB.67.094107
Burakowsky, L., Preston, D. L., and Silbar, R. R. (2000). Analysis of dislocation mechanism for melting of elements. Pressure dependence. J. Appl. Phys. 88, 6294–6301. doi:10.1063/1.1323535
Caprion, D., and Schober, H. R. (2002). Influence of the quench rate and the pressure on the glass transition temperature in selenium. J. Chem. Phys. 117, 2814. doi:10.1063/1.1492797
Cook, R. L., King, H. E. Jr., Herbst, C. A., and Herschbach, D. R. (1994). Pressure and temperature dependent viscosity of two glass forming liquids: glycerol and dibutyl phthalate. J. Chem. Phys. 100, 5178–5189. doi:10.1063/1.467276
Dass, N. (1995). Melting maximum in alkali metals. Phys. Rev. B 52, 3023–3025. doi:10.1103/PhysRevB.52.3023
Deaton, B. C., and Blum, F. A. Jr. (1965). Properties of Group VI B Elements Under Pressure. I. Melting Curves of S, Se, and Te. Phys. Rev. 137, A1131–A1140. doi:10.1103/PhysRev.137.A1131
Deb, S. K., Wilding, M., Somayazulu, M., and McMillan, P. F. (2001). Pressure-induced amorphization and an amorphous-amorphous transition in densified porous silicon. Nature 414, 528–530. doi:10.1038/35107036
Demus, D., and Pelzl, G. (1988). Early Cases of reentrant behaviour. Liq. Cryst. Today 8, 1–4. doi:10.1080/13583149808047691
Donth, E. (2000). The Glass Transition: Relaxation Dynamics in Liquids and Disordered Materials. Berlin: Springer Verlag.
Drozd-Rzoska, A. (2005). Pressure dependence of the glass transition in supercooled liquids. Phys. Rev. E 72, 041505. doi:10.1103/PhysRevE.72.041505
Drozd-Rzoska, A. (2006). Heterogeneity-related dynamics in isotropic n-pentylcyanobiphenyl. Phys. Rev. E 73, 022501. doi:10.1103/PhysRevE.73.022501
Drozd-Rzoska, A. (2009). Glassy dynamics of liquid crystalline 4’-n-pentyl-4-cyanobiphenyl in the isotropic and supercooled nematic phases. J. Chem. Phys. 130, 234910. doi:10.1063/1.3153349
Drozd-Rzoska, A., and Rzoska, S. J. (2006). On the derivative-based analysis for temperature and pressure evolution of dielectric relaxation times in vitrifying liquids. Phys. Rev. E 73, 041502. doi:10.1103/PhysRevE.73.041502
Drozd-Rzoska, A., Rzoska, S. J., and Imre, A. R. (2007a). On the pressure evolution of the melting temperature and the glass transition temperature. J. Non-Cryst. Solids 353, 3915–3923. doi:10.1016/j.jnoncrysol.2007.04.040
Drozd-Rzoska, A., Rzoska, S. J., Paluch, M., Imre, A. R., and Roland, C. M. (2007b). On the glass temperature under extreme pressures. J. Chem. Phys. 126, 165505. doi:10.1063/1.2721044
Drozd-Rzoska, A., Rzoska, S. J., Pawlus, S., and Tamarit, J. L. (2006a). Dielectric relaxation in compressed glassy and orientationally disordered mixed crystal. Phys. Rev. B 74, 064201. doi:10.1103/PhysRevB.74.064201
Drozd-Rzoska, A., Rzoska, S. J., Pawlus, S., and Tamarit, J. L. (2006b). Dynamic crossover and the dynamic scaling description in vitrifying of orientationally disordered crystal. Phys. Rev. B 73, 224205. doi:10.1103/PhysRevB.73.224205
Drozd-Rzoska, A., Rzoska, S. J., and Roland, C. M. (2008). On the pressure evolution of dynamic properties in supercooled liquids. J. Phys. Condens. Matter 20, 244103. doi:10.1088/0953-8984/20/24/244103
Floudas, G., Paluch, M., Grzybowski, A., and Ngai, K. L. (2011). Molecular Dynamics of Glass Forming Liquids: Effects of Pressure. Berlin: Springer Verlag.
Ford, P. J., Saunders, G. A., Lambson, E. F., and Carini, G. (1988). Pressure dependence of elastic constants of amorphous selenium near the glass transition region. Phys. Scr. 37, 894–897. doi:10.1088/0031-8949/37/6/008
Fulcher, G. S. (1925). Analysis of recent measurements of the viscosity of glasses. J. Am. Ceram. Soc. 8, 339–355. doi:10.1111/j.1151-2916.1925.tb16731.x
Gilvarry, J. J. (1966). Lindemann and Grüneisen laws and a melting law at high pressure. Phys. Rev. Lett. 16, 1089–1091. doi:10.1103/PhysRevLett.16.1089
Giovambattista, N., Loerting, T., Lukanov, B. R., and Starr, F. W. (2012). Interplay of the glass transition and the liquid-liquid phase transition in water. Sci. Rep. 2, 390. doi:10.1038/srep00390
Grüneisen, E. (1912). Theorie des festen zustandes einatomiger elemente. Ann. Phys. 344, 257–306. doi:10.1002/andp.19123441202
Höhne, G. W. H. (1999). High pressure differential scanning calorimetry on polymers. Thermochim. Acta 332, 115–123. doi:10.1016/S0040-6031(99)00066-0
Höhne, G. W. H., Rastogib, S., and Wunderlich, B. (2000). High pressure differential scanning calorimetry of poly(4-methyl-pentene-1). Polymer 41, 8869–8878. doi:10.1016/S0032-3861(00)00230-5
Hu, Y.-C., Guan, P.-F., Wang, Q., Yang, Y., Bai, H.-Y., and Wang, W.-H. (2017). Pressure effects on structure and dynamics of metallic glass-forming liquid. J. Chem. Phys. 146, 024507. doi:10.1063/1.4973919
Imre, A. R., Maris, H. J., and Williams, P. R. (2002). Liquids under Negative Pressures. Dordrecht: Kluwer.
Imre, A. R., and Rzoska, S. J. (2010). High-pressure melting curves and liquid–liquid phase transition. Adv. Sci. Lett. 3, 527–530. doi:10.1166/asl.2010.1143
Januchta, K., Randall, W. E., Goel, A., Bauchy, M., Rzoska, S. J., Boćkowski, M., et al. (2016). Volume and structure relaxation in compressed sodium borate. Phys. Chem. Chem. Phys. 18, 29879–29989. doi:10.1039/c6cp06341a
Januchta, K., Youngman, R. E., Goel, A., Bauchy, M., Logunov, S. L., Rzoska, S. J., et al. (2017). Discovery of Ultra-Crack-Resistant Oxide Glasses with Adaptive Networks. ACS Chem. Mater. 29, 5865–5876. doi:10.1021/acs.chemmater.7b00921
Johari, G. P., and Whalley, E. P. (1972). Dielectric Properties of glycerol in the range 0.1-105 Hz, 218-357 K, 0-53 kbar. Faraday Symposia Chem. Soc. 6, 23–41. doi:10.1039/FS9720600023
Kanno, H., Shirotani, I., and Minomura, S. (1981). Pressure dependence and cationic radius effect of the glass transition temperature in aqueous alkali acetate solutions. Bull. Chem. Soc. Jpn. 54, 2607–2609. doi:10.1246/bcsj.54.2607
Katayama, Y., Mizutami, T., Utsumi, W., Shimomura, P., Yamakata, M., and Funakoshi, K. (2000). A first-order liquid–liquid phase transition in phosphorus. Nature 403, 170. doi:10.1038/35003143
Kechin, V. V. (1995). Thermodynamically based melting curve equation. J. Phys. Condens. Matter 7, 531–535. doi:10.1088/0953-8984/7/3/008
Kechin, V. V. (2001). Melting curve equation at high pressures. Phys. Rev. B 65, 052102. doi:10.1103/PhysRevB.65.052102
Kraut, E. A., and Kennedy, G. C. (1966). New melting law at high pressures. Phys. Rev. Lett. 16, 608–609. doi:10.1103/PhysRevLett.16.608
Kumari, M., and Dass, N. (1988). The melting laws. Phys. Status Solidi B 146, 105–108. doi:10.1002/pssb.2221460108
Lindemann, F. A. (1910). Über die berechnung molekularer eigenfrequenzen. Physikalishes Zeischrirft 11, 609–612. doi:10.1002/andp.19143502104
Martinez-Garcia, J. C., Rzoska, S. J., Drozd-Rzoska, A., and Martinez-Garcia, J. (2013). A universal description of ultraslow glass dynamics. Nat. Commun. 4, 1823. doi:10.1038/ncomms2797
Martinez-Garcia, J. C., Rzoska, S. J., Drozd-Rzoska, A., Martinez-Garcia, J., and Mauro, J. C. (2014). Divergent dynamics and the Kauzmann temperature in glass forming systems. Sci. Rep. 4, 5160. doi:10.1038/srep05160
Martinez-Garcia, J. C., Rzoska, S. J., Drozd-Rzoska, A., Starzonek, S., and Mauro, J. C. (2015). Fragility and basic process energies in vitrifying system. Sci. Rep. 5, 8314. doi:10.1038/srep08314
McKinney, J. E., and Goldstein, M. (1974). PVT relationships for liquid and glassy poly(vinyl acetate). J. Res. Natl. Bur. Stand. 78, 331–353. doi:10.6028/jres.078A.018
Murnaghan, F. D. (1944). The compressibility of media under extreme pressures. Proc. Natl. Acad. Sci. U.S.A. 30, 244–247. doi:10.1073/pnas.30.9.244
Paluch, M., Rzoska, S. J., and Zioło, J. (1998). On the pressure behaviour of dielectric relaxation times in supercooled, glassforming liquids. J. Phys. Condens. Matter 10, 4131–4138. doi:10.1088/0953-8984/10/19/001
Paluch, M., Zioło, J., Rzoska, S. J., and Habdas, P. (1996). High pressure and temperature dependence of dielectric relaxation in supercooled di-isobutyl phthalate. Phys. Rev. E 54, 4010–4013. doi:10.1103/PhysRevE.54.4008
Pham, K. N., Puertas, A. M., Bergenholtz, J., Egelhaaf, S. U., Moussaïd, A., Pusey, P. N., et al. (2002). Multiple glassy states in a simple model system. Science 296, 104–106. doi:10.1126/science.1068238
Poirier, J. P. (2000). Introduction to the Physics of the Earth’s Interior. New York: Cambridge University Press.
Porowski, S., Sadovyi, B., Gierlotka, S., Rzoska, S. J., Grzegory, I., Petrusha, I., et al. (2015). The challenge of decomposition and melting of gallium nitride under high pressure and high temperature. J. Phys. Chem. Solids 85, 138–143. doi:10.1016/j.jpcs.2015.05.006
Pronin, A. A., Kondrin, M. V., Lyapin, A. G., Brazkhin, V. V., Volkov, A. A., Lunkenheimer, P., et al. (2010). Glassy dynamics under superhigh pressure. Phys. Rev. E 81, 041503. doi:10.1103/PhysRevE.81.041503
Ramesh, K. (2014). Pressure dependence of glass transition in As2Te3 glass. J. Phys. Chem. B 118, 8848–8853. doi:10.1021/jp504290z
Ramesh, K., Naresh, N., Pumlianmunga, P., and Gopal, E. S. R. (2016). Shift of glass transition temperature under high pressure for Ge20Te80 glass. Key Eng. Mater. 702, 43–47. doi:10.4028/www.scientific.net/KEM.702.43
Rein, C., and Demus, D. (1992). Mathematical description of strongly nonlinear pressure dependence of phase transition temperatures. Cryst. Res. Technol. 28, 273–278. doi:10.1002/crat.2170280222
Rodríguez-Tinoco, C., González-Silveira, M., Barrio, M., Lloveras, P., Tamarit, J. L., Garden, J.-L., et al. (2016). Ultrastable glasses portray similar behavior to ordinary glasses at high pressure. Sci. Rep. 6, 34296. doi:10.1038/srep34296
Roland, C. M., Bogoslovov, R. B., Casalini, R., Ellis, A. R., Bair, S., Rzoska, S. J., et al. (2008). Thermodynamic scaling and characteristic relaxation time at the phase transition in liquid crystals. J. Chem. Phys. 128, 224506. doi:10.1063/1.2931541
Roland, C. M., and Casalini, R. (2003). Temperature and volume effects on local segmental relaxation in poly(vinyl acetate). Macromolecules 36, 1361–1367. doi:10.1021/ma025791z
Roland, C. M., Hensel-Bielowka, S., Paluch, M., and Casalini, R. (2005). Supercooled dynamics of glass-forming liquids and polymers under hydrostatic pressure. Rep. Prog. Phys. 8, 1405–1478. doi:10.1088/0034-4885/68/6/r03
Rzoska, S. J., Mazur, V., and Drozd-Rzoska, A. (2010). Metastable Systems under Pressure. Springer Verlag
Schlosser, H., Vinet, P., and Ferrante, J. (1989). Pressure dependence of the melting temperature of metals. Phys. Rev. B 40, 5929–5935. doi:10.1103/PhysRevB.40.5929
Sciortono, F., Essmann, U., Stanley, H. E., Hemmati, M., Shao, J., Wolf, H., et al. (1995). Crystal stability limits at positive and negative pressures, and crystal-to-glass transitions. Phys. Rev. E 52, 6484–6490. doi:10.1103/PhysRevE.52.6484
Simon, F. E., and Glatzel, G. (1929). Bemerkungen zur Schmelzdruckkurve. Zeitschrift fuer Anorganische und Allgemeine Chemie 178, 309. doi:10.1002/zaac.19291780123
Skripov, V. P., and Faizulin, M. Z. (2006). Crystal-Liquid-Gas Phase Transitions and Thermodynamic Stability. Weinheim: WILEY-VCH.
Smedskjaer, M. M., Rzoska, S. J., Bockowski, M., and Mauro, J. C. (2014). Mixed alkaline earth effect in the compressibility of aluminosilicate glasses. J. Chem. Phys. 140, 054511. doi:10.1063/1.4863998
Svenson, M. N., Mauro, J. C., Rzoska, S. J., Bockowski, M., and Smedskjaer, M. M. (2017). Accessing forbidden glass regimes through high-pressure sub-Tg annealing. Sci. Rep. 7, 46631. doi:10.1038/srep4663
Tanaka, K. (1984). Photodarkening in amorphous As2S3 and Se under pressure. Phys. Rev. B 30, 4549. doi:10.1103/PhysRevB.30.4549
Tonkov, E. Y., and Ponyatovsky, E. G. (2004). Phase Transformation of Elements under High Pressure. Boca Raton: CRC PRESS.
Tropin, T. V., Gutzov, I., and Schick, C. (2012). On the theoretical determination of the Prigogine – Defay ratio in glass transition. J. Chem. Phys. 136, 124502. doi:10.1063/1.3694531
Trybuła, Z., and Stankowski, J. (1998). Coexistence of paraelectric/proton-glass and ferroelectric (antiferroelectric) orders in Rb1-x(NH4)xH2AsO4 crystals. Condens. Matter Phys. 1, 311–330. doi:10.5488/CMP.1.2.311
Turnbull, D. (1969). Under what condition can a glass be formed. Contemp. Phys. 10, 473–488. doi:10.1080/00107516908204405
Vaidya, S. N., Akella, J., and Kennedy, G. C. (1969). Melting of germanium to 65 kbar. J. Phys. Chem. Solids 30, 1411–1413. doi:10.1016/0022-3697(69)90203-0
Vogel, H. (1921). Temperaturabhaengigkeitsgesetz der Viskositaet von Fluessigkeiten. Physikalisches Zeitschrift 22, 645–646.
Voigtmann, T. (2006a). Glasses under pressure: a link to colloidal science. J. Phys. Condens. Matter 18, L465–L469. doi:10.1088/0953-898
Voigtmann, T. (2006b). Idealized glass transitions under pressure: dynamics versus thermodynamics. Phys. Rev. Lett. 101, 095701. doi:10.1103/PhysRevLett.101.095701
Keywords: glass transition, high pressures, negative pressures, melting, universality, dynamics, glass-forming ability
Citation: Rzoska SJ (2017) New Challenges for the Pressure Evolution of the Glass Temperature. Front. Mater. 4:33. doi: 10.3389/fmats.2017.00033
Received: 30 April 2017; Accepted: 16 October 2017;
Published: 27 November 2017
Edited by:
Lothar Wondraczek, Friedrich-Schiller-Universität Jena, GermanyReviewed by:
Limin Wang, Yanshan University, ChinaBu Wang, University of California, Los Angeles, United States
Copyright: © 2017 Rzoska. This is an open-access article distributed under the terms of the Creative Commons Attribution License (CC BY). The use, distribution or reproduction in other forums is permitted, provided the original author(s) or licensor are credited and that the original publication in this journal is cited, in accordance with accepted academic practice. No use, distribution or reproduction is permitted which does not comply with these terms.
*Correspondence: Sylwester J. Rzoska, sylwester.rzoska@unipress.waw.pl