Formation of Silica-Lysozyme Composites Through Co-Precipitation and Adsorption
 Daniela B. van den Heuvel1,2*
 Tomasz M. Stawski1,3
Dominique J. Tobler4
Richard Wirth3
Tomasz M. Stawski1,3
Dominique J. Tobler4
Richard Wirth3
 Caroline L. Peacock1
Liane G. Benning1,3,5
Caroline L. Peacock1
Liane G. Benning1,3,5
- 1Cohen Geochemistry Group, Earth Surface Science Institute, School of Earth and Environment, Faculty of Environment, University of Leeds, Leeds, United Kingdom
- 2Rock-Water Interaction Group, Institute of Geological Sciences, University of Bern, Bern, Switzerland
- 3Interface Geochemistry, German Research Centre for Geosciences, Potsdam, Germany
- 4Nano-Science Centre, Department of Chemistry, University of Copenhagen, Copenhagen, Denmark
- 5Geochemistry Group, Department of Earth Sciences, Free University of Berlin, Berlin, Germany
Interactions between silica and proteins are crucial for the formation of biosilica and the production of novel functional hybrid materials for a range of industrial applications. The proteins control both precipitation pathway and the properties of the resulting silica–organic composites. Here, we present data on the formation of silica–lysozyme composites through two different synthesis approaches (co-precipitation vs. adsorption) and show that the chemical and structural properties of these composites, when analyzed using a combination of synchrotron-based scattering (total scattering and small-angle X-ray scattering), spectroscopic, electron microscopy, and potentiometric methods vary dramatically. We document that while lysozyme was not incorporated into nor did its presence alter the molecular structure of silica, it strongly enhanced the aggregation of silica particles due to electrostatic and potentially hydrophobic interactions, leading to the formation of composites with characteristics differing from pure silica. The differences increased with increasing lysozyme content for both synthesis approaches. Yet, the absolute changes differ substantially between the two sets of composites, as lysozyme did not just affect aggregation during co-precipitation but also particle growth and likely polymerization during co-precipitation. Our results improve the fundamental understanding of how organic macromolecules interact with dissolved and nanoparticulate silica and how these interactions control the formation pathway of silica–organic composites from sodium silicate solutions, a widely available and cheap starting material.
Introduction
Over the last few years, interactions between silica particles and organic macromolecules in general, and silica–protein interaction in particular, have sparked renewed interest due to the dominant role of proteins in biological processes [e.g., biosilicification, Coombs and Volcani (1968), Simpson and Volcani (1981), Perry and Keeling-Tucker (2000), Otzen (2012)] and because silica–organic hybrid materials have proven to be crucial in a plethora of material science applications (Sumper and Brunner, 2006; Wang et al., 2013).
In this study, we use the protein lysozyme to study the formation pathways of silica–lysozyme composites. Lysozyme has been shown previously to act as a catalyst for silica colloid formation from silicon alkoxide solutions (TEOS/TMOS; Luckarift et al., 2006; Ramanathan et al., 2009) as well as dilute solutions of Waterglass at neutral pH (Coradin et al., 2003). Lysozyme also aggregates newly synthesized (Coradin et al., 2003; Luckarift et al., 2006; Ramanathan et al., 2009) as well as pre-formed and commercially available silica colloids (Bharti et al., 2011; Kumar et al., 2014). During aggregation, lysozyme is incorporated into the precipitates formed, resulting in hybrid materials with unique properties ideal for enzyme encapulsation on biosensor surfaces (Ramanathan et al., 2009) or for antifouling coatings and paints (Luckarift et al., 2006). Despite this range of applications, a molecular understanding of how the synthesis pathway leading to such silica–protein composites affects the final hybrid materials’ morphology (and thus functionality) is still lacking.
Lysozyme is a small prolate ellipsoidal protein (3 nm × 4.5 nm) with a molecular mass of 14.3 kDa. It consists of 129 amino acids, including 6 lysine and 11 arginine residues exposed at the surface of the molecule [Figure S1 in Supplementary Material, Canfield (1963), Jollès et al. (1963)]. This gives the molecule an overall positive surface charge over a large pH range [pHIEP = 11.1, Haynes and Norde (1994)] making electrostatic interactions with negatively charged silica monomers, nanoparticles, and surfaces possible (Coradin et al., 2003; Bharti et al., 2011; Kumar et al., 2011). The interaction between these organic macromolecules and silica occurs mainly by electrostatic interaction of primary amino groups (–NH2) with silica (Sumper and Brunner, 2008; Otzen, 2012), although hydrophobic interactions may also contribute (see below). The positively charged amino groups attract the partly deprotonated monosilicic acid and/or negatively charged oligomeric or colloidal silica and are inferred to enhance concentration locally (Coradin et al., 2002), therefore, facilitating precipitation and aggregation. Similar structure-derived electrostatic effects have been shown to facilitate interactions (self-assembly) of dissolved silica with proteins from the silaffin group and long chain long-chain polyamines. These macromolecules have been isolated from the cells of certain types of phytoplankton (diatoms) where they are known to control the characteristics of the resulting solid cell walls (Sumper and Brunner, 2008).
Adsorption of lysozyme onto silica surfaces can result in the partial loss of secondary and tertiary lysozyme structure, i.e., the conversion of alpha helices to beta sheets and the deformation of the overall shape of the lysozyme molecule (Norde and Favier, 1992; Billsten et al., 1995; Vertegel et al., 2004; Kubiak-Ossowska and Mulheran, 2010; Felsovalyi et al., 2011). The structural changes become more significant when lysozyme is adsorbed onto non-flat surfaces such as nanoparticle surfaces with strong curvature (Kubiak and Mulheran, 2009; Gagner et al., 2011; Hao et al., 2014). Due to the partial unfolding, the more hydrophobic core of the lysozyme molecule is exposed. This leads to hydrophobic interactions among unfolded adsorbed lysozyme molecules in order to minimize contact with water (Gagner et al., 2011). Thus, the adsorption of lysozyme onto silica and subsequent aggregation to form a composite is believed to be controlled by electrostatic as well as hydrophobic interactions. Lysozyme incorporates into the precipitate during this process, leading to composites with different properties compared to purely inorganic silica precipitates (Gordon et al., 2009). These composites have been found to show antibacterial properties similar to native lysozyme, despite the protein’s denaturation (Luckarift et al., 2006).
In this study, we have investigated the composition and microstructures of silica–lysozyme composites formed by co-precipitation and adsorption. In the co-precipitation synthesis, lysozyme was added to a solution of dissolved inorganic silica before initializing polymerization and nanoparticle formation. Lysozyme could thus potentially interact with silica mono- and polymers as well as nanoparticles during nucleation, particle growth, and aggregation. For the adsorption experiments, lysozyme was added to a solution containing already formed silica nanoparticles, where the presence of lysozyme could only cause particle aggregation. By comparing the results of these two sets of experiments, we were able to differentiate between the effects of lysozyme on polymerization and particle growth and its effect on aggregation of inorganic silica. We show that lysozyme becomes incorporated into the silica precipitates and that the concentration of lysozyme in solution and the time it is added strongly affect the properties of the composites.
Materials and Methods
Preparation of Silica–Lysozyme Composites
Sodium metasilicate (Na2SiO3·5·H2O, technical grade), hen egg white lysozyme (crystalline, powdered), HCl (37% fuming, analytical grade), and 1 M NaOH (analytical grade) were obtained from Sigma-Aldrich. Stock solutions of pure silica (1,000 ppm, pH ~12.5) and pure lysozyme (5 wt.%, pH ~3.5) were prepared by dissolving the required amount of silica/lysozyme in ultrapure deionized water (MilliQ, ~ 18.2 MΩ cm). For the co-precipitation experiments, the silica stock solution was acidified first to pH 9.5–10 with 37% HCl, before adding variable amounts of lysozyme stock solution to obtain solutions ranging from 25 to 1,000 ppm lysozyme (Table S2 in Supplementary Material). The pre-acidification step was performed in order to prevent damage to the lysozyme molecule at high pH. The solutions were then acidified to pH = 7.1 ± 0.1 and placed in an orbital shaker for 12 to 16 h. For the adsorption experiments the 1,000 ppm silica stock solution was neutralized (pH = 7.1 ± 0.1) in a single step by adding 37% HCl and left to polymerize in an orbital shaker for 12–16 h. Variable amounts of lysozyme stock solution were then added to these nanoparticle-containing solutions to obtain solutions ranging from 100 to 1,000 ppm lysozyme (Table S2 in Supplementary Material). The mixtures were again left in an orbital shaker for 12 to 16 h.
Characterization of Colloidal Suspensions
The pure silica and composite colloidal solutions were analyzed by synchrotron-based small-angle X-ray scattering (SAXS) at the Bio-SAXS beamline P12 of the EMBL at PETRA III, DESY, Germany (Blanchet et al., 2015) Measurements were performed by using a monochromatic X-ray beam at 10 keV and two-dimensional scattered intensities were collected at small-angles with a Dectris Pilatus 2 M (2D large area pixel-array detector). Transmission was measured by means of a photodiode installed in the beam-stop of the SAXS detector. A sample-to-detector distance of ~3 m allowed for a usable q-range of ~0.04 < q < 4.5 nm−1. The scattering-range at small-angles was calibrated against silver behenate and dry collagen standards. The samples were loaded into an automated sample changer (Round et al., 2015) and transferred to an in-vacuum quartz capillary (ID 1.7 mm, wall thickness 50 µm) for analyses. The acquisition time per frame was 1 s for the co-precipitation, and 50 ms for the adsorption experiments. Furthermore, we also measured a series of backgrounds and reference samples including an empty capillary and a capillary filled with water, silica stock solution, and lysozyme stock solution. SAXS data processing and reduction included primarily masking of undesired pixels, normalizations and correction for transmission, background subtraction and data integration to 1D. These steps were performed automatically post-data collection at P12. Additionally, the ζ-potential was determined on subsamples of the colloidal solutions of pure silica and composites as well as the lysozyme stock solution (1,000 ppm) using a Malvern Zetasizer Nano ZS and DTS1070 cells. The pH was adjusted to values between pH 2 and 10 with dilute HCl or NaOH to a separate aliquot of sample. Each measurement was repeated three times.
Characterization of Washed and Dried Precipitates
At the end of the co-precipitation and adsorption experiments, the silica–lysozyme mixtures were transferred into an oven and the aqueous solvent evaporated at 40°C for ~48 h. The dried powders were washed 5 times with MilliQ water to remove excess lysozyme and salts followed by a final drying step at 40°C [omitted for the sample aliquots used for pair distribution function (PDF) analyses]. The samples were stored at 4°C until further analysis. The dry solids were analyzed by powder X-day diffraction [X-ray diffraction (XRD), Bruker D8, Cu Kα radiation, 0.3°min−1 from 5° to 90°] and XRD patterns were evaluated using the EVA software (Bruker, Version 3.0). In addition, wet aliquots of solids were analyzed by synchrotron-based total scattering [high-energy X-ray diffraction (HEXD), PDF, ~60 keV, λ = 0.21280 Å] at beamline 11-ID-B at the Advanced Photon Source at Argonne National Laboratory (USA) by using a Perkin Elmer amorphous silicon detector. A CeO2 standard was used to calibrate the sample-to-detector distance and to align the detector with the incident beam path. A water-filled capillary was measured for background corrections. The data reduction was done using the software Fit-2D (Hammersley, 1998), while the total scattering measurements were background corrected and converted to PDF plots using PDFgetX2 (Qiu et al., 2004). Further details on the performed PDF analysis can be found in Tobler et al. (2015). The molecular formulae used to obtain the reduced structure factor functions were SiO2 × 0.5·H2O for silica and C613H959N193O185S10 for lysozyme. The PDFs for all silica-lysozyme composites and the pure silica and lysozyme samples were calculated from the Fourier transform of the reduced structure function truncated at ~17.7 Å−1. Dry samples were also analyzed by Fourier transform infrared spectroscopy (FTIR, A2 Technology Microlab, 1024 scans co-added, range 4,000 to 650 cm−1, resolution 4 cm−1) with spectra processed using the Nicolet FTIR OMNIC software, E.S.P. 5.1. The amount of lysozyme associated with the composites was quantified by determining the total carbon content in solids by mass spectrometry (DELTAplusXL ThermoFisher) with a Carlo-Erba NC2500. From these analyses the lysozyme content was calculated using the molecular formula C613H959N193O185S10 and molecular weight of 14.313 g/mol for lysozyme (ProtParam based on UniProtKB entry P00698, Gasteiger et al., 2005). Particle sizes of silica in the composites as well as the composite textures and morphologies were evaluated by high-resolution transmission electron microscopy (HR-TEM, FEI TECNAI F20 X-Twin, 200 kV) combined with energy electron loss spectroscopy [electron energy loss spectroscopy (EELS), using a Gatan GIF detector] and energy dispersive spectrometry (using a SiLi detector).
Results and Discussion
Composition of Silica–Lysozyme Composites
The pure silica and all silica–lysozyme composites, regardless whether produced through co-precipitation or adsorption, revealed only a single broad XRD peak at ~24° 2θ (Figure S2 in Supplementary Material), indicating their amorphous character as expected. PDFs derived from synchrotron-based high-energy X-ray diffraction (HEXD) confirmed the amorphous nature of all samples by showing attenuation of PDF plots at <10 Å and only very small coherent scattering domains (Figure 1). The PDF for pure silica revealed a dominant peak at ~1.7 Å (Si-O), followed by a series of smaller peaks up to 6 Å (Si–Si, O–O; Bowron, 2008; Dyer et al., 2010). The PDF of the pure lysozyme on the other hand showed dominant peaks at ~1.5 and 2.3 Å (C–C overlapping with C–N and C–O; Wang et al., 2007). For the composites, the peak positions and G(r) were identical to pure silica (Figure 1). The absence of any trace of lysozyme in the PDFs of the composite samples was due to the substantially lower scattering power of lysozyme, which rendered it “invisible” in the presence of silica. Nevertheless, if the presence of lysozyme considerably altered the silica structure at the molecular level or any Si–C or Si–N bonds had formed, a shift in the peak positions in the PDFs of the composite samples would be expected. Instead, no changes in the atom pair-distances were seen for the composites, indicating colloid-level interactions only.
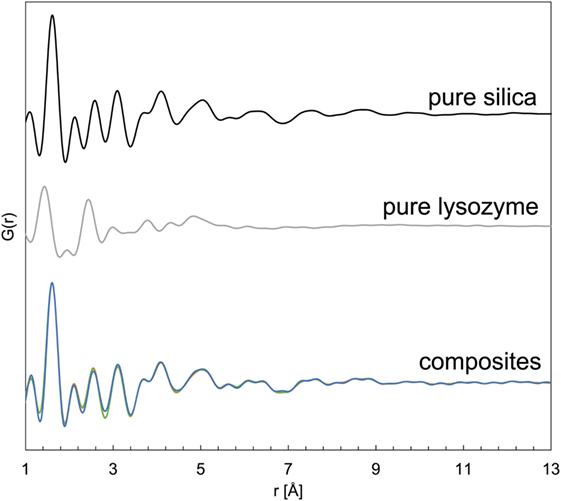
Figure 1. Pair distribution functions for pure silica, pure lysozyme, and silica–lysozyme composites formed by co-precipitation and adsorption.
In order to identify the mode in which the lysozyme was associated with the silica in the composites, aliquots of the bulk samples were analyzed using FTIR spectroscopy (Figure 2; Table S1 in Supplementary Material). The FTIR spectra of pure silica showed prominent bands at 750 to 1,300 cm−1, corresponding to stretching and vibration of the siloxane and silane bonds. In the spectra of pure lysozyme, the characteristic bands were at 1,200 to 1,700 cm−1 and corresponded to the vibrations of amide groups and stretching of carboxylic and nucleic acids. Both, the pure silica and lysozyme showed a broad band at ~3,300–3,400 cm−1 that corresponded to vibrations of water, which is associated with the silica nanoparticles (adsorbed water and structural hydroxyl groups), water molecules included in the protein layer as well as trapped in dead end pores during composite formation. However, based on the data available, the individual contribution of these three water reservoirs could not be distinguished. The FTIR spectra of the composite samples exhibited all bands described above for pure silica and lysozyme. Additionally, they showed a clear increase in the relative absorbance of the amide bands (~1,650 and ~1,540 cm−1) compared to the main silica band (1,060 cm−1) with an increase in the amount of lysozyme added during composite formation. There are no additional bands which could correspond to silicon–carbon or silicon–nitrogen pairs, confirming the conclusions derived from the PDF data that lysozyme did not affect silica at the molecular level and no chemical interactions between silica and lysozyme took place.
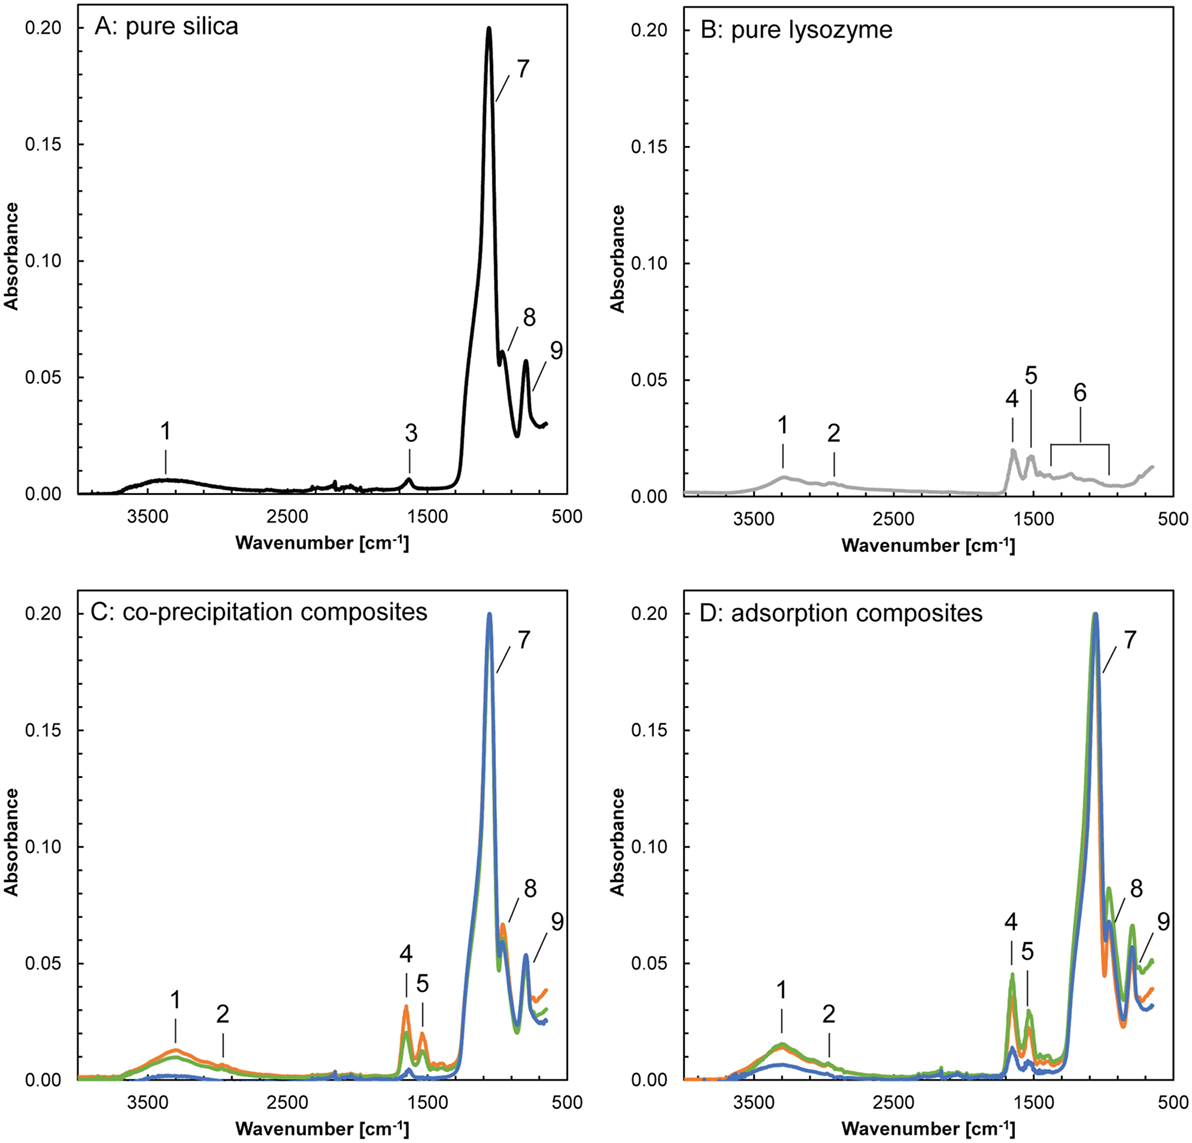
Figure 2. Fourier transform infrared spectra of pure silica, pure lysozyme and the composites formed by co-precipitation and adsorption (blue: 100 ppm added, green: 500 ppm added, orange: 1,000 ppm added). The frequencies and band assignments (1–9) are in accordance with Benning et al. (2004) and are listed in Table S1 in Supplementary Material.
In order to evaluate lysozyme contents within the composites, their carbon content was analyzed. For both composite types, the results (Table S2 in Supplementary Material) show that the amount of lysozyme associated with the composites increased with increasing lysozyme concentration in solution (Figure 3). In the adsorption synthesis, the increase of lysozyme associated with the silica was gradual, reaching a maximum lysozyme content of 32 wt.% when co-precipitated in the presence of 500 ppm lysozyme. Thereafter, an increase in the added lysozyme content did not result in more lysozyme associated with the adsorption composites. The presence of such a threshold concentration was also observed in previous studies. Kumar et al. (2014) and Vertegel et al. (2004) observed a threshold concentration of lysozyme when adsorbed onto silica nanoparticles of 9 and 20 nm, respectively, and interpreted this to be due to the completion of a monolayer. At around neutral pH this monolayer cannot be densely packed due to the inter-particle repulsion of lysozyme, resulting in a very small number of protein molecules adsorbed per silica nanoparticle (Vertegel et al., 2004; Kumar et al., 2014). Other studies reported continuously increasing adsorption even at lysozyme concentrations >1,000 ppm and found that the molecules adsorb in bilayers on silica. However, these studies were conducted on flat silica surfaces (Wahlgren et al., 1995; Su et al., 1998a,b) or large (100 nm) silica nanoparticles (Vertegel et al., 2004). The stronger electrostatic interactions between these larger surfaces and the lysozyme result in stronger attractive forces, which allow the inter-particle repulsions to be overcome. This is supported by the results of Su et al. (1998b) who showed that bilayer formation was prevented at pH 4 where silica–lysozyme attractive forces were weakened as the isoelectric point of silica was approached (pHIEP = 1–2, Parks, 1965) and inter-particle repulsions became stronger than the electrostatic interactions between silica and lysozyme.
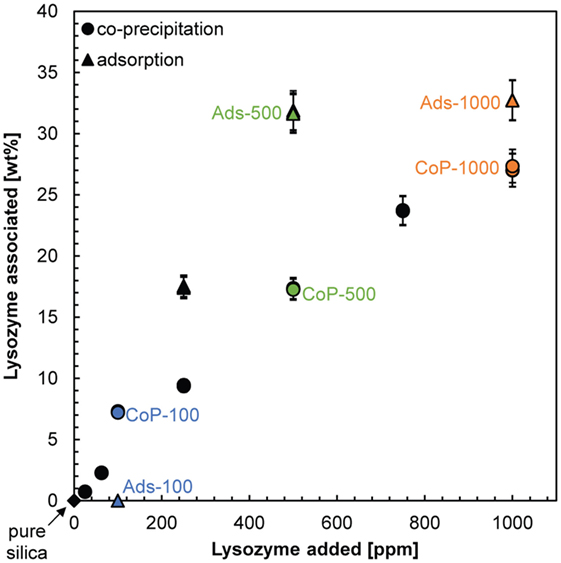
Figure 3. Relationship between the concentrations of lysozyme added to the dissolved or colloidal silica solution at the beginning of the co-precipitation (circles) and adsorption synthesis (triangles) and the amount of lysozyme associated with the composites. Labeled are the pure silica sample (black diamond) and the composites on which most analyses were carried out (colored symbols).
For the co-precipitation composites, the increase of lysozyme associated with the silica was also gradual, but less steep (Figure 3) and a maximum lysozyme content of 27 wt.% was reached for 1,000 ppm lysozyme added during synthesis. Thus, in contrast to the adsorption synthesis, no plateau in the amount of associated lysozyme was reached. Potentially, a plateau would be reached once the amount of lysozyme associated with the co-precipitated composites would reach >30 wt.% but we have no data to follow up on this assumption. In any case, the “loading capacity” of silica–lysozyme composites formed by co-precipitation appears to be lower, i.e., for the same amount of lysozyme in solution less lysozyme can be incorporated into the composites. This suggests that, in at least one of the synthesis pathways, the incorporation of lysozyme into the composites is not random but controlled by silica–lysozyme interactions in solution, which can, e.g., affect an average size of growing silica particles and hence their surface area and colloidal interactions. To better elucidate these interactions, we investigated the structure of the two types of composites in more detail.
Structure of Silica–Lysozyme Composites
To assess the structure of the composites at the nanoscale, high-resolution transmission electron microscopy (HR-TEM) was performed on the composites. Bright-field images of the pure silica and the composites looked almost identical and showed aggregates of nanospheres (5–10 nm), characterized by an uneven surface (Figures 4A–C). In these images, silica and lysozyme could not be differentiated, even at the highest resolution. Thus, we collected energy-filtered maps, where energy was tuned for a specific element (carbon and silicon, respectively) based on EELS. These maps (Figures 4D,E) revealed relatively well-mixed domains with some areas with higher carbon concentrations (in red; for differentiation between carbon support grid and carbon in lysozyme, see Figure S3 in Supplementary Material). In both types of composites, such carbon-rich areas were distributed relatively homogeneously throughout the precipitate (Figures 4D,E). These carbon-rich (red) areas in the elemental maps do not represent distinct lysozyme molecules as they are smaller than the dimensions of native lysozyme molecules [ellipsoid, 3 nm × 4.5 nm, Canfield (1963); Jollès et al. (1963)] but molecules deformed due to conformational changes. This indicates that lysozyme interacted with silica particles in solution and adsorbed onto their negatively charged surface, losing structural coherence in the process (Norde and Favier, 1992; Billsten et al., 1995; Vertegel et al., 2004; Kubiak-Ossowska and Mulheran, 2010; Felsovalyi et al., 2011). In both composites, some of the lysozyme areas are larger than 10 nm. These areas represent lysozyme oligomers that either formed in solution (as shown below) and became incorporated into the composites (Sophianopoulos and Van Holde, 1964; Bruzzesi et al., 1965) or that formed due to hydrophobic interactions among unfolded, adsorbed lysozyme (Gagner et al., 2011). Based on the presence of deformed lysozyme molecules in both, co-precipitation and adsorption composites, we can conclude that the association of lysozyme with silica precipitates was not coincidental in either experiment but happened in solution, due to electrostatic and hydrophobic interactions between the two colloids.
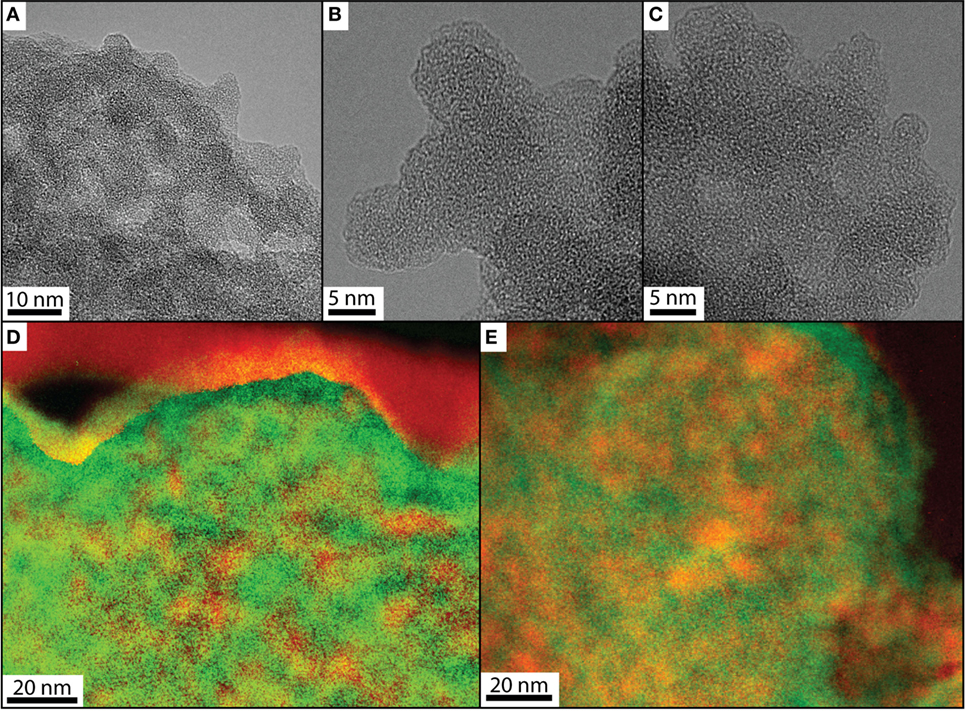
Figure 4. HR-TEM phase contrast images of pure silica (A), CoP-100 (B), and Ads-100 (C) and overlapped energy-filtered elemental maps collected at the carbon K-edge (red, ~290 eV) and the silicon K-edge (green, ~1,840 eV) for CoP-100 (D) and Ads-100 (E).
In order to assess if lysozyme also affected particle growth during co-precipitation synthesis, we obtained size information on silica particles and silica–lysozyme aggregates in suspension from SAXS. In the pure silica system, the mean diameter of silica nanoparticles was found to be 5.1 nm with a minor skew to larger diameters (based on a MCSAS fit, Bressler et al., 2015; Figure S4 in Supplementary Material; Pauw et al., 2013). In the log I(q) vs. log q representation, at low q the intensity follows a near-q0 dependence (plateau), indicating that the silica particles did not aggregate in solution in the absence of lysozyme (Figure 5A). The measured pattern of pure lysozyme showed a very good agreement with the simulated scattering curve of lysozyme generated in FoXS (Schneidman-Duhovny et al., 2010, 2013) based on the molecular structure from Wang et al. (2007). The increase in intensity at q > 0.2 nm−1 corresponded to particle aggregation of lysozyme (Figure 5A). Importantly, the average intensity of scattering from silica nanoparticles was nearly two orders of magnitude higher compared to lysozyme at the concentrations used in our experiments. This indicated that, because silica strongly dominated the measured intensity, the direct scattering contribution from lysozyme remained invisible in the composite patterns. This was highlighted by the pink pattern in Figure 5A that represents the mathematical summation of the scattering contributions from silica and lysozyme, i.e., assuming absolutely no interactions between these two entities. This pattern falls within the experimental uncertainty region of the pure silica pattern. However, the patterns of the two composite samples (Figure 5B) look distinctly different to the pure silica pattern and the calculated mixed pattern. This indicates interaction between the silica particles and lysozyme molecules during composite formation. The most striking features in the composite SAXS patterns were the strong increase in intensity at q < 0.5 nm−1 and the correlation peaks at q ~1.5 nm−1 for the co-precipitation and q ~1.2 nm−1 for the adsorption composites. The increasing intensity at low q values indicated the contribution of a structure factor to the data, i.e., the aggregation of silica in the presence of lysozyme. The correlation peaks formed due to the increasing number of particle–particle interactions which corresponded to typical distances between individual silica particles of d ~4.2 nm for the co-precipitation composite and d ~5.2 nm for the adsorption composite. For the adsorption composite this length scale corresponded to the average silica particle diameter determined from the pure silica system (Figure S4 in Supplementary Material), which is in line with the absence of lysozyme during particle growth. For the co-precipitation composite, on the other hand, the smaller inter-particle distance suggested the formation of smaller silica particles. However, the correlation peak positions depend to a certain degree on the local volume fraction of particles within the aggregates, since particles pack more closely together at increased volume fractions (Kinning and Thomas, 1984, see Supplementary Material). The absence of an increase in peak intensity or narrowing of the correlation peak in the co-precipitation sample indicated that the effect of a local increase in volume fraction was minor with respect to the peak shift being related to the formation of smaller silica particles. Nevertheless, this rough dependence d ~2π/qmax does not consider any polydispersity influence at all, which is important for silica particles (Figure S4 in Supplementary Material). Hence, by merely measuring the position of the local maximum we only signal the relevant/plausible range of sizes. In order to fully differentiate between the effect of polydisperse particle sizes and increased local volume fraction, fitting of the data by an advanced model is necessary. Without this advanced data processing, it is impossible to say if any lysozyme is trapped between the silica particles. We are currently preparing a manuscript which will deal with this issue extensively. However, what we can deduct from the current data is the fact that neither of the inter-particle distances determined for the composite samples could accommodate for a naturally folded lysozyme molecules in between silica particles (since the lysozyme molecules are ellipsoidal and 3 nm × 4.5 nm in size, and the correlation peak would thus be expected at q ~ 0.8 nm−1). The same was observed by Kumar et al. (2011) when analyzing silica–lysozyme aggregates by small-angle neutron scattering. These authors attributed the “missing” space between particles as an indication for the near-complete loss of structural coherence of the lysozyme molecule upon adsorption to multiple silica spheres. This was supported by other studies showing that lysozyme can lose substantial amounts of its secondary (transformation of α-helixes to β-sheets) and tertiary structure (more oblate molecules), especially when adsorbed to non-flat surfaces (Kubiak and Mulheran, 2009), porous media (Hao et al., 2014), or in between nanoparticles (Gagner et al., 2011). This is in agreement with the energy-filtered images shown in Figure 4, which indicate that lysozyme molecules underwent substantial conformational changes upon adsorption onto silica particles and incorporation into composites in both syntheses.
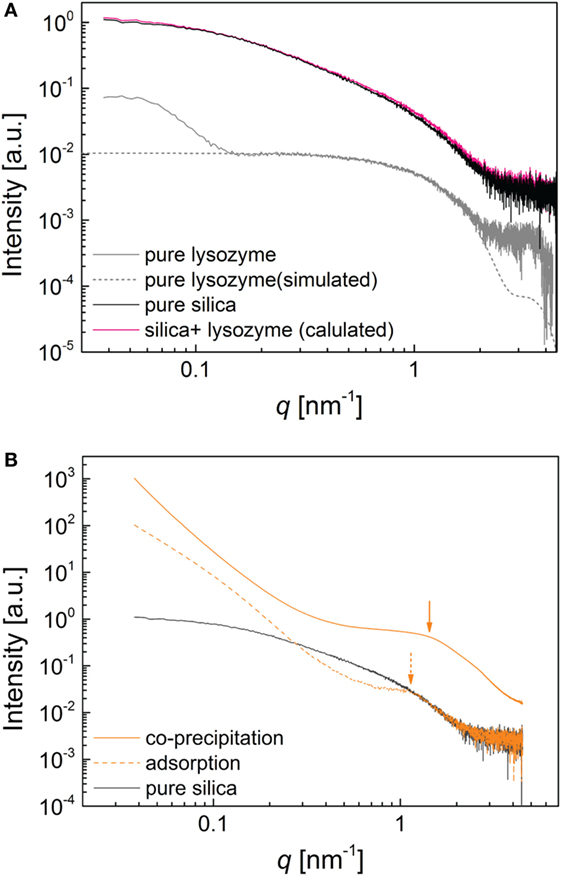
Figure 5. Small-angle X-ray scattering patterns (A) pure silica (black), pure lysozyme (gray) fitted by a scattering curve based on entry 2VB1(Wang et al., 2007) in the Protein Database PDB (dot-dash gray), and the mathematical summation of the silica and lysozyme patterns (pink); (B) patterns representative of co-precipitated composites (CoP-1000, orange) and adsorption composites (Ads-1000, dashed orange) and pure silica (black) for comparison.
We also evaluated the ζ-potential over the pH range between 2.5 and 10 through potentiometric titrations to assess the surface properties of the composites. Our data showed that the surfaces of the pure silica precipitates were negative over the whole measured pH range with a pHIEP < 2 (Figure 6, dotted lines), which agrees well with previously reported pHIEP for non-modified silica nanoparticles (Parks, 1965; Iler, 1979). Pure lysozyme on the other hand is positively charged over most of the measured pH range with a pHIEP of ~9.5 (Figure 6, dashed lines). This was lower than the pHIEP = 11.1 previously reported for lysozyme (Haynes and Norde, 1994) and most likely due to impurities (buffer salts and other proteins from egg white) present in the crystalline lysozyme (Thomas et al., 1996), which affected the ζ-potential measurements. The surface charge distribution as a function of pH of composites formed by co-precipitation and adsorption is strikingly different (Figure 6). The adsorption composites show the same pHIEP and evolution of the ζ-potential as a function of pH as pure silica at low concentrations of lysozyme added (100 ppm) and as pure lysozyme at high concentrations of lysozyme added (500 and 1,000 ppm). The actual ζ-potential values deviate slightly from the end-members due to contribution of small amounts of positively charged lysozyme for the low-lysozyme composite and conformational changes of the protein molecules in the high-lysozyme composites, which resulted in slightly different parts of the lysozyme molecule being exposed to the solution (Norde and Favier, 1992; Su et al., 1998a,b; Vertegel et al., 2004; Kubiak-Ossowska and Mulheran, 2010). The co-precipitation composites on the other hand show a much more complex behavior. The composite formed by co-precipitation with 100 ppm showed a ζ-potential trend similar to that of pure lysozyme in the acidic pH range but with less positive values. This was likely due to the presence of some negatively charged silica nanoparticles at the surface of the composite (Figure 4D), contributing to the measured ζ-potential. Once the isoelectric point was reached at pHIEP 5–5.5, the composite surface became negative and at pH > 8 identical to pure silica due to the decreasing surface charge of the adsorbed lysozyme molecules or potential desorption. The composites containing higher amounts of lysozyme (500 and 1,000 ppm) showed a similar decreasing trend of ζ-potential as a function of pH but showed higher overall values than the low-lysozyme composite and higher pHIEP around 7.5 and 8.5, respectively. The pHIEP values of the co-precipitation composites falling in between the pHIEP values of the two end-members, pure silica and lysozyme is in agreement with previous studies (Haynes and Norde, 1995; Rezwan et al., 2005). The ζ-potential data for the adsorption composites can be explained by additive behavior of silica and lysozyme where the ζ-potential of the composites fall in between the ζ-potential of the individual end-members, except for the influence of deformed lysozyme molecules to the overall surface charge density at neutral to alkaline pH in the high-lysozyme composites. The behavior of the co-precipitation samples on the other hand is non-additive and much more complex. The SAXS data revealed that the particle size in the co-precipitation experiments was smaller than the pure silica system and the adsorption composites. While the size difference is not substantial (d ~ 4.2 nm for the co-precipitation composites and d ~ 5.2 nm for the adsorption composites), the diameter of silica particles in the co-precipitation pathway represents a maximum mean particle size. From the fact that the particle sizes are different, we expect that the size distributions of silica particles from the two paths are substantially different. Therefore, for very small silica particles, especially once they are smaller than the native lysozyme molecules (3 nm × 4.5 nm), the silica–lysozyme interactions become substantially different to the adsorption pathway, resulting in composites with different characteristics compared to the adsorption composites.
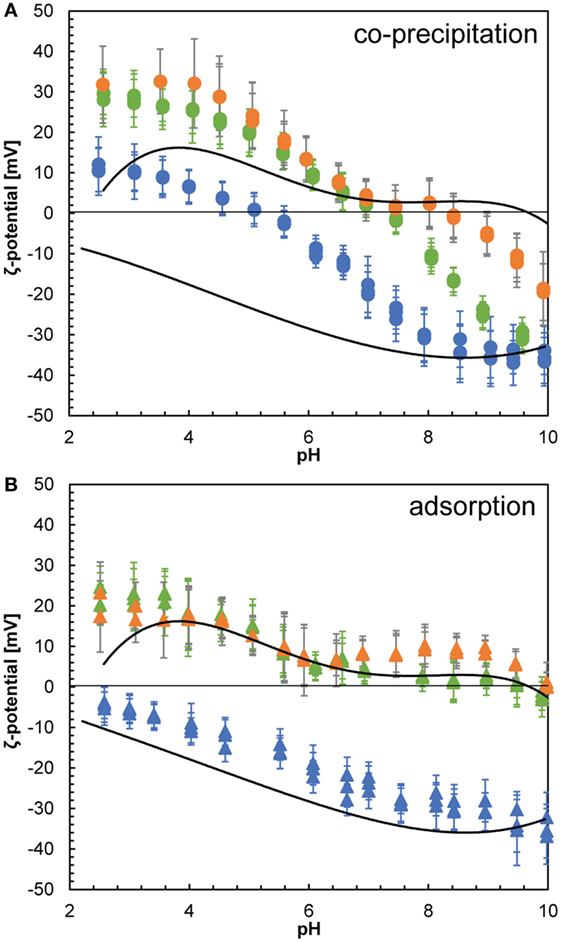
Figure 6. ζ-potential as a function of pH for silica nanoparticles (dotted line) and lysozyme (dashed line) and for composites formed by co-precipitation (A) and composites formed by adsorption (B). Composite results are given for samples with 100 (blue), 500 (green), and 1,000 ppm (orange) lysozyme added.
Summary and Conclusion
Lysozyme is neither incorporated into nor does its presence alter the molecular structure of the silica particles. However, its presence enhances the aggregation of the silica nanoparticles and affects the composite composition and structure. We observe a clear trend between the amount of lysozyme associated with the composites and the change in their properties. While these overall trends hold true for both the composites formed by co-precipitation and adsorption, the absolute changes between composites and pure silica differ substantially between these two sets of samples.
Based on the complementary data sets presented above, we deduce that the pathway of silica precipitation in the absence and presence of lysozyme follows a series of steps (Figure 7). For pure silica the reaction starts with polycondensation of monosilicic acid, followed by particle growth and very limited particle aggregation [Figure 7A; e.g., Iler (1979), Tobler et al. (2009)]. For the adsorption experiments, where lysozyme was added to a solution containing silica nanoparticles, the only effect unequivocally and directly observed was on particle aggregation (Figure 7C). Lysozyme adsorbed onto silica particles, which resulted in conformational changes deforming the lysozyme molecules. This is proof that there are interactions (electrostatic and, less important, hydrophobic) between silica and lysozyme resulting in composite formation. In the co-precipitation experiments, where lysozyme was added to a silica solution simultaneously with initializing polymerization, lysozyme could have interacted with different silica species at each step of the precipitation pathway (Figure 7B). The co-precipitation composites contain deformed lysozyme molecules similarly to the adsorption composites, showing that silica and lysozyme interacted in solution as they did during the adsorption synthesis. Our SAXS data showed that the presence of lysozyme affected the growth and final size of the formed silica nanoparticles: The silica particles in the co-precipitation composites were a little smaller than the ones in the adsorption composites. The positively charged lysozyme molecules likely caused silica particles to aggregate before they reached their full size and/or might have adsorbed some of the deprotonated silica monomers and small polymers onto their surface, reducing the amount of dissolved silica species available for the growth of particles. While we did not investigate the polymerization step of silica here, previous studies suggested that lysozyme can also affect the polymerization of silica during co-precipitation. They showed that oligomeric silica species adsorb onto lysozyme molecules which locally increases their number density and thus the polymerization rate (Coradin et al., 2002, 2004). This could further add to the observed differences between the two types of composites.
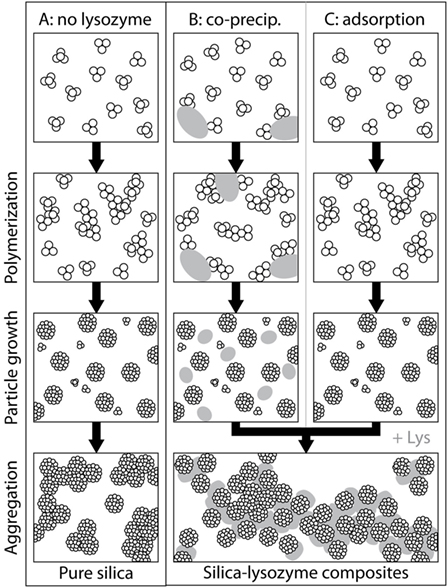
Figure 7. Differences in pathways of formation for pure silica precipitation (A) and silica-lysozyme composites (B,C).
Previous studies on silica–lysozyme composites have primarily used silica particles prepared from silicone alkoxides such as TEOS (Luckarift et al., 2006; Ramanathan et al., 2009; Bharti et al., 2011) or commercially available silica colloids (Kumar et al., 2014). Our approach on the other hand uses dilute solutions of sodium silicate as source for the silica particles, thus representing a simpler and cheaper alternative involving less hazardous substances. The two pathways presented in this study could, therefore, be viable options for the preparation of larger volumes of silica–lysozyme composites, e.g., for large-scale antibacterial coatings.
Author Contributions
Laboratory synthesis of composites was done by DH. SAXS experiments were completed by DH, TS, and Dr. R. Besselink at PETRA III (DESY) and data evaluation done by TS. HEXD and conversion to PDF was done by DT at APS. HR-TEM was done by RW and DH and evaluated with the help of TS. Other experimental data were collected and evaluated by DH. Writing and production of figures was completed by DH with significant contributions from all coauthors. TS wrote the supplementary information on SAXS data evaluation. All authors have read and approved of the final version of this manuscript.
Conflict of Interest Statement
The authors declare that the research was conducted in the absence of any commercial or financial relationships that could be construed as a potential conflict of interest.
Acknowledgments
This research was made possible by two Marie Curie grants from the European Commission in the framework of the MINSC Initial Training Research network, Project number 290040 and the NanoSiAl Individual Fellowship, Project No. 703015 and a UK Natural Environment Research Council grant (NE/J008745/1). TS and LB also acknowledge the financial support of the Helmholtz Recruiting Initiative. The authors thank EMBL for granting us SAXS beamtime at PETRA II at beamline P12 and Dr. Rogier Besselink for his support during measurements. The authors also acknowledge Drs. Karina Chapman, Peter Chupas, Rick Spence, and Kevin A. Beyer at APS beamline 11 ID-B for their assistance with PDF data collection. Use of the Advanced Photon Source was supported by the U.S. Department of Energy under Contract No. DE-AC02-06CH11357. DT acknowledges support for travel to the synchrotron facilities from the Danish Council for Independent Research (via DANSCATT). The authors are grateful to Sylvia Pinkerneil (GFZ Potsdam) for measuring the carbon contents of or composites and Susanne Patel (University of Leeds) for her support with ζ-potential measurements. This manuscript was improved by comments of P. Ramirez-Garcia, Dr. J. Rosenqvist, Dr. R. Besselink, D. Jha, and two anonymous reviewers. This manuscript contains data made available online as part of DH’s thesis completed in July 2016 at the University of Leeds.
Supplementary Material
The Supplementary Material for this article can be found online at https://www.frontiersin.org/articles/10.3389/fmats.2018.00019/full#supplementary-material.
References
Benning, L. G., Phoenix, V., Yee, N., and Tobin, M. (2004). Molecular characterization of cyanobacterial silicification using synchrotron infrared micro-spectroscopy. Geochim. Cosmochim. Acta 68, 729–741. doi: 10.1016/S0016-7037(03)00489-7
Bharti, B., Meissner, J., and Findenegg, G. H. (2011). Aggregation of silica nanoparticles directed by adsorption of lysozyme. Langmuir 27, 9823–9833. doi:10.1021/la201898v
Billsten, P., Wahlgren, M., Arnebrant, T., McGuire, J., and Elwing, H. (1995). Structural changes of T4 lysozyme upon adsorption to silica nanoparticles measured by circular dichroism. J. Colloid Interface Sci. 175, 77–82. doi:10.1006/jcis.1995.1431
Blanchet, C. E., Spilotros, A., Schwemmer, F., Graewert, M. A., Kikhney, A., Jeffries, C. M., et al. (2015). Versatile sample environments and automation for biological solution X-ray scattering experiments at the P12 beamline (PETRA III, DESY). J. Appl. Crystallogr. 48, 0–0. doi:10.1107/S160057671500254X
Bowron, D. (2008). An experimentally consistent atomistic structural model of silica glass. Mater. Sci. Eng. B 149, 166–170. doi:10.1016/j.mseb.2007.11.030
Bressler, I., Pauw, B. R., and Thünemann, A. F. (2015). McSAS: software for the retrieval of model parameter distributions from scattering patterns. J. Appl. Cryst. 48, 962–969. doi:10.1107/S1600576715007347
Bruzzesi, M. R., Chiancone, E., and Antonini, E. (1965). Association-dissociation properties of lysozyme. Biochemistry 4, 1796–1800. doi:10.1021/bi00885a016
Canfield, R. E. (1963). The amino acid sequence of egg white lysozyme. J. Biol. Chem. 238, 2698–2707.
Coombs, J., and Volcani, B. (1968). Studies on the biochemistry and fine structure of silica shell formation in diatoms. Planta 80, 264–279. doi:10.1007/BF00392396
Coradin, T., Coupé, A., and Livage, J. (2003). Interactions of bovine serum albumin and lysozyme with sodium silicate solutions. Colloids Surf. B Biointerfaces 29, 189–196. doi:10.1016/S0927-7765(02)00208-4
Coradin, T., Durupthy, O., and Livage, J. (2002). Interactions of amino-containing peptides with sodium silicate and colloidal silica: a biomimetic approach of silicification. Langmuir 18, 2331–2336. doi:10.1021/la011106q
Coradin, T., Eglin, D., and Livage, J. (2004). The silicomolybdic acid spectrophotometric method and its application to silicate/biopolymer interaction studies. J. Spectrosc. 18, 567–576. doi:10.1155/2004/356207
Dyer, L., Fawell, P. D., Newman, O., and Richmond, W. R. (2010). Synthesis and characterisation of ferrihydrite/silica co-precipitates. J. Colloid Interface Sci. 348, 65–70. doi:10.1016/j.jcis.2010.03.056
Felsovalyi, F., Mangiagalli, P., Bureau, C., Kumar, S. K., and Banta, S. (2011). Reversibility of the adsorption of lysozyme on silica. Langmuir 27, 11873–11882. doi:10.1021/la202585r
Gagner, J. E., Lopez, M. D., Dordick, J. S., and Siegel, R. W. (2011). Effect of gold nanoparticle morphology on adsorbed protein structure and function. Biomaterials 32, 7241–7252. doi:10.1016/j.biomaterials.2011.05.091
Gasteiger, E., Hoogland, C., Gattiker, A., Wilkins, M. R., Appel, R. D., and Bairoch, A. (2005). “Protein identification and analysis tools on the ExPASy server,” in The Proteomics Protocols Handbook, ed. J. Walker (Totowa: Humana Press Inc.), 571–607.
Gordon, R., Losic, D., Tiffany, M. A., Nagy, S. S., and Sterrenburg, F. A. (2009). The glass menagerie: diatoms for novel applications in nanotechnology. Trends Biotechnol. 27, 116–127. doi:10.1016/j.tibtech.2008.11.003
Hammersley, A. (1998). FIT2D V9. 129 Reference Manual V3. 1, Inter Rep ESRF98HA01. Grenoble: European Synchrotron Radiation Facility.
Hao, D.-X., Huang, Y.-D., Wang, K., Wei, Y.-P., Zhou, W.-Q., Li, J., et al. (2014). Multiscale evaluation of pore curvature effects on protein structure in nanopores. J. Mater. Chem. B 2, 1770–1778. doi:10.1039/C3TB21714K
Haynes, C. A., and Norde, W. (1994). Globular proteins at solid/liquid interfaces. Colloids Surf. B Biointerfaces 2, 517–566. doi:10.1016/0927-7765(94)80066-9
Haynes, C. A., and Norde, W. (1995). Structures and stabilities of adsorbed proteins. J. Colloid Interface Sci. 169, 313–328. doi:10.1006/jcis.1995.1039
Iler, R. K. (1979). The Chemistry of Silica: Solubility, Polymerization, Colloid and Surface Pro Perties, and Biochemistry. London: Wiley.
Jollès, J., Jauregui-Adell, J., Bernier, I., and Jollès, P. (1963). La structure chimique du lysozyme de blanc d’oeuf de poule: étude détaillée. Biochim. Biophys. Acta 78, 668–689. doi:10.1016/0006-3002(63)91033-3
Kinning, D. J., and Thomas, E. L. (1984). Hard-sphere interactions between spherical domains in diblock copolymers. Macromolecules 17, 1712–1718. doi:10.1021/ma00139a013
Kubiak, K., and Mulheran, P. A. (2009). Molecular dynamics simulations of hen egg white lysozyme adsorption at a charged solid surface. J. Phys. Chem. B 113, 12189–12200. doi:10.1021/jp901521x
Kubiak-Ossowska, K., and Mulheran, P. A. (2010). Mechanism of hen egg white lysozyme adsorption on a charged solid surface. Langmuir 26, 15954–15965. doi:10.1021/la102960m
Kumar, S., Aswal, V. K., and Callow, P. (2014). pH-dependent interaction and resultant structures of silica nanoparticles and lysozyme protein. Langmuir 30, 1588–1598. doi:10.1021/la403896h
Kumar, S., Aswal, V. K., and Kohlbrecher, J. (2011). SANS and UV-vis spectroscopy studies of resultant structure from lysozyme adsorption on silica nanoparticles. Langmuir 27, 10167–10173. doi:10.1021/la201291k
Luckarift, H. R., Dickerson, M. B., Sandhage, K. H., and Spain, J. C. (2006). Rapid, room-temperature synthesis of antibacterial bionanocomposites of lysozyme with amorphous silica or Titania. Small 2, 640–643. doi:10.1002/smll.200500376
Norde, W., and Favier, J. P. (1992). Structure of adsorbed and desorbed proteins. Colloids Surf. 64, 87–93. doi:10.1016/0166-6622(92)80164-W
Otzen, D. (2012). The role of proteins in biosilicification. Scientifica (Cairo) 2012, 22. doi:10.6064/2012/867562
Parks, G. A. (1965). The isoelectric points of solid oxides, solid hydroxides, and aqueous hydroxo complex systems. Chem. Rev. 65, 177–198. doi:10.1021/cr60234a002
Pauw, B. R., Pedersen, J. S., Tardif, S., Takata, M., and Iversen, B. B. (2013). Improvements and considerations for size distribution retrieval from small-angle scattering data by Monte Carlo methods. J. Appl. Crystallogr. 46, 365–371. doi:10.1107/S0021889813001295
Perry, C. C., and Keeling-Tucker, T. (2000). Biosilicification: the role of the organic matrix in structure control. J. Biol. Inorg. Chem. 5, 537–550. doi:10.1007/s007750000130
Qiu, X., Thompson, J. W., and Billinge, S. J. (2004). PDFgetX2: a GUI-driven program to obtain the pair distribution function from X-ray powder diffraction data. J. Appl. Crystallogr. 37, 678–678. doi:10.1107/S0021889804011744
Ramanathan, M., Luckarift, H. R., Sarsenova, A., Wild, J. R., Ramanculov, E. K., Olsen, E. V., et al. (2009). Lysozyme-mediated formation of protein-silica nano-composites for biosensing applications. Colloids Surf. B Biointerfaces 73, 58–64. doi:10.1016/j.colsurfb.2009.04.024
Rezwan, K., Meier, L. P., and Gauckler, L. J. (2005). Lysozyme and bovine serum albumin adsorption on uncoated silica and AlOOH-coated silica particles: the influence of positively and negatively charged oxide surface coatings. Biomaterials 26, 4351–4357. doi:10.1016/j.biomaterials.2004.11.017
Round, A., Felisaz, F., Fodinger, L., Gobbo, A., Huet, J., Villard, C., et al. (2015). BioSAXS sample changer: a robotic sample changer for rapid and reliable high-throughput X-ray solution scattering experiments. Acta Crystallogr. D Biol. Crystallogr. 71, 67–75. doi:10.1107/S1399004714026959
Schneidman-Duhovny, D., Hammel, M., and Sali, A. (2010). FoXS: a web server for rapid computation and fitting of SAXS profiles. Nucleic Acids Res. 38, W540–W544. doi:10.1093/nar/gkq461
Schneidman-Duhovny, D., Hammel, M., Tainer, J. A., and Sali, A. (2013). Accurate SAXS profile computation and its assessment by contrast variation experiments. Biophys. J. 105, 962–974. doi:10.1016/j.bpj.2013.07.020
Simpson, T. L., and Volcani, B. E. (1981). Silicon and Siliceous Structures in Biological Systems. New York: Springer.
Sophianopoulos, A., and Van Holde, K. (1964). Physical studies of muramidase (lysozyme) II. pH-dependent dimerization. J. Biol. Chem. 239, 2516–2524.
Su, T., Lu, J., Thomas, R., Cui, Z., and Penfold, J. (1998a). The effect of solution pH on the structure of lysozyme layers adsorbed at the silica-water interface studied by neutron reflection. Langmuir 14, 438–445. doi:10.1021/la970623z
Su, T. J., Lu, J. R., Thomas, R. K., Cui, Z. F., and Penfold, J. (1998b). The adsorption of lysozyme at the silica-water interface: a neutron reflection study. J. Colloid Interface Sci. 203, 419–429. doi:10.1006/jcis.1998.5545
Sumper, M., and Brunner, E. (2006). Learning from diatoms: nature’s tools for the production of nanostructured silica. Adv. Funct. Mater. 16, 17–26. doi:10.1002/adfm.200500616
Sumper, M., and Brunner, E. (2008). Silica biomineralisation in diatoms: the model organism Thalassiosira pseudonana. Chembiochem 9, 1187–1194. doi:10.1002/cbic.200700764
Thomas, B., Vekilov, P., and Rosenberger, F. (1996). Heterogeneity determination and purification of commercial hen egg-white lysozyme. Acta Crystallogr. D Biol. Crystallogr. 52, 776–784. doi:10.1107/S090744499600279X
Tobler, D. J., Rodriguez-Blanco, J. D., Dideriksen, K., Bovet, N., Sand, K. K., and Stipp, S. L. (2015). Citrate effects on amorphous calcium carbonate (ACC) structure, stability, and crystallization. Adv. Funct. Mater. 25, 3081–3090. doi:10.1002/adfm.201500400
Tobler, D. J., Shaw, S., and Benning, L. G. (2009). Quantification of initial steps of nucleation and growth of silica nanoparticles: an in-situ SAXS and DLS study. Geochim. Cosmochim. Acta 73, 5377–5393. doi:10.1016/j.gca.2009.06.002
Vertegel, A. A., Siegel, R. W., and Dordick, J. S. (2004). Silica nanoparticle size influences the structure and enzymatic activity of adsorbed lysozyme. Langmuir 20, 6800–6807. doi:10.1021/la0497200
Wahlgren, M., Arnebrant, T., and Lundström, I. (1995). The adsorption of lysozyme to hydrophilic silicon oxide surfaces: comparison between experimental data and models for adsorption kinetics. J. Colloid Interface Sci. 175, 506–514. doi:10.1006/jcis.1995.1482
Wang, J., Dauter, M., Alkire, R., Joachimiak, A., and Dauter, Z. (2007). Triclinic lysozyme at 0.65 A resolution. Acta Crystallogr. D Biol. Crystallogr. 63, 1254–1268. doi:10.1107/S0907444907054224
Keywords: silica, lysozyme, co-precipitation, adsorption, composite materials, hybrid material, biosilica
Citation: van den Heuvel DB, Stawski TM, Tobler DJ, Wirth R, Peacock CL and Benning LG (2018) Formation of Silica-Lysozyme Composites Through Co-Precipitation and Adsorption. Front. Mater. 5:19. doi: 10.3389/fmats.2018.00019
Received: 23 November 2017; Accepted: 15 March 2018;
Published: 03 April 2018
Edited by:
Sher Bahadar Khan, King Abdulaziz University, Saudi ArabiaReviewed by:
Dongyan Liu, Institute of Metals Research (CAS), ChinaAbu Zayed M. Saliqur Rahman, The Ohio State University, United States
Copyright: © 2018 van den Heuvel, Stawski, Tobler, Wirth, Peacock and Benning. This is an open-access article distributed under the terms of the Creative Commons Attribution License (CC BY). The use, distribution or reproduction in other forums is permitted, provided the original author(s) and the copyright owner are credited and that the original publication in this journal is cited, in accordance with accepted academic practice. No use, distribution or reproduction is permitted which does not comply with these terms.
*Correspondence: Daniela B. van den Heuvel, daniela.vandenheuvel@geo.unibe.ch