Impingement Cooling Using the Ionic Wind Generated by a Low-Voltage Piezoelectric Transformer
 Michael J. Johnson
 David B. Go
- 1Department of Aerospace and Mechanical Engineering, University of Notre Dame, Notre Dame, IN, USA
- 2Department of Chemical and Biomolecular Engineering, University of Notre Dame, Notre Dame, IN, USA
As the consumer demand for smaller, more sophisticated computers grows, the need arises for new air cooling methods that will work in geometries that mechanical fans cannot. Ionic winds (also known as electrohydrodynamic flows) are flows that are produced by the generation of a gas discharge. These flows do not require moving parts to operate, making them attractive for small form-factor devices. However, in order to produce and sustain a gas discharge in atmospheric air, very large applied voltages are required (~5 kV). Through the use of piezoelectric transformers (PTs), it is possible to generate ionic winds in ambient air with significantly smaller voltages (~7 V) than otherwise possible. When a moderate voltage is applied to a PT, discharges can form on the edges of the crystal that produce measureable ionic winds. The impingement cooling properties of these ionic winds jets on a vertical, uniformly heated metal plate were studied by measuring their induced forced convection coefficients. Using a sharpened piezoelectric crystal, a round, axis symmetric ionic wind jet was formed, and it followed similar heat transfer correlations to that of more conventional jets. The sharpened piezoelectric was able to produce convection coefficients near 50 W m−2 K−1 under the right conditions. When the piezoelectric was not sharpened, the PT produced similar convection coefficients, but cooled a larger area than its counterpart, as ionic wind jets were generated off the corners of the rectangular device.
Introduction
To keep up with the demands of consumers, the next generation of portable computers needs to be smaller, faster, and more efficient than their predecessors. Developing electronics that can operate in the small form-factor geometries of portable electronics requires new thermal management techniques to keep components cool and operational. Many common thermal management techniques, such as mechanical fans, are not possible in smaller portable devices due to size and acoustic constraints. Because of this, many of these small form-factor devices have abandoned forced convection completely and instead have turned to purely passive methods. While these passive methods are efficient and cost-effective, they are inherently limited in the amount of heat they can remove from the system. The development of an air mover that can operate within the constraints of a portable device would enable more powerful devices to be built that could not otherwise operate with a purely passive thermal management system.
Recently, there has been increased interest in incorporating electrohydrodynamic flows (often called ionic winds) into portable electronics devices to introduce forced convective cooling (Allen and Karayiannis, 1995; Fylladitakis et al., 2014). Ionic winds have several advantages over mechanical fans; in particular they can be easily miniaturized (Hsu et al., 2007; Tirumala et al., 2011), have no moving parts, and produce small acoustic signals. In order to generate an ionic wind, a large voltage (>5 kV) is applied and maintained between two electrodes. These large voltages can be prohibitive for portable applications due to the costs and size constraints of the power supply required. Therefore, it is necessary to pursue alternative methods to drive ionic winds that that can operate in the small confines of a portable electronic device and under strict voltage and power requirements.
Piezoelectric transformers (PTs) work through the electromechanical coupling within a piezoelectric material. Analogous to magnetic transformers, which convert between electric and magnetic energy to produce a gain in voltage, PTs convert between mechanical and electrical energy to produce a similar gain. PTs have been most commonly used to power cold cathode fluorescent lamp (CCFL), backlighting in portable electronics (Day and Lee, 2002), as a battery charger in mobile phones (Ivensky et al., 2002), or as a DC/DC converter (Yamane and Hamamura, 1998). PTs have been shown to be able to produce very large voltage gains, in some cases on the order of 10,000 (VanGordon et al., 2014). For this reason, PTs have recently garnered interest for their use in a number of different high-voltage applications, including gas discharge generation (Alonso et al., 2009), x-ray (Gall et al., 2013), and neutron generation (Gall et al., 2012), and for excimer lamps (Teranishi and Itoh, 2007). In addition, others have used gas discharges produced from PTs to treat the surfaces of materials (Kim et al., 2009), sterilize wounds (Teschke, 2009), and to build plasma reactors (Itoh et al., 2006).
An ionic wind forms as a byproduct of the presence of an electric field acting over a gas discharge. Ions produced by the discharge are accelerated by the applied electric field, which will cause them to collide with neutral air molecules and impart momentum. This process results in a bulk flow driven purely by the applied electric field without the need for moving parts. The heat transfer properties of ionic winds have been studied in depth as both an enhancement to other means of forced convection (Franke, 1969; Tada et al., 1997; Go et al., 2007) or for its impingement cooling properties (Mitchell and Williams, 1978; Owsenek et al., 1995; Baghaei Lakeh and Molki, 2012). In our previous work, we demonstrated that a PT can be used to produce an ionic wind with applied voltages on the order of 10 V, which were significantly lower than the kilovolts used in most other approaches (Johnson and Go, 2015). In this work, we quantify the impingement cooling induced by a PT-driven ionic wind to gage its potential as a cooling technology and to better understand its characteristics.
Experimental Method
Piezoelectric Transformer
When a voltage is applied to a piezoelectric crystal, an internal stress will form within the crystal and cause it to deform. Rosen (1956) was the first to discover that this behavior can be used to build a transformer when two piezoelectrics with polarizations normal to each other are attached. The applied voltage into one of the piezoelectrics produces a deformation wave that will then travel through the adjacent piezoelectric. The wave causes the adjacent piezoelectric to deform, and produces a voltage on its surface. It is important to note that this effect can also be achieved with a single piezoelectric that has a diagonal polarization, as was done in this study. The piezoelectric used in this study was a 128°Y-cut piece of lithium niobate (LN). This angled cut was chosen because it has been found to be the optimum conditions for peak voltage gain when used for a transformer (Nakamura and Adachi, 1998).
In general, the surface voltage is at a maximum when the applied voltage is at the piezoelectric’s resonant frequency. This resonant frequency forms a standing displacement wave within the piezoelectric that must not be interfered with. In order to properly hold the piezoelectric, contacts are made with the piezoelectric where the displacement in the piezoelectric is 0 (nodes of the displacement wave). In this work, we choose to operate at the second resonance frequency, causing the displacement wave to be half of the length of the piezoelectric as shown in Figure 1. The second resonant mode was chosen for convenience, but other modes could also be used (Kawashima et al., 1994; Gall et al., 2013). The piezoelectric had electrodes applied to both of its faces with silver paint along half of its length for simplicity.
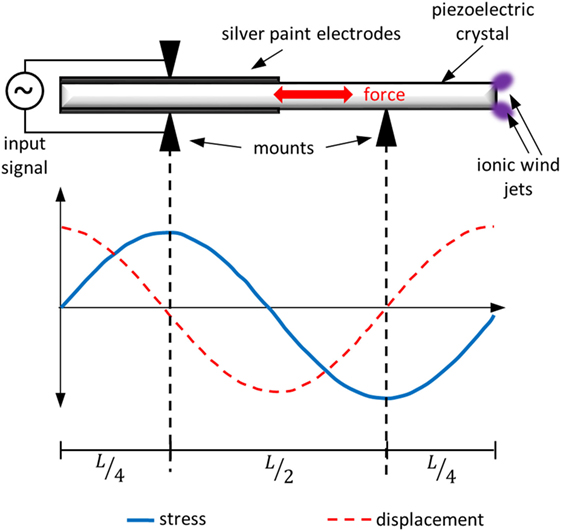
Figure 1. A schematic of the piezoelectric transformer. The plot at the bottom shows the stress and the displacement within the piezoelectric when operated at its second resonant frequency. The mounts from the transformer were designed so that they only make contact with the piezoelectric where there was no displacement (nodes of the displacement wave). For the second resonant frequency, these nodes are located L/4 from the ends of the crystal.
The maximum voltage gain, Vout/Vin, from a PT is a strong function of its geometry and piezoelectric properties and is commonly expressed as (Rosen, 1956),
where L is the length of the piezoelectric, w is the thickness of the piezoelectric, Q is the loss factor of the piezoelectric, k23 is the coupling factor for extensional vibration, and k33 is the coupling factor for longitudinal vibration. Figure 1 shows a schematic of the PT used in this study. When operated at its resonant frequency, the voltage gain across the crystal is significant, causing local breakdown at the surface and discharges to form off the corners of the piezoelectric. These discharges are what forms the ionic wind jets that are of interest for this study. The discharge travels normal to the corners and edges of the piezoelectric, generating distinct ionic wind jets. While difficult to measure the velocity of these ionic wind jets in unbounded flows, prior work has shown these PT-generated ionic winds produce duct flows near 1 m s−1 (Johnson and Go, 2015), but can reach velocities upwards of 2 m s−1 close to the PT.
It is important to note that piezoelectric materials have been investigated for their use as fans in the past (Schmidt, 1994; Petroski et al., 2008). However, these past efforts have differed from the present work in how the piezoelectric material has been utilized. Past efforts have used the piezoelectric material as a vibrating “flap” where the motion of the piezoelectric under an applied voltage was used to push the air in a desired direction. By contrast, the piezoelectric in the present work is used as a transformer to amplify the electric field at its corners to produce a gas discharge. The air is then moved by ions produced within the discharge influenced by the local electric field. Thus, while prior work used primarily the mechanical behavior of the piezoelectric to produce the flow, our approach uses primarily the electrical behavior of the piezoelectric to generate flow.
Experimental Apparatus
In order to measure the impingement cooling induced by the ionic wind jets, a vertical plate was heated uniformly and infrared (IR) thermographic measurements of the plate temperature were used to quantify the induced convection. Many of the characteristics of this experiment have been inspired by similar experiments that used different methods of impingement cooling (Liu et al., 1991; Kimber et al., 2007). A schematic of the experimental configuration is shown in Figure 2A. The experiment consisted of a stainless steel plate (type 304) that was pulled tightly over two stainless steel rods by springs that were clamped to the far ends of the plate and exposed to ambient conditions. The springs allowed for the plate to stay in uniform contact with the rods, even after the length of the plate changed due to thermal expansion. The plate was heated resistively through a voltage difference applied between the two metal rods using a power supply (Pyramid PS-52KX) in series with a set of parallel 10, 5, and 1 Ω resistors. The resistors allowed for the voltage drop across the plate to be controlled by adding or subtracting resistors in parallel to change the total resistance of the system and, thus, change the heat flux into the plate. The plate was clamped firmly to the rods in a manner that would allow for uniform contact along the rod’s height so that the plate would heat uniformly. The voltage drop between the two rods was measured using a voltmeter (Amprobe AM-510) along the height of the rods to verify that it remained constant.
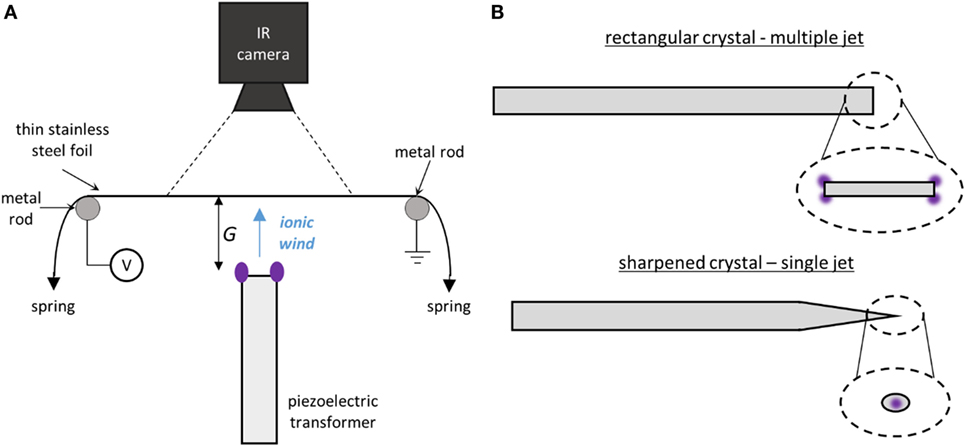
Figure 2. (A) A schematic showing the apparatus used to measure the impingement cooling properties of the PT-driven ionic wind. The thin stainless steel plate was resistively heated by a differential voltage applied between the two metal rods. The total heated area of the plate was 8 cm × 12 cm. The side of the plate facing the IR camera was painted black to improve IR measurements. (B) A schematic depicting the two different shapes of piezoelectric crystals used to cool the plate. The single jet crystal had one of its ends sharpened to a point so a single jet was generated. The insets show the view along the axis of the PT.
The PT was mounted normal to the heated plate so that the induced flow would impinge against the plate. The plate was very thin (0.005-cm thick), such that the plate could be treated as “lumped” and the change in temperature due to impingement cooling on one side of the plate could be measured on the other side (this assumption will be discussed in more depth in the following sections). The temperature of the plate was measured with an IR camera (Flir T420) on the opposite side of the PT. The IR camera observed a 6 cm × 5.4 cm region on the surface of the plate, which is the observed area for all measurements in this work. The side of the plate facing the IR camera was painted with a flat black paint with a known emissivity of 0.96 (Ekkad et al., 2004) and the IR camera was calibrated using the known emissivity and a thermocouple in contact with the plate. The side exposed to the impinging ionic wind was unpainted, stainless steel with an emissivity of 0.12 (Roger et al., 1979). The entire apparatus was placed within a large acrylic box to ensure that superfluous flows did not contaminate temperature measurements.
Two different shapes of piezoelectric crystals were used during this study, both of which are shown in Figure 2B. The first was a 40 mm × 3 mm × 0.5 mm rectangular shaped piece of LN. When a sufficiently large voltage was applied to the crystal (>10 V), the corners and edges of the crystal form discharges and produce ionic wind jets. These jets travel normal to the surface, making several different jets that travel in different directions. In order to better control the direction of the induced ionic wind jet, the second shape was made from a crystal that had its end sharpened to a tip with a radius of ~20 μm, in order to control where the discharge was generated. With this shape, a single jet is generated outward from the tip of the piezoelectric crystal, not orthogonal from its corners. Others have shown that changing the shape of the piezoelectric can improve its performance (VanGordon et al., 2010), but none have used the geometry of the piezoelectric to generate a directional ionic wind jet. Both shapes were tested to better understand the characteristics of the induced ionic wind jet.
The PTs were operated by applying a sinusoidal AC input voltage to the electrodes on both the top and bottom of the PT (as shown in Figure 1) using a signal generator (Agilent 33220A) connected to an amplifier (Powertron Model 500A RF Amplifier). As noted above, the PTs were operated at their second resonant frequency (~60 kHz) and all input voltages are reported in amplitude. Additional details on operating PT-based discharge devices can be found in Johnson and Go (2015).
General Behavior and Key Assumptions
In this study, three different measurements of the steady-state temperature distribution along the metal plate were taken and are shown in Figure 3. A representative temperature distribution along the heated plate without the ionic wind impinging is shown in Figure 3A. Due to buoyancy, there is natural convection, and the natural convection coefficient was higher at the bottom of the plate while the air at the top of the plate was warmer, which lead to the lower portions of the plate being cooler. For the same heated condition, Figure 3B shows the induced cooling by an ionic wind from a sharpened PT. The cooling effect of the jet is clear, as a cold, circular region forms in the center of the plate and the cooling is more dramatic for increasing input voltage. We also measured the temperature distribution for the ionic wind when the plate was unheated, and there was localized heating as shown in Figure 3C. The heating from the ionic wind is due to the discharge at the end of the PT heating the surrounding air. This heated air is then pushed by the ionic wind into the plate and can cause the plate to heat if the air is at a higher temperature than the plate. This illustrates the unusual behavior of the PT-driven ionic wind: when the plate is cold, the ionic jet will heat it, but when the plate is hot the jet will cool it.
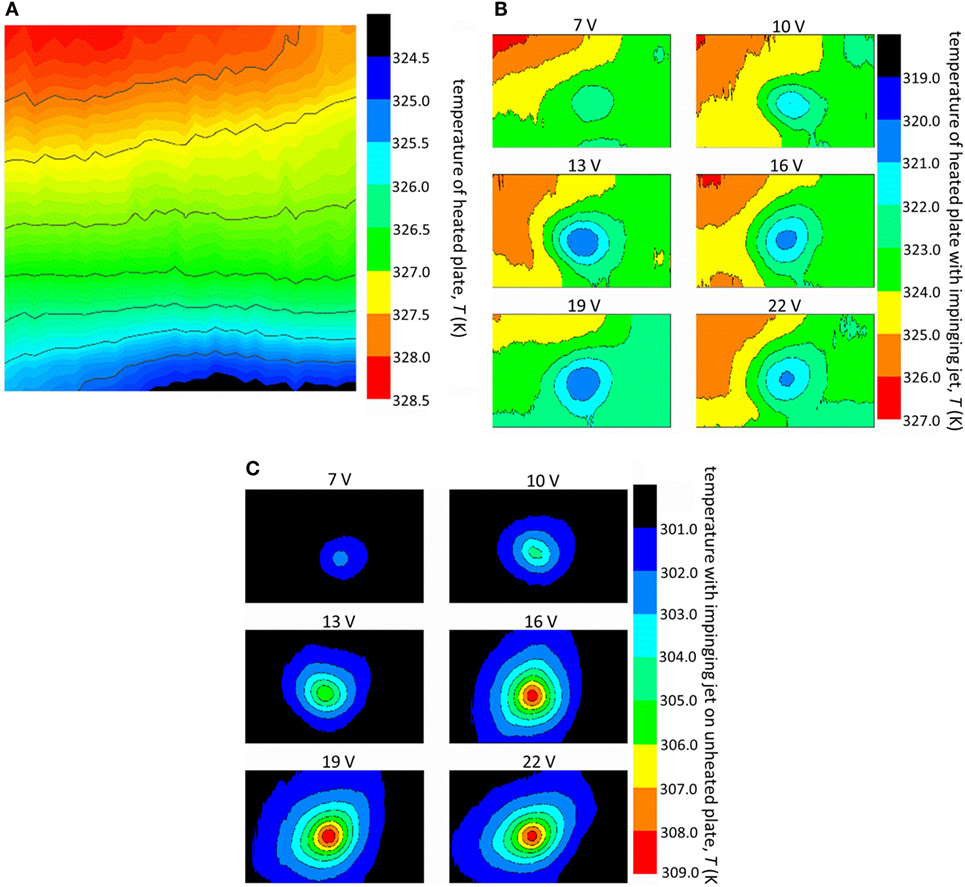
Figure 3. Contours that show the temperature of (A) the heated plate without the impinging jet, (B) the heated plate with the impinging ionic wind at different PT input voltages, and (C) the unheated plate with the impinging ionic wind at different PT input voltages. The sharpened PT was positioned 1 cm from the plate. All of the contours are of a viewing area that is 6 cm wide and 5.4 cm tall. (Please note that the contours themselves are at a slightly different height to width ratio than the viewing area, causing some objects to appear stretched.)
In order to analyze the temperature contours, energy balances are used for each of the cases shown in Figure 3 as discussed in Section “Heat Transfer Coefficient Calculation.” A few essential assumptions are made in these analyses:
1. The plate is assumed to thermally emit as a gray body whose surroundings are large enough that they can be considered to behave as a black body at a background temperature equal to that of the ambient air.
2. The temperature variation through the thickness of the plate is negligible. To confirm this assumption, the Biot number of the plate was calculated. The Biot number is a non-dimensional number used to determine if the temperature variance within an object is significant by comparing the heat transfer resistances inside the body and at its surface. If the Biot number is less than 0.1, the object can be assumed to be “lumped” and have a uniform temperature throughout the object. For the plate to have a Biot number greater than 0.1, the forced convection coefficient would need to exceed 300 W m−2 K−1, which is about an order of magnitude larger than what was measured in this study; therefore, it is reasonable to assume the plate is ‘lumped’.
3. The system is at steady state for each temperature profile. For a lumped body, the thermal time constant, τ, is defined as,
where ρ, cp, and t are the density, specific heat, and thickness of the plate, respectively. Even for natural convection where h is small (h ≈5 W m−2 K−1), the time constant is always less than 10 s. Therefore, for each of the aforementioned analyses, the system was active with the desired conditions for >10 time constants to assure it had reached steady state.
Heat Transfer Coefficient Calculation
In order to quantify the heat transfer coefficient h, we applied simple energy balances where convection was treated by Newton’s Law of Cooling
where q″ is the heat flux into or out of the body, A is the surface area of the body, T is the temperature of the body, and T∞is the temperature of the air. However, as noted above, the ionic wind itself increases the air temperature (see Figure 3C), and this must be accounted for when analyzing the temperature contours. For each of the cases in Figure 3, zero-dimensional energy balances were constructed as shown in Figure 4: Figure 4A considers only a heated plate (corresponding to Figure 3A), Figure 4B considers a heated plate with impinging ionic wind (corresponding to Figure 3B), and Figure 4C considers an unheated plate with impinging ionic wind (corresponding to Figure 3C).
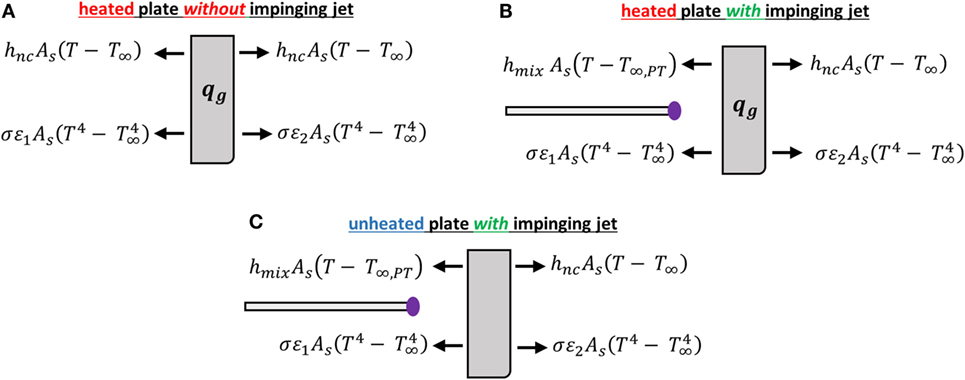
Figure 4. Schematics of the three energy balances used to calculate convection coefficients where each case corresponds to the temperature contours shown in Figure 3: (A) heated plate, (B) heated plate with impinging ionic wind, and (C) unheated plate with impinging ionic wind. The arrows correspond to whether heat is being added to or removed from the plate.
Applying energy balances to each pixel in the temperature contour, the “local” convection coefficient can be found at each pixel on the plate surface. The local coefficients can then be combined together to produce the average convection coefficient, defined as the mean value of all the local coefficients in the observed areas on the plate. The average was calculated using
were H and L are the height (5.4 cm) and width (6 cm) of the viewing area on the plate, respectively. It is important to note, that since the average is taken over the viewing area of the plate, this average can be used to quantitatively compare results in this experiment but only has qualitative implications in other configurations.
The heat input into the plate generated by resistive Joule heating, qg, can be written as,
where Vs is the voltage differential between the metal rods, and Is is the amount of current moving through the steel plate. For the heated plate case (Figures 3A and 4A), energy conservation can be written as a balance between the heat input and the heat lost through natural convection and radiation exchange with the surroundings. At steady state, this can be expressed as
where T is the pixel temperature corresponding to the temperature contours in Figure 3A, with T∞being the ambient temperature, ε1 the emissivity of the black paint, ε2 the emissivity of the bare stainless steel, As the surface area of one side of the plate, and σ the Stefan–Boltzmann constant. Using the temperature contour in Figure 3A for T, the local natural convection coefficient hnc could be determined using Eq. 6. For all experiments here, hnc had an average value of 6 W m−2 K−1, which is slightly higher but comparable to those predicted from experiments done by others (Vliet and Ross, 1975), and is in good agreement with numerical results (Oosthuizen and Paul, 2010).
When the ionic wind is impinging the heated plate (Figures 3B and 4B), the steady-state energy balance is modified to include the effect of the ionic wind and can be written as
The first term on the right-hand side (RHS) accounts for natural convection on the back of the heated plate, while the second term on the RHS again accounts for radiation loss. The convection due to the ionic wind is included in the third term on the RHS, where hmix accounts for both natural convection hnc and the convection induced by the ionic wind hPT. Typically, natural and forced convection add non-linearly, and can be decomposed when expressed as Nusselt numbers, Nu, using the following relationship (Incropera et al., 2007),
In this work, convection coefficients are reported instead of Nusselt numbers in order to prevent confusion due to the extraneous length scale required in the Nusselt number. Since both the natural convection and forced convection operate on the same length scale, the Nusselt numbers can be decomposed, so that the forced convection coefficient from the impinging ionic wind can be found using
Note that there is an additional unknown term in Eq. 7, T∞,PT, which corresponds to the additional heating of the ambient air by the discharge off of the PT device. We analyze this value by using an energy balance on the unheated plate with the impinging ionic wind jet (Figures 3C and 4C)
where again hmix consists of both the ionic wind and natural convection components as shown in Eq. 9.
Ostensibly, both hPT and T∞,PT are independent of whether the vertical plate is heated or not; that is, the discharge heating (T∞,PT) and fluid dynamics of the ionic wind (hPT) are independent of the plate’s heated condition. Therefore, we can use Eqs 7 and 10 along with Eq. 9 to solve for these two values. However, this assumes that the natural convection coefficient hnc is known in both Eqs 7 and 10. Yet, because hnc depends on the temperature of the plate itself – either heated, heated with an impinging jet, or unheated with an impinging jet – then its value is not known a priori. But because of the unique temperature contours induced by the ionic wind in Figures 3B,C, it was not possible to determine hnc as an independent variable for every condition. We, therefore, estimated it by scaling the values for hnc we determined in the heated case (Figure 3A). To do so, we used the ratio between the standard Nusselt correlation for vertical heated plates (Churchill and Chu, 1975) at two given temperatures – the temperature of the heated plate where hnc was measured and the temperature under the influence of the ionic wind. This scaling can be written as
Using this correlation as a scaling factor provides an estimate on the magnitude of the temperature dependence of the natural convection coefficient. While this is an imperfect way to account for the temperature dependence, it does allow for the natural convection coefficient’s dependence on its location along the plate to remain intact, producing more accurate trends within the local coefficients.
Equations 6, 7, and 10 were solved in tandem to find the forced convection coefficient, hPT, natural convection coefficient, hnc, and the heated air temperature, T∞,PT. These equations were solved for every pixel along the surface of the plate, allowing the shape and size of the impinging jets to be quantified. Average values were subsequently calculated using Eq. 4.
In order to account for the propagation of systematic and random errors within the analyses, error bars were computed for each of the calculated quantities. We included uncertainties associated with extrapolating the heat transfer coefficients from the measured data, including estimates for the bias introduced by the assumed scaling of the natural convection coefficient in Eq. 11. Furthermore, each measurement was repeated at least three times to account for random errors. The error bars for the plots in this work are set at a 95% confidence interval.
Results
Single Impinging Jet
The local forced convection coefficients measured from a single ionic wind jet generated from the sharpened piezoelectric at a gap of G = 1 cm are shown in Figure 5A. The convection coefficients indict that the impinging jet was round and axisymmetric, suggesting that the ionic wind jet takes a similar circular shape as it propagates from the PT. As the input voltage increases, the cooled area grew larger while the convection coefficient increased steadily until about 16 V where it fluctuated in magnitude as input voltages continue to increase. Notably, we were able to measure cooling for input voltages as small as 7 V. For comparison, previous work on impinging ionic winds required input voltages on the order of 6 kV to produce any cooling at similar gap distances (Owsenek et al., 1995). By using a PT to generate the ionic wind, the input voltage is order of magnitudes smaller, making the existence of any cooling at these input voltages impressive.
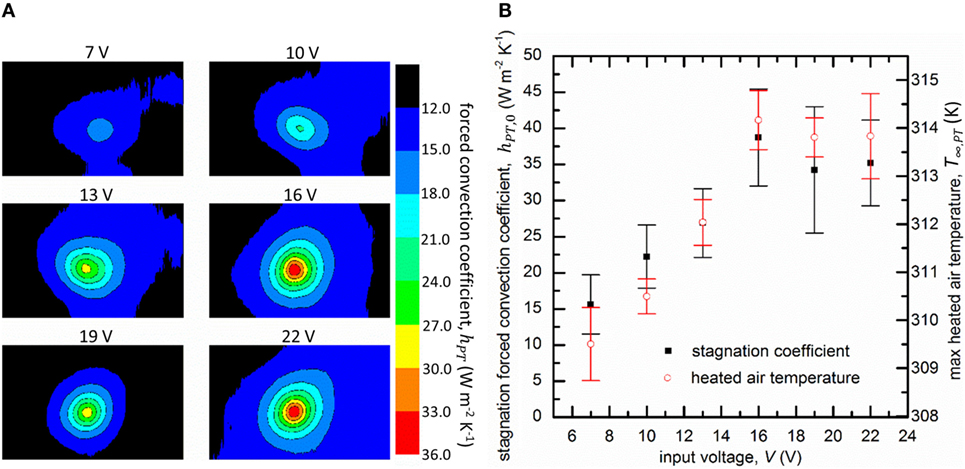
Figure 5. (A) Contours of the local forced convection coefficient hPT for different input voltages to a sharpened PT. The gap distance was G = 1 cm. (B) The local stagnation convection coefficient hPT,0 and the maximum heated air temperature T∞,PT as a function of the input voltage.
The largest forced convection coefficient from an impinging jet occurs at the stagnation point where a thin thermal boundary layer forms that produces large convection coefficients (Liu et al., 1993). The convection coefficient at the stagnation point hPT,0 as a function of the input voltage is shown in Figure 5B (averaged over three experimental runs). Initially, hPT,0 increased steadily with the input voltage. As the input voltage reached larger values, the stagnation convection coefficient began to plateau to a steady value of approximately 40 W m−2 K−1. This suggests that the flow speed of the ionic wind remains relatively constant for input voltages greater than 16 V. A similar trend was also observed with the maximum local heated air temperature T∞,PT, also shown in Figure 5B. We observed that once the input voltage reached 16 V, the discharge had engulfed the entire tip of the sharp PT, and it could not grow any larger as the input voltage continued to increase. However, we did observe that the input current into the PT did not stagnate for larger input voltages, indicating that the power consumption of the PT was continuing to rise. We conjecture that the piezoelectric itself could be preventing the discharge from growing stronger, perhaps by acting as an internal ballast that limits the discharge current.
The value of the stagnation convection coefficient was used to normalize traces along the horizontal centerline of the heated plate. These traces are shown in Figure 6 (log–log) for different input voltages; their shape is similar to those found by others (Mitchell and Williams, 1978; Owsenek et al., 1995). At distances far away from the stagnation point (x/G > 0.3), the normalized convection coefficients begin to follow the power law relationship,
where C1 is a fitting constant. However, we found that the coefficients only collapse to Eq. 12 at higher input voltages. For example, at 7 V, the coefficients had a smaller power than its higher voltage counterparts. As the input voltage increases, the slope of the coefficients began to increase and eventually converge to the curve fit provided by Eq. 12. This suggests that the ionic wind takes a consistent shape when the input voltage exceeded a certain value. Notably, this is the same input voltage when the plateau in convection coefficient occurs in Figure 5B, indicating that the discharge and ionic wind does not change significantly for input voltages larger than 16 V. While Eq. 12 worked for this particular gap distance, G, it does not work for all gap distances. The exponent in Eq. 12 is a function of the gap distance, so this would need to be accounted for cases where the gap distance is not fixed.
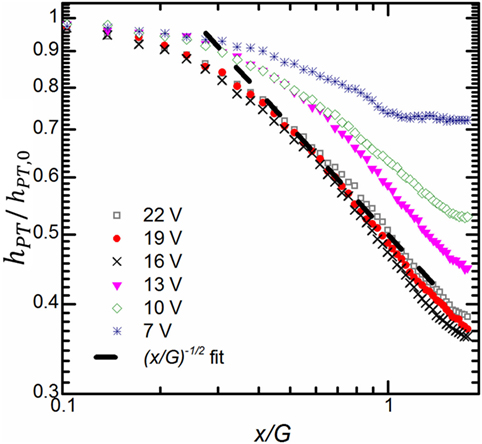
Figure 6. Log–log plot of the normalized local convection coefficient as a function of the non-dimensional distance along the plate for various input voltages at a gap distance of G = 1 cm. Equation 12 was used in the linear curve fit where C1 was 0.5.
Multiple Impinging Jets
In addition to the sharpened PT, we also tested a rectangular PT, and as noted earlier, for this shape the discharges form off the corners of the PT. As shown by the temperature distribution in Figure 7A, the distinct jets that form at the corners of the rectangular PT are visible as separate low temperature nodes on the plate surface. These nodes indicate that individual ionic wind jets form at each of the corners of the PT rather than a single large jet forming from the rectangular face of the PT. The air heating from the discharges is shown in Figure 7B where the plate itself was unheated. We observe that the local heating profile takes the same multi-jet shape as with the cooling depicted in Figure 7A. Both of these are analogs to the sharpened jet profiles shown in Figures 3B,C, with the primary differences being the multi-jet behavior and the overall larger area of cooling.
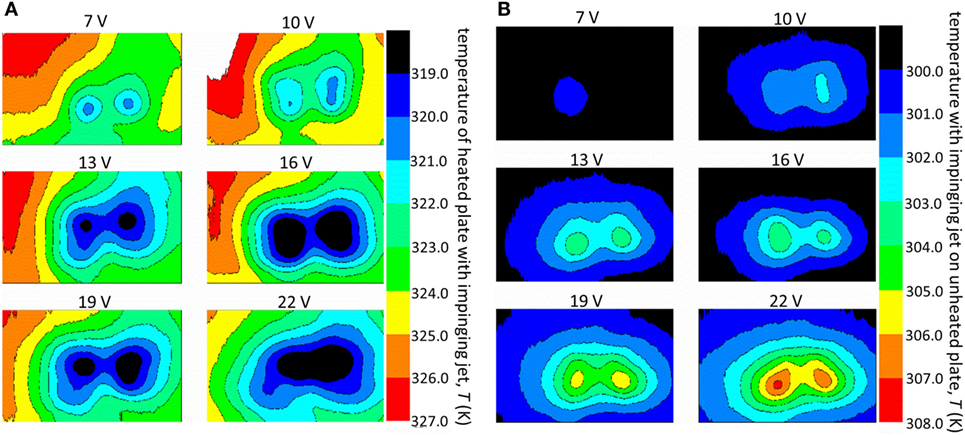
Figure 7. The temperature distribution at different input voltages on the (A) heated plate and (B) unheated plate with the impinging jet generated from a rectangular PT for a gap of G = 1 cm.
Figure 8A shows the local forced convection coefficients hPT for the jet generated by the rectangular PT. As with Figures 7A,B, distinct high intensity nodes with large convection coefficients form on the plate. As the applied voltage increases, these nodes spread and eventually merge with each other. At 22 V, the two strongest nodes begin to intersect, making an oval shape. Unlike with the sharp PT, the intensity and the affected area continued to increase for all input voltages tested in this study.
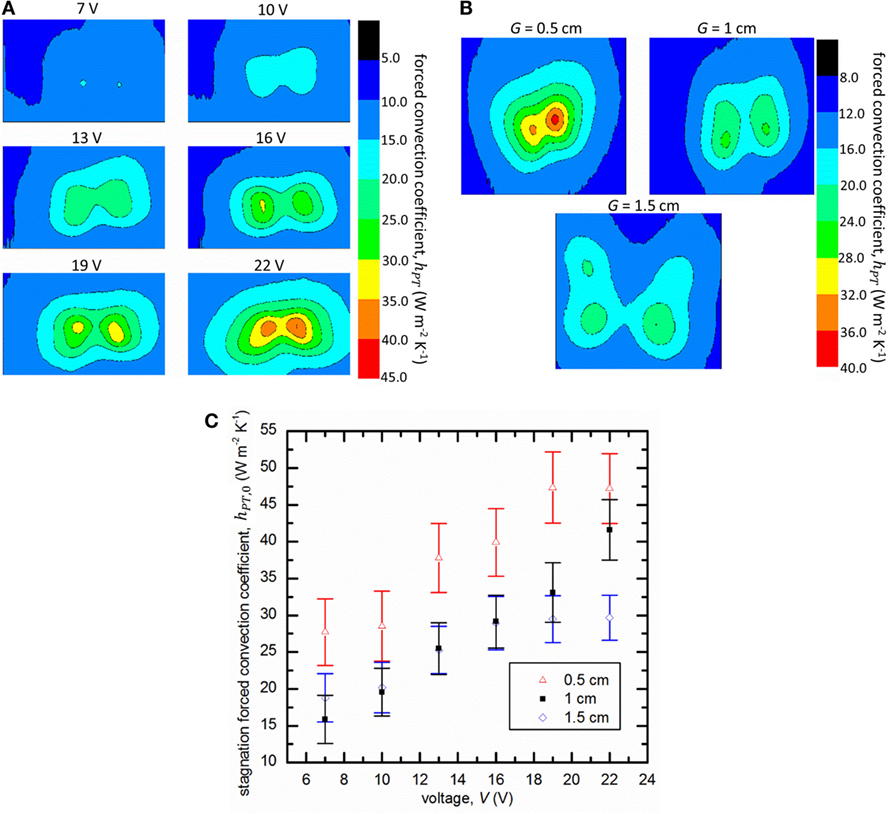
Figure 8. (A) The local forced convection coefficient hPT as a function of input voltage for the rectangular piezoelectric when the PT was placed G = 1 cm from the plate. (B) The local forced convection coefficient hPT as a function of gap distance from the plate, G, where the input voltage was 13 V. (C) The stagnation coefficient hPT,0 for different gap distances as a function of the input voltage.
The presence of four distinct jets produced by the corners of the PT becomes more apparent when the distance G between the PT and plate is changed. Figure 8B shows the local forced convections coefficient, while the PT is placed at three different distances from the plate at a constant input voltage (13 V). Closer to the plate (G = 0.5 cm), the jets are crowded together; but further away (G = 1.5 cm), the four jets are distinct nodes on the plate. Since there are multiple jets, we defined the stagnation convection coefficient as the maximum convection coefficient calculated on the plate. Figure 8C shows the stagnation convection coefficient recorded across the same range of input voltages for the different gap distances from the plate. Unlike with the single jet PT, the stagnation forced convection coefficient continued to increase for input voltages greater than 16 V, with no plateau observed across the voltage range tested here.
This can be attributed to the fact that unlike with the sharpened PT, the rectangular PT has edges for the discharges to continue grow, while the sharp piezoelectric does not. We observed that the discharge spread along the edges of the face the PT as the input voltage increased, leading to an overall stronger discharge and ionic wind. Figure 9 shows the color intensity taken from camera images of the discharge, where the areas of high intensity signify the visible glow of the plasma. The Coulombic body force fb that drives ionic winds can be written as follows (Ladenburg, 1932):
where ρi is the charge density, E is the electric field, i is the current, μi is the ion mobility, and Ad is the active area over which the body force acts. By growing along the edges of the PT, the area over which the electric field generated by the PT increases, causing a larger body force and thus larger convection coefficients. Notably, at 7 V only 2 nodes were present in Figure 7A. At the same input voltage, discharges were only active on three corners of the PT. This discrepancy can be attributed to surface irregularity on the piezoelectric, causing the corner in question to be less geometrically favorable for a discharge to form relative to the others.
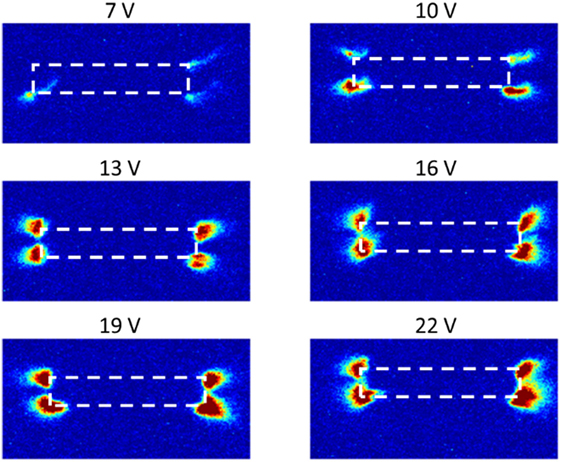
Figure 9. The color intensity of images taken at the end of the PT of the glow forming at the end of the PT from the perspective of the heated plate. The colored patches correspond to the formation of discharges that produce ionic wind jets, while the dashed line represents the location of the piezoelectric.
To fully quantify the total cooling done by the ionic wind, it is necessary to account for the total area cooled by the PT. As the input voltage increased, the impinging jets became stronger and cooled a larger area of the plate. The size of the cooled area as a function of the input voltage was determined by calculating the average forced convection coefficient across the observed area on the plate surface. Figure 10 shows the average convection coefficient as a function of input voltage. The steady increase in the average convection coefficient shows that the area cooled by the PT increases along with the input voltage. This coincides with what was shown in Figure 8A, where the increase in voltage leads to larger regions with active discharges. Figure 10 also shows the maximum local heated air temperature T∞,PT for different input voltages. Unlike with the single jet, the air temperature continued to increase at higher input voltages. This is likely because the discharges have more room to grow along the edges and heat more of the surrounding air.
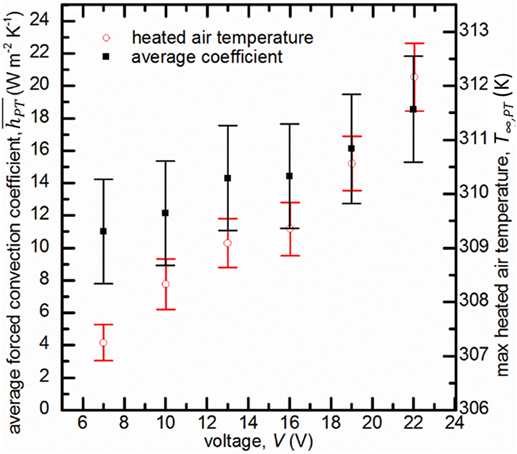
Figure 10. The average convection coefficient across the surface of the plate and the max heated air temperature when the PT is placed 1 cm away from the plate.
Cooling Effectiveness
To compare the cooling properties of the sharp and rectangular PTs, the amount of heat removed by the ionic wind relative to the electrical power input into the PT was computed for both. The heat removed from the surface by the ionic wind was computed using
where ΔT is the local change in temperature due to the ionic wind, and Ao is the area of an individual pixel. For both the sharp and rectangular PTs, the power into the piezoelectric, Pin, increased linearly with the input voltage, from Pin = 0.05 to 0.25 W for the sharp PT and Pin = 0.13 to 0.18 W for the rectangular PT.
The ratio Qout/Pin is shown in Figure 11 for both the sharpened and rectangular PTs. Interestingly, for the sharpened PT, this ratio reached a local maximum at an input voltage of 10 V, and steadily decreased at higher input voltages. By contrast, the ratio for the rectangular PT continued to increase with the input voltage, indicating greater cooling effectiveness. The sharp PT reached a peak effectiveness at an intermediate input voltage because, as was shown in Figure 5B, the stagnation convection coefficient eventually plateaus, although the peak is at a slightly lower voltage (~10 V) than the plateau (~16 V). Due to the sharp tip of the PT, the geometry is more favorable for ionic wind production, allowing for stronger ionic winds at lower voltages. However, as the input voltage increases and the size of the electric field is no longer prohibitive for discharge generation the rectangular PT is able to produce ionic winds from its corners. Because of this, the sharp PT operates more effectively at small input voltages, but stagnates at higher inputs. We did find that the sharp PT provides better control of the direction of the induced ionic, making it potentially better for some voltage-limited and space-limited applications, such as spot cooling in portable electronics. However, the rectangular PT is the superior option for less constrained applications because it effectively has four times the number of jets as the sharp PT, making it a better option for a bulk air mover.
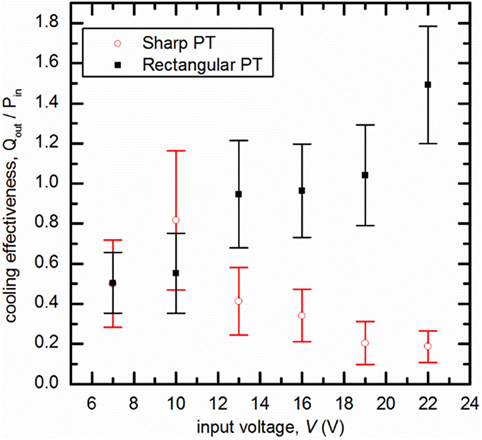
Figure 11. The cooling effectiveness of the two piezoelectric shapes as a function of the applied voltage.
Summary
In this work, the ionic wind generated by a PT was used to cool a heated metal plate at voltages as low as 7 V, orders of magnitude lower than previously possible. It was shown that through the use of PTs, an ionic wind jet can be produced at voltages significantly smaller than previously possible. The discharge used to drive the ionic wind also caused the surrounding air to heat, causing the ionic wind to cool the plate when it was warm, but heat it when it was cool. The induced jets acted similarly to other round, axisymmetric jets produced from conventional means. The sharp piezoelectric induced a single jet whose strength stagnated for higher input voltages. The rectangular PT did not stagnate for the voltages tested in this study, and cooling continued to increase for higher input voltages. The cooling effectiveness of both PTs were measured, and it was found that the sharp PT hit a local maximum while the rectangular PT continued to increase up to higher voltages. More work needs to be done on optimizing PT-based ionic wind devices for practical cooling application, such as exploring arrays of PTs, but this work serves as an important proof-of-concept for this approach.
Author Contributions
MJJ built experimental apparatus, conducted all of the experiments, and analyzed the data. DBG guided the experimental design and data analysis. Both authors contributed equally to the writing of the manuscript.
Conflict of Interest Statement
The authors declare that the research was conducted in the absence of any commercial or financial relationships that could be construed as a potential conflict of interest.
Funding
The authors would like to acknowledge funding support from Intel Corporation.
References
Allen, P. H. G., and Karayiannis, T. G. (1995). Electrohydrodynamic enhancement of heat transfer and fluid flow. Heat Recover. Syst. CHP 15, 389–423. doi:10.1016/0890-4332(95)90050-0
Alonso, J., Ordiz, C., Dalla Costa, M. A., Ribas, J., and Cardesin, J. (2009). High-voltage power supply for ozone generation based on piezoelectric transformer. IEEE Trans. Ind. Appl. 45, 1513–1523. doi:10.1109/TIA.2009.2023501
Baghaei Lakeh, R., and Molki, M. (2012). Targeted heat transfer augmentation in circular tubes using a corona jet. J. Electrostat. 70, 31–42. doi:10.1016/j.elstat.2011.09.003
Churchill, S. W., and Chu, H. H. S. (1975). Correlating equations for laminar and turbulent free convection from a vertical plate. Int. J. Heat Mass Transf. 18, 1323–1329. doi:10.1016/0017-9310(75)90243-4
Day, M., and Lee, B. (2002). Understanding piezoelectric transformers in CCFL backlight applications. Analog. Appl. J. Texas Instrum. Available at: http://www.ti.com/lit/an/slyt107/slyt107.pdf
Ekkad, S. V., Ou, S., and Rivir, R. B. (2004). A transient infrared thermography method for simultaneous film cooling effectiveness and heat transfer coefficient measurements from a single test. J. Turbomach. 126, 597. doi:10.1115/1.1791283
Franke, M. E. (1969). Effect of vortices induced by corona discharge on free-convection heat transfer from a vertical plate. J. Heat Transfer 91, 427. doi:10.1115/1.3580209
Fylladitakis, E. D., Theodoridis, M. P., and Moronis, A. X. (2014). Review on the history, research, and applications of electrohydrodynamics. IEEE Trans. Plasma Sci. 42, 358–375. doi:10.1109/TPS.2013.2297173
Gall, B., Kovaleski, S. D., VanGordon, J. A., Norgard, P., Benwell, A., Kim, B. H., et al. (2013). Investigation of the piezoelectric effect as a means to generate X-rays. IEEE Trans. Plasma Sci. 41, 106–111. doi:10.1109/TPS.2012.2227250
Gall, B. B., Kovaleski, S. D., VanGordon, J. A., Norgard, P., Baxter, E., Kim, B., et al. (2012). “Compact neutron generator driven with high-voltage piezoelectric transformer,” in 2012 Abstracts IEEE International Conference on Plasma Science (Edinburgh: IEEE).
Go, D. B., Garimella, S. V., Fisher, T. S., and Mongia, R. K. (2007). Ionic winds for locally enhanced cooling. J. Appl. Phys. 102, 53302. doi:10.1063/1.2776164
Hsu, C.-P., Jewell-Larsen, N. E., Krichtafovitch, I. A., Montgomery, S. W., Dibene, J. T., and Mamishev, A. V. (2007). Miniaturization of electrostatic fluid accelerators. J. Microelectromech. Syst. 16, 809–815. doi:10.1109/JMEMS.2007.899336
Incropera, F. P., DeWitt, D. P., Bergman, T. L., and Lavine, A. S. (2007). Fundamentals of Heat and Mass Transfer, eds F. P. Incropera and F. P. F. O. H. A. M. T. Incropera (John Wiley & Sons).
Itoh, H., Teranishi, K., and Suzuki, S. (2006). Discharge plasmas generated by piezoelectric transformers and their applications. Plasma Sources Sci. Technol. 15, S51–S61. doi:10.1088/0963-0252/15/2/S07
Ivensky, G., Zafrany, I., and Ben-Yaakov, S. (2002). Generic operational characteristics of piezoelectric transformers. IEEE Trans. Power Electron. 17, 1049–1057. doi:10.1109/TPEL.2002.805602
Johnson, M. J., and Go, D. B. (2015). Piezoelectric transformers for low-voltage generation of gas discharges and ionic winds in atmospheric air. J. Appl. Phys. 118, 243304. doi:10.1063/1.4938491
Kawashima, S., Ohnishi, O., Hakamata, H., Tagami, S., Fukuoka, A., Inoue, T., et al. (1994). “Third order longitudinal mode piezoelectric ceramic transformer and its application to high-voltage power inverter,” in Proceedings of IEEE Ultrasonics Symposium ULTSYM-94, Vol. 1 (Cannes: IEEE), 525–530.
Kim, H., Brockhaus, A., and Engemann, J. (2009). Atmospheric pressure argon plasma jet using a cylindrical piezoelectric transformer. Appl. Phys. Lett. 95, 211501. doi:10.1063/1.3267142
Kimber, M., Garimella, S. V., and Raman, A. (2007). Local heat transfer coefficients induced by piezoelectrically actuated vibrating cantilevers. J. Heat Transfer 129, 1168. doi:10.1115/1.2740655
Ladenburg, R. (1932). Untersuchungen über die physikalischen Vorgänge bei der sogenannten elektrischen Gasreinigung. III. Teil. Ann. Phys. 406, 510–520. doi:10.1002/andp.19324060503
Liu, X., Gabour, L. A., and Lienhard, J. H. (1993). Stagnation-point heat transfer during impingement of laminar liquid jets: analysis including surface tension. J. Heat Transfer 115, 99. doi:10.1115/1.2910677
Liu, X., Lienhard, J. H., and Lombara, J. S. (1991). Convective heat transfer by impingement of circular liquid jets. J. Heat Transfer 113, 571. doi:10.1115/1.2910604
Mitchell, A. S., and Williams, L. E. (1978). Heat transfer by the corona wind impinging on a flat surface. J. Electrostat. 5, 309–324. doi:10.1016/0304-3886(78)90026-8
Nakamura, K., and Adachi, Y. (1998). Piezoelectric transformers using LiNbO3 single crystals. Electron. Commun. Jpn. 81, 1–6. doi:10.1002/(SICI)1520-6440(199807)81:7<1:AID-ECJC1>3.0.CO;2-O
Oosthuizen, P. H., and Paul, J. T. (2010). Natural convective heat transfer from a narrow vertical flat plate with a uniform surface heat flux and with different plate edge conditions. Front. Heat Mass Transfer 1, 1–8. doi:10.5098/hmt.v1.1.3006
Owsenek, B. L., Seyed-Yagoobi, J., and Page, R. H. (1995). Experimental investigation of corona wind heat transfer enhancement with a heated horizontal flat plate. J. Heat Transfer 117, 309. doi:10.1115/1.2822522
Petroski, J., Arik, M., and Gursoy, M. (2008). “Piezoelectric fans: heat transfer enhancements for electronics cooling,” in Heat Transfer: Volume 2 (Jacksonville, FL: ASME), 671–677.
Roger, C. R., Yen, S. H., and Ramanathan, K. G. (1979). Temperature variation of total hemispherical emissivity of stainless steel AISI 304. J. Opt. Soc. Am. 69, 1384. doi:10.1364/JOSA.69.001384
Rosen, C. A. (1956). “Ceramic transformer and filters,” in Proceedings of the Electronic Components Symposium (Washington, DC), 205.
Schmidt, R. R. (1994). “Local and average transfer coefficients on a vertical surface due to convection from a piezoelectric fan,” in Proceedings of 1994 4th Intersociety Conference on Thermal Phenomena in Electronic Systems (I-THERM) (Washington, DC: IEEE), 41–49.
Tada, Y., Takimoto, A., and Hayashi, Y. (1997). Heat transfer enhancement in a convective field by applying ionic wind. J. Enhanc. Heat Transf. 4, 71–86. doi:10.1615/JEnhHeatTransf.v4.i2.20
Teranishi, K., and Itoh, H. (2007). A compact excimer lamp constructed by piezoelectric transformer. J. Light Vis. Environ. 31, 5–10. doi:10.2150/jlve.31.5
Teschke, M. (2009). Piezoelectric low voltage atmospheric pressure plasma sources. Contrib. Plasma Phys. 49, 614–623. doi:10.1002/ctpp.200910065
Tirumala, R., Li, Y., Pohlman, D. A., and Go, D. B. (2011). Corona discharges in sub-millimeter electrode gaps. J. Electrostat. 69, 36–42. doi:10.1016/j.elstat.2010.10.006
VanGordon, J. A., Gall, B. B., Kovaleski, S. D., Baxter, E. A., Almeida, R., and Kwon, J. W. (2010). High voltage production from shaped piezoelectric transformers and piezoelectric transformer based circuits. 2010 IEEE Int. Power Modul. High Volt. Conf. 334–337. doi:10.1109/IPMHVC.2010.5958361
VanGordon, J. A., Kovaleski, S. D., Norgard, P., Gall, B. B., and Dale, G. E. (2014). Measurement of the internal stress and electric field in a resonating piezoelectric transformer for high-voltage applications using the electro-optic and photoelastic effects. Rev. Sci. Instrum 85, 23101. doi:10.1063/1.4864052
Vliet, G. C., and Ross, D. C. (1975). Turbulent natural convection on upward and downward facing inclined constant heat flux surfaces. J. Heat Transfer 97, 549. doi:10.1115/1.3450427
Yamane, T., and Hamamura, S. (1998). “Efficiency improvement of piezoelectric-transformer DC-DC converter,” in PESC 98, 1255–1261. Available at: http://ieeexplore.ieee.org/xpls/abs_all.jsp?arnumber=703167
Keywords: impingement cooling, air cooling, forced convection, ionic winds, piezoelectric, heat transfer
Citation: Johnson MJ and Go DB (2016) Impingement Cooling Using the Ionic Wind Generated by a Low-Voltage Piezoelectric Transformer. Front. Mech. Eng. 2:7. doi: 10.3389/fmech.2016.00007
Received: 04 August 2016; Accepted: 06 October 2016;
Published: 24 October 2016
Edited by:
Dipankar Chatterjee, CSIR-Central Mechanical Engineering Research Institute, IndiaReviewed by:
Senentxu Lanceros-Mendez, University of Minho, PortugalShyama Prasad Das, Indian Institute of Technology Madras, India
Copyright: © 2016 Johnson and Go. This is an open-access article distributed under the terms of the Creative Commons Attribution License (CC BY). The use, distribution or reproduction in other forums is permitted, provided the original author(s) or licensor are credited and that the original publication in this journal is cited, in accordance with accepted academic practice. No use, distribution or reproduction is permitted which does not comply with these terms.
*Correspondence: David B. Go, dgo@nd.edu