Determining the Difference between Predicted vs. Actual Lighting Use in Higher Education Corridors
 Katharine L. van Someren
 C. Philip Beaman
 Li Shao3
- 1Technologies for Sustainable Built Environments Centre, University of Reading, Reading, United Kingdom
- 2School of Psychology and Clinical Language Sciences, University of Reading, Reading, United Kingdom
- 3School of the Built Environment, University of Reading, Reading, United Kingdom
The performance gap is a measure of the difference between design assumptions and actual in field data. Estimating terms, specifically the operational hours of use, when making such design assumptions in order to predict the impact of lighting upgrades can potentially result in either an overestimate or underestimate of the savings to be made. In this paper, the background of performance gap measurement is outlined and field measurements are gathered and applied retrospectively to lighting upgrades in corridors. The lighting upgrade projects in three university buildings and their assumptions are explained in relation to the operational hours proposed using the industry “Energy assessment and reporting method.” We then describe a simple and relatively inexpensive means of taking in field measurements using small unobtrusive environmental loggers to record the lighting use and occupancy. This method, which can be implemented prior to upgrade works or energy efficiency retrofits, reveals substantially different patterns of annual electricity consumption, and carbon dioxide equivalent emissions from those assumed by a priori estimates. Patterns of use emerge that include additional hours of use by cleaners, out of hours working, and weekend working not anticipated in original estimates. These results also suggest a valuable distinction between lighting on hours and occupancy hours not captured in the current “Energy assessment and reporting method.” The results find the differences between predicted vs. actual data are considerably different, with lights on hours ranging from −67% lower to 25% and 138% higher when compared with predicted operational hours. We conclude that the estimates the industry uses in calculating energy efficiency upgrades should be accompanied by clear and adequate information about occupancy use. In our study, the consequence of reporting energy savings using assumptions and estimates in calculations resulted in a substantial overall underestimate of the savings achieved in practice.
Introduction
In 2014, lighting comprised 18% of all United Kingdom electricity use and consumed 58,000 TWh per year (Lighting Industry Association, 2014). Upgrading to more energy-efficient lighting systems is therefore a critical component in decreasing energy consumption and improving overall sustainability as lighting systems are relatively easy to replace compared with heating and ventilation systems. Having recognised the need for verification and evolving improvement of building systems the “European Committee for Standardization Technical Body CEN/TC 169—Light and Lighting” is in the course of updating their documentation to include the “Lighting Design Process” (LightingEurope, 2017). The “Lighting Design Process” details five stages: (1) Design, (2) Installation, (3) Commissioning, (4) Verification, and (5) Operation and Maintenance. These stages have been illustrated alongside the building life, frequency of lighting upgrades in Figure 1 (LightingEurope, 2017). “Lighting Targets for Government Buildings,” which includes University buildings, is defined as strategically important in the United Kingdom Lighting Sector Strategy Report (Lighting Industry Association, 2014). Stage 4 Verification of the “Lighting Design Process” is key to the credibility of business cases for supporting lighting upgrades (Lighting Industry Association, 2014). Lighting upgrades are modelled in Figure 1 as occurring every 10 years to upgrade luminaires and sensor technologies. In a school environment, luminaires have a typical life expectancy of 11 years and a lighting capital expenditure of £106/m2 over a 30-year life for the building, compared with £66/m2 for heating and £59/m2 for ventilation (Karbasi et al., 2016). Thus, the lighting sector and leading European Union member states are making significant changes to include verification as part of their evolving practises; the lighting performance gap is crucial to all stages but is distinguished in the verification stage.
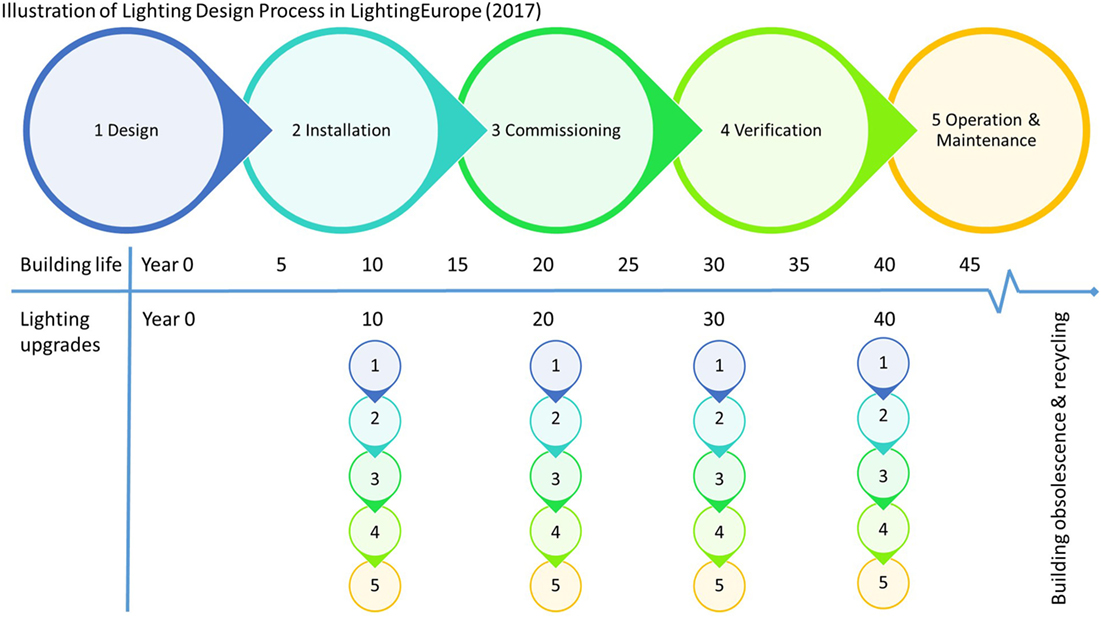
Figure 1. Illustration of the LightingEurope CEN/TC 169 “Lighting Design Process” alongside building lifespan.
The United Kingdom Government and Higher Education Funding Council for England links English University funding to their Carbon Management Plan targets. In 2009, the University in this study committed to the target of reducing its carbon emissions by 35% against the 2008/2009 baseline and in February 2017 achieved this target (Hodgson, 2011; Sustainability Team University of Reading, 2017). In the first 6 years of this University’s carbon management programme, lighting retrofit projects made up 12% of the total carbon energy efficiency projects and the nine lighting upgrades cost a total of £810,532 and achieved savings of £164,951 per annum (p.a.) and 800 tCO2e (p.a.) (Fernbank, 2013). The 30 teaching and learning buildings on the main University campus amount to 122,000 m2 of Gross Internal Area floor space, and communal areas total 21% of this space (25,300 m2). Corridor and communal areas are not defined as usable floor space in the context of a building that is primarily used for teaching and learning with additional academic offices (RICS, 2015). The electricity consumption in these transient corridor spaces is predominately electrical lighting and this is a substantial floor area to illuminate. The purpose of this study was to investigate, over a 6-month period, whether the lighting within the corridor areas of three different University buildings was being used efficiently.
Performance Gap
The performance gap is a measure of the difference between design assumptions and actual in field data. The performance gap, originally termed the “credibility gap” by Bordass and Leaman (2005) and Way and Bordass (2005), is well established in the built environment and post-occupancy evaluation is a means of addressing this gap by providing designers with actual in-use data (Menezes et al., 2012; Lawrence and Keime, 2016; Min et al., 2016). A distinction between the types of performance gap has been proposed dividing into three progressive categories: regulatory performance gap; static performance gap; and dynamic performance gap (Burman, 2015; van Dronkelaar et al., 2016). Respectively, these are broadly: the regulatory requirements, for example, compliance with Part L2B Building Regulations in the United Kingdom; the static performance gap is a snapshot in time at a specific point, for example, when the building is first occupied and compared with designer’s assumptions or models; the dynamic performance gap assumes a fluid and flexible changing of the space organically throughout time, for example, different types of building user or tenants. Imam et al. (2017) recently investigated the internal “mental models”—the psychological representation of a real or imagined system (Craik, 1943)—of 108 thermal modellers and found a wide variability in their approaches to model inputs and ranking input parameters. Their findings include the observation that a quarter of modellers participating were making worse judgements than a random response and even the most experienced modellers, including external consultants, contributed great diversity (including some of the worst performance) to the overall results (Imam et al., 2017). This paper measures and assesses how retrofit upgrades to luminaires and controls in corridor areas perform in practice. This study aims to contribute to this growing area of research by exploring consultants’ predictions of energy savings used in financing and supporting these projects prior to installation. We have purposely focussed on communal areas as there is a distinct lack of empirical evidence detailing how frequently lighting in corridor and transient spaces is switched on through automation systems such as timer and sensor controls. Calculating the lighting demand in existing buildings in the United Kingdom is a requirement of designers when retrofit works are undertaken to upgrade older systems (HM Government, 2010) but in the absence of in field data the predicted consumption of lighting is often based on prediction and model simulation. This paper compares in field measurements against design assumption to measure the performance gap.
Building Performance Methods
In the commercial sector the CIBSE “Guidance TM22 Energy assessment and reporting method” is widely used in the United Kingdom to assess four building types. These are offices, hotels, banks and agencies, and mixed use industrial, but there is no specific guidance for University buildings (CIBSE, 2006). The International Performance Measuring and Verification Protocol (IPMVP) method is adopted predominately in the United States (Borgstein et al., 2016) and is used in locations where shared savings schemes are agreed, as a way of quantifying the in-use consumption of systems and buildings. However, it is suggested that the cost of IPMVP measuring and verification should not exceed 10% of the estimated savings and be appropriate for the scale of the project. Other benchmarking tools exist and in the United Kingdom the “Carbon Buzz” project is a collaborative and anonymous database of each sector’s actual energy use in relation to initial design predictions (CIBSE et al., 2017). As a sector, the performance gap in university buildings was calculated to be 85% higher for electricity consumption (kilowatt hour per meter squared per year) as detailed in the “CarbonBuzz” project (Menezes et al., 2011). Menezes et al. (2012) determined the performance gap for lighting in an office space where the calculations used 2,600 total hours of operation per annum and 11 W/m2 in their initial assumptions. Conversely, the final model which most closely matched the actual energy use was 3,640 h per annum and 13 W/m2 (Menezes et al., 2012). In this study, the absolute underestimation of 1,040 h per annum and 2 W/m2 is substantial; this is an additional 40 and 18%, respectively, relative to the initial model. Corridor space is often neglected in such studies but a City University of Hong Kong building was calculated to have potential to save 69% of corridor lighting electricity when linked to daylight harvesting for a range switch off threshold illuminances between 200 and 450 lux (Li and Lam, 2003). Li and Lam (2003) noted that the corridor used in this study was illuminated to 450 lux rather than the 100 lux cited as the CIBSE reference level of illumination, hence there was the potential to save even more if the over-illumination of the corridor was satisfactorily addressed (Li and Lam, 2003).
Decision Making
The decision making surrounding energy efficiency installations involves consideration of many factors, including financial incentives, carbon reduction and routine maintenance, and management of upgrading older systems. A difficulty estates and facilities teams face is in convincing budget holders and decision makers that new energy-efficient systems will save money and reduce carbon dioxide emissions in practice. Faced with this difficulty, most researchers investigating decision making in the built environment have utilised the Multiple Criteria Decision Making method, where multiple inputs are ranked, or Analytic Hierarchy Process used in group decision making (Kracka and Zavadskas, 2013; Fouchal et al., 2016). In the absence of actual data, estimates are used for the calculations, based on assumptions and discussions with building occupants but the accuracy of these estimates has not been examined. The lack of credibility in these estimates leads to doubt by the decision makers, or worse still the estimates go unchecked.
We suggest that the “Pre-Mortem technique” proposed by Klein could be adopted by built environment designers. A prospective hindsight approach is used to describe and imagine weaknesses in the early design stage, the reasons and adaptations to mitigate failure are then discussed (Klein, 2007).
As an example:
• The assumptions used for the hours of operation for a University building corridor are 10 h a day, 5 days a week, 48 weeks of the year: a total of 2,400 h annually.
• Other corridor calculations have estimates of use for only 42 weeks of the year, and yet others with 8 h per day not 10 h.
There are no indications within the calculations as to why these differences are so large—as previous researchers have pointed out, these assumptions survive unchallenged (Menezes et al., 2012).
Lighting upgrades are relatively simple projects but it is critical to anticipate where the weaknesses are in the assumptions and how pivotal these might be in relation to the outcome metrics: return on investment simple payback, annual electricity consumption, carbon dioxide equivalent emissions, and savings.
Objectives
The objectives of this study are:
(A) to discover any interesting patterns of lighting on use and occupancy;
(B) to explore the predictions and assumptions by inputting the actual values of hours of operation into the carbon and electricity consumption calculations; and
(C) to measure the performance gap of lighting in corridor environments.
The key contribution of this work is to measure the performance gap in corridor lighting by taking a retrospective approach and analysing three buildings lighting use by recording actual occupancy and lights on data. This will allow for evaluation of the accuracy of the energy efficiency calculations commonly used by energy managers for decision making. The metrics for assessing the use of corridor lighting in practice against project carbon and electricity saving estimates provides insights that could also be used in other mechanical and electrical installations in buildings, not just lighting.
Materials and Methods
The CIBSE TM22 method in Appendix A8: Energy Tree Diagram is used as the basis for this study’s assessment of four different lighting areas in three university buildings. The data collected include in-depth 1 min resolution of corridor lighting on time, corridor occupancy, vertical corridor illuminance, and building level electricity metering where available. Monitoring of occupancy is based on a passive infra-red (PIR) sensor for a limited zone of the corridors studied.
Building Descriptions
The three buildings in this study were selected as they were identified as part of the university’s carbon management plan and importantly the long-term real estate strategy. All three buildings had corridor lighting assessments from the university’s external consultants, in house project managers, and sustainability team. Between them, the three buildings contributed four corridor areas of data collection and will be identified as Humanities 1 (first floor), Urban 2 (second floor), Urban 3 (third floor), and Maths 1 (first floor). Two buildings Urban and Maths had upgrades completed by 2013, the financial payback periods for the Humanities lighting upgrade was considered unviable and therefore the decision was made that this building’s corridor lighting would not be upgraded at the time.
Field Information
The University has closure dates each year where the buildings are closed and not accessible without prearranged authorisation from the campus security team. For the period considered, the closure dates were 24 December–3 January and over the Easter period, including Maundy Thursday through to Easter Monday. The buildings in this study are closed by security staff between 9:00 and 10:00 p.m. and access is gained by cleaning staff who usually enter at 5:30 or 6:00 a.m. During closure periods and outside of normal working hours, the buildings are only accessible by staff and students who hold authorised access permissions, otherwise in all other cases the buildings are accessible by staff, students, and arranged visitors. The buildings are all fully operational and used during the United Kingdom summer period in July–September for other courses and all students have full access during this time.
All four locations are accessible to all staff and students during the periods when the buildings are open. The corridor locations—which are outside of classrooms—were specifically chosen to represent corridor spaces outside classrooms which are not solely occupied by one school or department but can be centrally booked by any group booking.
Data Collection
Environment Loggers
At each corridor monitoring area, two loggers were installed at 1.5 m from finished floor level on the vertical wall of the corridor. The HOBO™ UX90-005 occupancy/lights on (PIR detector 5 m), or UX90-006 occupancy/lights on logger (PIR detector 6 m) was installed and this logger also recorded lights on/off with a photocell. The HOBO™ U12-012 light intensity environmental loggers were installed at each site to measure vertical illuminance. The occupancy/lights on logger were configured to log occupancy events and return the light state every 1 min as on or off. The photocell in the UX90-005/006 occupancy/lights on logger is triggered by the illuminance levels and can be calibrated on set up and at each data download with the lights on. The occupancy/lights on loggers cannot differentiate between daylight and artificial light, so data can be recorded as lights on when daylight reaches this threshold of toggling it on/off. To prevent this from happening, the logger was placed in an area away from direct sunlight. The HOBO™ UX90-005/6 occupancy/lights on logger were positioned above the HOBO™ U12-012 light intensity data logger. The use of HOBO™ loggers in built environment research has led to consistent findings when validating their data outputs alongside Open Source Building Science Sensors (Ali et al., 2016) and their use in lighting applications is pervasive (Tetlow et al., 2014; Burman, 2015; Popoola et al., 2015).
CO2e Saving Predictions
The method most widely used for calculating lighting installation energy over time, which includes parasitic load and controls, is the “lighting energy numeric indicator” (LENI) measured in units kilowatt hour per square meter per annum (HM Government, 2010; The Society of Light and Lighting, 2016). The carbon savings predictions that form the basis of this performance gap assessment for corridor lighting, are calculated using Eq. 1 as the corridor is calculated on a per metre rather than metre squared basis of LENI:
Equation 1 LENI and CO2e calculation: Equation 1 parameters where E: total electricity density, P: total electricity consumption kW, FL: load factor, Th: operating hours, : CO2 conversion factor. Equation 1 is extracted from the external consultants calculations used in these corridor lighting upgrade projects and they are based on the Carbon Trust formulae for calculating the business cases for retrofit projects (Carbon Trust, 2012). The designs and calculations used in these projects were carried out in 2012 and 2013, since then the LENI calculation has been further refined, for differentiating daytime, night time, and parasitic consumption, nonetheless the original calculation is used for comparison purposes.
For lighting projects, Eq. 1 includes two predicted terms: operational hours (Th) and electricity consumption (P) and one predicted coefficient: load factor (FL). As these predictions are multiplied any error in the terms and coefficient will skew the estimate of predicted energy consumption overall. The load factor is usually between 1 and 0.7, it is an estimated coefficient based on assumptions that takes into account parasitic load and whether the control system achieves electricity savings when it is dimming, switched off through absence detection, or daylight detection. In the absence of specialist sub-metering data and simultaneous recording of the lights at a dimmed level or at a lower load, the load factor remains routinely based on assumptions rather than evidence provided by lighting manufacturers (Caple, 2016). The CO2e conversion factor is extracted from published United Kingdom Government Greenhouse Gas Reporting Conversion Factors for the appropriate year of the project (Department of Energy and Climate Change, 2011). The CO2e electricity factor is the sum of generation (Scope 2) and transmission and distribution (Scope 3) factors, for example, in 2016 respectively: 0.41205 + 0.03727 = 0.44932 kg CO2e/kWh. The current paper examines the accuracy of the predicted term annual operating hours.
Lighting Controls and Field Information
The lighting controls operating in each of the four corridors is described in Table 1.
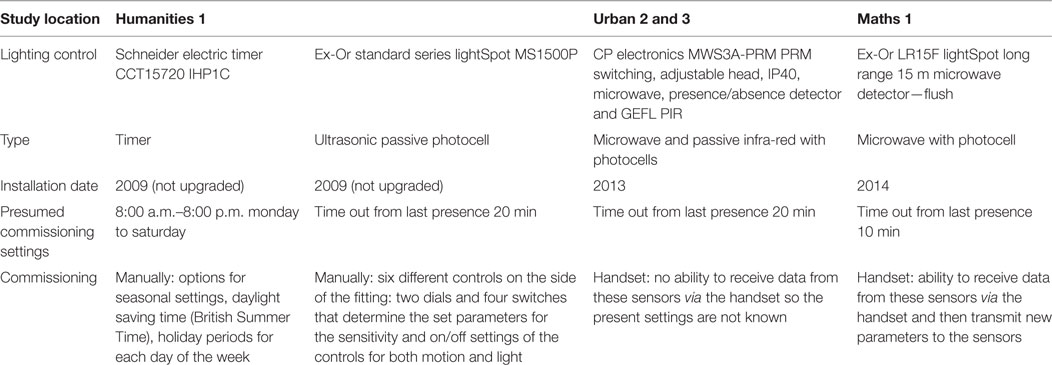
Table 1. Lighting corridor controls field data.
Data Structure and Data Procedures
The data produced by the HOBO™ loggers was downloaded each month using the HOBOware software, the light on calibration for the U90-005/6 loggers took place at each installation, and reinstallation in situ. Where incomplete days of data were recorded, for example, at the beginning of the study when a logger was installed at 13:00 h on Tuesday, the whole of Tuesday’s data was omitted as the study aimed to capture complete hours of operations over a 24 h period. Using the HOBOware software, the data were aggregated to count the total number of hours the lights were recorded as switched on and occupied each day. The average illuminance each hour was also aggregated, these summative datasets were exported as a Microsoft Excel file.
Energy Efficiency Predicted Project CO2e Calculations
The energy efficiency predictions for electricity consumption and reduction in CO2 equivalent emissions for the three buildings are detailed in Table 2. These are the predictions as calculated from the individual projects.
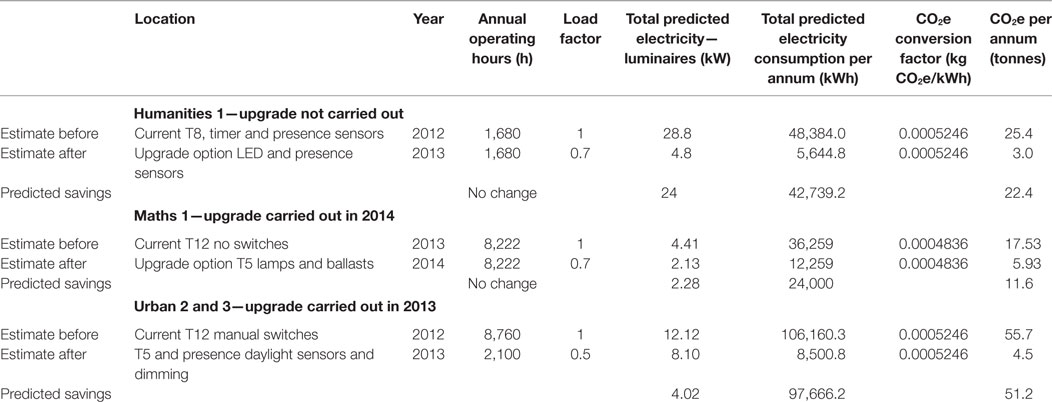
Table 2. Electricity consumption predictions for each building.
The load factor changes as outlined previously in Eq. 1 are based on assumptions provided by lighting manufacturers. The load factor assumes lower loads due to photocells, dimming controls, and other control options after upgrade.
Results
Humanities 1
Corridor Lights on and Occupancy Patterns
The original calculation in Table 2 for predicting the operating hours for Humanities 1 assumed 1,680 annual operating hours in total, based upon 8 h per day, 5 days per week, and 42 weeks per year. The Humanities 1 building had two control systems (timer and ultrasonic sensors) operating for similar lights on hours, the lights on median annual value from the four areas is 3,994 (h/annum), and lights on SD 111 (h/annum), the data from the four areas are displayed in Figure 2 with SD error bars. The occupancy in the four corridor data collection areas is shown alongside the predicted value of operational hours in Figure 2, with an occupancy median value of 1,547 per annum and occupancy SD of 302 (h/annum).
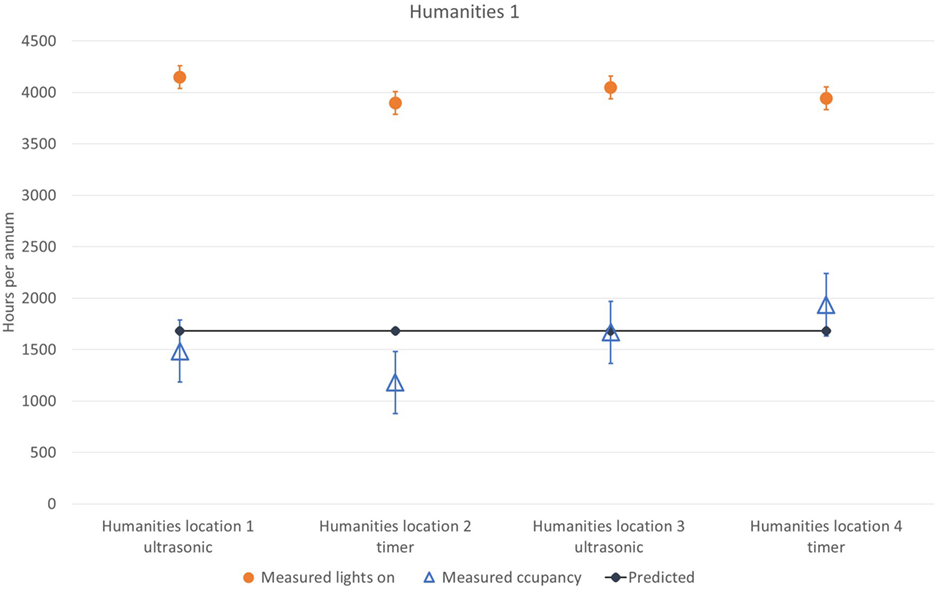
Figure 2. Predicted operational hours and measured hours per annum in the Humanities 1 Building.
The predicted assumption has no weekend or working between 08:00–09:00 and 17:00–20:00 h and no occupancy for 10 weeks of the year. Building users were accurate in providing their own occupation period as the median value is only 133 h per annum lower than the predicted value of 1,680. However, this original prediction omits the arrival of the cleaners at 05:30 h each morning during the working week and students’ union groups and other societies making use of the classrooms (with prior agreement) until 20:00 h on some working week evenings. The heuristics, or rules of thumb, used in the assumptions could be perceived as overoptimistic in their major underestimation of the actual patterns of lights on hours which are 138% higher than predicted operational hours. Operational hours are used as a proxy for occupancy hours which is in turn used as a proxy for lights on hours.
A key finding of this study is that operational hours ≠ occupancy hours ≠ lighting on hours: the terms are not analogous.
The patterns that emerged from the data were that the hours of occupation extended to more realistically being 08:00–20:00 h each weekday as shown in Figure 3.
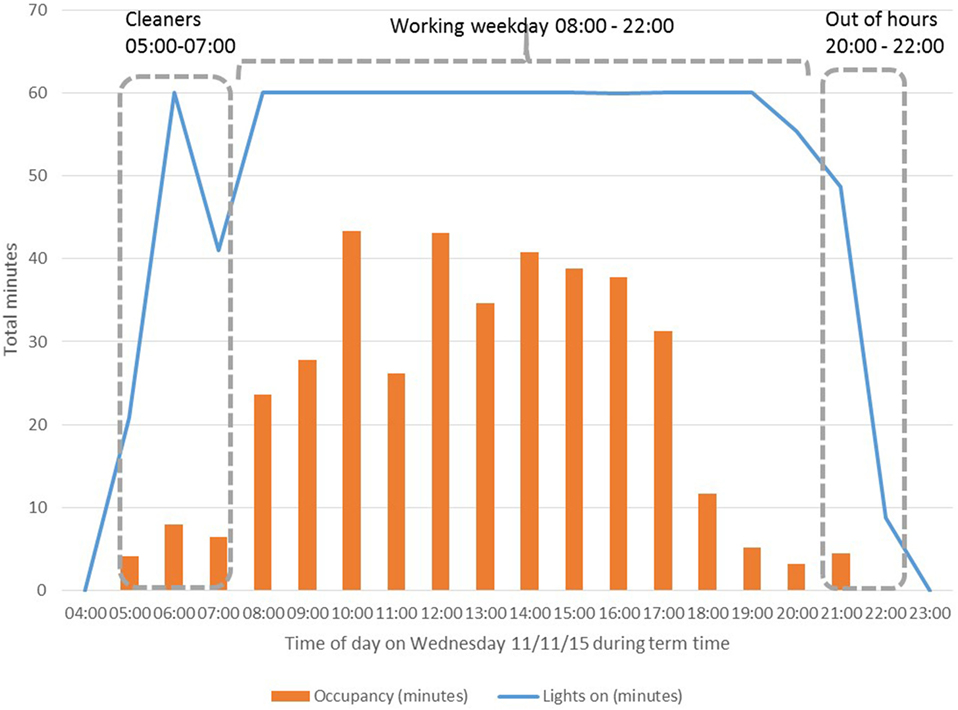
Figure 3. Typical term time weekday lights on and occupancy profiles: humanities 1 corridor at location 1 where installed ceiling lighting is controlled by ultrasonic sensors (rather than the timer).
The pattern supports the conclusion that the timer settings of 08:00–20:00 h are rational as a design solution for the half of the lighting system luminaires that are linked to the timer, however, this does not account for the settings including Saturday. The occupancy proportions according to time of day, working day, and weekends are divided as: mean working hours Monday–Friday 08:00–20:00 h 89%, non-working hours 20:00–08:00 h Monday–Friday 9%, and the remaining 2% was weekend occupancy. The combined control methods used in this corridor satisfy the out of hours use 20:00–08:00 h and weekend use with the ultrasonic sensor and the timer 08:00–20:00 h could be further adjusted to Monday–Friday only and to be switched off over the closure periods to consume less electricity. It is proposed that the large discrepancy between lights on hours and occupancy hours in Figures 2 and 3 can be reduced by shortening the hold on time after someone has vacated the corridor area. The “Lighting Design Process” Stages 3 Commissioning, Stage 4 Verification, and Stage 5 Operation and Maintenance in Figure 1 are iterative and can take place consistently until the gap is narrowed to reduce operating costs, electricity consumption, and CO2e emissions.
CO2e Emissions and Electricity Consumption
The predicted annual CO2e emissions and electricity consumption are compared with the measured values using the before and after process in Table 2 and is shown in Figure 4. The measured values are 138% higher than predicted, these findings are consistent with CarbonBuzz data for University buildings which have shown up to a 150% increase in recent performance gap analysis (van Dronkelaar et al., 2016).
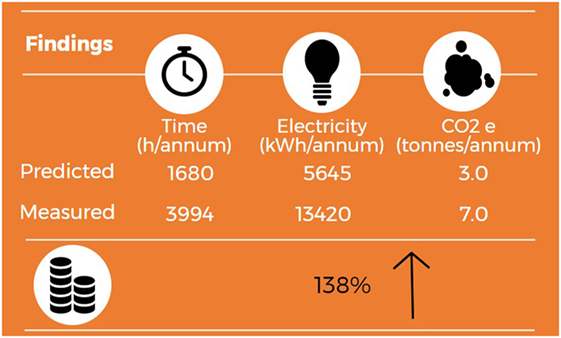
Figure 4. Humanities 1 CO2e emissions and electricity consumption analysis.
Another important finding was that although this building did not have the lighting upgraded in 2013, with the measured data available for total annual hours on, almost 4,000 h p.a., the calculations can be revisited for both the “before” and “after” calculations in Table 2. If only the annual hours of use are changed the “before” gives a measured total of 60.4 CO2e p.a. (tonnes), and “after” upgrade with LED lighting gives a total of 7.1 CO2e p.a. (tonnes), saving 53.3 CO2e p.a. (tonnes) compared with the predicted 22.4 CO2e p.a. (tonnes). What is surprising is that the decision making surrounding this project led to it being deemed unviable at the time due to its payback periods. Using the Pre-Mortem technique for this project, if the designers and project managers had imagined weaknesses in the early design stage they might have picked up on the appropriateness of the assumptions in the predictions. Reasons and adaptations to mitigate failure at the time were not explored as this project was put on hold, it now has the potential to save much more than first expected using measured values.
Maths 1
Corridor Lights on and Occupancy Patterns
The Maths building was part of the lighting energy efficiency upgrades in the Carbon Management Plan. The corridor lighting upgraded was completed in 2014 with microwave sensors, the corridors on the first floor where this study was located have a mixed use of academic offices and centrally bookable classrooms. The original calculation in Table 2 for predicting the operating hours for Maths 1 assumed 8,222 annual operating hours in total. The median annual lights on value from the three areas is 2,683 (h/annum) and lights on SD 416 (h/annum), these are displayed separately in Figure 5. The occupancy in the three corridor data collection areas is shown alongside the predicted value of operational hours in Figure 5, from the three areas a median value of 831 per annum, and SD of 354 (h/annum) are calculated.
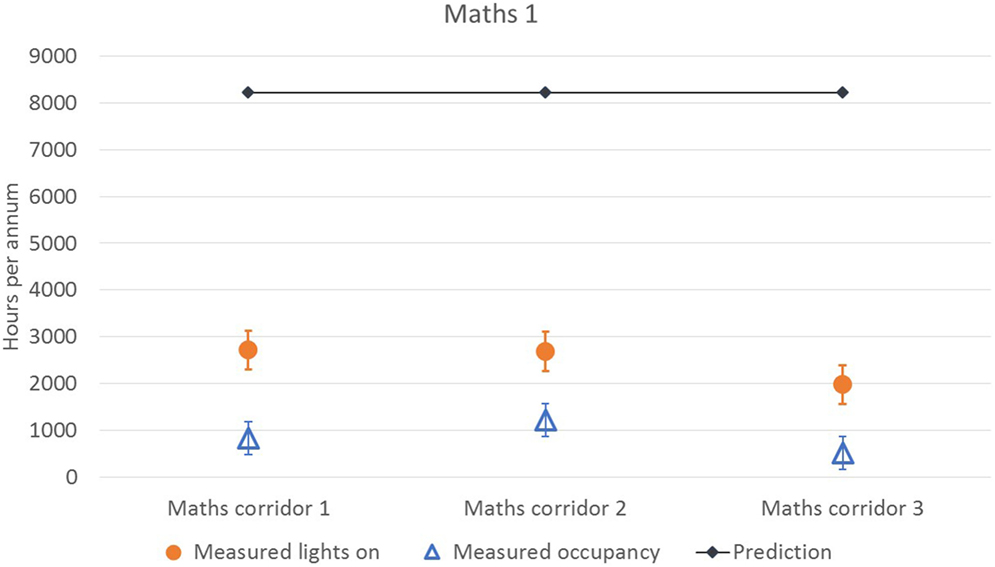
Figure 5. Predicted operational hours and measured hours per annum in Maths 1 Building.
The predicted 8,222 annual operating hours were calculated from survey data where prior to the retrofit some of the corridor lights did not have switches and remained on constantly, some were on for up to 80% of the year. Lights on for 24 h a day 365 days of a year = 8,760 annual hours; the prediction assumes 22 days in the year the corridor lights are off. The actual patterns of lights on hours after the corridor lighting retrofit are 67% lower than predicted operational hours. Operational hours are used as a proxy for occupancy hours which is in turn used as a proxy for lights on hours which supports the previous building’s analysis. The patterns that emerged from the data are shown in Figure 6, which shows continual occupancy from 06:00 to 20:00 h and out of hours occupancy from 20:00 to 22:00 h.
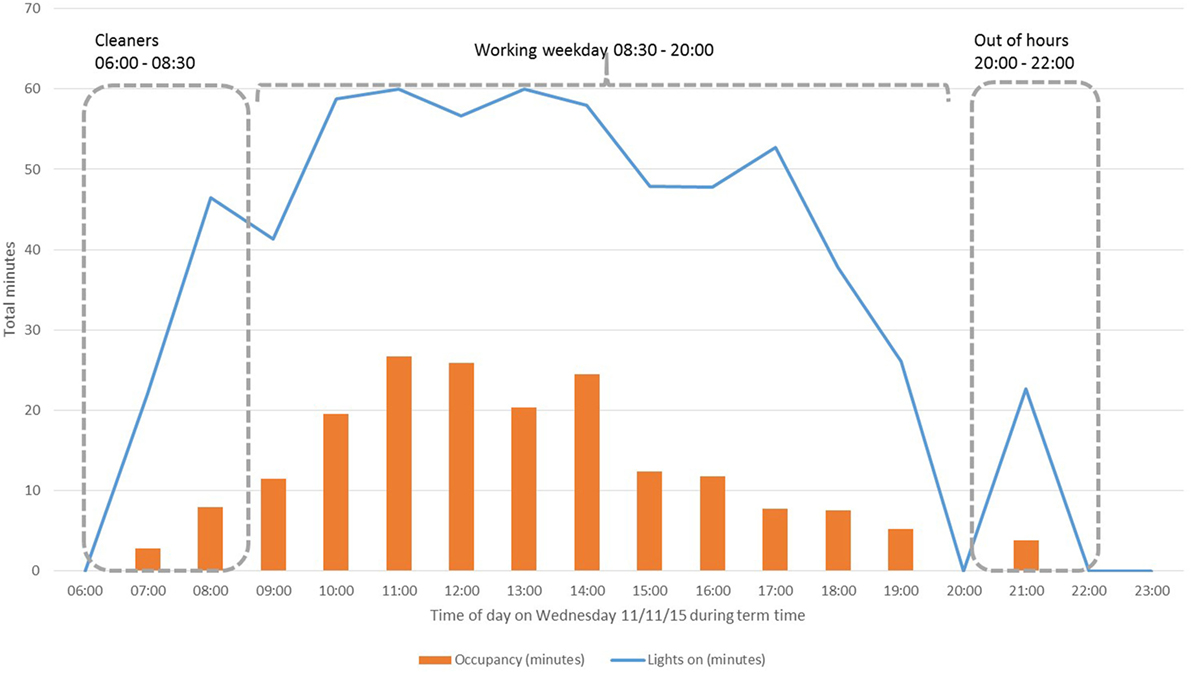
Figure 6. Typical term time weekday lights on and occupancy profiles: Maths 1 corridor location 2 microwave sensor.
The pattern of lights on and occupancy during the study period are aggregated each week from the three corridor loggers and shown in Figure 6. The study period began during an undergraduate break in the academic calendar in early November 2015. Median lights on use are calculated by taking the median value from the total daily lights on use across the 7 days of the week from the three data collection corridor locations. The identical calculation is used for occupancy and both are displayed alongside each other in Figure 7. The highest daily median lights on value are 12.60 h at week 12 prior to the Easter holidays during weeks 13–15. Non-term times at week 45 when the study started, weeks 52–53 over Christmas, and a drop in occupancy at week 7 for reading week can be seen in Figure 7. It is proposed that the difference between the median lights on hours and occupancy hours is the time delay when the corridor has been vacated to the lights being switched off. The lights were fully commissioned to complete the upgrade process in 2014, the study took place in 2015 only 1 year after retrofit completion. In the lighting design process if Stages 3–5 (Figure 1) are iteratively explored for reducing the performance gap this study generates the hypothesis that the lights on hours and occupancy hours would be much more closely aligned.
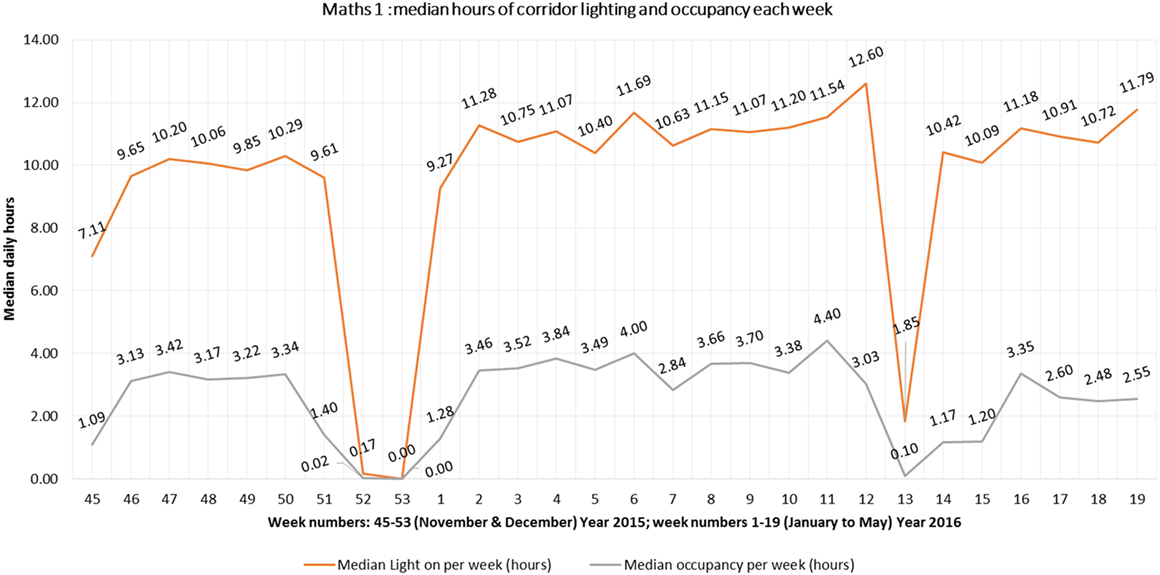
Figure 7. Maths 1 median hours corridor lights are on and median occupancy each week.
CO2e Emissions and Electricity Consumption
The predicted annual CO2e and electricity consumption are compared with the measured values using the before and after process in Table 2 and is shown in Figure 8. The measured values are 67% less than predicted, these findings are paradoxical with CarbonBuzz data for University buildings where increased electricity consumption is the norm (van Dronkelaar et al., 2016).
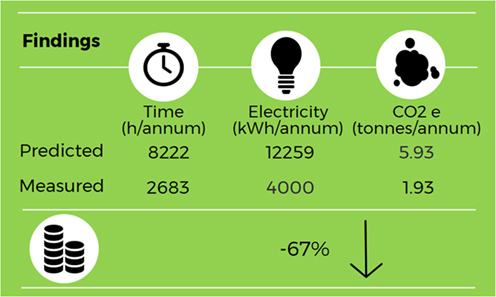
Figure 8. Maths 1 CO2e and electricity consumption analysis.
Maths 1 has been calculated using overestimates of operating hours both before and after the upgrade. Inputting the measured lights on hours into the original calculation for the after scenario, this project has saved more annual electricity and annual CO2e emissions than originally predicted.
Urban 2 and Urban 3
Corridor Lights on and Occupancy Patterns
The corridors on the second floor (Urban 2) accessed mainly centrally bookable classrooms and some shared post-graduate offices. Four corridor locations surrounding a central staircase access point were monitored on the second floor. The consultant’s assumptions for the Urban 2 and 3 corridor retrofit lighting project were predicted to be 2,100 operational hours annually after the retrofit in 2013 (10 h per day, 5 days per week, 42 weeks per year). The commissioning of the infra-red and microwave sensors after the retrofit of new lighting were set to 20 min of hold time where if no presence was recorded the lights linked to that sensor would automatically switch off. The corridors on the third floor (Urban 3) accessed single occupancy offices for academics and administrative staff offices. A key element of logging corridor data in the two different locations in the one Urban building was the difference in the use of these two floors. It was anticipated that the occupancy and lights on hours would be quite different between Urban 2 and Urban 3, however, without empirical evidence to support this, this study sought to find out if there was such a difference. The lights on median annual value from the four areas in Urban 2 is 2,964 (h/annum) and lights on SD 287 (h/annum), the data from the four area are displayed in Figure 9.
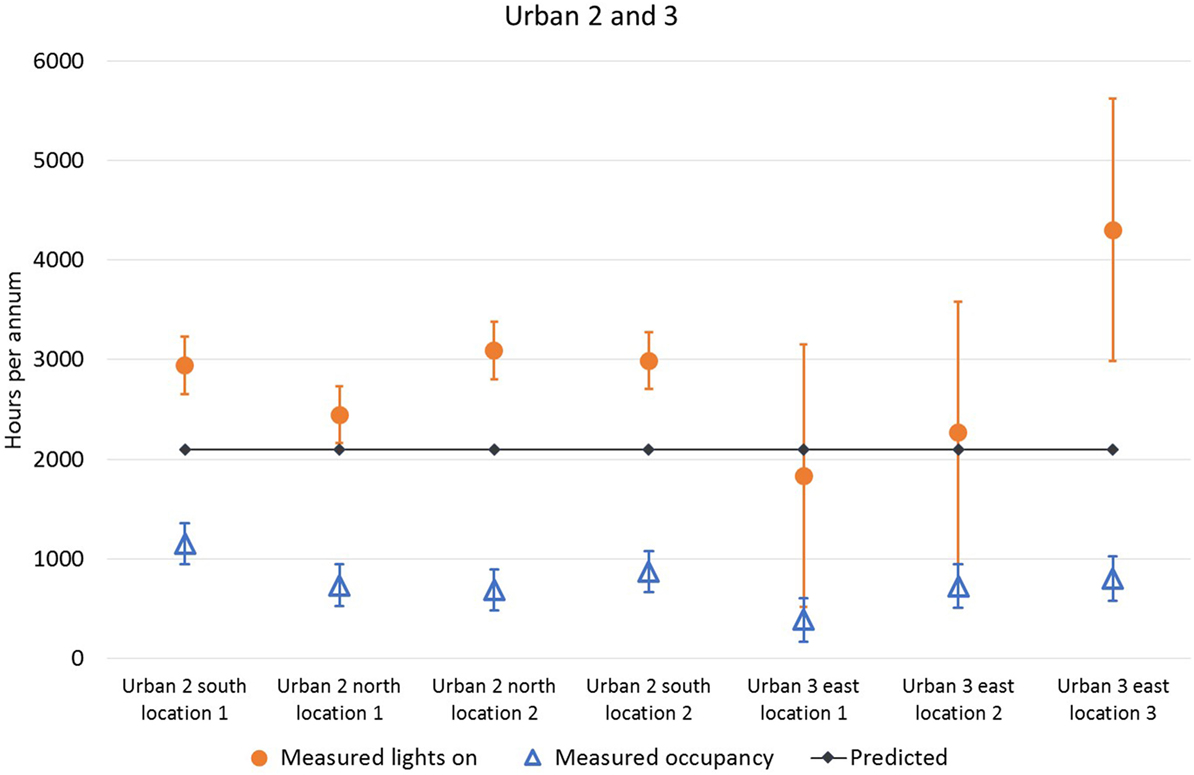
Figure 9. Predicted operational hours and measured hours per annum in the Urban building.
The lights on median annual value from the three Urban 3 corridor locations is 2,267 (h/annum) and SD 1,317 (h/annum), SD is indicated by the error bars shown in Figure 9. The high SD in Urban 3 lights on suggests the hypothesis of highly varied office hours kept by the academic staff on this floor. The occupancy is also shown in Figure 9, with an occupancy median value of 804 (h/annum) for the four corridor areas in Urban 2 and 725 (h/annum) for the three corridor areas in Urban 3, the respective SD are 207 (h/annum) and 220 (h/annum). The assumptions used in the calculations for estimating the operating hours of lighting after the retrofit were 2,100 (h/annum) for both Urban 2 and Urban 3. However, as envisaged the Urban 2 location had a higher footfall from students due to the classrooms on the second floor and was almost 800 h in addition to those predicted in the original calculations.
Investigating the patterns of lights on use (rather than occupancy) for both Urban 2 and Urban 3 on the different building floors, Figure 10 illustrates the very different patterns of lights on use between the second and third floors in the Urban building on Wednesday 6 May 2015. It should be noted that rather than continuing to show lights on and occupancy patterns together this figure instead illustrates only lights on data for comparing the two corridor locations. The Urban 3 corridor has lights on from 06:00 to 15:00 h; however, the lights remain on in the Urban 2 corridor at some level almost continuously throughout the night. In the Urban building 3, standalone vending machines are sited underneath one of the PIR sensors, it is proposed that this triggers the corridor lighting on out of hours in this location between 20:00 and 06:00.
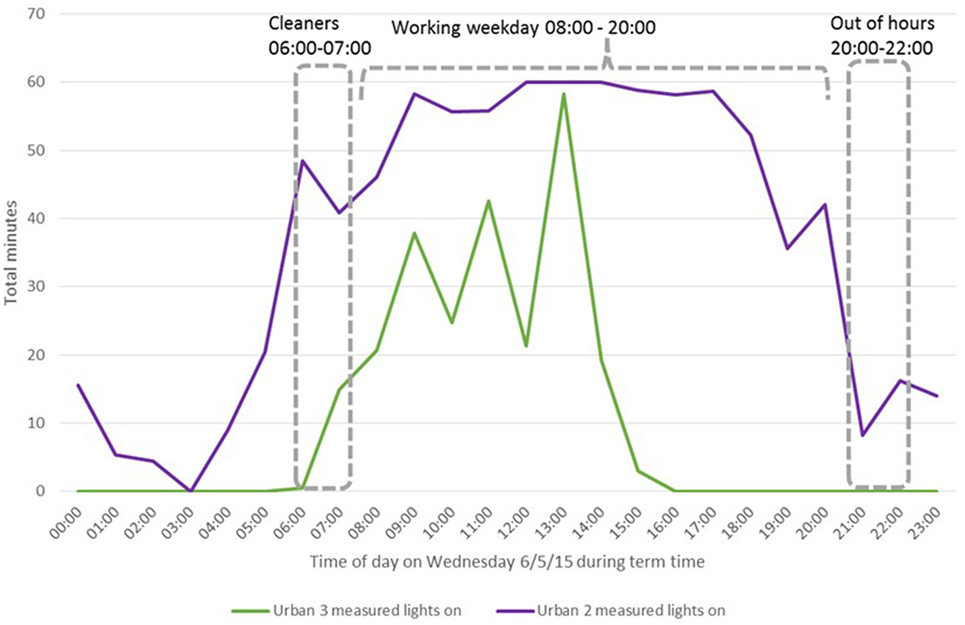
Figure 10. Typical term time weekday lights on for Urban 2 and Urban 3 corridor profiles.
CO2e Emissions and Electricity Consumption
The lighting upgrade in the Urban building in 2013 was part of the wider Carbon Management Plan and anticipated carbon dioxide savings of 51.2 tonnes of CO2 equivalent, Table 2.
The original estimates were based on estimated operational hours of 2,100 per annum for both floors, the calculation was split so that half of the annual hours were taken from the measurements from Urban 2 (second floor) and Urban 3 (third floor), the combined calculations for annual hours, electricity consumption, and CO2e emissions are shown in Figure 11. The measured values are 25% more than predicted, these findings are consistent with CarbonBuzz data for University buildings where increased electricity consumption is the norm (van Dronkelaar et al., 2016).
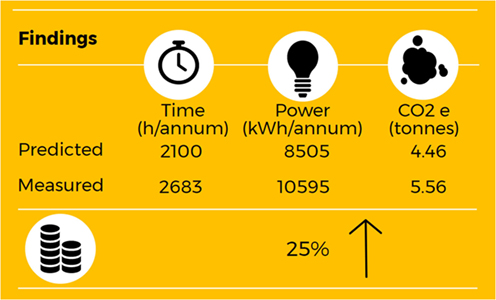
Figure 11. Urban 2 and Urban 3 CO2e and electricity consumption analysis.
Comparison across the Three Study Buildings
The predicted operational hours, measured lights on hours, and measured occupancy hours across all three buildings are plotted in Figure 12. What is striking about the values for annual hours in Figure 12 is the large variance between buildings in predicted operational hours. The heuristics, or rules of thumb, used by the external consultants in the predicted operational hours have a large variability and error compared with actual measured values. Overall, these results across all three buildings consistently show that operational hours ≠ occupancy hours ≠ lighting on hours. This finding needs to be tested on further lighting retrofit studies in other locations to verify if this is also seen in different building sectors or use types but the consistent pattern observed here suggests that, at the very least, estimates of operational hours based on indirect evidence of occupancy hours may not be reliable and should be viewed with caution.
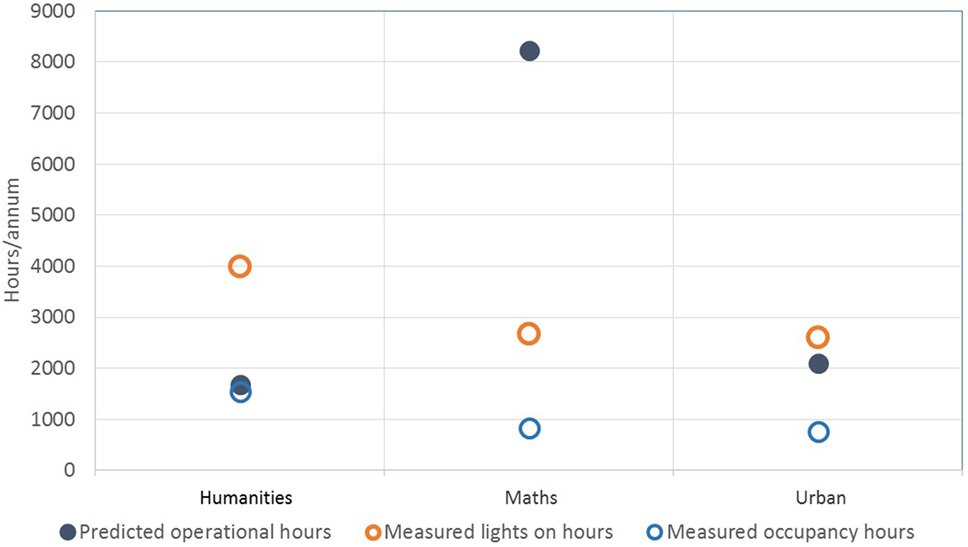
Figure 12. Annual hours of lighting and occupancy across three buildings.
For reporting the performance gap in percentage terms, following the convention of other performance gap researchers (Bordass et al., 2001; Menezes et al., 2012; van Dronkelaar et al., 2016), the final comparison of predictions vs. actual data are displayed in Figure 13.
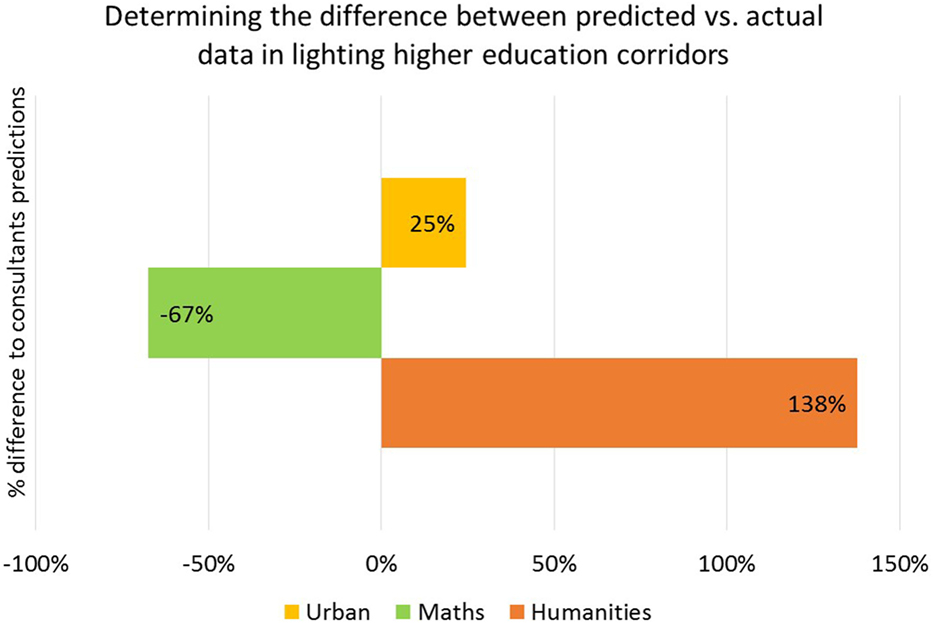
Figure 13. Determining the difference between predicted vs. actual data in lighting higher education corridors.
Discussion
Two key findings arise from this corridor lighting performance gap study. Firstly the input parameter for predicted operational hours ≠ occupancy hours ≠ lighting on hours: the terms are not analogous for measured lighting use across the three locations studied. Secondly in the context of lighting retrofits the lights on hours of use were found to be −67, 25, and 138% different from designers’ and external consultants’ predictions. The findings are comparable with CarbonBuzz data in higher education buildings (van Dronkelaar et al., 2016). The novel findings from this retrospective study are that further savings could be found in revisiting the lighting upgrade in the Humanities building as this upgrade was not carried out, the input parameters used in this project were grossly underestimating the annual lighting hours. For the two lighting retrofit projects that were completed in the Maths and Urban buildings, further savings can be accrued for Maths given this measured data and with iterative verification of commissioning the Urban building has the potential to narrow the gap between lights on hours and occupancy hours. The inputs used in the LENI calculations, Eq. 1, by the external consultants in these feasibility studies were based on assumptions and best guess estimates, this is congruent with other performance gap researchers who found that consultant’s thermal modelling input assumptions were highly variable (Imam et al., 2017). The operational hours can easily be replaced by actual data collected in practice. The use of widely available environmental loggers provided insightful and practical inputs to calculations that would otherwise be based on unknown assumptions.
Integrating these environmental loggers into common use enables Energy Managers and Project Managers in all sectors to collect field measurements rather than relying on assumptions. Using environmental loggers can provide an additional tool to support decision making in energy efficiency projects. The use of the HOBO™ loggers in lighting applications enables commissioning engineers to reduce the performance gap between the lights on hours of use and occupancy patterns. It is proposed that the closer the lights on hours are to the occupancy hours in these buildings, the greater the savings in annual electricity consumption and carbon dioxide emissions. This can be achieved through following stages 3–5 in the “Lighting Design Process” Figure 1 with regular re-commissioning and dramatically shortening the time delay to switch off.
Management Factor and Load Factor
An important element of the “Energy assessment and reporting method” (CIBSE, 2006) calculation comes from the management factor—this is the same as the load factor in the LENI calculation—which is not explored in-depth here as this was outside the scope of our study. This term is understandably ambiguous as each mechanical and electrical service will have different requirements in a building. In lighting terms, this encapsulates the additional complexity of commissioning, dimming, daylight, hold on time, contextual elements involving school schedule, types of occupant and operation, times of year, and overarching policies on energy management. The load factor in the LENI calculation is not benchmarked or validated by evidence and remains another ambiguous estimation for external consultants and designers, this is often used as a crucial coefficient for promoting the justification for automated controls over manual lighting controls. A further study building on this research is being carried out in corridor locations where manual controls are in operation to investigate the load factor coefficient.
Limitations
The HOBO™ loggers used in this study were agreed for installation with the Building Managers and Energy Manager as they could then be subsequently utilised for other applications. They were relatively low in cost and this justified using them in corridor areas where they were liable to tampering and even theft. The loggers are limited in their respective situations of deployment in so far as the occupancy hours are only in the direct vicinity of the logger so it is likely that the recorded occupancy hours underestimate the amount of time the corridors are occupied. It is for this reason that the actual lights on hours were used as part of the calculations for assessing the performance gap in corridor lighting. The occupancy does however give another separate opportunity to analyse the data for time of day analysis, this would provide insights for other mechanical and electrical systems, such as heating to determine the profiles in term time and out of term periods. The calculations for estimates relied on the assumption that the sensors would be more efficient at switching off the lights than a manual switch and routine operation by say the security staff member walking around at the end of the day. This provides an opportunity to assess what the hours of lights on use and occupancy are for manually operated corridor lighting which is part of a future study. Since the study was limited to 6 months of data (the loggers were redeployed to other locations), it was not possible to give a full year of data. The extrapolation of 6 months of data to a full year is also another aggregation that limits this study.
Conclusion
This paper aimed to measure and assess how automatic lighting controls in corridor areas performed in practice, in comparison with consultants estimates of energy savings. The lack of continuity in how the operational hours were originally conceived as the basis of these calculations shows how the TM22 method has still not permeated the consultancy sector which provided these calculations. This study provided original empirical evidence on lights on hours and occupancy hours in corridors which was previously unknown and found that neither of these are synonymous with operational hours. These results suggest that there is a valuable distinction between lighting on hours and occupancy hours, a parameter not captured in the current CIBSE TM22 “Energy assessment and reporting method.” The performance gap analysis determined the difference between predicted and actual measurements for lights on hours ranging from −67 to 138%. As the research into performance gaps has previously found the difference between design estimates and actual performance data can be up to 85% higher in University buildings (Menezes et al., 2011). There are still many unanswered questions about the load/management factor, used in the LENI calculation and CIBSE TM22, respectively. This can lead to conceivable variances in measured savings and would be suited to further in field studies with empirical evidence. The analysis of lighting on use and occupancy patterns undertaken here has extended our knowledge of including both out of hours occupancy and weekend working into corridor lighting use, yet none of these were taken into account in the predictions calculated by designers. Taken together, these findings support the use of environmental loggers and recommendations to use empirical evidence from field data in energy efficiency upgrade projects. There is abundant room for further progress in utilising small unobtrusive and relatively inexpensive environmental loggers across all building services which can be implemented prior to upgrade works or energy efficiency retrofits.
Ethics Statement
Ethical approval was sought from the University of Reading Research Ethics Committee and was given a favorable ethical opinion for conduct.
Author Contributions
KvS is a final year EngD doctoral student sponsored by EPSRC and the University of Reading Sustainability Team. The lead author designed, collected, analysed, and wrote the original research manuscript. CPB and LS are the lead author’s academic supervisors who provided detailed advice on the design, collection, and analysis of the studies. Both supervisors provided comprehensive editing and comments on all sections of the manuscript.
Conflict of Interest Statement
The lead author is an EngD doctoral student and the recipient of both EPSRC grant EP/G037787/1 and sponsored by the Sustainability Team in the Estates and Facilities Department at the University of Reading. All other authors declare that the research was conducted in the absence of any commercial or financial relationships that could be construed as a potential conflict of interest.
The reviewer MW and handling Editor declared their shared affiliation.
Acknowledgments
Thank you to my colleagues at Technologies of Sustainable Built Environment Centre and all of the past and present members of the Sustainability Team and Maintenance Team for your assistance.
Funding
Funded through EPSRC grant EP/G037787/1 and sponsored by the Sustainability Team in the Estates and Facilities Department at the University of Reading.
References
Ali, A. S., Zanzinger, Z., Debose, D., and Stephens, B. (2016). Open source building science sensors (OSBSS): a low-cost Arduino-based platform for long-term indoor environmental data collection. Build. Environ. 100, 114–126. doi:10.1016/j.buildenv.2016.02.010
Bordass, B., and Leaman, A. (2005). Making feedback and post-occupancy evaluation routine 3: case studies of the use of techniques in the feedback portfolio. Build. Res. Inform. 33, 361–375. doi:10.1080/09613210500162016
Bordass, B., Leaman, A., and Ruyssevelt, P. (2001). Assessing building performance in use 5: conclusions and implications. Build. Res. Inform. 29, 144–157. doi:10.1080/09613210010008054
Borgstein, E. H., Lamberts, R., and Hensen, J. L. M. (2016). Evaluating energy performance in non-domestic buildings: a review. Energy Build. 128, 734–755. doi:10.1016/j.enbuild.2016.07.018
Burman, E. (2015). Assessing the Operational Performance of Educational Buildings against Design Expectations—A Case Study Approach [EngD Thesis]. University College London. Available at: http://discovery.ucl.ac.uk/1482161/
Caple, R. (2016). Lighting and Part L of the Building Regulations. Available at: http://www.cibse.org/getmedia/486e0365-9b7c-4f4c-a998-53ad4bfc3ca5/160309-Part-L-of-the-Building-Regulations_2016.pdf.aspx
Carbon Trust. (2012). How to Use Retrofit Kits to Convert Fluorescent Light Fittings to T5 Fluorescent or LED Lamps. London: University of Reading.
CIBSE, RIBA, BRE. (2017). Carbon Buzz. Available at: http://www.carbonbuzz.org/index.jsp
Department of Energy and Climate Change. (2011). Greenhouse Gas Reporting—Conversion Factors 2011. London. Available at: https://www.gov.uk/government/publications/greenhouse-gas-reporting-conversion-factors-2011
Fouchal, F., Hassan, T. M., Firth, S., Dimitriou, V., Wei, S., Masior, J., et al. (2016). “Functional requirements and system architecture for decision support of energy efficient building design in retrofit and maintenance stage,” in CIB World Building Congress (WBC16): Advancing Products and Services, May 30th–June 3rd (Tampere, Finland: World Building Congress), 761–773. Available at: https://dspace.lboro.ac.uk/dspace-jspui/bitstream/2134/22451/1/WBC16%20-%20Paper%20Notification%203254793-%20Loughbororugh%20University_20160324%20updated.pdf
HM Government. (2010). The Building Regulations 2010 Conservation of Fuel and Electricity, Approved Document L2B. Available at: https://www.gov.uk/government/uploads/system/uploads/attachment_data/file/540329/BR_PDF_AD_L2B_2013_with_2016_amendments.pdf
Hodgson, N. (2011). Carbon Management Plan. Reading: University of Reading. Available at: https://www.reading.ac.uk/web/files/cleanandgreen/UoR_HE_Carbon_Management_Plan.pdf
Imam, S., Coley, D. A., and Walker, I. (2017). The building performance gap: are modellers literate? Build. Serv. Eng. Res. Technol. 38, 351–375. doi:10.1177/0143624416684641
Karbasi, H. M., Marsh, D., and Pitman, A. (2016). “Life cycle cost of mechanical and electrical services case study of a new build school,” in CIBSE Technical Symposium 2016 – “Integration for Whole Life Building Performance” (Edinburgh: CIBSE). Available at: http://www.cibse.org/getmedia/aaaaa938-e57d-4de7-b86d-53df09f25133/Mohammadpourkarbasi-slides2.pdf.aspx
Klein, G. (2007). Performing a project premortem. Harv. Bus. Rev. HBRreprints. Forethough Grist. 1–4.
Kracka, M., and Zavadskas, E. K. (2013). Panel building refurbishment elements effective selection by applying multiple-criteria methods. Int. J. Strateg. Prop. Manage. 17, 210–219. doi:10.3846/1648715X.2013.808283
Lawrence, R., and Keime, C. (2016). Bridging the gap between energy and comfort: post-occupancy evaluation of two higher-education buildings in Sheffield. Energy Build. 130, 651–666. doi:10.1016/j.enbuild.2016.09.001
Li, D. H. W., and Lam, J. C. (2003). An analysis of lighting energy savings and switching frequency for a daylit corridor under various indoor design illuminance levels. Appl. Energy 76, 363–378. doi:10.1016/S0306-2619(02)00121-6
Lighting Industry Association. (2014). UK Lighting Sector Strategy. Telford, Shropshire. Available at: http://luxreview.com/uploads/uklightingsectorstrategy.pdf
LightingEurope. (2017). Position Paper on the review of Directive 2010/31/EU on the energy performance of buildings. Brussels. Available at: http://www.lightingeurope.org/images/publications/position-papers/LightingEurope_-_Position_Paper_-_20170330_-_updated.pdf
Menezes, A. C., Cripps, A., Bouchlaghem, D., and Buswell, R. (2011). “Analysis of electricity consumption for lighting and small electricity in office buildings,” in CIBSE Technical Symposium, DeMontfort University, Leicester, UK, 6–7 September 2011 (Leicester). Available at: https://dspace.lboro.ac.uk/dspace-jspui/bitstream/2134/9433/6/110905-AnnaMenezes-AnalysisofElectricityConsumptionforLightingandSmallElectricity.pdf
Menezes, A. C., Cripps, A., Bouchlaghem, D., and Buswell, R. (2012). Predicted vs. actual energy performance of non-domestic buildings: using post-occupancy evaluation data to reduce the performance gap. Appl. Energy 97, 355–364. doi:10.1016/j.apenergy.2011.11.075
Min, Z., Morgenstern, P., and Marjanovic-Halburd, L. (2016). Facilities management added value in closing the energy performance gap. Int. J. Sustain. Built Environ. 5, 197–209. doi:10.1016/j.ijsbe.2016.06.004
Popoola, O., Munda, J., Mpanda, A., and Popoola, A. P. I. (2015). Comparative analysis and assessment of ANFIS-based domestic lighting profile modelling. Energy Build. 107, 294–306. doi:10.1016/j.enbuild.2015.08.028
Sustainability Team University of Reading. (2017). How Did We Achieve Our 35% Carbon Reduction Target? Available at: http://blogs.reading.ac.uk/clean-and-green/2017/02/08/how-did-we-achieve-out-35-carbon-reduction-target/
Tetlow, R. M., Beaman, C. P., Elmualim, A. A., and Couling, K. (2014). Simple prompts reduce inadvertent energy consumption from lighting in office buildings. Build. Environ. 81, 234–242. doi:10.1016/j.buildenv.2014.07.003
The Society of Light and Lighting. (2016). Lighting Guide 14: Control of Electric Lighting. Suffolk, UK.
van Dronkelaar, C., Dowson, M., Burman, E., Spataru, C., and Mumovic, D. (2016). A review of the regulatory energy performance gap and its underlying causes in non-domestic buildings. Front. Mech. Eng. 1:1–14. doi:10.3389/fmech.2015.00017
Keywords: performance gap, lighting, corridors, higher education, decision making, carbon emissions, electricity consumption
Citation: van Someren KL, Beaman CP and Shao L (2017) Determining the Difference between Predicted vs. Actual Lighting Use in Higher Education Corridors. Front. Mech. Eng. 3:11. doi: 10.3389/fmech.2017.00011
Received: 18 May 2017; Accepted: 27 September 2017;
Published: 02 November 2017
Edited by:
Lin Lu, Hong Kong Polytechnic University, Hong KongReviewed by:
Minchen Wei, Hong Kong Polytechnic University, Hong KongXiaofeng Guo, ESIEE Paris, France
Copyright: © 2017 van Someren, Beaman and Shao. This is an open-access article distributed under the terms of the Creative Commons Attribution License (CC BY). The use, distribution or reproduction in other forums is permitted, provided the original author(s) or licensor are credited and that the original publication in this journal is cited, in accordance with accepted academic practice. No use, distribution or reproduction is permitted which does not comply with these terms.
*Correspondence: Katharine L. van Someren, katharinevansomeren@gmail.com