Low-Temperature Combustion of High Octane Fuels in a Gasoline Compression Ignition Engine
 Khanh Duc Cung
 Stephen Anthony Ciatti
 Slavey Tanov
 Öivind Andersson
- 1Energy Systems Division, Argonne National Laboratory, Argonne, IL, United States
- 2Lund University, Lund, Sweden
Gasoline compression ignition (GCI) has been shown as one of the advanced combustion concepts that could potentially provide a pathway to achieve cleaner and more efficient combustion engines. Fuel and air in GCI are not fully premixed compared to homogeneous charge compression ignition (HCCI), which is a completely kinetic-controlled combustion system. Therefore, the combustion phasing can be controlled by the time of injection, usually postinjection in a multiple-injection scheme, to mitigate combustion noise. Gasoline usually has longer ignition delay than diesel. The autoignition quality of gasoline can be indicated by research octane number (RON). Fuels with high octane tend to have more resistance to autoignition, hence more time for fuel-air mixing. In this study, three fuels, namely, aromatic, alkylate, and E30, with similar RON value of 98 but different hydrocarbon compositions were tested in a multicylinder engine under GCI combustion mode. Considerations of exhaust gas recirculating (EGR), start of injection, and boost were investigated to study the sensitivity of dilution, local stratification, and reactivity of the charge, respectively, for each fuel. Combustion phasing (location of 50% of fuel mass burned) was kept constant during the experiments. This provides similar thermodynamic conditions to study the effect of fuels on emissions. Emission characteristics at different levels of EGR and lambda were revealed for all fuels with E30 having the lowest filter smoke number and was also most sensitive to the change in dilution. Reasonably low combustion noise (<90 dB) and stable combustion (coefficient of variance of indicated mean effective pressure <3%) were maintained during the experiments. The second part of this article contains visualization of the combustion process obtained from endoscope imaging for each fuel at selected conditions. Soot radiation signal from GCI combustion were strong during late injection and also more intense at low EGR conditions. Soot/temperature profiles indicated only the high-temperature combustion period, while cylinder pressure-based heat release rate showed a two-stage combustion phenomenon.
Nomenclature
Introduction
Compression ignition (CI) engines with conventional diesel combustion (CDC) have been known to have high efficiency, but they also produce significant amounts of soot and emissions that are harmful to human health and the environment. Soot is known to form mostly at fuel-rich condition, with equivalence ratio ~ 4 or higher (Glassman, 1989), while the formation of NOx is promoted at high combustion temperature ~2,700 K (Akihama et al., 2001, Fujimoto et al., 2002). Increasingly stringent emission standards for low emission of soot and NOX demand newly advanced engine combustion (AEC) concepts such as homogeneous charge compression ignition (HCCI) (Onishi et al., 1979; Najt and Foster, 1983; Epping et al., 2002; Dec et al., 2011), partially premixed combustion (PPC) (Noehre et al., 2006), gasoline compression ignition (GCI) (Kalghatgi et al., 2006; Manente et al., 2009; Kalghatgi et al., 2010; Sellnau et al., 2012; Ciatti et al., 2013), and reactivity controlled compression ignition (Kokjohn et al., 2011). Simply speaking, these AEC concepts have a similar goal of utilizing the fuel stratification and the reactivity of the charge (fuel and air) through various approaches such as injection strategy, dilution, or fuel reactivity that can accomplish desirable combustion and emission performance. In this article, we only investigate on GCI approach (also similar to PPC). Conceptually, GCI, known to be a PPC concept, is somewhat in between HCCI and CI which are fully premixed and fully stratified combustion, respectively. GCI experiments (Kalghatgi et al., 2010; Manente et al., 2012; Sellnau et al., 2012; Ciatti et al., 2013) showed a great flexibility in controlling the combustion process including the time of ignition and combustion phasing. This was achieved through multiple-injection strategy, which has a portion of the fuel “premixed” with air from early injections. This leads to lower emission of soot since fuel and air are sufficiently mixed. Early autoignition from premixed combustion can be delayed with dilution of exhaust gas recirculating (EGR). Moreover, the application of multiple-injection strategy has shown that start of ignition or combustion can be controlled by postinjection timing.
Application of low-temperature combustion (LTC) concept has since been explored extensively to reduce in-cylinder emission of NOx and soot (Hasegawa and Yanagihara, 2003). The LTC strategy can be illustrated on a temperature (T) and equivalence ratio (ϕ) map. These factors (T and ϕ) strongly affect the combustion and emission processes. Figure 1 shows ϕ-T plot from a closed-reactor (CR) simulation for the reaction of gasoline surrogate with air. The gasoline surrogate is a primary reference fuel (PRF) mixtures of n-heptane/isooctane/toluene with respective volume ratio of 19.4/42.2/38.3 (Cai and Pitsch, 2015). The mechanism includes 338 species and 2,791 reactions. The simulation was performed at constant pressure (60 bar) and constant predefined initial temperature. Concentration of species was then acquired after 2.0 ms (residence time) reaction time, which is considered as a reasonable timescale for CI combustion (Fujimoto et al., 2002). Although CR simulation is lack of the representation of an actual reacting spray with fuel-air mixing interaction, and the continuously changing in-cylinder temperature, pressure, and charge composition, it provides general insights on the combustion and emission processes at a given mixture composition and initial conditions of temperature and pressure. CR simulation is capable of performing with very extensive detailed chemical kinetic mechanisms, which is most desirable, but usually not viable for computational fluid dynamics (CFD) simulation due to the limitation in computational resources (Cung et al., 2013). Yield value or emission index (Turns, 2000), which is the mass ratio of species to fuel at a given ϕ, was used to indicate emission of all species on the ϕ-T plot, except NO (given in ppm). Overlaid on the ϕ-T plot are the adiabatic temperature calculated for the reaction of the current PRF and air (21% O2 + 79% N2 vol.) at a given equivalence ratio and ambient gas temperature for no EGR and 30% EGR cases. Initial fuel temperature was 500 K.
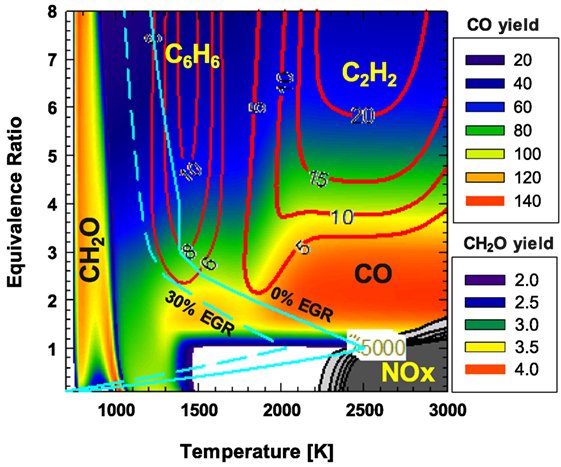
Figure 1. Emission of soot precursors including acetylene (C2H2), benzene (C6H6) in contour lines (soot yield), and other emission species (CH2O, CO) in color maps from homogeneous closed-reactor model (60 bar, 2.0 ms residence time) of TPRF gasoline surrogate and air (21% O2). Unit of NO is in ppm.
As shown in Figure 1, soot precursor of C6H6 and C2H2 are located mostly in low-temperature and fuel-rich condition, while high concentration of NOX appears at high-temperature and near stoichiometric condition (ϕ = 1). These soot precursors are the most important species in the soot mechanism regardless of fuels with: C2H2 as a major contributor in the hydrogen abstraction and acetylene addition (HACA) scheme; and C6H6 as the simplest polycyclic aromatic hydrocarbon (PAH) toward pyrene (C16H10) through ring–ring condensation (Frenklach and Warnatz, 1987; Richter et al., 1999; Glassman et al., 2014). Following these PAH growth steps and beyond, soot particles are formed physically and chemically through nucleation, coagulation, and surface reactions (Fujimoto et al., 2002). C2H2 covers a wide range of temperature (1,800–3000 K), while C6H6 remains in region of temperature below 1,700 K. It was also interesting to see the separation of these two islands of C2H2 and C6H6. Other studies (Fujimoto et al., 2002, Cung et al., 2013) showed that there are more overlapping regions of C6H6 and C2H2 for other fuels including diesel surrogate (n-heptane), dimethyl ether, and jet surrogate (JP-8). Law (Chung, 2006) suggested that the ratio of C2H2 and C6H6 may determine which mechanism pathway (HACA or aromatic condensation) forms soot particles. This suggests that soot formation of gasoline, especially under GCI condition, may have a different chemical pathway. Emission of CO is seen in two typical regions: low temperature and lean mixture or a wide range of high temperature but fuel rich. This is expected as high CO is usually resulted from either low combustion temperature for the oxidation of CO to CO2 or insufficient O2 (high ϕ) to complete the conversion (Dec, 2009). Unburned hydrocarbon (UHC; not shown in figure) also has a similar behavior as seen in the study by Kim et al. (2008) with high concentration at either too lean (overmixed) or too rich (undermixed) conditions, especially at low temperature. The formation of formaldehyde (CH2O) shown in Figure 1 appears at low-temperature region (<1,000 K), but at a very wide range of ϕ. As an intermediate species, CH2O has been known to formed at a very initial stage ignition reaction (prior to premixed combustion) and is usually seen in upstream region of CI combustion and consumed downstream of the flame lift-off length (Idicheria and Pickett, 2006; Skeen et al., 2015; Cung et al., 2016). With some amount of low-temperature reaction during premixed combustion in GCI, it is expected a high concentration of CH2O prior to high-temperature diffusion flame. More interestingly, there appears a narrow region (temperature of 1,500–2,200 K, and ϕ below 1.0) with low level of both soot precursors, CO, NOx, and UHC. Theoretically, this seems to be an ideal T-ϕ condition to “trigger” the combustion. In fact, many CFD simulations (Sellnau et al., 2014; Kodavasal et al., 2015; Dempsey et al., 2016) captured the distribution of fuel stratification from an actual in-cylinder spray on T-ϕ map to develop an optimal injection strategy and other conditions of boost and ambient composition that can lead to the combustion event occurring in this narrow region. As EGR increased from 0 to 30%, only region of high NOx emissions was further avoided, but temperature profile shifts away from the C6H6 region. The formation of NOX is known to be highly thermal dependence. Meanwhile, low combustion temperature has been also shown to be able to suppress soot formation even at higher local equivalence ratio. This is also known as smokeless rich diesel combustion at very high EGR level (Akihama et al., 2001). However, dilution effect of EGR itself can also affect soot formation of precursor. Higher EGR can lead to longer presence time of soot precursor, promoting time required for soot oxidation. Study using lifted flame model (Pickett et al., 2006) actually showed that peak of pyrene increases, reaches maximum, but then decreases as oxygen concentration continue to increase, while residence time of pyrene increases at higher EGR level. In an actual reacting spray (i.e., CDC, GCI), high EGR can delay the autoignition event and provide even longer time for fuel–air mixing, hence leading to leaner combustion.
As mentioned above, beside EGR, multiple-injection strategy can also offer a pathway for obtaining LTC condition (lean combustion) by splitting the amount of all injected fuel into smaller quantities that are introduced at different timings or crank angle (CA) before top dead center (TDC). This approach helps avoiding the locally undermixed fuel-rich pockets that promote high soot formation inside the combustion chamber. Some studies (Musculus et al., 2013, Dempsey et al., 2016) have summarized the benefits of using multiple injections to reduce both emission of NOx and soot for both CDC and GCI operating conditions. Moreover, postinjection can also reduce UHC emissions by enriching and burning the mixture of the near-nozzle regions, which usually happen to be overly leaned after the end of the injection (Musculus et al., 2007). Particularly for GCI, it was demonstrated in the study by Dempsey et al. (2016) the importance of fuel stratification levels designed by different multiple-injection strategies on the emission (NOx/HC/CO and smoke) and engine performance (i.e., noise, combustion stability, peak cylinder pressure). Injecting a large amount of fuel early can reduce soot significantly, but also leads to high level of combustion noise (CN) from premixed burn. On the other hand, late injection results in the undermixing of fuel and air and therefore could result in higher soot unless a massive EGR (>50%) is used to delay the combustion (Manente et al., 2010) or CDC-relevant high injection pressure for better mixing. It was shown that moderate fuel stratification (MFS), compared to partial fuel stratification and heavy fuel stratification (HFS), can provide a compromise for both considerations of CN and smoke. More importantly, similar to HFS, MFS is an injection-driven concept, which means the combustion phasing can be dictated by the timing of last injection, usually near TDC.
The combustion and emission are also linked strongly with the autoignition characteristics of the fuel. Autoignition quality of gasoline and diesel are measured by the research octane number (RON) and motor octane number (MON). Gasoline-like fuels with high RON has more resistance to autoignition or knock and, therefore, is considered as an ideal fuel for GCI (Kalghatgi et al., 2006; Kalghatgi et al., 2007; Kalghatgi et al., 2010). A long ignition delay means more time available for better mixing of air and fuel; therefore, soot level can be reduced consequently. Gasoline is also highly volatile, which is desirable for avoiding wall-wetting even when injected very early. The RON and MON values are obtained empirically from cooperative fuel research engine at conditions of 600 rpm, Tintake = 52°C (ASTM D2699) and 900 rpm, Tintake = 149°C (ASTM2770), respectively. Because the conditions for determining RON and MON are very different in engine speed and Tintake, it provides a better way to compare the autoignition quality of different fuels with different properties and behavior under actual engine operation. The difference between RON and MON is called sensitivity (S) with S = RON-MON. Fuels with low S value typically exhibit a two-stage ignition behavior while single-stage ignition behavior is seen for fuels with high S values (Kalghatgi, 2014a,b). In addition, chemical composition of the fuel also plays key role in determining the emission signature. For example, fuel with higher aromatic content tend to produce high content of soot but better antiknock quality (Kalghatgi, 2014a,b).
In this study, we explored the characteristic of GCI combustion for three gasoline fuels with different chemical composition but similar RON. Different conditions of EGR and λ were chosen to study their effects on the combustion and emission of the fuels. Multiple-injection strategy was used with the combustion phasing being controlled by the start of injection (SOI) of last injection. Moreover, combustion luminosity was obtained by endoscope imaging through a small optical access into the engine combustion chamber. The results from this diagnostic provided additional insights on the in-cylinder soot formation process. The overall objective of this work is to examine the aspect of GCI operation under various conditions of fuel composition, ambient composition, and fuel stratification level and therefore provide a better understanding of the combustion and emission characteristics of GCI accordingly.
Experimental Setup
Engine Setup
The test engine used in this study is a production Euro IV General Motors (GM) 1.9 l four-cylinder light-duty diesel engine. The engine was mounted to an alternating current (AC) dynamometer on a fully instrumented test bed. The dynamometer is rated up to 678 N-m and 8,040 rpm operating speed. The engine has an aftermarket Eaton VT400 supercharger (S/C) mounted prior to the intake manifold. The engine is also equipped with a standard built-in variable geometry turbine turbocharger (T/C). However, intake pressure was only controlled by S/C to ensure stable pressure condition in this study. More details of engine specification are listed in Table 1. An air heater was used to maintain a constant intake air temperature of 55°C for all tested runs.
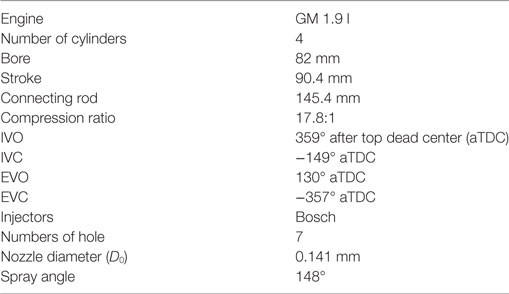
Table 1. Engine specification.
The test cell controller (INERTIA) by Wineman Technology (WTi) was used to control and monitor a number of relevant instruments such as the exhaust gas emissions measurement bench, smoke meter, and 300-HP AC dynamometer. A closed-loop controller was used to monitor the engine coolant and intake air temperature with the air mass flow being measured by a laminar flow element. In-cylinder pressure was measured by AVL GH14P piezoelectric transducers, while the relative CA was determined through an AVL crank shaft encoder with resolution of 0.2° CA. The heat release rate (HRR) is calculated with an energy balance where Woschni’s model (Woschni, 1967) was used to take into account the heat transfer that occurs during the engine cycle.
Fuel delivery consists of a Bosch common-rail diesel injection system with a belt-driven CP1H injection pump, which is capable of providing a maximum pressure of 1,600 bar. The fuel is delivered by a separate cart system (Re-Sol), which also outputs the fuel mass flow rate via a coriolis flow meter. To protect the high-pressure fuel pump and the injectors, a small amount (300 ml) of lubricity additive (Infinium R655) was added to each drum of fuels (~55 gallon per drum). The Drivven engine control unit (ECU) enabled full authority control over relevant engine control parameters via a LabVIEW interface, as well as provided analysis using Combustion Analysis Software through a high-speed data acquisition system. Each injector was controlled independently through Drivven interface to achieve similar engine load and heat release profile in all four cylinders.
Raw exhaust emission gases were measured using emission gas analyzer Pierburg AVL AMA i60 for concentrations of CO, CO2, NOX, O2, THC, and CH4. Exhaust sampling line was heated at 180°C from the engine to the gas analyzer to prevent any condensation of emission gases. EGR was calculated by the concentration ratio of intake CO2 to exhaust CO2. λ was derived from Brettschneider’s equation (Brettschneider, 1979) by considering the measured concentrations of CO, CO2, HC, and O2 from the emission bench. The exhaust gases were also passed through a AVL 415 s smoke meter for measuring the amount of particulate given by filter smoke number (FSN) value. Calculation of FSN was based on the opacity of soot measurement on the filter paper.
Fuel Property
Three fuels with similar RON value of 98 were tested in this study. Table 2 lists important fuel properties that were obtained from analysis done by Southwest Research Institute including detailed hydrocarbon analysis. These fuels, named by their composition characteristics, “aromatic,” “Alkylate,” and “E30,” are the among fuels that are currently investigated in a broad department of energy research program known as Co-optimization of fuels and engines (Co-Optima) (DOE, 2016). The average molecular formulas are C6.82H12.3 (aromatic), C7.74H17.53 (Alkylate), and C4.44H9.75O0.49 (E30). Both aromatic and E30 fuels show a similar distillation profile, while alkylate has a narrower boiling range with T90 of 113°C. The LHV of E30 is less than 90% of that of aromatic or alkylate. Suggested by Chupka et al. (2015), the heat of vaporization (HoV) of aromatic and alkylate are approximately 350 kJ/kg, which is similar to regular petroleum gasoline. With addition of ethanol, HoV of E30 (highest among fuels) is estimated with nominal value of 550 kJ/kg. Recently, extended study (Burke et al., 2017) showed that increase in ethanol concentration in gasoline-like fuels delayed the autoignition by suppressing the distillation of aromatic and isoparaffinic species. The effect of HoV on the combustion and emission is currently being studied extensively by the same research group (Burke et al., 2017).
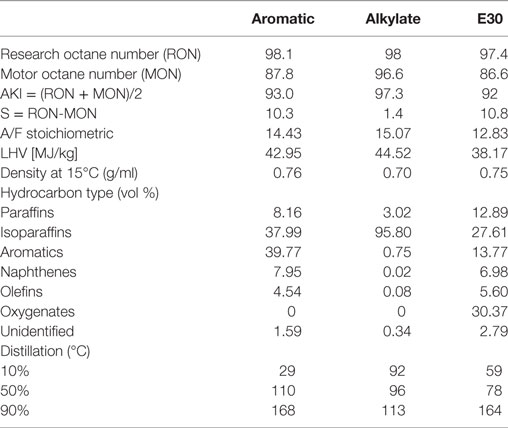
Table 2. Fuel properties.
Testing Approach and Condition
Summary of tested conditions is listed in Table 3. Engine speed was kept constant at 1,000 rpm. EGR was varied from 0% to maximum achievable level while maintaining stable combustion. Fuel split ratio was approximately 50/50, which was determined by the durations of injector current. This ratio was slightly adjusted (± 5% for pilot/main injection) to complete all test conditions of different EGR and lambda while keeping CN level and combustion stability within their limits. The combustion phasing (CA50) was fixed constant during the EGR sweep by adjusting the SOI of second injection (SOI2) or intake boost pressure. Both SOI2 and boost were demonstrated to control CA50 effectively during the experiment. It was suggested to keep CA50 constant, so that the effect of SOI or boost on the autoignition and earlier combustion stage can be studied. Matching CA50 approach also indicates a combustion process with a reasonably similar thermodynamic condition (Cheng et al., 2006, Armas et al., 2010). Therefore, it can provide a controlled condition to study the effect of chemical and physical properties of different fuels on exhaust emission. Finally, maintaining a constant CA50 at ~5° after top dead center (aTDC) helps keeping a reasonably low CN (<90 dB). Lambda was also controlled to be relatively constant during each sweep. Because the global fuel–air mixture was the same, the effect of fuel stratification or other factors (i.e., boost) can be investigated more independently on the ignition and combustion. Also, different global lambda of 1.6 (richest), 1.8 (baseline condition), and 2.0 (leanest) were selected. SOI of first injection (namely, SOI1) was fixed at −50° aTDC. The indicated mean effective pressure (IMEP) range covered in this study was between 5 and 10 bar. For simplicity, the reported SOI timings of both injections were obtained from the input in the ECU command, rather than the measured injector current. Data were taken during steady-state condition with coefficient of variance of IMEP below 3%. Cylinder pressure of 200 cycles was collected and used for data analysis.
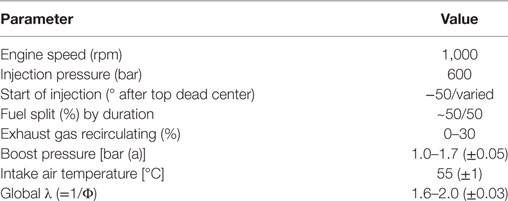
Table 3. Summary of test conditions.
Endoscope Imaging Configuration
Modification was done for one of the cylinder heads to provide an optical access into the combustion chamber. This allowed insertion of an endoscope system that can capture the field-of-view of the area near the injector tip where most of the strong combustion luminosity were present. Endoscope system required a very small area to have optical access into the interior of the cylinder, hence had a minimal impact on the interior combustion system. The system is capable of withstanding a wide range of operating engine conditions (i.e., low to high load). As shown in Figure 2, the endoscope system consists of a charge coupled device camera (PCO Pixelfly), an air cooling system for the endoscope, and the 30° rigid industrial endoscope. The camera was connected to an AVL Visioscope™ optical system with a frame rate of 10 Hz and an exposure time of 5 µs. Images (640 × 480 pixel, 12-bit resolution) were processed by AVL’s Thermo Vision™ software to give postprocessed soot and temperature distributions using two-color optical pyrometry method (Zhao and Ladommatos, 2001, Ciatti et al., 2002). More details of the endoscope system and measurement technique can be found in other studeis (ProductGuide, 2004, Ciatti et al., 2005).
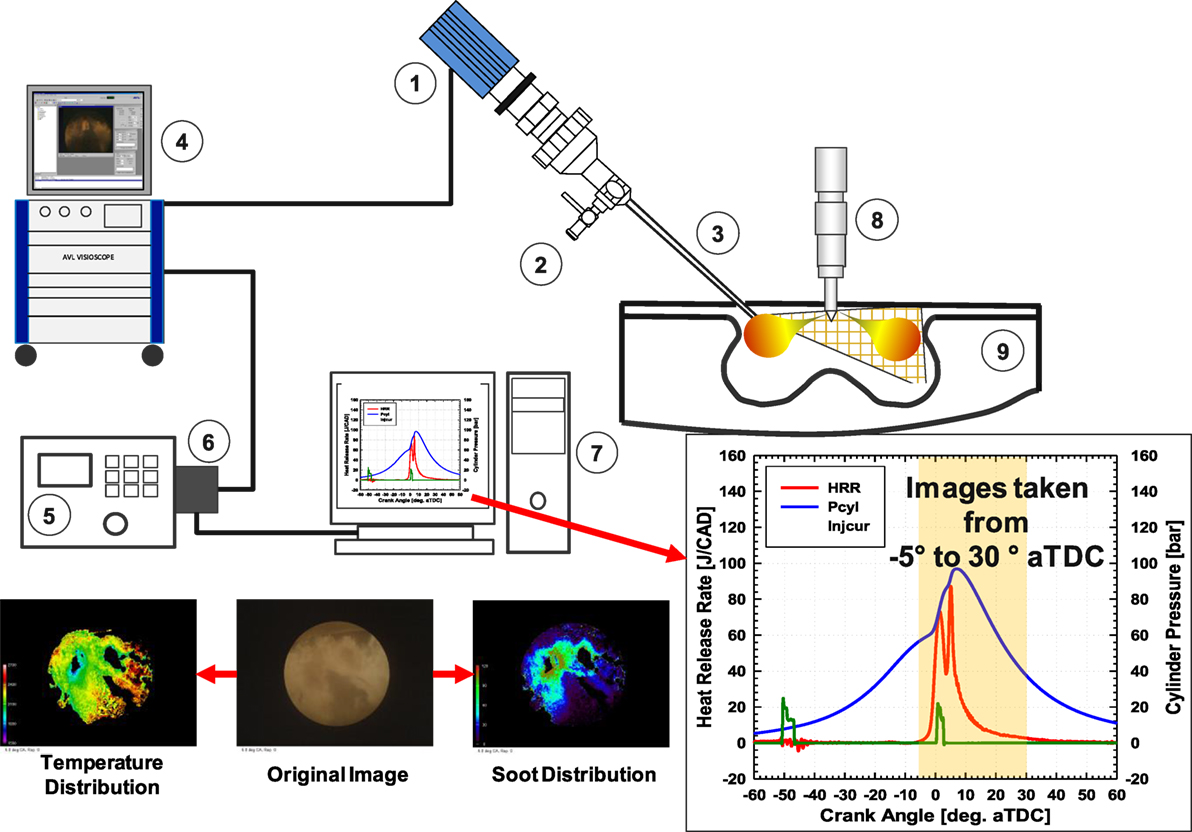
Figure 2. Endoscope setup: (1) charge coupled device camera; (2) air cooling port; (3) cylinder head and endoscope window; (4) AVL Visioscope system; (5) alternating current dynamometer; (6) encoder; (7) data acquisition system; (8) injector; (9) piston. Lower right, timing period [crank angle degree (CAD)] that endoscope images cover (−5° to 30° aTDC); lower left, original image (flame luminosity) and postprocessed images of soot and temperature distributions. aTDC, after top dead center.
The endoscope system allowed to record images by 0.5 crank angle degree (CAD) interval from −5° to 30° aTDC covering most of HRR profiles for all conditions as shown in lower right of Figure 2. Note that, the entire visualized combustion event was based on a collection of images from different cycles. This was due to the limitation of the camera’s frame rate. However, because good combustions stability was maintained, high repeatability was acquired for all cycles. Image distortion, also known as “fish-eye-view” or “spherical distortion” (Dierksheide et al., 2002), could be present through the lens system, image correction was not performed due to the lack of a light source for the initial alignment on the field of interest.
Results and Discussion
Effect of Postinjection at Baseline Condition
The testing approach of using SOI2 to control CA50 at a given EGR level was demonstrated in Figure 3 for baseline λ of 1.8. First, as EGR increased at fixed intake pressure, the oxygen concentration in the intake decreased. Therefore, the amount of fuel was reduced to keep the same A/F ratio. Mass fuel flow rate decreased almost linearly with the increment of EGR for both three fuels. E30 required higher fueling rate due to having the lowest (A/F)stoic ratio compared to other fuels as listed Table 2. In fact, the inverses of fueling rate (1/F), for three fuels at any given EGR have the same ratio with (A/F)stoic ratio: E30:aromatic:alkylate as 12.83:15.07:14.43. SOI2 was adjusted to keep CA50 constant at ~5° aTDC. In general, higher EGR retarded the combustion; hence, SOI2 was advanced. Here, combustion mixing time (CMT) is defined as the CA difference between CA50 and end of injection (EOI) of second injection. CMT increased as EGR increased. CMT of fuels did not change significantly within 10% EGR. For E30 and alkylate, the CMT varied within ±1 CAD with EGR increased up to 15%. As EGR increased above 15%, CMT of fuels increased exponentially. At 25% EGR, E30 had longest CMT of 5.8 CAD, while it was 3 and 3.4 CAD for aromatic and alkylate, respectively. E30 appeared to be the least reactive fuel, hence required most advanced timing of second injection to keep the same combustion phasing.
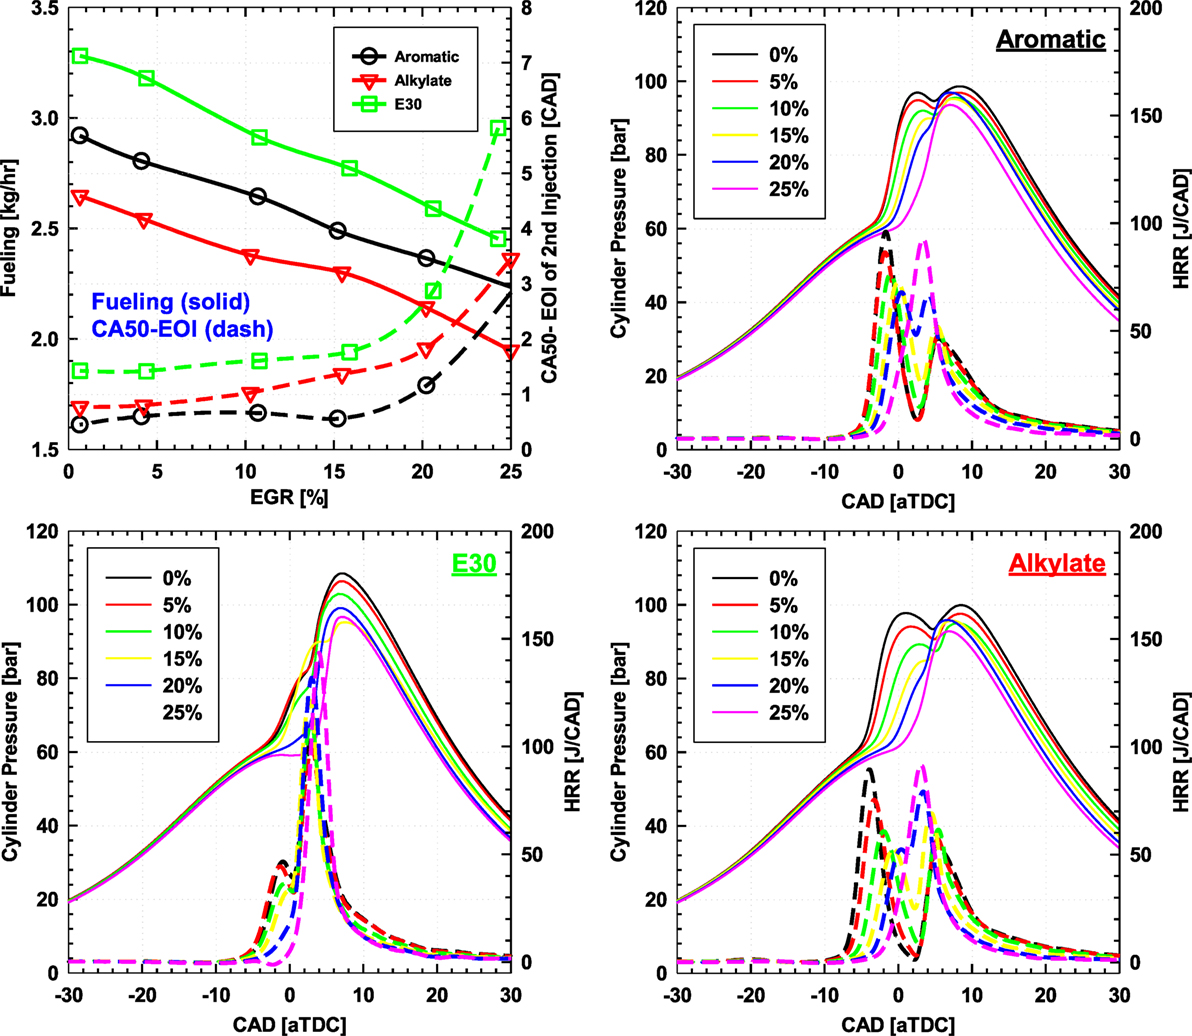
Figure 3. Exhaust gas recirculating (EGR) sweep (0–25%) results with start of injection adjustment of second injection for constant combustion phasing: fuel mass flow rate and combustion delay (top left) and cylinder pressure and heat release of each fuels (aromatic, alkylate, and E30).
Figure 3 also shows cylinder pressure and HRR for each fuel during EGR sweep. Both cylinder pressure and HRR indicate a distinctive two-stage combustion phenomenon for all three fuels, especially at low EGR condition. This phenomenon appears at condition of EGR below 20% for aromatic and alkylate and EGR below 10% for E30. At 25% EGR, all three fuels display a single-stage HRR profile with the peak of HRR at about 3° aTDC. It can be seen here that at low EGR levels (EGR < 15%), the first stage of HRR occurred even before second injection event. Therefore, it is reasonable to assume that this stage corresponds to the premixed combustion from first injection (SOI1 = −50° aTDC). As EGR increased, the premixed combustion of pilot injection was more suppressed (lower peak value) and eventually merged with the (more diffusion) combustion of the second injection. It was expected that some degree of mixing-controlled combustion may have occurred at low EGR (<15%) even though CMT was positive for all EGR condition meaning CA50 started after EOI of second injection. This was observed when the second HRR stage seemed to appear briefly after second injection. Peak HRR of E30 was about 30% higher than other fuels, especially at high EGR condition which combustion became more spontaneous with single-stage HRR situation. This might be caused by earlier statement on the suppression of aromatic and isoparaffinic contents in E30 gasoline fuel due to the addition of ethanol (Burke et al., 2017).
Emission of NOx/HC/CO and smoke (FSN) were shown with CN over EGR sweep in Figure 4. Highest NOx emission resulted from the combustion of E30 as expected with higher cylinder pressure and peak HRR than the combustion of other fuels. NOx was reduced by almost half with EGR increased from 0 to 30% for E30. Emission of NOx for aromatic and alkylate were similar and were also reduced at higher EGR. Both CO and HC emissions increased when EGR increased as more incomplete combustion was expected at high dilution condition. Particulate emission described by FSN values was lowest for E30 and highest for aromatic. As EGR increased, SOI2 was advanced giving longer mixing time; hence, FSN was reduced significantly below 0.1 at EGR of 25% for all fuels. Having the shortest CMT as seen in Figure 3, and containing high aromatic content, aromatic resulted in highest FSN by more than a factor of 2 than alkylate and 10 than E30. High oxygen content, long CMT, and high cylinder temperature provided the condition for oxidizing E30 fuel easily; hence, relatively low emission of smoke was seen through all EGRs. But while CN decreased as EGR increased for aromatic and alkylated, CN from E30 combustion increased. CN from combustion of E30 increased above 90 dB at 20% EGR. This was due to the very fast pressure rise. At 25% EGR, peak of the single-stage HRR from the combustion of E30 reached 140 J/CAD.
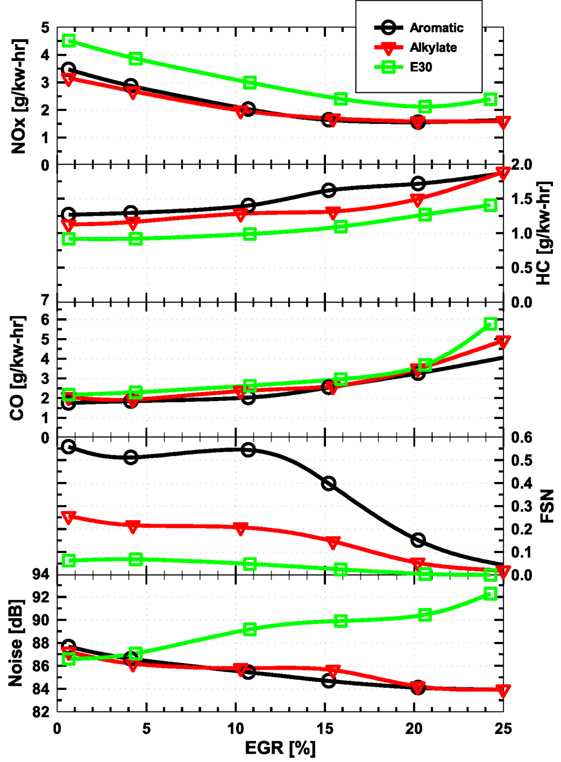
Figure 4. Exhaust gas recirculating (EGR) sweep (0–25%) results with start of injection adjustment of second injection for constant combustion phasing: emission of (NOx, HC, and CO); filter smoke number (FSN); and combustion noise.
Effect of Intake Pressure at Baseline Condition
The second approach beside adjusting SOI2 for controlling the combustion phasing was to vary the intake boost pressure. This was accomplished while keeping the same injection timing and split ratio of both first and second injections. Note that the SOI of second injection is ~2° aTDC for aromatic and alkylate, while it is −0.5° aTDC for E30. Global λ of 1.8 was fixed by managing both fueling and boost as demonstrated in Figure 5. Increasing boost helped maintaining the same global λ and CA50 simultaneously as EGR increased. Unlike previous experiment of adjustable SOI second injection, a distinctive two-stage combustion was seen for all EGR cases during adjustable intake pressure testing. It also appears that with fixed SOI2, the second stage of HRR remained relatively unchanged at any given EGR, and the combustion started almost immediately after SOI of second injection for all fuels. Hence, it is reasonable to expect the presence of some diffusion combustion type during the second injection. Meanwhile, with higher boost at high EGR, the first stage of HRR was advanced, hence separating the two stages more. This phenomenon was less distinguished with the cases of aromatic and alkylate, while more obvious with E30. This shows that premixed combustion of E30 from early injection was more sensitive to change in boost. Since the second injection started nearly after the end of the depletion of first stage HRR, it is fair to assume that each HRR stage was responsible for the corresponding each injection. The lower peak of the first stage HRR in E30 case could be due to (1) the lower LHV of E30 compared to other fuels (LHVE30 is approximately less than 89% than that of aromatic and alkylate); (2) pilot:main ratio was 50:50 for E30 and 54:46 for aromatic and alkylate. Or it could be the higher HoV and low reactivity of E30 resulted in “slower” combustion; hence, not all of the fuel was burned during the first stage, especially the ethanol content which might be contributed in the combustion of the second stage. This also explained high peak of second stage HRR in E30 case. Note that, it was only taken up to 20% EGR for E30 and alkylate because boost was already maximized by the operation of the supercharger at the current engine speed. Hence, it was not possible to maintain a constant CA50 at higher EGRs. Perhaps, an earlier SOI2 for alkylate and E30 could have extended the EGR range to test because boost can be reduced further to delay the combustion during EGR sweep.
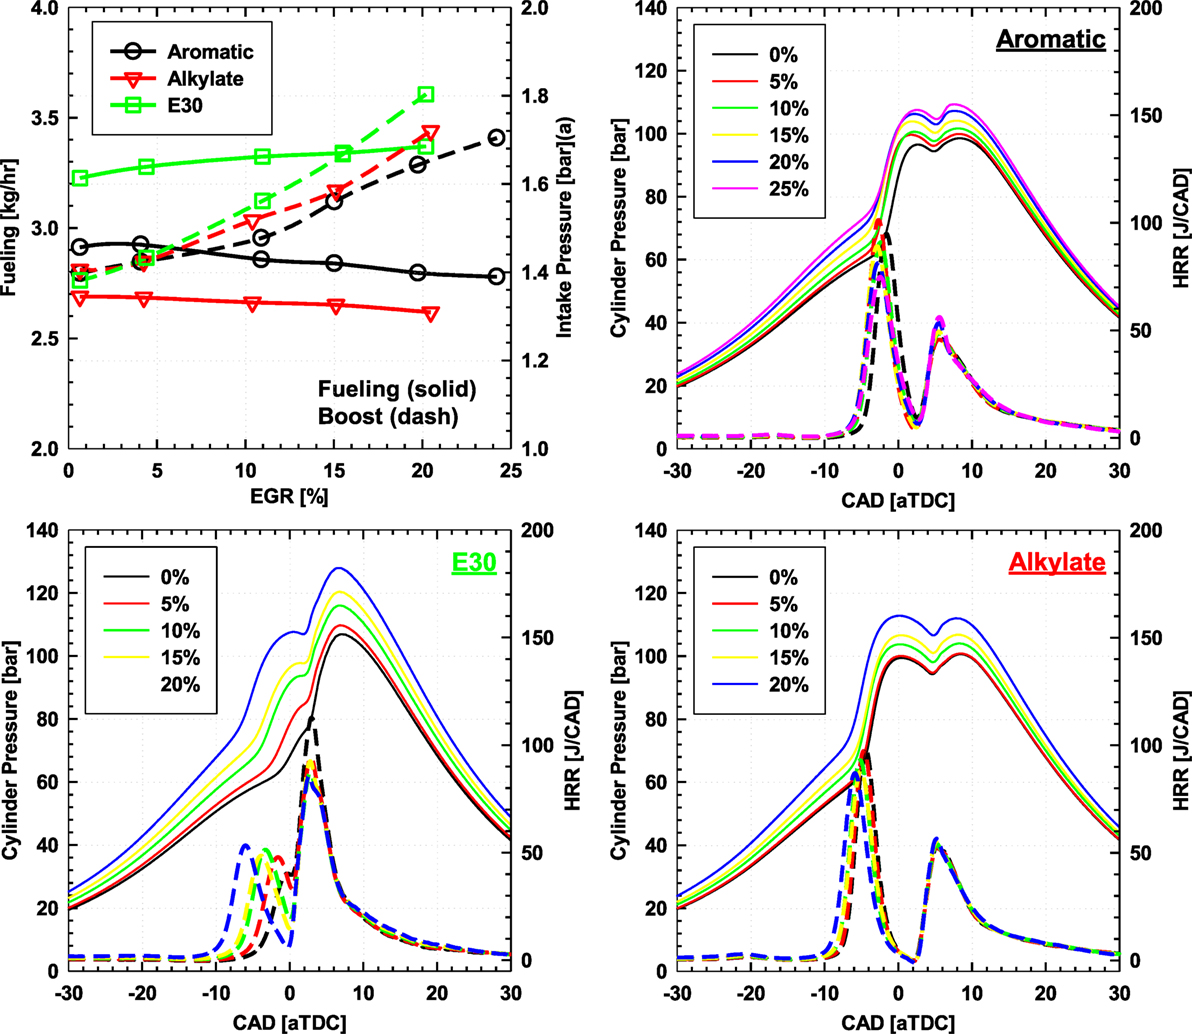
Figure 5. Exhaust gas recirculating (EGR) sweep (0–25%) results with intake pressure adjustment for constant combustion phasing: fuel mass flow rate and combustion delay (top left) and cylinder pressure and heat release of each fuels (aromatic, alkylate, and E30).
Emission and CN results from adjustable intake pressure experiment are shown in Figure 6. NOx emission reduced almost linearly with increase in EGR. As EGR was changed, HC emissions remained relatively unchanged, while CO emission increased. HC/CO emission was relatively low, which suggests high combustion efficiency was maintained for all fuels. Smoke emission was again lowest for E30 at all EGR levels. There is a slight increase in FSN from 0 to 15% EGR for alkylate and aromatic cases. This is expected with locally richer combustion as dilution level increases. However, FSN tends to stay about constant as EGR increased above 15%. This phenomenon was explained earlier in Section “Introduction” as high dilution level can actually increase time for soot oxidation, therefore suppressing the formation of soot precursors. Moreover, in this case, high boost was used as EGR increased to keep the same air:fuel ration. This further enhanced the soot oxidation process.
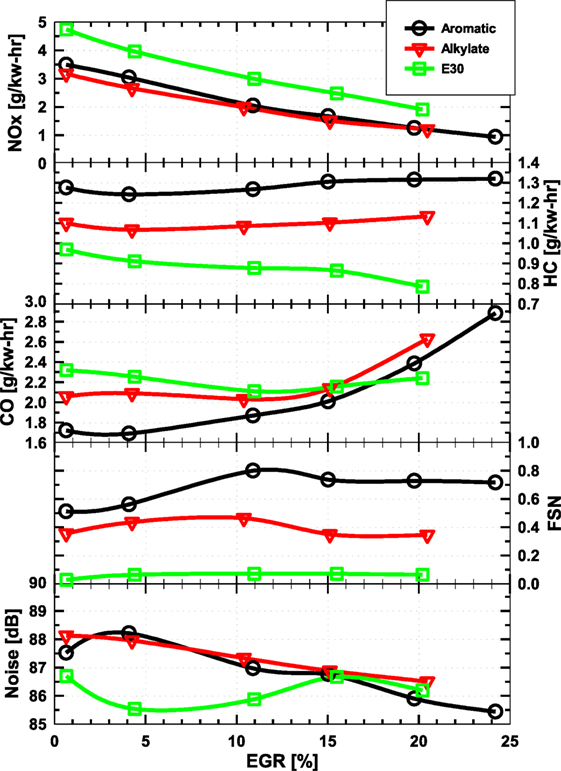
Figure 6. Exhaust gas recirculating (EGR) sweep (0–25%) results with intake pressure adjustment for constant combustion phasing: emission of (NOx, HC, and CO), filter smoke number (FSN), and combustion noise.
To consider the trend in CN with EGR, it is also helpful to look at the trends of HRR stages because fast HRR rise or high HRR peak could be an indicator for high CN. For example, as EGR increased, peak of second stage HRR was reduced for E30, while the second stage HRR stayed almost the same for aromatic and alkylate. In addition, EGR affected on the first stage HRR quite differently for each fuel. As EGR increased, the peak of first stage HRR for aromatic and alkylate became lower, while the combustion of first stage in E30 advanced. As explained previously, E30 was demonstrated to be sensitive to boost. Because boost affected both first and second stages of HRR in E30 combustion, CN showed some non-linear trend against EGR. Meanwhile, CN was consistently reduced at higher EGR for the other fuels.
Effect of Global Lambda and EGR
A new term, the peak ratio of the first to the second stage HRR (namely, “PHRR ratio”) is introduced to provide some insights on how strong (premixed) combustion from early injection compared to a more diffusion combustion from the late injection. PHRR ratio is calculated as below.
As seen previously in Figure 3, combustion mode turned into single-stage at high EGR level. Hence, PHRR ratio is expected to become unity eventually during EGR sweep. A high value of PHRR ratio indicates a stronger premixed combustion (early injection), while a lower value implies a more robust diffusion combustion from the late injection.
Three different global lambda (1.6, 1.8, and 2.0) were tested in EGR sweep using adjustable SOI of second injection approach. This approach was selected because there is a more distinctive separation of different HRR stages than what was seen from the adjustable boost pressure approach. Also, there was a limit on the maximum boost pressure provided by the supercharger at current engine speed (1,000 rpm) that can facilitate to maintain constant CA50 at high EGR and highly diluted conditions. Adjustable SOI of second injection approach showed the flexibility of adjusting combustion phasing by changing only the injection timing. The results of lambda-EGR sweep are summarized in Figure 7 for all three fuels.
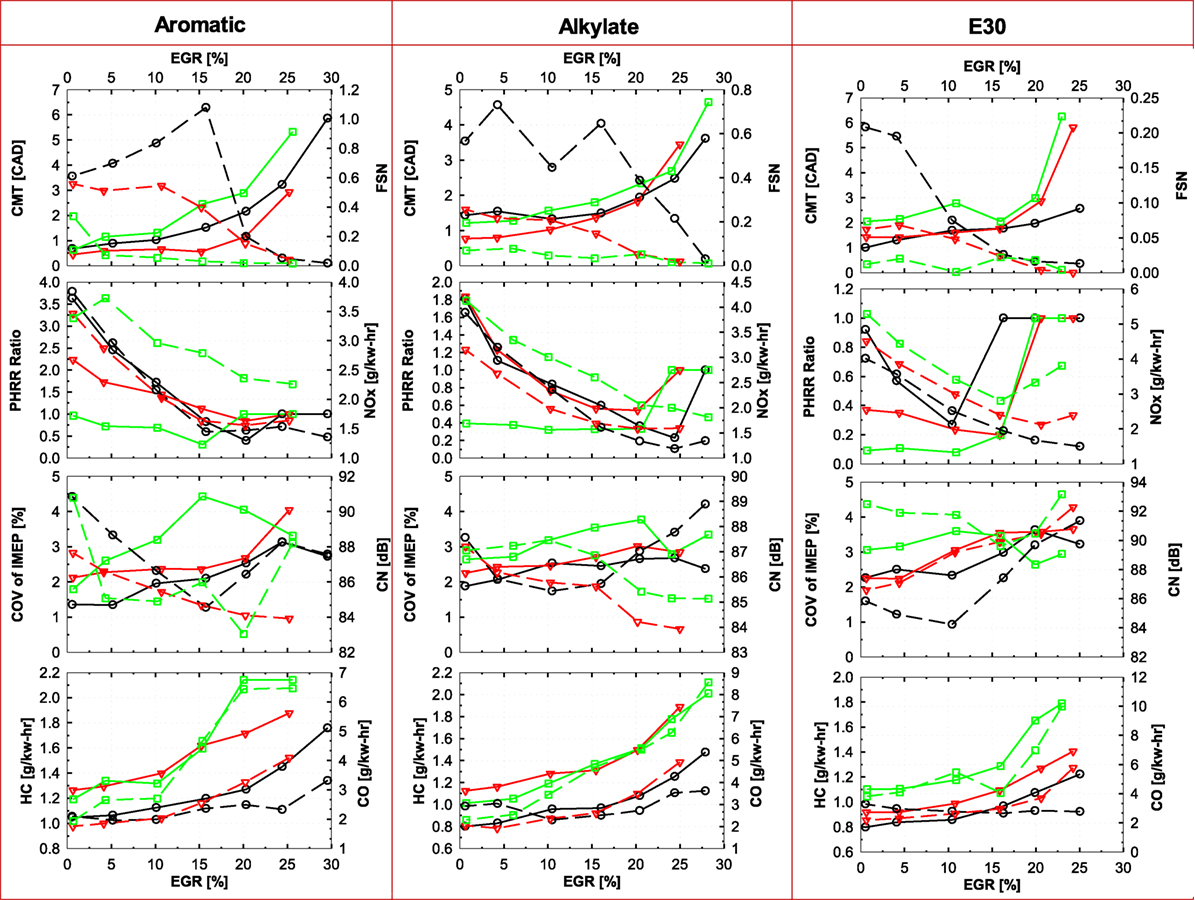
Figure 7. Combustion and emission of fuels at different λ-Exhaust gas recirculating (EGR) conditions with λ = 1.6 (black), 1.8 (red), and 2.0 (green). Solid lines are shown for y1-axis (left). Dashed lines are shown for y2-axis (right).
Similar to previous finding, as EGR increased, the CMT of three fuels increased due to advance of SOI2. At most EGR conditions, CMT with λ = 2 was longest. CMT was shortest for λ = 1.8 for aromatic and alkylate, while it was shortest at richest condition (λ = 1.6) for E30. Longer CMT means longer mixing time and therefore reduced FSN. FSN was also reduced with leaner conditions (higher λ). E30 still produced the lowest smoke compared to other fuels: almost 4–5 times less than other fuels. At λ = 2.0, all three fuels have FSN below 0.1 over the EGR range. In overall, FSN was reduced significantly with EGR of 25% or higher, or with CMT of approximately 5 CAD or higher. The PHRR ratio and NOx emission were plotted together to show a decreasing trend as EGR increased. At 0% EGR and λ = 1.6, the PHRR ratios were highest for all three fuels, indicating a strong premixed combustion from early injected fuel. At about 15–20% EGR, PHRR ratio started to become unity. This indicates the merging of the two combustion stages. The lowest PHRR ratios were found at λ = 2.0 condition. At this λ, PHRR ratios were lowest at EGR of 15, 10, and 10% for aromatic, alkylate, and E30, respectively. Emission of NOx was relatively similar in both trends and magnitude among all three fuels. NOx emission was reduced significantly at EGR of 25% or higher. However, it is interesting to see that lower λ (richer condition) gave lower NOx emissions for a given EGR level. This is because NOx emission is usually promoted at “locally” high temperature and rich condition as discussed in Section “Introduction.” With PHRR ratio is higher at lower λ, or lower second HRR peak, diffusion flame from late injection may have occurred at lower combustion temperature. The premixed combustion portion was lack of the locally rich factor due to fuel was injected very early. Combustion also became more unstable (higher COVIMEP but still below 5%) as λ or EGR increases. This also leads to higher incomplete combustion products of HC and CO.
Endoscope Images
Test conditions with low FSN were selected for taking endoscope images since this prevented the endoscope window from getting too “sooty,” and therefore would affect the visibility of the combustion signal. Here, the condition of 25% EGR, λ = 1.8 was selected basing on the results shown in Figure 7 with low FSN from all three fuels. FSN were 0.019, 0.022, and 0.007 for aromatic, alkylate, and E30, respectively. In Figure 8, endoscope images (original flame luminosity and processed soot and temperature distributions) are shown for each fuel over selected CA range where combustion mostly occurred. Important findings from endoscope images, cylinder pressure, and HRR profiles are summarized in Table 4.
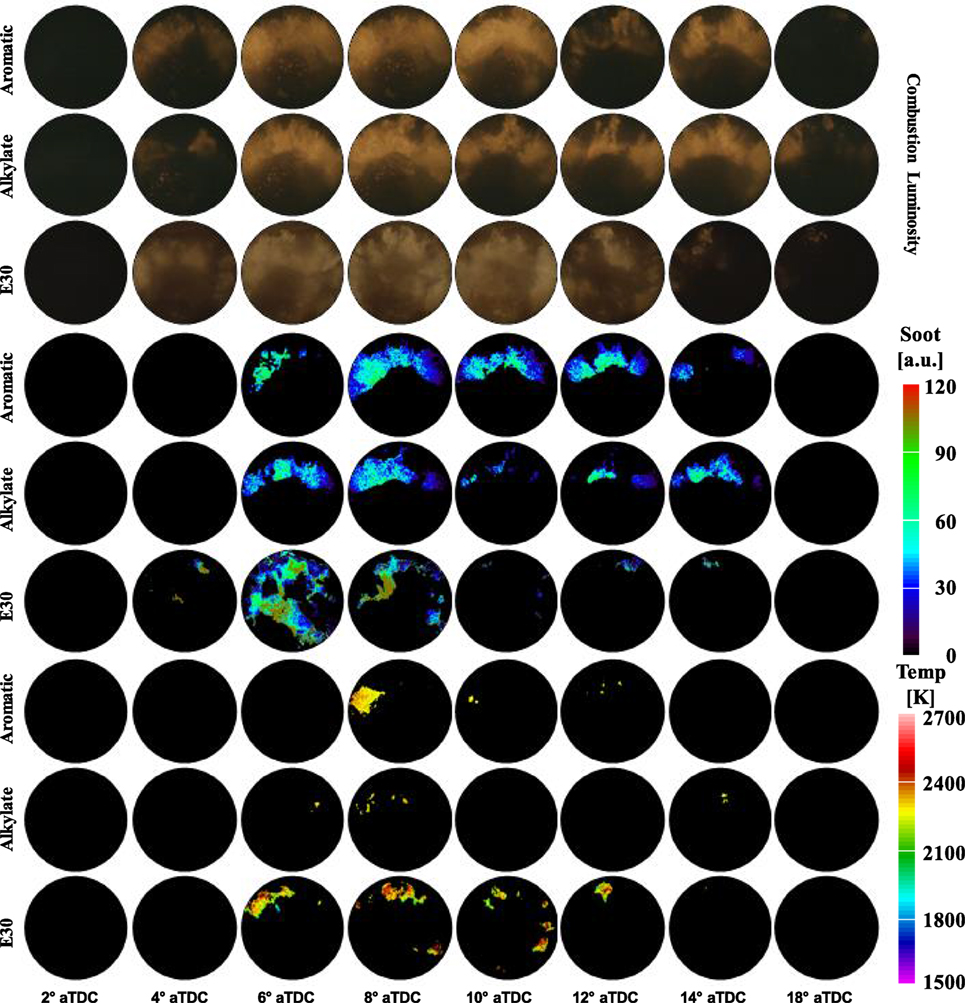
Figure 8. Endoscope images (original, soot, and temp) of three fuels (aromatic, alkylate, and E30) at exhaust gas recirculating = 25%, λ = 1.8 over selected crank angles for complete combustion/emission evolution.
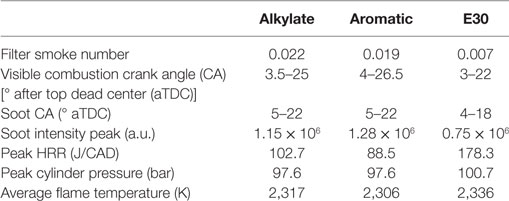
Table 4. Summary of findings from endoscope imaging, heat release rate (HRR), and cylinder pressure for three fuels at 25% exhaust gas recirculating, λ = 1.8.
Combustion luminosity images show that combustion began shortly after TDC for all three fuels. This indicates a very low to no signals from the premixed combustion of early injection. Soon after EOI2, combustion signals became visible around the same location of CA50 (5° aTDC). Flame luminosity signals occurred mostly between 4° and 12° aTDC. Among three fuels, combustion of E30 seemed to occur more spread out within the combustion chamber. Combustion of E30 also occurred more spontaneous and ended quicker than other fuels as very little flame visibility was seen after 12° aTDC. Flame from alkylate and aromatic cases stayed mostly in the upper half region of the endoscope images, which is closer to the injector. This suggests a more heterogenous mixture remaining in the cylinder after the last injection that led to stronger combustion signal. Further analysis on this with comparison of HRR profile is provided at later discussion.
Average soot intensity evaluated from combustion images was investigated with HRR profiles in Figure 9. Previously, spatial soot images in Figure 8 showed similar trend with combustion luminosity images with soot formation from the combustion of E30 distributed more spread inside the cylinder. Soot formation also seemed to last longer for aromatic and alkylate than E30. Soot signal started to cease after 10° aTDC. Figure 9 shows HRR and injector currents together with soot intensity for all three fuels to study the correlation between pressure-based data and endoscope images. First, before 4° aTDC where first stage of HRR (except for E30 with no clear indication of first stage HRR) was present, no soot signals (Figure 8) was seen and soot intensity (Figure 9) was nearly 0. Last injection started shortly after the start of first combustion stage except for SOI2 of E30, which occurred almost together as HRR increased. Soot intensity was lowest in combustion of E30 with the peak of soot intensity was about 60% lower than those of aromatic and alkylate. Soot intensity profile of E30 also showed a shorter soot duration with soot intensity reduced to 50% of its peak at approximately 10° aTDC, while this was ~13° aTDC for aromatic and alkylate. This is because longer CMT resulted in locally leaner combustion in E30 case.
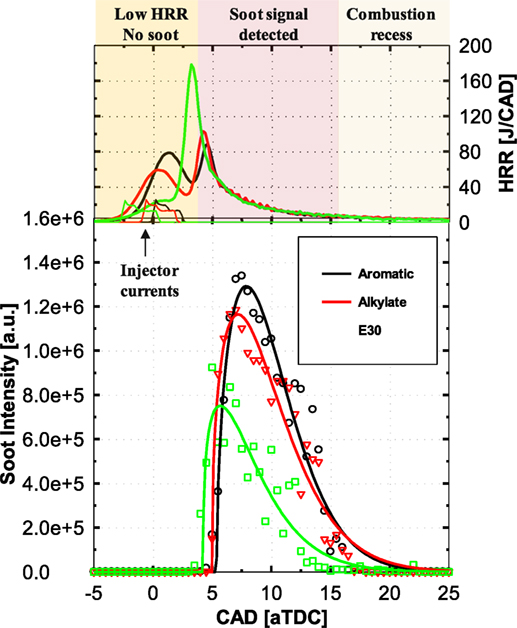
Figure 9. Comparison of heat release rate (HRR) and soot intensity profiles for three fuels at exhaust gas recirculating (EGR) = 25%, λ = 1.8.
Average flame temperature was estimated based on two-color method with measurement range of 1,500–2,700 K and resolution of 4.7 K. Flame temperature is approximately 2,320 K in average for both three fuels. Spatial distribution of flame temperature shows that high flame temperature occurred at more locations in the combustion chamber for E30, while there was little indication of high flame temperature regions for aromatic and alkylate.
Conclusion
This study investigates the combustion and emission of three gasoline fuels with the same high RON value of 98 under GCI operation. The experiment was performed in a multicylinder engine with optical accessibility for endoscope imaging. Test condition included different EGRs and global lambda. The main conclusions of this work are summarized as follows:
• Combustion phasing was controlled effectively by the SOI of the last injection or boost during EGR sweep. At higher EGR, advanced SOI or higher boost was needed to maintain a constant CA50 of 5° aTDC. HRR profile showed a two-staged combustion when EGR was less than 15%. Combustion became single-staged event at higher EGR. E30 was shown to be the most sensitive to boost as compared to other fuels.
• Smoke was reduced at higher EGR due to longer mixing time from advancing the last injection and dilution effect. Longest mixing time (5.8 CAD) was resulted from E30. FSN was below 0.1 at EGR of 25% for all three fuels. NOx emission was reduced as EGR increased due to its thermal and dilution effects. Emissions of CO and HC increased slightly at higher EGR.
• EGR sweep test at different lambda (λ = 1.6, 1.8, and 2.0) showed lowest FSN from E30 and highest FSN from aromatic. FSN was reduced with either higher λ or higher EGR to achieve a leaner and LTC condition. Peak HRR ratio started high (>1.0) for aromatic and alkylate, while this was below 1.0 for E30 at low EGR. E30 was demonstrated to be the least reactive fuel, and its combustion appeared to be more spontaneous (toward ~premixed combustion). HRR profiles of E30 quickly became single-stage combustion as EGR level increased to 15% or higher.
• Endoscope image (at 25% EGR, λ = 1.8) showed more spread region of combustion within the cylinder in E30 case. Meanwhile, combustion of aromatic and alkylate occurred in a more confined region closer to the injector and along the spray axis. Soot intensity was lowest in E30, while it was relatively similar for other fuels. For two-stage combustion conditions, no flame luminosity was seen. However, it is expected that some low-temperature reaction could have emitted chemiluminescence signals such as OH*. Further investigation would provide better understanding of the unique autoignition and combustion of GCI for these high RON fuels. In addition, soot characterization technique through experiments such as transmission electron microscopy may reveal insights on the particular soot distribution and soot structure of GCI combustion.
Author Contributions
KC: establish test condition, conduct experiment, data analysis, and paper preparation. SC: supervise engine experiment, direction of research, endoscope setup, paper preparation, and paper review. ST: support engine experiment, assist in endoscope setup, and paper review. OA: paper review.
Conflict of Interest Statement
The authors declare that the research was conducted in the absence of any commercial or financial relationships that could be construed as a potential conflict of interest.
The reviewer, HW, and handling editor declared their shared affiliation.
Acknowledgments
This research was conducted as part of the Co-Optimization of Fuels & Engines (Co-Optima) project sponsored by the US Department of Energy (DOE) Office of Energy Efficiency and Renewable Energy (EERE), Bioenergy Technologies and Vehicle Technologies Offices. The submitted manuscript has been created by UChicago Argonne, LLC, Operator of Argonne National Laboratory (“Argonne”). Argonne, a US Department of Energy Office of Science laboratory, is operated under Contract No. DE-AC02-06CH11357. The US Government retains for itself, and others acting on its behalf, a paid-up non-exclusive, irrevocable worldwide license in said article to reproduce, prepare derivative works, distribute copies to the public, and perform publicly and display publicly, by or on behalf of the Government. The Department of Energy will provide public access to these results of federally sponsored research in accordance with the DOE Public Access Plan. https://energy.gov/downloads/doe-public-access-plan. In addition, authors would also like to thank Mr. Timothy Rutter (ANL) for his technical support in the test cell; European funding agency for providing financial support (3 month period) to the visiting Ph.D. student (also co-author of this paper) to work at ANL.
Funding
Partial support for ST was received from the People Programme (Marie Curie Actions) of the European Union’s seventh framework programme FP7/2007-2013/ under REA grant agreement n° 607214.
References
Akihama, K., Takatori, Y., Inagaki, K., Sasaki, S., and Dean, A. M. (2001). Mechanism of the Smokeless Rich Diesel Combustion by Reducing Temperature. Detroit, MI: SAE International.
Armas, O., Yehliu, K., and Boehman, A. L. (2010). Effect of alternative fuels on exhaust emissions during diesel engine operation with matched combustion phasing. Fuel 89, 438–456. doi: 10.1016/j.fuel.2009.09.022
Brettschneider, J. (1979). Berechnung des luftverhältnisses lambda von luft-kraftstoff-gemischen und des einflusses von messfehlern auf lambda. Bosch. Tech. Ber. 6, 177–186.
Burke, S. C., Ratcliff, M., McCormick, R., Rhoads, R., and Windom, B. (2017). Distillation-based droplet modeling of non-ideal oxygenated gasoline blends: investigating the role of droplet evaporation on PM emissions. SAE Int. J. Fuels Lubr. 10, 69–81. doi:10.4271/2017-01-0581
Cai, L., and Pitsch, H. (2015). Optimized chemical mechanism for combustion of gasoline surrogate fuels. Combust. Flame 162, 1623–1637. doi:10.1016/j.combustflame.2014.11.018
Cheng, A. S., Upatnieks, A., and Mueller, C. (2006). Investigation of the impact of biodiesel fuelling on NOx emissions using an optical direct injection diesel engine. Int. J. Eng. Res. 7, 297–318. doi:10.1243/14680874JER05005
Chupka, G. M., Christensen, E., Fouts, L., Alleman, T. L., Ratcliff, M. A., and McCormick, R. L. (2015). Heat of vaporization measurements for ethanol blends up to 50 volume percent in several hydrocarbon blendstocks and implications for knock in SI engines. SAE Int. J. Fuels Lubr. 8, 251–263. doi:10.4271/2015-01-0763
Ciatti, S., Johnson, M., Das Adhikary, B., Reitz, R., and Knock, A. (2013). Efficiency and Emissions Performance of Multizone Stratified Compression Ignition Using Different Octane Fuels. Detroit, MI: SAE Technical Paper, 2.
Ciatti, S. A., Blobaum, E. L., and Foster, D. E. (2002). Determination of Diesel Injector Nozzle Characteristics Using Two-Color Optical Pyrometry. Detroit, MI: SAE International.
Ciatti, S. A., Miers, S. A., and Ng, H. K. (2005). “Influence of EGR on soot/no X production in a light-duty diesel engine,” in 2005 Fall Technical Conference of the ASME Internal Combustion Engine Division, Ottawa, ON.
Cung, K., Bhagat, M., Zhang, A., and Lee, S. Y. (2013). Numerical Study on Emission Characteristics of High-Pressure Dimethyl Ether (DME) Under Different Engine Ambient Conditions. Detroit, MI: SAE Technical Paper, 2.
Cung, K., Moiz, A. A., Zhu, X., and Lee, S.-Y. (2016). “Ignition and formaldehyde formation in dimethyl ether (DME) reacting spray under various EGR levels,” in Proceedings of the Combustion Institute, Pittsburgh, PA, 36.
Dec, J. E. (2009). Advanced compression-ignition engines – understanding the in-cylinder processes. Proc. Combust. Inst. 32, 2727–2742. doi:10.1016/j.proci.2008.08.008
Dec, J. E., Yang, Y., and Dronniou, N. (2011). Boosted HCCI – controlling pressure-rise rates for performance improvements using partial fuel stratification with conventional gasoline. SAE Int. J. Engines 4, 1169–1189. doi:10.4271/2011-01-0897
Dempsey, A. B., Curran, S. J., and Wagner, R. M. (2016). A perspective on the range of gasoline compression ignition combustion strategies for high engine efficiency and low NOx and soot emissions: effects of in-cylinder fuel stratification. Int. J. Eng. Res. 17, 897–917. doi:10.1177/1468087415621805
Dierksheide, U., Meyer, P., Hovestadt, T., and Hentschel, W. (2002). Endoscopic 2D particle image velocimetry (PIV) flow field measurements in IC engines. Exp. Fluids 33, 794–800. doi:10.1007/s00348-002-0499-3
Epping, K., Aceves, S., Bechtold, R., and Dec, J. E. (2002). The Potential of HCCI Combustion for High Efficiency and Low Emissions. Detroit, MI: SAE International.
Frenklach, M., and Warnatz, J. (1987). Detailed modeling of PAH profiles in a sooting low-pressure acetylene flame. Combust. Sci. Technol. 51, 265–283. doi:10.1080/00102208708960325
Fujimoto, H., Senda, J., Ito, T., and Kitamura, T. (2002). Mechanism of smokeless diesel combustion with oxygenated fuels based on the dependence of the equivalence ration and temperature on soot particle formation. Int. J. Eng. Res. 3, 223–248. doi:10.1243/146808702762230923
Glassman, I. (1989). Soot formation in combustion processes. Symp. Int. Combust. 22, 295–311. doi:10.1016/S0082-0784(89)80036-0
Idicheria, C. A., and Pickett, L. M. (2006). Formaldehyde Visualization Near Lift-Off Location in a Diesel Jet. Detroit, MI: SAE Technical Paper.
Kalghatgi, G., Hildingsson, L., and Johansson, B. (2010). Low NOx and low smoke operation of a diesel engine using gasolinelike fuels. J. Eng. Gas Turbines Power 132, 092803. doi:10.1115/1.4000602
Kalghatgi, G. T. (2014b). The outlook for fuels for internal combustion engines. Int. J. Eng. Res. doi:10.1177/1468087414526189
Kalghatgi, G. T., Risberg, P., and Ångström, H.-E. (2006). Advantages of Fuels with High Resistance to Auto-Ignition in Late-Injection, Low-Temperature, Compression Ignition Combustion. Detroit, MI: SAE International.
Kalghatgi, G. T., Risberg, P., and Ångström, H.-E. (2007). Partially Pre-Mixed Auto-Ignition of Gasoline to Attain Low Smoke and Low NOx at High Load in a Compression Ignition Engine and Comparison with a Diesel Fuel. Detroit, MI: SAE International.
Kim, D., Ekoto, I., Colban, W. F., and Miles, P. C. (2008). In-cylinder CO and UHC imaging in a light-duty diesel engine during PPCI low-temperature combustion. SAE Int. J. Fuels Lubr. 1, 933–956. doi:10.4271/2008-01-1602
Kodavasal, J., Kolodziej, C. P., Ciatti, S. A., and Som, S. (2015). Computational fluid dynamics simulation of gasoline compression ignition. J. Energy Resour. Technol. 137, 032212. doi:10.1115/1.4029963
Kokjohn, S. L., Hanson, R. M., Splitter, D. A., and Reitz, R. D. (2011). Fuel reactivity controlled compression ignition (RCCI): a pathway to controlled high-efficiency clean combustion. Int. J. Eng. Res. 12, 209–226. doi:10.1177/1468087411401548
Manente, V., Johansson, B., and Tunestal, P. (2009). Partially Premixed Combustion at High Load Using Gasoline and Ethanol, a Comparison with Diesel. Detroit, MI: SAE Technical Paper.
Manente, V., Johansson, B., Tunestal, P., Sonder, M., and Serra, S. (2012). Gasoline partially premixed combustion: high efficiency, low NOx and low soot by using an advanced combustion strategy and a compression ignition engine. Int. J. Veh. Des. 59, 108–128. doi:10.1504/IJVD.2012.048689
Manente, V., Zander, C.-G., Johansson, B., Tunestal, P., and Cannella, W. (2010). An Advanced Internal Combustion Engine Concept for Low Emissions and High Efficiency from Idle to Max Load Using Gasoline Partially Premixed Combustion. Detroit, MI: SAE International.
Musculus, M. P. B., Lachaux, T., Pickett, L. M., and Idicheria, C. A. (2007). End-of-Injection Over-Mixing and Unburned Hydrocarbon Emissions in Low-Temperature-Combustion Diesel Engines. Detroit, MI: SAE Technical Paper.
Musculus, M. P. B., Miles, P. C., and Pickett, L. M. (2013). Conceptual models for partially premixed low-temperature diesel combustion. Prog. Energy Combust. Sci. 39, 246–283. doi:10.1016/j.pecs.2012.09.001
Najt, P. M., and Foster, D. E. (1983). Compression-Ignited Homogeneous Charge Combustion. Detroit, MI: SAE Technical Paper.
Noehre, C., Andersson, M., Johansson, B., and Hultqvist, A. (2006). Characterization of Partially Premixed Combustion. Detroit, MI: SAE International.
Onishi, S., Jo, S. H., Shoda, K., Do Jo, P., and Kato, S. (1979). Active Thermo-Atmosphere Combustion (ATAC)-a New Combustion Process for Internal Combustion Engines. Detroit, MI: SAE Technical Paper.
Pickett, L., Caton, J., Musculus, M., and Lutz, A. (2006). Evaluation of the equivalence ratio-temperature region of diesel soot precursor formation using a two-stage Lagrangian model. Int. J. Eng. Res. 7, 349–370. doi:10.1243/14680874JER00606
Richter, H., Grieco, W. J., and Howard, J. B. (1999). Formation mechanism of polycyclic aromatic hydrocarbons and fullerenes in premixed benzene flames. Combust. Flame 119, 1–22. doi:10.1016/S0010-2180(99)00032-2
Sellnau, M., Foster, M., Hoyer, K., Moore, W., Sinnamon, J., and Husted, H. (2014). Development of a gasoline direct injection compression ignition (GDCI) engine. SAE Int. J. Engines 7, 835–851. doi:10.4271/2014-01-1300
Sellnau, M. C., Sinnamon, J., Hoyer, K., and Husted, H. (2012). Full-time gasoline direct-injection compression ignition (GDCI) for high efficiency and low NOx and PM. SAE Int. J. Engines 5, 300–314. doi:10.4271/2012-01-0384
Skeen, S. A., Manin, J., and Pickett, L. M. (2015). Simultaneous formaldehyde PLIF and high-speed schlieren imaging for ignition visualization in high-pressure spray flames. Proc. Combust. Inst. 35, 3167–3174. doi:10.1016/j.proci.2014.06.040
Woschni, G. (1967). A Universally Applicable Equation for the Instantaneous Heat Transfer Coefficient in the Internal Combustion Engine. Detroit, MI: SAE Technical Paper.
Keywords: internal combustion engine, gasoline compression ignition, high octane, endoscope imaging, low-temperature combustion
Citation: Cung KD, Ciatti SA, Tanov S and Andersson Ö (2017) Low-Temperature Combustion of High Octane Fuels in a Gasoline Compression Ignition Engine. Front. Mech. Eng. 3:22. doi: 10.3389/fmech.2017.00022
Received: 03 July 2017; Accepted: 05 December 2017;
Published: 21 December 2017
Edited by:
Mingfa Yao, Tianjin University, ChinaReviewed by:
Adam Brian Dempsey, Oak Ridge National Laboratory (DOE), United StatesHu Wang, Tianjin University, China
Copyright: © 2017 Cung, Ciatti, Tanov and Andersson. This is an open-access article distributed under the terms of the Creative Commons Attribution License (CC BY). The use, distribution or reproduction in other forums is permitted, provided the original author(s) or licensor are credited and that the original publication in this journal is cited, in accordance with accepted academic practice. No use, distribution or reproduction is permitted which does not comply with these terms.
*Correspondence: Stephen Anthony Ciatti, sciatti@anl.gov