 Leong-Keat Chan1†‡ Ryan J. Newton1,2‡ Shalabh Sharma1 Christa B. Smith1 Pratibha Rayapati1† Alexander J. Limardo1 Christof Meile1 Mary Ann Moran1*
- 1 Department of Marine Sciences, University of Georgia, Athens, GA, USA
- 2 Great Lakes WATER Institute, University of Wisconsin-Milwaukee, Milwaukee, WI, USA
Marine bacteria drive the biogeochemical processing of oceanic dissolved organic carbon (DOC), a 750-Tg C reservoir that is a critical component of the global C cycle. Catabolism of DOC is thought to be regulated by the biomass composition of heterotrophic bacteria, as cells maintain a C:N:P ratio of ∼50:10:1 during DOC processing. Yet a complicating factor in stoichiometry-based analyses is that bacteria can change the C:N:P ratio of their biomass in response to resource composition. We investigated the physiological mechanisms of resource-driven shifts in biomass stoichiometry in continuous cultures of the marine heterotrophic bacterium Ruegeria pomeroyi (a member of the Roseobacter clade) under four element limitation regimes (C, N, P, and S). Microarray analysis indicated that the bacterium scavenged for alternate sources of the scarce element when cells were C-, N-, or P-limited; reworked the ratios of biomolecules when C- and P- limited; and exerted tighter control over import/export and cytoplasmic pools when N-limited. Under S limitation, a scenario not existing naturally for surface ocean microbes, stress responses dominated transcriptional changes. Resource-driven changes in C:N ratios of up to 2.5-fold and in C:P ratios of up to sixfold were measured in R. pomeroyi biomass. These changes were best explained if the C and P content of the cells was flexible in the face of shifting resources but N content was not, achieved through the net balance of different transcriptional strategies. The cellular-level metabolic trade-offs that govern biomass stoichiometry in R. pomeroyi may have implications for global carbon cycling if extendable to other heterotrophic bacteria. Strong homeostatic responses to N limitation by marine bacteria would intensify competition with autotrophs. Modification of cellular inventories in C- and P-limited heterotrophs would vary the elemental ratio of particulate organic matter sequestered in the deep ocean.
Introduction
Bacterioplankton control the flux of dissolved organic carbon (DOC) into the microbial food web and influence the release of carbon to atmospheric, offshore, and deep sea reservoirs. Many studies suggest that catabolism of DOC is regulated by the biomass stoichiometry of heterotrophic bacteria with respect to N and other nutrients (del Giorgio and Cole, 1998). Thus bacteria incorporate a higher percentage of metabolized DOC into biomass when C is the limiting element and a lower percentage when other elements (typically N or P) limit growth, resulting in decreased growth efficiency as the substrate C:N ratio increases (Goldman et al., 1987). While the molar stoichiometry of C:N:P in marine seston averages ∼106:16:1 (the Redfield ratio; Redfield, 1934), bacteria from a variety of freshwater and marine environments have higher N and P requirements relative to C and typically must attain a biomass stoichiometry closer to 50:10:1 during DOC processing (Fagerbakke et al., 1996; Cotner et al., 2010).
A confounding factor in stoichiometry-based analyses is that heterotrophic bacteria can change the C:N:P ratio of their biomass in response to the substrate composition (Martinussen and Thingstad, 1987; Tezuka, 1990; Fagerbakke et al., 1996; Gundersen et al., 2002). This plasticity occurs either by uncoupling catabolism and anabolism to overproduce metabolites rich in the excess element (which can be stored or excreted), or by reducing the requirement for the limiting element. Resource-driven shifts in C:N:P ratios of bacterial biomass can affect the efficiency of DOC transformation, modify C flux through the marine food web (Elser et al., 1995), buffer mismatches between bacterial requirements and ecosystem resource availability, and alter the composition of particulate organic matter sequestered in the deep ocean (Thingstad et al., 2008).
While it is clear that any modifications in elemental stoichiometry must occur within the basic macromolecular constraints of a functioning heterotrophic bacterial cell, there is yet only rudimentary knowledge of the physiological mechanisms that might allow C:N:P ratio variability in marine bacteria. Proposed avenues for changes in stoichiometry include alteration of the cellular inventory of P-rich rRNA (Elser et al., 1996), trade-offs in macromolecular composition to maximize growth (Franklin et al., 2011), substitution of S for P in bacterial membrane lipids (Van Mooy et al., 2009), depletion of P reserves stored in the form of polyphosphate (Kornberg, 1999), depletion of C reserves stored in the form of polyhydroxybutyrate (Dawes and Senior, 1973), and reduction of the cell quota of the limiting element (i.e., the required cell concentration; Harder and Dijkhuizen, 1983; Rivkin and Anderson, 1997).
Here we investigate the global transcriptional response underlying resource-driven shifts in biomass stoichiometry in the marine heterotrophic bacterium Ruegeria pomeroyi DSS-3, a member of the ubiquitous Roseobacter clade, under four different element limitation regimes (C, N, P, and S). Our experimental approach equalized growth rates across treatments using continuous cultures (Ferenci, 2008), thereby disentangling effects of the limiting element from any growth rate-driven differences in cell composition (Elser et al., 1995). R. pomeroyi exhibited significant flexibility in biomass content of some elements but not others, and gene transcription patterns deduced from whole-genome microarrays revealed element-specific metabolic strategies underlying the stoichiometric shifts.
Materials and Methods
Cell Growth Conditions
Ruegeria pomeroyi DSS-3 was grown in 320 ml custom-made chemostats with a culture volume of 200 ml. Steady-state biomass was limited either by carbon (glucose, 1 mmol l−1), nitrogen (NH4Cl, 0.26 mmol l−1), phosphorus (KH2PO4, 9.2 μmol l−1), or sulfur (Na2SO4, 25 μmol l−1). The appropriate concentrations of limiting nutrients needed to produce similar biomass were initially approximated from batch culture experiments that measured growth yields of R. pomeroyi under a range of concentrations. The range was then narrowed in test runs of the chemostats. Once the correct element concentration was determined, six independent chemostat cultures for each macroelement limitation run at two different times were used for elemental analysis and triplicate RNA sampling.
Chemostat culture medium (Table A1 in Appendix) modified from Henriksen (2008) was buffered with 10 mmol l−1 1,3-bis(tris(hydroxymethyl)methyl amino)propane (Bis–tris propane), a C- and N-containing compound; batch cultures of R. pomeroyi did not grow with 10 mmol l−1 Bis–tris propane when it was added as the sole N or C source. Vitamins and trace metals were added to the culture medium (Table A1 in Appendix). The feed medium was added to each chemostat at a rate of 8.4 ml h−1, equivalent to a dilution rate of 0.042 h−1, chosen to approach the rate of marine bacterial growth in situ (∼1–2 day−1; Ducklow and Hill, 1985) while maintaining sufficient cell yield for biological and chemical analysis. During the incubation, cell cultures were mixed by constant stirring, and temperature was maintained at 30°C using a circulating water bath. Air was bubbled into the culture at a flow rate of 2 ml min−1. Salinity was constant at 25 and pH ranged from 6.6 to 7.0 during all growth regimes. Cell cultures were considered to be at steady-state when the change in OD600 was ≤10% between two successive measurements. At steady-state, the feed medium dilution rate equals cell growth rate, which was equivalent to a 16.5-h doubling time for R. pomeroyi DSS-3. All cultures reached steady-state after three volume exchanges, and cells were harvested after five volume exchanges
Inoculum for the chemostat cultures was from a frozen glycerol stock of R. pomeroyi DSS-3, revived by streaking onto 1/2 strength YTSS agar (yeast extract, 4 g l−1; tryptone, 2.5 g l−1; sea salts, 20 g l−1; agar, 20 g l−1; González et al., 2003; pH adjusted to 6.8), and incubating at 30°C in the dark. After colonies appeared (∼3 days after streaking), a patch of cells was transferred into 1/2 YTSS liquid medium and grown at 30°C with shaking at 150 rpm. After an overnight incubation, cells were washed two times and resuspended in fresh medium lacking glucose, ammonium, phosphate, and sulfate (Table A1 in Appendix). Cells were inoculated into 200 ml chemostat medium to an OD600 of 0.05 (∼7 × 10⁶ cells ml−1), and cultured initially with the outflow pump turned off. After ∼16 h, the flow carrying the feed medium was started and the medium supply was maintained at a constant rate during the chemostat run.
Cell Counts and Protein Measurements
Chemostat cultures were routinely monitored for OD600, cell counts, and cell protein concentration. For cell counts, aliquots taken from the chemostats were fixed with glutaraldehyde (2% vol/vol, final concentration), incubated at room temperature for 10 min, and frozen at −20°C. One freeze–thaw cycle did not cause a change in the cell count (data not shown). Thawed cells were stained with SYBR Green II (Molecular Probes/Invitrogen, Carlsbad, CA, USA), incubated in the dark for 10 min, and analyzed with a Beckman Colter Cyan Flow Cytometer. Bacterial cells were quantified using a combination of forward light scatter and fluorescence detection. To reduce the contribution of background fluorescence, cells were quantified within a gate encompassing ≥94% of total fluorescence. Light scatter values provided an index of cell size. The cell protein concentration was measured from cells flash-frozen in a dry ice–ethanol bath according to the method of Bradford (1976) using Bovine Serum Albumin as a standard.
Spent Medium Analysis
For each treatment regime, concentrations of glucose, and were measured in one sample (one or two technical duplicates) of cell-free spent medium pooled from three independent chemostat cultures. Cells were pelleted by centrifugation at 16,250 × g. The supernatant from three replicates was combined and passed through a 0.22-μm pore-size cellulose acetate filter to remove remaining cells and stored at −20°C until analysis. An estimate of ammonium in the supernatant was obtained by assaying the spent medium using the Ammonia Assay Kit (BioVision, Mountain View, CA, USA; detection limit of 20 μmol l−1) according to the manufacturer’s instructions and correcting for the interference from pyruvate based on a control prepared in parallel with the sample. Attempts to measure ammonium with the more sensitive phenol–hypochlorite method (Solorzano, 1969) failed due to inhibiting agents in the culture medium. Glucose concentration was measured with the Glucose Assay Kit (Sigma, St. Louis, MO, USA; detection limit of 50 μmol l−1), and control samples were prepared in parallel with the supplied glucose standard. The concentration of was determined with a Shimadzu UV-1601 spectrophotometer using the molybdenum blue reaction (Strickland and Parsons, 1972) and the concentration of was determined with a DIONEX ICS-2000 ion chromatography system. Internal standards were used in and measurements.
Growth Efficiency Calculations
Carbon assimilatory efficiency was calculated as Cb/Cipt, where Cb is the C present in cell biomass per chemostat volume (200 ml), calculated as 3,072, 1,007, 2,928, and 511 μg C for the C-, N-, P-, and S-limited conditions, respectively, based on measures of biomass %C and dry weight; and Cipt is the C input to the chemostat per cell doubling minus any C remaining in the spent medium, calculated as 9,988 μg C for C-limited conditions (8.4 ml h−1 of a 1-mmol l−1 solution) and 44,946 μg C minus spent medium C for N-, P-, and S-limited conditions (8.4 ml h−1 of a 4.5-mmol l−1 solution).
Cell Elemental Analysis
Ruegeria pomeroyi DSS-3 cells from 240 ml of culture, pooled from three independent chemostat replicates (80 ml per replicate), were pelleted by centrifugation at 16,250 × g, washed twice in fresh medium without glucose, ammonium, phosphate, and sulfate (Table A1 in Appendix), immediately frozen in a dry ice–ethanol bath, and stored at −70°C. Frozen cell samples were lyophilized for dry weight measurements and then used in elemental analysis with a Perkin-Elmer 2400 CHN analyzer (C and N) and an inductively coupled plasma mass spectrometer (P).
Free Amino Acid Analysis
Cells from 180 ml of culture pooled from three independent chemostat replicates (60 ml per replicate) were washed and pelleted as described above. A portion was saved for cell counts by flow cytometry. To the remainder, 9.7 nmol of β-amino isobutyric acid was added as an internal standard (Hendrickson et al., 2008) and cells were rapidly frozen in a dry ice–ethanol bath and stored at −80°C until analysis. Frozen cell pellets were sent to the Molecular Structure Facility at the University of California Davis for assay with a Hitachi L-8900 Amino Acid Analyzer according to the facility’s protocol. Briefly, cell pellets were lysed with acetonitrile (50% vol/vol) and formic acid (5% vol/vol), and amino-ethyl cysteine was added as an internal standard for quality control. The final amount of amino acids was corrected for the standard and converted to units of pmoles (mg dry weight)−1.
Microarray Hybridization
Cell culture from each replicate chemostat (45 ml) was rapidly fixed with 5 ml of phenol–ethanol solution (5% vol/vol). Cells were collected by centrifugation at 4,500 × g, the supernatant was removed, and the loose cell pellets were frozen at −70°C. Total RNA was purified using the RNeasy Mini Kit (Qiagen, Valencia, CA, USA) according to procedures described previously (Poretsky et al., 2009). DNA was removed by the TURBO DNA-free kit (Applied Biosystems/Ambion, Austin, TX, USA), ribosomal RNA was removed with the MicrobeExpress kit (Applied Biosystems/Ambion), and mRNA-enriched RNA was amplified with the MessageAmp II-Bacteria Kit (Applied Biosystems/Ambion).
A non-competitive, single-color hybridization strategy was used to hybridize the mRNA samples to microarray slides. Amplified mRNA was labeled with AlexaFluor 647 dye (Invitrogen), with modifications to the manufacturer’s protocol as described previously (Bürgmann et al., 2007). Amplified and labeled mRNA was purified with the MEGAclear kit (Applied Biosystems/Ambion) and concentrated by ethanol precipitation. Samples were hybridized to a whole-genome microarray manufactured by Combimatrix (Mukilteo, WA, USA) and imaged according to the procedures described in the manufacturer’s protocol. The CustomArray 12 K microarray slides for R. pomeroyi DSS-3 used in this study were described in detail by Bürgmann et al. (2007). A total of 8,143 probes, each present up to three times, were represented on the array (Bürgmann et al., 2007). Hybridized slides were stripped according to Combimatrix’s protocol and re-used up to three times. Arrays were re-imaged after each stripping, and re-stripped as needed until minimal fluorescence signal remained.
Microarray Data Analysis
Quality control of microarray hybridizations was performed as described previously (Bürgmann et al., 2007). Each hybridized spot was manually examined in GenePix Pro 6.0 Software (Molecular Devices, Sunnyvale, CA, USA), and the background fluorescence was subtracted (i.e., fluorescence values of the five closest empty spots). Spots were flagged as bad with Acuity 4.0 (Molecular Devices) when they were unevenly hybridized (determined manually by checking the hybridization circularity), when the detected fluorescence minus the background fluorescence was less than 2 SDs of the background fluorescence [F635–B635 < 2 SD (B635)], or when the signal to noise ratio was <3. Probes were removed when the flagged spots were present in >25% of arrays. For the remaining probes with good hybridization signal, those targeting 5S rRNA, 16S rRNA, 23S rRNA, mismatch probes, and manufacturer’s control probes were removed. Each gene was represented by up to two probes and each probe was spotted up to three times on the array (Bürgmann et al., 2007). After probe removal, 5,145 probes (covering 3,324 genes out of the total 4,252 genes in the R. pomeroyi DSS-3 genome) remained for analysis. The complete microarray dataset, reported according to the Minimum Information About a Microarray Experiment guidelines (Brazma et al., 2001), was appended to the Gene Expression Omnibus1 (GEO; The National Center for Biotechnology Information), platform GPL4067, under series accession number GSE27032.
Florescence values from 14 microarray hybridizations (three biological replicates from each macroelement-limited condition and one technical replicate each for the N and S limitations) were normalized globally, as in Rinta-Kanto et al. (2010). Data for the technical replicates were averaged and combined (Figure A1 in Appendix). Spearman rank correlation coefficients between replicate arrays ranged between 0.82 and 0.96, while those between arrays from different treatments were ≤0.80 (Table A2 in Appendix). The exception was between P and S limitation arrays, for which the correlation coefficients ranged between 0.71 and 0.85 (Table A2 in Appendix). Statistical analysis was performed in MultiExperiment Viewer2 (MeV, Dana-Farber Cancer Institute, Boston, MA, USA; Saeed et al., 2006). Significance analysis of microarray (SAM; Tusher et al., 2001), available through the MeV interface, was used for statistical analysis. Pairwise comparisons were made between treatments, with the following settings: two-class unpaired, 5,000 permutations, and false discovery rate (FDR; Tusher et al., 2001) ≤2%. Pairwise SAM analyses were performed as follows: C limitation compared to C excess conditions (where N, P, or S was limiting); N limitation compared to N excess conditions (where C, P, or S was limiting); P limitation compared to P excess conditions (where N, C, or S was limiting); and S limitation compared to S excess conditions (where N, C, or P were limiting; Figure A1 in Appendix).
Transcriptionally responsive genes were identified as those with a ≥3-fold enrichment in all three pairwise comparisons across treatments (Figure A1 in Appendix). Four genes (SPO0968, SPO1031, SPO1795, and SPO3300) were transcriptionally enriched under one treatment but transcriptionally depleted under another, due to different responses of two probes for a single gene; these were not considered further. Designation of enriched or depleted genes was conservative. In many cases genes had significant responses in two out of three pairwise comparisons or had a ≥2-fold (but ≤3-fold) transcriptional change, but they were not considered further.
Gene Annotation and Metabolic Pathway Construction
Ruegeria pomeroyi DSS-3 gene products were generally assigned according to the annotations in GenBank (Accession number NC_003911.11) with updated gene calls as appropriate (SPO0781, phnD; SPO1948, pstS; SPO1979, OlsA-like protein; SPO1980, OlsB-like protein; SPO0372 and SPO2287, LuxI-type proteins). Operons were as predicted in Roseobase3, and metabolic pathways were constructed manually from BioCyc4 (SRI International, Menlo Park, CA, USA). For analysis of the global ocean sampling (GOS) metagenome (Rusch et al., 2007; Yooseph et al., 2007; data obtained from Community Cyberinfrastructure for Advanced Microbial Ecology Research and Analysis5), BLASTp was used to identify homologous sequences using an E-value of <10−5. The percent of bacterioplankton cells in GOS samples (as of May 2011; Sargasso Sea, northwest Atlantic, Pacific, and Indian Ocean sequences; Rusch et al., 2007; Yooseph et al., 2007) harboring a homolog was calculated as (number of homologs × 100)/number of recA, assuming only one homolog and one recA per genome and 10,196 recA homologs in the analyzed portion of the GOS dataset (Moran et al., 2011). For analysis of other microbial genomes, BLASTp was used to identify homologs using an E-value < 10−30. In both cases, candidate homologs were subjected to phylogenetic analysis using pplacer (Matsen et al., 2010) to confirm homology with genes of known function.
Cell Stoichiometry
The stoichiometry rules that best reproduced observed C:N:P ratios under elemental limitation were explored. A simple model that assumed limitation shifted the concentration of the limiting element away from the concentration found under balanced growth (when all elements are available in non-limiting conditions) by a factor α, while the other two (non-limiting) elements were unaffected by the limitation gave the best fit to the observed C:N:P ratios. Thus the C:N:P ratio for R. pomeroyi under balanced growth conditions was approximated as:
where αX is the factor by which element X changes when it is limiting, and C X , N X , and P X are the C, N, and P content, respectively, under limiting element X.
Results and Discussion
Attributes of Steady-State Cultures
Measurements of cell-free spent media indicated that limiting elements were below the detection limit while non-limiting elements were in excess for chemostat-grown R. pomeroyi DSS-3 (Table 1). Cell dry weights for the C, N, and S treatments averaged 486 fg cell−1, similar to those reported for heterotrophic marine bacteria during exponential growth (322–512 fg cell−1, Vrede et al., 2002; Table A3 in Appendix), but P-limited cells had an unusually high dry weight (1,388 fg cell−1). C-limited cells were smaller and had higher growth efficiency (i.e., amount of new bacterial biomass produced per unit of organic C assimilated) than N-, P-, or S- limited cells (31 versus 1–8%; Table 1). By way of comparison, del Giorgio and Cole (1998) report 9–47% bacterial growth efficiencies (interquartile range) for heterotrophic bacteria in oceans and estuaries. The protein: dry weight ratio of S-limited cells was atypically high, likely reflecting an unnatural condition for marine bacterioplankton. Molar C:N ratios in biomass varied up to 2.5-fold and C:P ratios varied up to sixfold among the different limiting element regimes (Table 1).
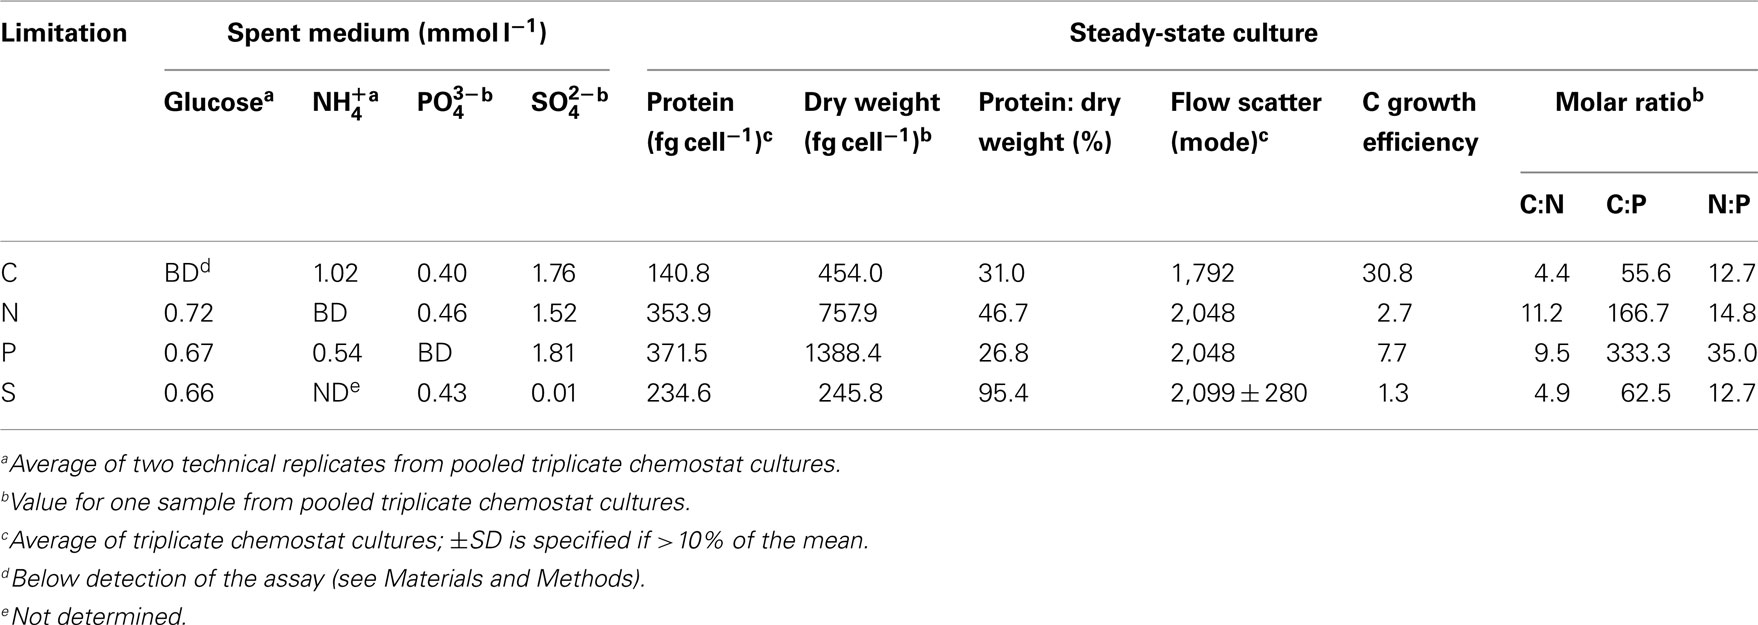
Table 1. Biological and chemical status of R. pomeroy i DSS-3 chemostat cultures.
Transcripts for 190 genes (4.5% of the 4,252 genes in the R. pomeroyi DSS-3 genome) were responsive exclusively to C, N, P, or S limitation, with 134 genes enriched (3.2%) and 56 genes depleted (1.3%; Figure A1 in Appendix; see Tables A4 and A5 in Appendix for a complete list of significantly enriched and depleted genes).
Transcriptional Response to C Limitation
The C-limited transcriptome was enriched in transporters for dicarboxylic acids, peptides, branched-chain amino acids, sugars, and glycine betaine/proline (Table 2), indicating increased investment in substrate acquisition. Several cell division transcripts were also present in higher proportion, including those for a chromosome initiation replication protein (dnaA), DNA helicase (recQ), DNA polymerase, and a purine biosynthesis enzyme (hisF; Table 2), coinciding with the smaller and more numerous cells observed under C limitation (Table 1). Transcripts for the rod shape-determining mreD, a mutated version of which causes Escherichia coli cells to take on a spherical shape (Wachi et al., 1989), were depleted (Table 2). Spherical shape and small cell size are characteristic of marine bacterioplankton in oligotrophic conditions, and are hypothesized to afford a more favorable surface-to-volume ratio to compete for scarce substrates (Azam et al., 1983). Relative increases in transcripts for three proteins involved in flagellum synthesis indicated increased motility of C-limited cells. Together, these changes represent a strong C scavenging response by C-limited R. pomeroyi cells.
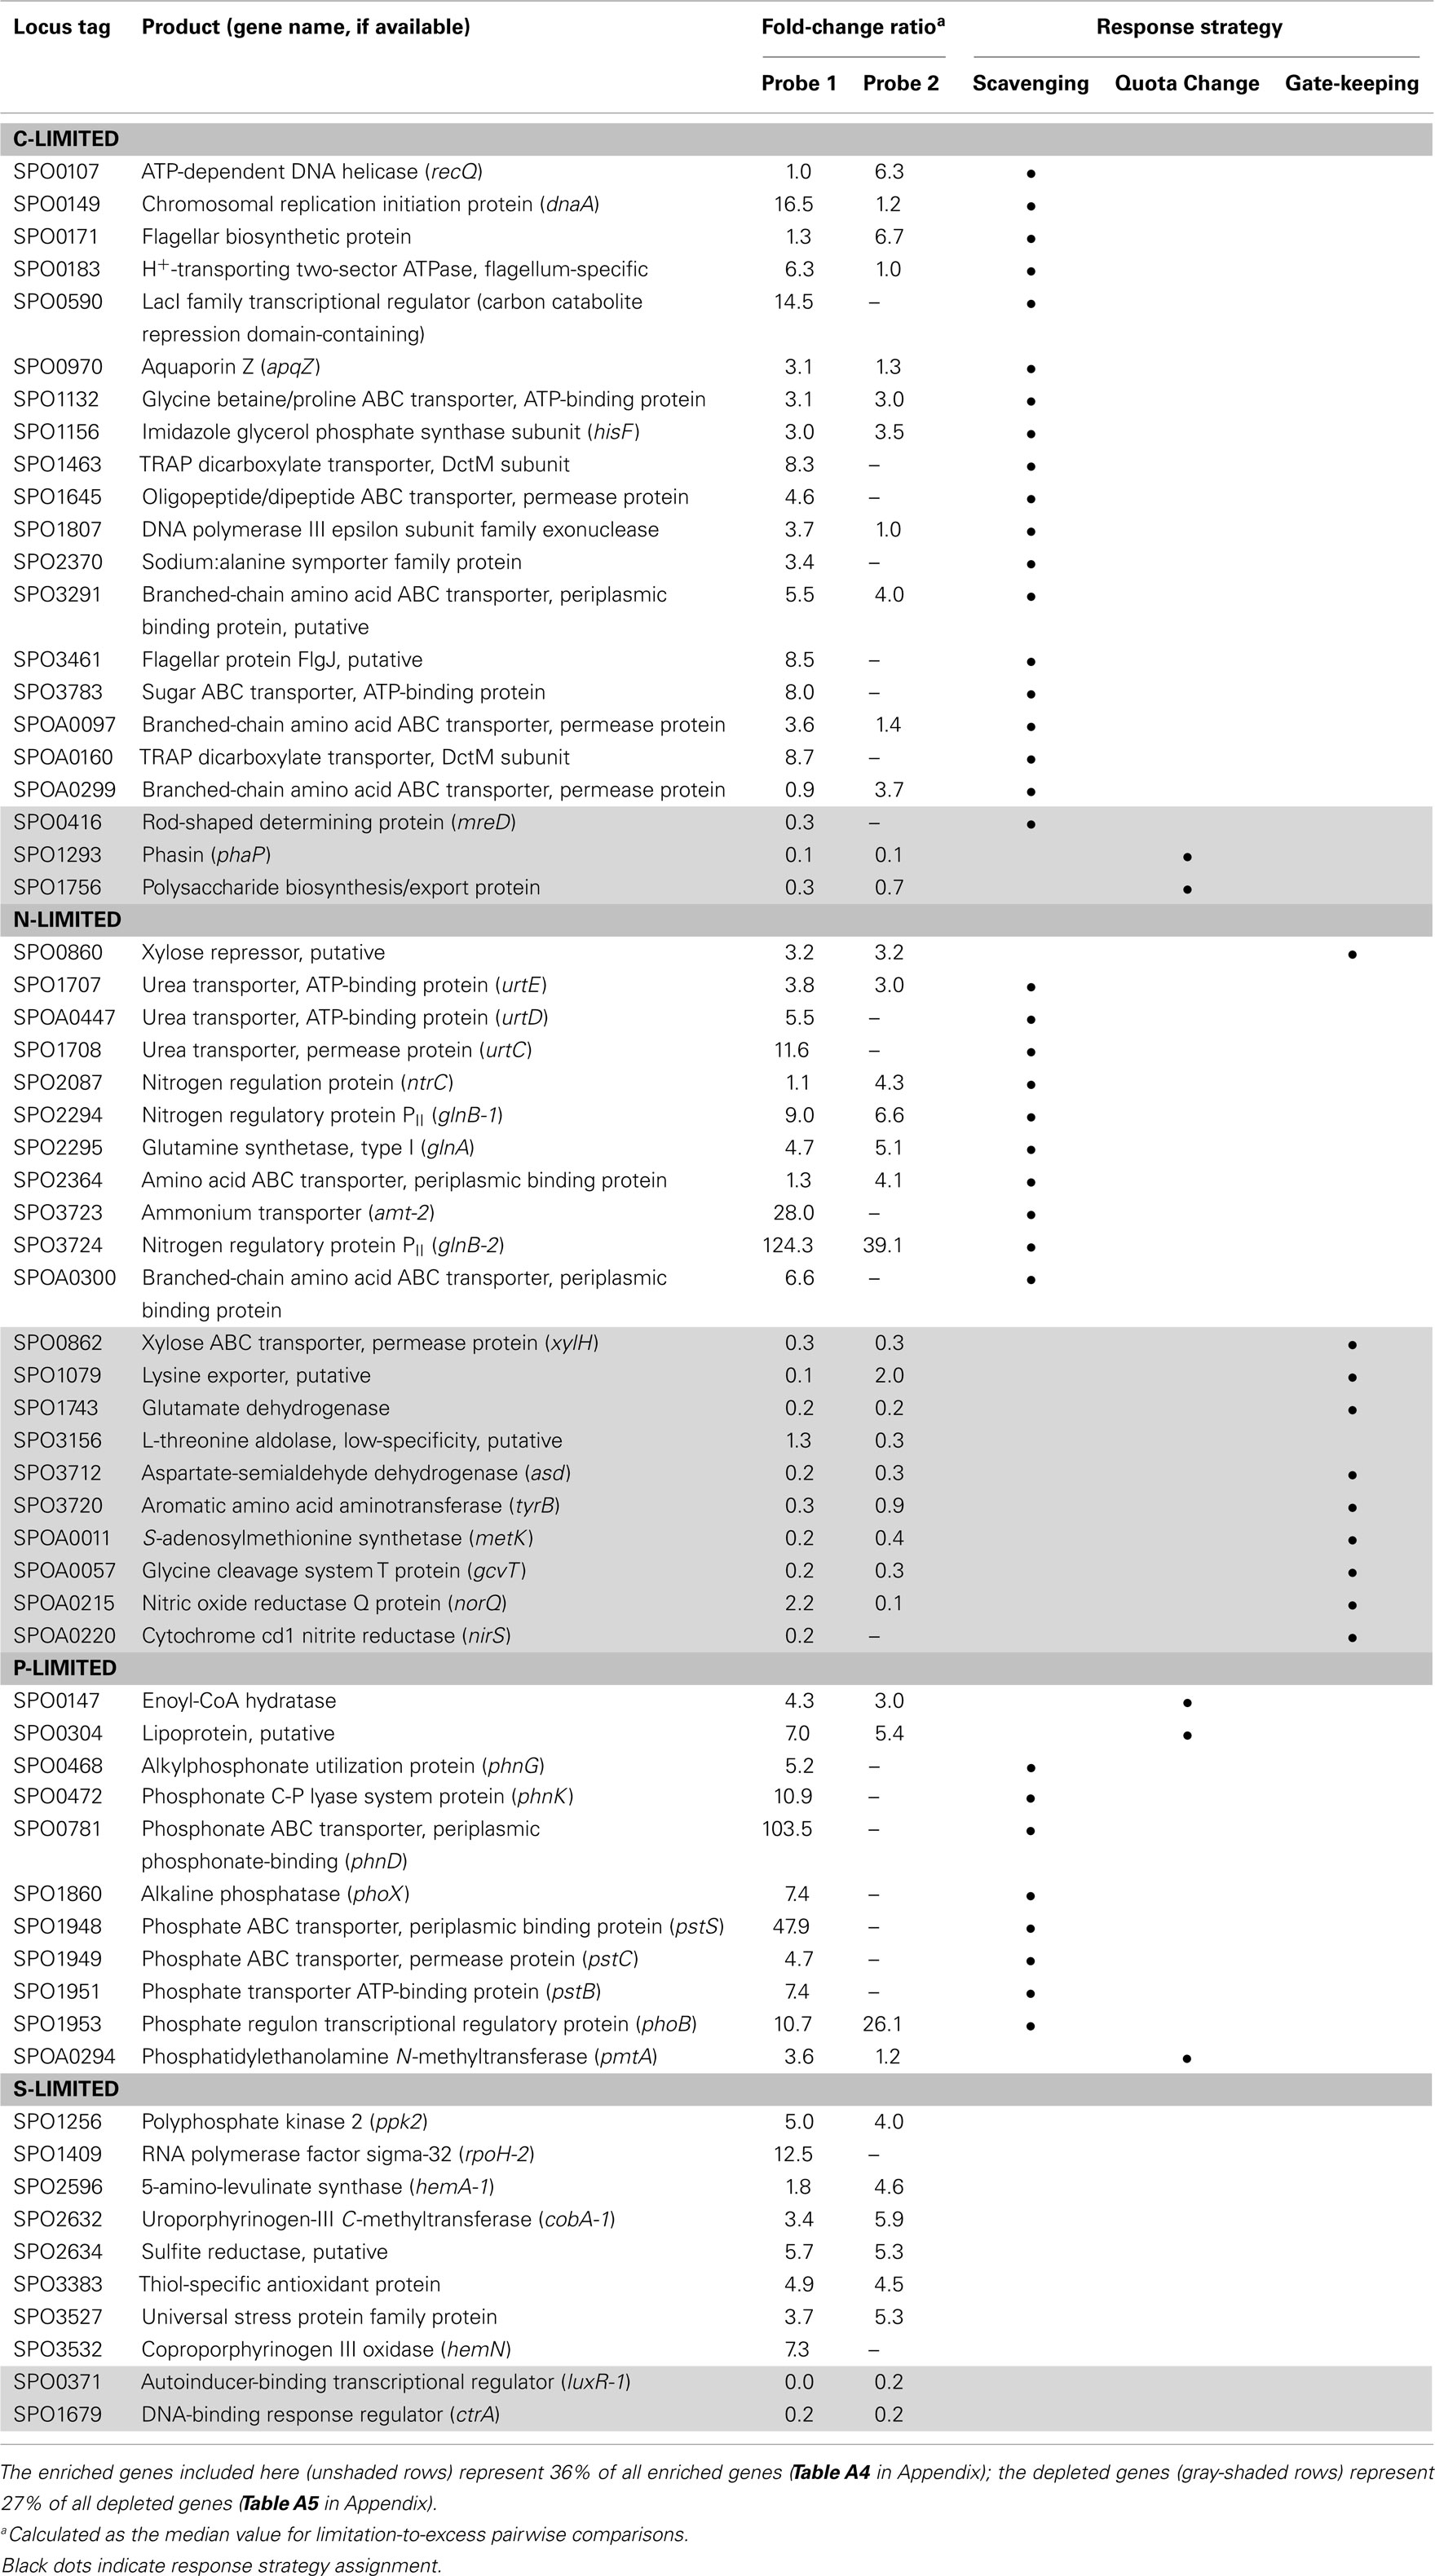
Table 2. Selected R. pomeroyi DSS-3 genes responding uniquely to a C-, N-, P-, or S-limited regime.
In the C-limited cultures, the R. pomeroyi transcriptome was depleted in transcripts encoding the synthesis and export of high C-content surface-associated polysaccharides, a strategy that would lower the cellular C quota (Table 2). Transcripts for phasin (phaP), a protein that binds to the surface of C storage inclusions composed of polyhydroxyalkanoate (PHA; Anderson and Dawes, 1990), were depleted (Table 2), indicating degradation of internal C reservoirs. Other genes involved in PHA metabolism (phbA, phbB, phaZ, phaR) did not have altered transcription levels (Figure A2 in Appendix), but this is consistent with data from the related alphaproteobacterium Rhodobacter capsulatus showing PHA synthesis genes to be constitutively expressed, with control occurring post-translationally (Kranz et al., 1997). Since PHA storage molecules have been observed in R. pomeroyi cells (González et al., 2003) and can occupy 40–50% of cell volume in some C-replete bacteria (Yurkov, 2006), this finding coincides with the smaller cell size observed under C limitation (Table 1). Together, this set of transcriptional changes comprise strategies for a reduced cell quota for C.
Transcriptional Response to N Limitation
N limitation induced a strong scavenging response for acquiring available N compounds mediated through a conserved bacterial regulatory system involving PII regulators (glnB-1 and glnB-2) and the N response regulator NtrC (Ikeda et al., 1996; Gyaneshwar et al., 2005; Walter et al., 2007; Table 2). Two genes previously found to be controlled by these regulators in E. coli (Zimmer et al., 2000; Gyaneshwar et al., 2005) were also part of the R. pomeroyi scavenging response: an ammonium transporter (amt-2, located adjacent to glnB-2) and a glutamine synthetase (glnA, mediating ammonium incorporation; located adjacent to glnB-1). Two other N scavenging activities included enrichment of transcripts for urea transport and amino acid transport (Table 2).
There was no evidence of a role for N storage compounds in the R. pomeroyi response to N limitation. The genome does not contain homologs to the genes required for synthesis of cyanophycin granule polypeptide (CGP), the only known bacterial mechanism for N storage (Füser and Steinbüchel, 2007). Instead, transcriptional responses focused on tightening of the import/export balance of N through better “gate-keeping.” In one response, depletion of a xylose ABC transporter (xylH) and enrichment of a putative xylose uptake repressor (Table 2) would work to decrease the import of high C:N content carbohydrates. In another, depletion of transcripts for a putative lysine exporter (Table 2) involved in cytoplasmic amino acid regulation (Vrljic et al., 1999) would suppress the export of low C:N content amino acids. Two genes mediating dissimilatory nitrite reduction (norQ and nirS, which are part of a partial denitrification pathway; Moran et al., 2004) were also depleted (Table 2), suggesting another mechanism for N retention through a decrease in N-based respiration. The underrepresentation of transcripts for amino acid metabolism, including glutamate dehydrogenase, threonine aldolase, asd (aspartate-semialdehyde dehydrogenase), metK (S-adenosylmethionine synthetase), tyrB (aromatic amino acid aminotransferase), and gcvT (glycine cleavage system T protein; Table 2) was consistent with the substantial change in free amino acid concentrations observed under N-limited conditions (0.5% of cell N content compared to 1.3 and 4.2% under C and P limitation; Table A6 in Appendix), suggesting a reallocation of cytoplasmic N. Collectively, the transcriptional data support strong N homeostasis as the major response to N limitation, enabled through intense scavenging and tighter controls over N import/export and cytoplasmic pools.
Transcriptional Response to P Limitation
A phoB-mediated response involving scavenging for inorganic and organic sources of P dominated the P-limited transcriptome (Table 2). Transcripts were enriched for transport or utilization of phosphate (pstB, -C, -S; Yuan et al., 2006), phosphonate (phnD, -G, and -K; Metcalf and Wanner, 1991; Parker et al., 1999), and phosphate esters (phoX; Sebastian and Ammerman, 2011; Table 2). While inorganic P storage is common among bacteria, R. pomeroyi does not have a close homolog to the widespread P storage enzyme polyphosphate kinase I (ppk1; Newton et al., 2010) or to 1,3-diphosphoglycerate-polyphosphate phosphotransferase or polyphosphate:AMP-phosphotransferase (Kulaev et al., 1971; Ishige and Noguchi, 2000). It has been suggested that SPO0224 functions as a ppk1 in R. pomeroyi (Nahálka and Pätoprstý, 2009), but neither that gene nor the two ppk2 genes purported to degrade polyphosphates (SPOP1256 and SPO1727; Nahálka and Pätoprstý, 2009) were transcriptionally modified under P limitation. Instead, there was evidence for lowering the P cell quota by reworking of membrane phospholipids, including enrichment of transcripts for an enoyl-CoA hydratase mediating fatty acid degradation, a phosphatidyl ethanolamine N-methyltransferase (pmtA), and a lipoprotein likely representing a membrane-bound degradative enzyme or stress sensor (Table 2; Figure A3 in Appendix). R. pomeroyi possesses genes for the synthesis of ornithine-containing lipids (olsAB-like genes), which incorporate N rather than P into lipid membranes. The transcription of olsB was highest under P limitation (Figure A3 in Appendix), although the probes did not meet the significance cut off of ≥3-fold. These genes are important under P limitation in closely related Alphaproteobacteria (Weissenmayer et al., 2002; Gao et al., 2004) and in marine bacterioplankton communities (Van Mooy et al., 2009), and we leave open the possibility that this pathway is involved in P content reworking in R. pomeroyi.
Transcriptional Response to S Limitation
Unlike responses to C, N, and P limitation, none of the 21 transcriptionally responsive genes to S limitation were indicative of scavenging (Tables A4 and A5 in Appendix). Instead, response took the form of increased relative expression of enzymes requiring S-containing substrates or cofactors (Figure A4 in Appendix). Changes in transcript abundance for the synthesis of 5-amino-levulinate (hemA-1), protoporphyrinogen IX (hemN), sirohydrochlorin (cobA-1), and the quorum sensor regulator luxR-1 (Table 2; Figure A4 in Appendix) may all be linked to a depleted pool of S-adenosyl-methionine (Figure A4 in Appendix). Evidence for a cellular stress response was strongest under S limitation, and this included enrichment of transcripts for a thiol-containing antioxidant protein, a universal stress protein, and a σ32 factor (rpoH-2), along with the gene ppk2 (Table A4 in Appendix), which degrades polyphosphate to GTP and is implicated in bacterial stress responses (Brown and Kornberg, 2008; Gangaiah et al., 2010).
The S-limited transcriptome provided a useful perspective on transcriptional responses to limitation by an element that is not naturally limiting in the ocean (seawater SO4 concentrations are ∼28 mmol l−1) and therefore for which there is little selective pressure to evolve responses to scarcity. The biasing of the S-limited transcriptome toward biosynthetic pathways with depleted end products, while a successful strategy for addressing metabolic imbalances in bacteria (Goyal et al., 2010), cannot solve a cell-wide elemental deficit. In E. coli, scavenging responses occur through the CysB system that upregulates transporters for sulfate, cysteine, and alternate sources of S (Gyaneshwar et al., 2005). However, the R. pomeroyi DSS-3 genome does not contain a CysB ortholog.
The fact that S limitation was the only condition that did not invoke a scavenging response for obtaining more of the limiting element indicates that transcriptional regulation in R. pomeroyi is not evolutionarily attuned for S limitation. By analogy, the absence of an N storage response may indicate that conditions under which excess N is available for transport and storage by bacterioplankton are rare in the ocean. Indeed, a search of the marine bacterioplankton genes captured in the Global Ocean Sampling (GOS) dataset (Rusch et al., 2007; Yooseph et al., 2007) indicated that fewer than 3% of surface ocean bacterioplankton have homologs for cysB. Similarly, fewer than 1% of bacterioplankton carry homologs for either of the two genes required for N storage (CPG synthetase and cyanophycinase; Table A7 in Appendix). Transcriptional responses of R. pomeroyi may therefore provide insights into the role of seawater chemistry in molding the evolution of marine bacterioplankton genome content.
Explaining Cell Stoichiometry Changes
To link transcriptional responses to cell stoichiometry under different element limitations, we estimated the composition of R. pomeroyi biomass under balanced growth (i.e., when all elements are available in excess and the C:N:P ratio is optimal); this is the conceptual starting point from which the cells’ transcriptional responses produced the observed element-limited ratios (Table 1). The simplest model, one in which C:N:P ratios under element limitation are reached through a proportional change in only the limiting element, fit our data well. This does not necessarily require that C, N, and P are unlinked in the cell, but rather that the net result of resource limitation is a decrease in only the limiting element, where αX is the factor by which element X (C, N, or P) changes when it is limiting. The best solution to the elemental ratio data emerged with a C:N:P of ∼154:15:1 under balanced growth (Figure 1). From this initial ratio, C-limited cells (56:13:1; Table 1) would have undergone a relative C decrease to 38% of balanced growth levels (αC = 1/0.38), P-limited cells (333:35:1) would have undergone a relative P decrease to 40% of balanced growth (αP = 1/0.4), but N-limited cells (167:15:1) would have undergone almost no change in N content (αN = 1/1.0; Figure 1).
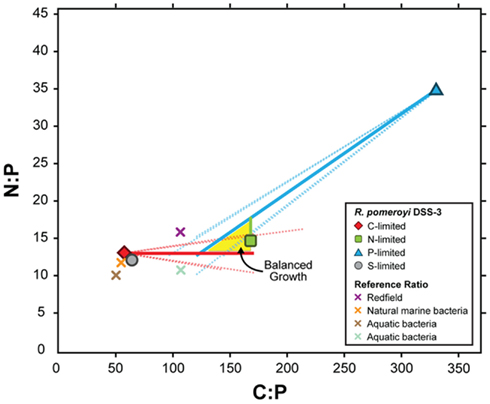
Figure 1. Modeled C:P and N:P atomic ratios of R. pomeroyi DSS-3 cells over a range of depletion factors (α) for the limiting element (see Materials and Methods). The model assumes that limitation decreases the concentration of the limiting element relative to its value under balanced growth by a factor α, but the non-limiting elements are not affected. Measured C:N:P ratios in the element-limited chemostats are shown as symbols with bold borders, and modeled balanced growth ratios assuming different values of α are shown as solid lines. Dotted lines show elemental ratios if one of the non-limiting elements also changes during limitation, but by a factor 10-fold less than for the limiting element. The region where the three lines intersect (yellow shading) indicates the simultaneous solution for the C:N:P ratio (∼154:15:1). Other plotted C:P and N:P ratios are as follows: gray circle with black border, S-limited R. pomeroyi DSS-3 cells; purple X, Redfield ratio (Redfield, 1934); orange X, marine bacteria (Cotner et al., 1997); brown X, aquatic bacteria (Fagerbakke et al., 1996); blue X, freshwater bacteria (Cotner et al., 2010).
The transcriptional changes in R. pomeroyi strongly support this model. Only the C- and P-limited cells exhibited reworking strategies to decrease cell quotas (degradation of stored reserves, decreases in production or secretion of extracellular products, restructuring of membranes; Table 2). Only the N-limited cells showed a substantial gate-keeping response and tightening of control over cytoplasmic pools (Table 2). It is not yet evident whether strong N homeostasis compared to C and P is a feature that can be generalized to other heterotrophic marine bacterioplankton, although R. pomeroyi represents a ubiquitous bacterial taxon in surface ocean waters (Moran et al., 2004) and its growth rate in the continuous cultures was within the range measured for marine bacterioplankton in situ (Ducklow and Hill, 1985; Whitman et al., 1998). Four unidentified marine bacterial isolates studied by Vrede et al. (2002) did not show a similar N homeostasis (Figure A5 in Appendix), although they were not grown in continuous culture. Elemental ratios measured for natural bacterioplankton typically do not fall within the balanced growth region for R. pomeroyi (Figure 1) and are a better match to the ratios found under C limitation, suggesting that marine bacteria may be most often C-limited in the ocean.
A central concept in stoichiometric ecology is that growth rate changes drive differences in biomass elemental composition through shifts in the content of P-rich RNA (Sterner et al., 2008). For marine microbes, this growth rate hypothesis (GRH) will be most relevant when bacterioplankton are growing at different rates, such as during phytoplankton blooms or mixing events relative to non-bloom conditions or dormancy. By comparison, R. pomeroyi was studied under constant growth rate but differing stoichiometry of external resources, a scenario more relevant when the element limiting heterotrophic growth varies over time or space (e.g., Thingstad, 1987; Kirchman, 1990; Pomeroy et al., 1995; Cherrier et al., 1996; Cotner et al., 1997; Kirchman and Rich, 1997; Zohary and Robarts, 1998; Torréton et al., 2000; Van Wambeke et al., 2002; Obernosterer et al., 2003; Thingstad et al., 2005). In exploring stoichiometric changes predicted under the GRH, Loladze and Elser (2011) calculated a microbial protein:rRNA ratio of 3 under optimal growth conditions (cellular N:P ratio = 16). Our balanced growth-stoichiometry calculation for R. pomeroyi agrees with this (N:P ratio = 15; Figure 1). Under non-optimal conditions however, which are commonplace in the ocean, transcriptional responses of heterotrophic bacteria can drive biomass C:N:P ratios from this ideal value through physiological mechanisms that store certain elements when available in excess and strongly retain others when scarce. The consistency of transcriptional reactions among the diverse taxa that make up marine bacterial assemblages will determine the aggregate community response to element limitation in the ocean (Hall et al., 2011; Scott et al., 2012).
Conclusion
Bacterioplankton transcriptional changes reveal the cellular basis for biomass stoichiometry outcomes whose effects are manifested at the ecosystem level. Flexible biomass ratios provide a buffer in the development of nutrient limitation (Thingstad et al., 2008) and, at least in the short term, delay intensification of bacterial–phytoplankton competition. Stoichiometric flexibility also broadens the range of C:N:P ratios in bacterial biomass produced in ocean surface waters, with consequences for basin-scale differences in particulate material and sequestration of organic matter deviating from Redfield proportions (Geider and La Roche, 2002; Hessen et al., 2004; Sterner et al., 2008; Weber and Deutsch, 2010). For model marine heterotrophic bacterium R. pomeroyi, cellular biomass ratios reflect a net transcriptional balance between element scavenging responses, gate-keeping activities, and cell quota changes, with the balance between these expression responses dictated by which element is limiting its growth.
Conflict of Interest Statement
The authors declare that the research was conducted in the absence of any commercial or financial relationships that could be construed as a potential conflict of interest.
Acknowledgments
This work was supported by a grant from the Gordon and Betty Moore Foundation and the National Science Foundation (OCE-0724017). We thank J. Rinta-Kanto for advice on microarray analysis, C. Reisch and W. Whitman for guidance on chemostat setup, Y. Liu for advice on amino acid analysis, and C. English for graphics assistance.
Footnotes
References
Anderson, A. J., and Dawes, E. A. (1990). Occurrence, metabolism, metabolic role, and industrial uses of bacterial polyhydroxyalkanoates. Microbiol. Rev. 54, 450–472.
Azam, F., Fenchel, T., Field, J. G., Gray, J. S., Meyer-Reil, L. A., and Thingstad, F. (1983). The ecological role of water-column microbes in the sea. Mar. Ecol. Prog. Ser. 10, 257–263.
Bradford, M. M. (1976). A rapid and sensitive method for the quantitation of microgram quantities of protein utilizing the principle of protein-dye binding. Anal. Biochem. 72, 248–254.
Brazma, A., Hingamp, P., Quackenbush, J., Sherlock, G., Spellman, P., Stoeckert, C., Aach, J., Ansorge, W., Ball, C. A., Causton, H. C., Gaasterland, T., Glenisson, P., Holstege, F. C., Kim, I. F., Markowitz, V., Matese, J. C., Parkinson, H., Robinson, A., Sarkans, U., Schulze-Kremer, S., Stewart, J., Taylor, R., Vilo, J., and Vingron, M. (2001). Minimum information about a microarray experiment (MIAME)-toward standards for microarray data. Nat. Genet. 29, 365–371.
Brown, M. R., and Kornberg, A. (2008). The long and short of it- polyphosphate, PPK and bacterial survival. Trends Biochem. Sci. 33, 284–290.
Bürgmann, H., Howard, E. C., Ye, W., Sun, F., Sun, S., Napierala, S., and Moran, M. A. (2007). Transcriptional response of Silicibacter pomeroyi DSS-3 to dimethylsulfoniopropionate (DMSP). Environ. Microbiol. 9, 2742–2755.
Cherrier, J., Bauer, J. E., and Druffel, E. R. M. (1996). Utilization and turnover of labile dissolved organic matter by bacterial heterotrophs in eastern north Pacific surface waters. Mar. Ecol. Prog. Ser. 139, 267–279.
Cotner, J. B., Ammerman, J. W., Peele, E. R., and Bentzen, E. (1997). Phosphorus-limited bacterioplankton growth in the Sargasso Sea. Aquat. Microb. Ecol. 13, 141–149.
Cotner, J. B., Hall, E. K., Scott, J. T., and Heldal, M. (2010). Freshwater bacteria are stoichiometrically flexible with a nutrient composition similar to seston. Front. Microbiol. 1:132. doi:10.3389/fmicb.2010.00132
Dawes, E. A., and Senior, P. J. (1973). The role and regulation of energy reserve polymers in micro-organisms. Adv. Microb. Physiol. 10, 135–266.
del Giorgio, P. A., and Cole, J. J. (1998). Bacterial growth efficiency in natural aquatic systems. Annu. Rev. Ecol. Syst. 29, 503–541.
Ducklow, H. W., and Hill, S. M. (1985). The growth of heterotrophic bacteria in the surface waters of warm core rings. Limnol. Oceanogr. 30, 239–259.
Elser, J. J., Dobberfuhl, D. R., MacKay, N. A., and Schampel, J. H. (1996). Organism size, life history, and N:P stoichiometry. Bioscience 46, 674–684.
Elser, J. J., Stabler, L. B., and Hassett, R. P. (1995). Nutrient limitation of bacterial-growth and rates of bacterivory in lakes and oceans: a comparative study. Aquat. Microb. Ecol. 9, 105–110.
Fagerbakke, K. M., Heldal, M., and Norland, S. (1996). Content of carbon, nitrogen, oxygen, sulfur and phosphorus in native aquatic and cultured bacteria. Aquat. Microb. Ecol. 10, 15–27.
Ferenci, T. (2008). Bacterial physiology, regulation and mutational adaptation in a chemostat environment. Adv. Microb. Physiol. 53, 169–229.
Franklin, O., Hall, E. K., Kaiser, C., Richter, A., and Battin, T. (2011). Optimization of biomass composition explains microbial growth-stoichiometry relationships. Am. Nat. 177, E29–E42.
Füser, G., and Steinbüchel, A. (2007). Analysis of genome sequences for genes of cyanophycin metabolism: identifying putative cyanophycin metabolizing prokaryotes. Macromol. Biosci. 7, 278–296.
Gangaiah, D., Liu, Z., Arcos, J., Kassem, I. I., Sanad, Y., Torrelles, J. B., and Rajashekara, G. (2010). Polyphosphate kinase 2: a novel determinant of stress responses and pathogenesis in Campylobacter jejuni. PLoS ONE 5, e12142. doi:10.1371/journal.pone.0012142
Gao, J. L., Weissenmayer, B., Taylor, A. M., Thomas-Oates, J., López-Lara, I. M., and Geiger, O. (2004). Identification of a gene required for the formation of lyso-ornithine lipid, an intermediate in the biosynthesis of ornithine-containing lipids. Mol. Microbiol. 53, 1757–1770.
Geider, R. J., and La Roche, J. (2002). Redfield revisited: variability of C:N:P in marine microalgae and its biochemical basis. Eur. J. Phycol. 37, 1–17.
Goldman, J. C., Caron, D. A., and Dennett, M. R. (1987). Regulation of gross growth efficiency and ammonium regeneration in bacteria by substrate C:N ratio. Limnol. Oceanogr. 32, 1239–1252.
González, J. M., Covert, J. S., Whitman, W. B., Henriksen, J. R., Mayer, F., Scharf, B., Schmitt, R., Buchan, A., Fuhrman, J. A., Kiene, R. P., and Moran, M. A. (2003). Silicibacter pomeroyi sp. nov. and Roseovarius nubinhibens sp. nov., dimethylsulfoniopropionate-demethylating bacteria from marine environments. Int. J. Syst. Evol. Microbiol. 53, 1261–1269.
Goyal, S., Yuan, J., Chen, T., Rabinowitz, J. D., and Wingreen, N. S. (2010). Achieving optimal growth through product feedback inhibition in metabolism. PLoS Comput. Biol. 6, e1000802. doi:10.1371/journal.pcbi.1000802
Gundersen, K., Heldal, M., Purdie, D. A., and Knap, A. H. (2002). Elemental C, N, and P cell content of individual bacteria collected at the Bermuda Atlantic Time-series Study (BATS) site. Limnol. Oceanogr. 47, 1525–1530.
Gyaneshwar, P., Paliy, O., McAuliffe, J., Popham, D. L., Jordan, M. I., and Kustu, S. (2005). Sulfur and nitrogen limitation in Escherichia coli K-12: specific homeostatic responses. J. Bacteriol. 187, 1074–1090.
Hall, E. K., Maixner, F., Franklin, O., Daims, H., Richter, A., and Battin, T. (2011). Linking microbial and ecosystem ecology using ecological stoichiometry: a synthesis of conceptual and empirical approaches. Ecosystems 14, 261–273.
Harder, W., and Dijkhuizen, L. (1983). Physiological responses to nutrient limitation. Annu. Rev. Microbiol. 37, 1–23.
Hendrickson, E. L., Liu, Y., Rosas-Sandoval, G., Porat, I., Söll, D., Whitman, W. B., and Leigh, J. A. (2008). Global responses of Methanococcus maripaludis to specific nutrient limitations and growth rate. J. Bacteriol. 190, 2198–2205.
Henriksen, J. R. (2008). Physiology of Dimethylsulfoniopropionate Metabolism in a Model Marine Roseobacter, Silicibacter pomeroyi. Ph.D. thesis, University of Georgia, Athens, GA, USA.
Hessen, D. O., Agren, G. I., Anderson, T. R., Elser, J. J., and De Ruiter, P. C. (2004). Carbon sequestration in ecosystems: the role of stoichiometry. Ecology 85, 1179–1192.
Ikeda, T. P., Shauger, A. E., and Kustu, S. (1996). Salmonella typhimurium apparently perceives external nitrogen limitation as internal glutamine limitation. J. Mol. Biol. 259, 589–607.
Ishige, K., and Noguchi, T. (2000). Inorganic polyphosphate kinase and adenylate kinase participate in the polyphosphate:AMP phosphotransferase activity of Escherichia coli. Proc. Natl. Acad. Sci. U.S.A. 97, 14168–14171.
Kirchman, D., and Rich, J. (1997). Regulation of bacterial growth rates by dissolved organic carbon and temperature in the Equatorial Pacific Ocean. Microb. Ecol. 33, 11–20.
Kirchman, D. L. (1990). Limitation of bacterial growth by dissolved organic matter in the subartic Pacific. Mar. Ecol. Prog. Ser. 62, 47–54.
Kornberg, A. (1999). Inorganic polyphosphate: a molecule of many functions. Prog. Mol. Subcell. Biol. 23, 1–18.
Kranz, R. G., Gabbert, K. K., Locke, T. A., and Madigan, M. T. (1997). Polyhydroxyalkanoate production in Rhodobacter capsulatus: genes, mutants, expression, and physiology. Appl. Environ. Microbiol. 63, 3003–3009.
Kulaev, I. S., Bobyk, M. A., Nikolaev, N. N., Sergeev, N. S., and Uryson, S. O. (1971). Polyphosphate synthesizing enzymes in some fungi and bacteria. Biochemistry 36, 791–796.
Loladze, I., and Elser, J. J. (2011). The origins of the Redfield nitrogen-to-phosphorus ratio are in a homoeostatic protein-to-rRNA ratio. Ecol. Lett. 14, 244–250.
Martinussen, I., and Thingstad, T. F. (1987). Utilization of organic N, organic P and organic C by heterotrophic bacteria. 2. Comparison of experiments and a mathematical model. Mar. Ecol. Prog. Ser. 37, 285–293.
Matsen, F. A., Kodner, R. B., and Armbrust, E. V. (2010). Pplacer: linear time maximum-likelihood and Bayesian phylogenetic placement of sequences onto a fixed reference tree. BMC Bioinformatics 11, 538. doi:10.1186/1471-2105-11-538
Metcalf, W. W., and Wanner, B. L. (1991). Involvement of the Escherichia coli phn (psiD) gene cluster in assimilation of phosphorus in the form of phosphonates, phosphite, Pi esters, and Pi. J. Bacteriol. 173, 587–600.
Moran, M. A., Buchan, A., González, J. M., Heidelberg, J. F., Whitman, W. B., Kiene, R. P., Henriksen, J. R., King, G. M., Belas, R., Fuqua, C., Brinkac, L., Lewis, M., Johri, S., Weaver, B., Pai, G., Eisen, J. A., Rahe, E., Sheldon, W. M., Ye, W., Miller, T. R., Carlton, J., Rasko, D. A., Paulsen, I. T., Ren, Q., Daugherty, S. C., Deboy, R. T., Dodson, R. J., Durkin, A. S., Madupu, R., Nelson, W. C., Sullivan, S. A., Rosovitz, M. J., Haft, D. H., Selengut, J., and Ward, N. (2004). Genome sequence of Silicibacter pomeroyi reveals adaptations to the marine environment. Nature 432, 910–913.
Moran, M. A., Reisch, C. R., Kiene, R. P., and Whitman, W. B. (2011). Genomic insights into bacterial DMSP transformations. Ann. Rev. Mar. Sci. 4, 523–542.
Nahálka, J., and Pätoprstý, V. (2009). Enzymatic synthesis of sialylation substrates powered by a novel polyphosphate kinase (PPK3). Org. Biomol. Chem. 7, 1778–1780.
Newton, R. J., Griffin, L. E., Bowles, K. M., Meile, C., Gifford, S., Givens, C. E., Howard, E. C., King, E., Oakley, C. A., Reisch, C. R., Rinta-Kanto, J. M., Sharma, S., Sun, S., Varaljay, V., Vila-Costa, M., Westrich, J. R., and Moran, M. A. (2010). Genome characteristics of a generalist marine bacterial lineage. ISME J. 4, 784–798.
Obernosterer, I., Kawasaki, N., and Benner, R. (2003). P-limitation of respiration in the Sargasso Sea and uncoupling of bacteria from P-regeneration in size-fractionation. Aquat. Microb. Ecol. 32, 229–237.
Parker, G. F., Higgins, T. P., Hawkes, T., and Robson, R. L. (1999). Rhizobium (Sinorhizobium) meliloti phn genes: characterization and identification of their protein products. J. Bacteriol. 181, 389–395.
Pomeroy, L. R., Sheldon, J. E., Sheldon, W. M. J., and Peters, F. (1995). Limits to growth and respiration of bacterioplankton in the Gulf of Mexico. Mar. Ecol. Prog. Ser. 117, 259–268.
Poretsky, R. S., Gifford, S. M., Rinta-Kanto, J. M., Vila-Costa, M., and Moran, M. A. (2009). Analyzing gene expression from marine microbial communities using environmental transcriptomics. J. Vis. Exp. 24:e1086. doi:10.3791/1086
Redfield, A. C. (1934). “On the proportions of organic derivations in seawater and their relation to the composition of plankton,” in James Johnstone Memorial Volume, ed. Daniel (Liverpool: University Press), 177–192.
Rinta-Kanto, J. M., Bürgmann, H., Gifford, S. M., Sun, S., Sharma, S., del Valle, D. A., Kiene, R. P., and Moran, M. A. (2010). Analysis of sulfur-related transcription by Roseobacter communities using a taxon-specific functional gene microarray. Environ. Microbiol. 13, 453–467.
Rivkin, R. B., and Anderson, M. R. (1997). Inorganic nutrient limitation of oceanic bacterioplankton. Limnol. Oceanogr. 42, 730–740.
Rusch, D. B., Halpern, A. L., Sutton, G., Heidelberg, K. B., Williamson, S., Yooseph, S., Wu, D., Eisen, J. A., Hoffman, J. M., Remington, K., Beeson, K., Tran, B., Smith, H., Baden-Tillson, H., Stewart, C., Thorpe, J., Freeman, J., Andrews-Pfannkoch, C., Venter, J. E., Li, K., Kravitz, S., Heidelberg, J. F., Utterback, T., Rogers, Y. H., Falcón, L. I., Souza, V., Bonilla-Rosso, G., Eguiarte, L. E., Karl, D. M., Sathyendranath, S., Platt, T., Bermingham, E., Gallardo, V., Tamayo-Castillo, G., Ferrari, M. R., Strausberg, R. L., Nealson, K., Friedman, R., Frazier, M., and Venter, J. C. (2007). The Sorcerer II Global Ocean Sampling expedition: Northwest Atlantic through Eastern Tropical Pacific. PLoS Biol. 5, 77. doi:10.1371/journal.pbio.0050077
Saeed, A. I., Bhagabati, N. K., Braisted, J. C., Liang, W., Sharov, V., Howe, E. A., Li, J., Thiagarajan, M., White, J. A., and Quackenbush, J. (2006). TM4 microarray software suite. Meth. Enzymol. 411, 134–193.
Scott, J. T., Cotner, J. B., and LaPara, T. M. (2012). Variable stoichiometry and homeostatic regulation of bacterial biomass elemental composition. Front. Microbiol. 3:42. doi:10.3389/fmicb.2012.00042
Sebastian, M., and Ammerman, J. W. (2011). Role of the phosphatase PhoX in the phosphorus metabolism of the marine bacterium Ruegeria pomeroyi DSS-3. Environ. Microbiol. Rep. 3, 535–542.
Solorzano, L. (1969). Determination of ammonia in natural waters by the phenolhypochlorite method. Limnol. Oceanogr. 14, 799–801.
Sterner, R. W., Andersen, T., Elser, J. J., Hessen, D. O., Hood, J. M., McCauley, E., and Urabe, J. (2008). Scale-dependent carbon: nitrogen: phosphorus seston stoichiometry in marine and freshwaters. Limnol. Oceanogr. 53, 1169–1180.
Strickland, J. D. H., and Parsons, T. R. (1972). A Practical Handbook of Seawater Analysis, 2nd Edn. Ottawa: Fish Res Board Can.
Tezuka, Y. (1990). Bacterial regeneration of ammonium and phosphate as affected by the carbon:nitrogen:phosphorus ratio of organic substrates. Microb. Ecol. 19, 227–238.
Thingstad, T. F. (1987). Utilization of N, P, and organic C by heterotrophic bacteria. 1. Outline of a chemostat theory with a consistent concept of maintenance metabolism. Mar. Ecol. Prog. Ser. 35, 99–109.
Thingstad, T. F., Bellerby, R. G., Bratbak, G., Børsheim, K. Y., Egge, J. K., Heldal, M., Larsen, A., Neill, C., Nejstgaard, J., Norland, S., Sandaa, R.-A., Skjoldal, E. F., Tanaka, T., Thyrhaug, R., and Töpper, B. (2008). Counterintuitive carbon-to-nutrient coupling in an Arctic pelagic ecosystem. Nature 455, 387–390.
Thingstad, T. F., Krom, M. D., Mantoura, R. F., Flaten, G. A., Groom, S., Herut, B., Kress, N., Law, C. S., Pasternak, A., Pitta, P., Psarra, S., Rassoulzadegan, F., Tanaka, T., Tselepides, A., Wassmann, P., Woodward, E. M. S., Wexels Riser, C., Zodiatis, G., and Zohary, T. (2005). Nature of phosphorus limitation in the ultraoligotrophic eastern Mediterranean. Science 309, 1068–1071.
Torréton, J. P., Talbot, V., and Garcia, N. (2000). Nutrient stimulation of bacterioplankton growth in Tuamotu atoll lagoons. Aquat. Microb. Ecol. 21, 125–137.
Tusher, V. G., Tibshirani, R., and Chu, G. (2001). Significance analysis of microarrays applied to the ionizing radiation response. Proc. Natl. Acad. Sci. U.S.A. 98, 5116–5121.
Van Mooy, B. A., Fredricks, H. F., Pedler, B. E., Dyhrman, S. T., Karl, D. M., Koblizek, M., Lomas, M. W., Mincer, T. J., Moore, L. R., Moutin, T., Rappé, M. S., and Webb, E. A. (2009). Phytoplankton in the ocean use non-phosphorus lipids in response to phosphorus scarcity. Nature 458, 69–72.
Van Wambeke, F., Christaki, U., Giannakourou, A., Moutin, T., and Souvemerzoglou, K. (2002). Longitudinal and vertical trends of bacterial limitation by phosphorus and carbon in the Mediterranean Sea. Microb. Ecol. 43, 119–133.
Vrede, K., Heldal, M., Norland, S., and Bratbak, G. (2002). Elemental composition (C, N, P) and cell volume of exponentially growing and nutrient-limited bacterioplankton. Appl. Environ. Microbiol. 68, 2965–2971.
Vrljic, M., Garg, J., Bellmann, A., Wachi, S., Freudl, R., Malecki, M. J., Sahm, H., Kozina, V. J., Eggeling, L., Saier, M. H. Jr., Eggeling, L., and Saier, M. H. Jr. (1999). The LysE superfamily: topology of the lysine exporter LysE of Corynebacterium glutamicum, a paradigm for a novel superfamily of transmembrane solute translocators. J. Mol. Microbiol. Biotechnol. 1, 327–336.
Wachi, M., Doi, M., Okada, Y., and Matsuhashi, M. (1989). New mre genes mreC and mreD, responsible for formation of the rod shape of Escherichia coli cells. J. Bacteriol. 171, 6511–6516.
Walter, B., Hänssler, E., Kalinowski, J., and Burkovski, A. (2007). Nitrogen metabolism and nitrogen control in corynebacteria: variations of a common theme. J. Mol. Microbiol. Biotechnol. 12, 131–138.
Weber, T. S., and Deutsch, C. (2010). Ocean nutrient ratios governed by plankton biogeography. Nature 467, 550–554.
Weissenmayer, B., Gao, J. L., López-Lara, I. M., and Geiger, O. (2002). Identification of a gene required for the biosynthesis of ornithine-derived lipids. Mol. Microbiol. 45, 721–733.
Whitman, W. B., Coleman, D. C., and Wiebe, W. J. (1998). Prokaryotes: the unseen majority. Proc. Natl. Acad. Sci. U.S.A. 95, 6578–6583.
Yooseph, S., Sutton, G., Rusch, D. B., Halpern, A. L., Williamson, S. J., Remington, K., Eisen, J. A., Heidelberg, K. B., Manning, G., Li, W., Jaroszewski, L., Cieplak, P., Miller, C. S., Li, H., Mashiyama, S. T., Joachimiak, M. P., van Belle, C., Chandonia, J. M., Soergel, D. A., Zhai, Y., Natarajan, K., Lee, S., Raphael, B. J., Bafna, V., Friedman, R., Brenner, S. E., Godzik, A., Eisenberg, D., Dixon, J. E., Taylor, S. S., Strausberg, R. L., Frazier, M., and Venter, J. C. (2007). The Sorcerer II Global Ocean Sampling expedition: expanding the universe of protein families. PLoS Biol. 5, e16. doi:10.1371/journal.pbio.0050016
Yuan, Z. C., Zaheer, R., and Finan, T. M. (2006). Regulation and properties of PstSCAB, a high-affinity, high-velocity phosphate transport system of Sinorhizobium meliloti. J. Bacteriol. 188, 1089–1102.
Yurkov, V. V. (2006). “Aerobic phototrophic proteobacteria,” in The Prokaryotes, 3rd Edn, eds M. Dworkin, S. Falkow, E. Rosenberg, K.-H. Schleifer, and E. Stachebrandt (Singapore: Springer Science and Business Media, LLC), 562–584.
Zimmer, D. P., Soupene, E., Lee, H. L., Wendisch, V. F., Khodursky, A. B., Peter, B. J., Bender, R. A., and Kustu, S. (2000). Nitrogen regulatory protein C-controlled genes of Escherichia coli: scavenging as a defense against nitrogen limitation. Proc. Natl. Acad. Sci. U.S.A. 97, 14674–14679.
Zohary, T., and Robarts, R. D. (1998). Experimental study of microbial P limitation in the eastern Mediterranean. Limnol. Oceanogr. 43, 387–395.
Appendix
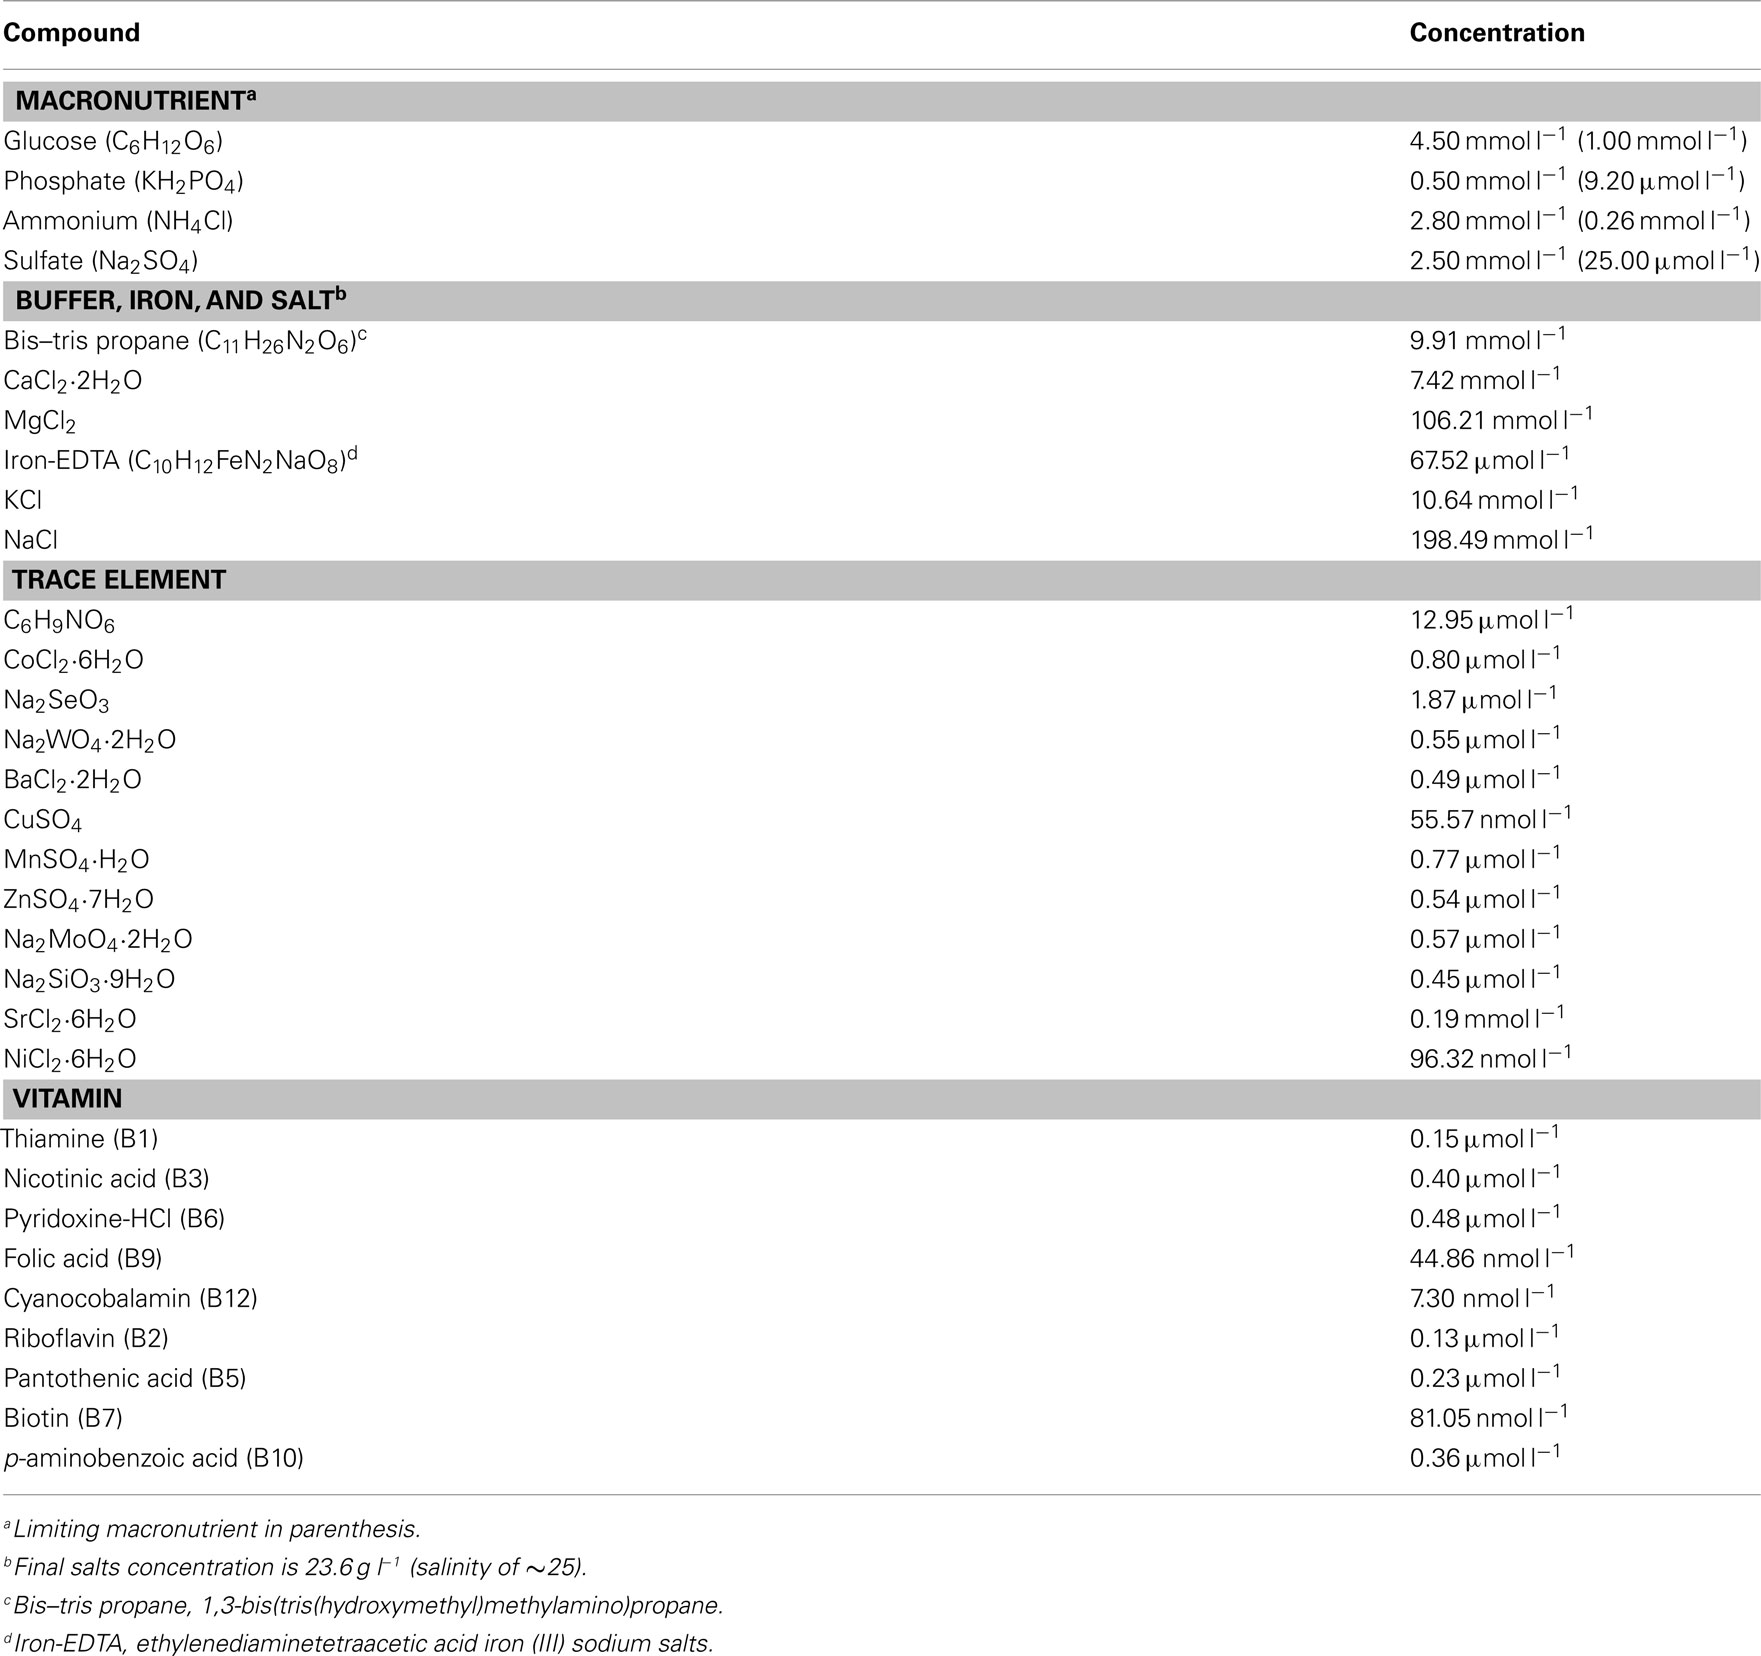
Table A1. Chemostat culture medium.
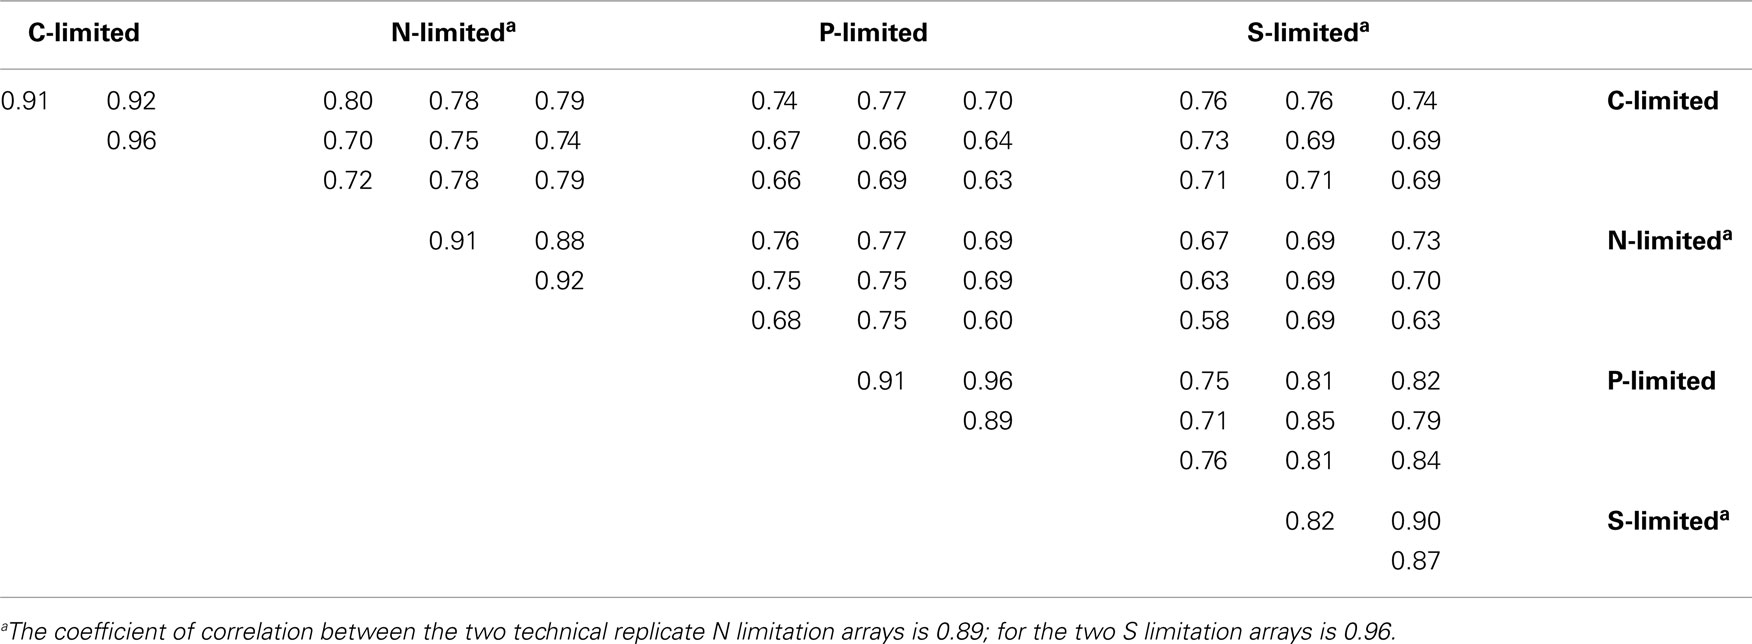
Table A2. Spearman’s rank correlation coefficients of the normalized fluorescence values in 5,145 probes between replicate arrays.
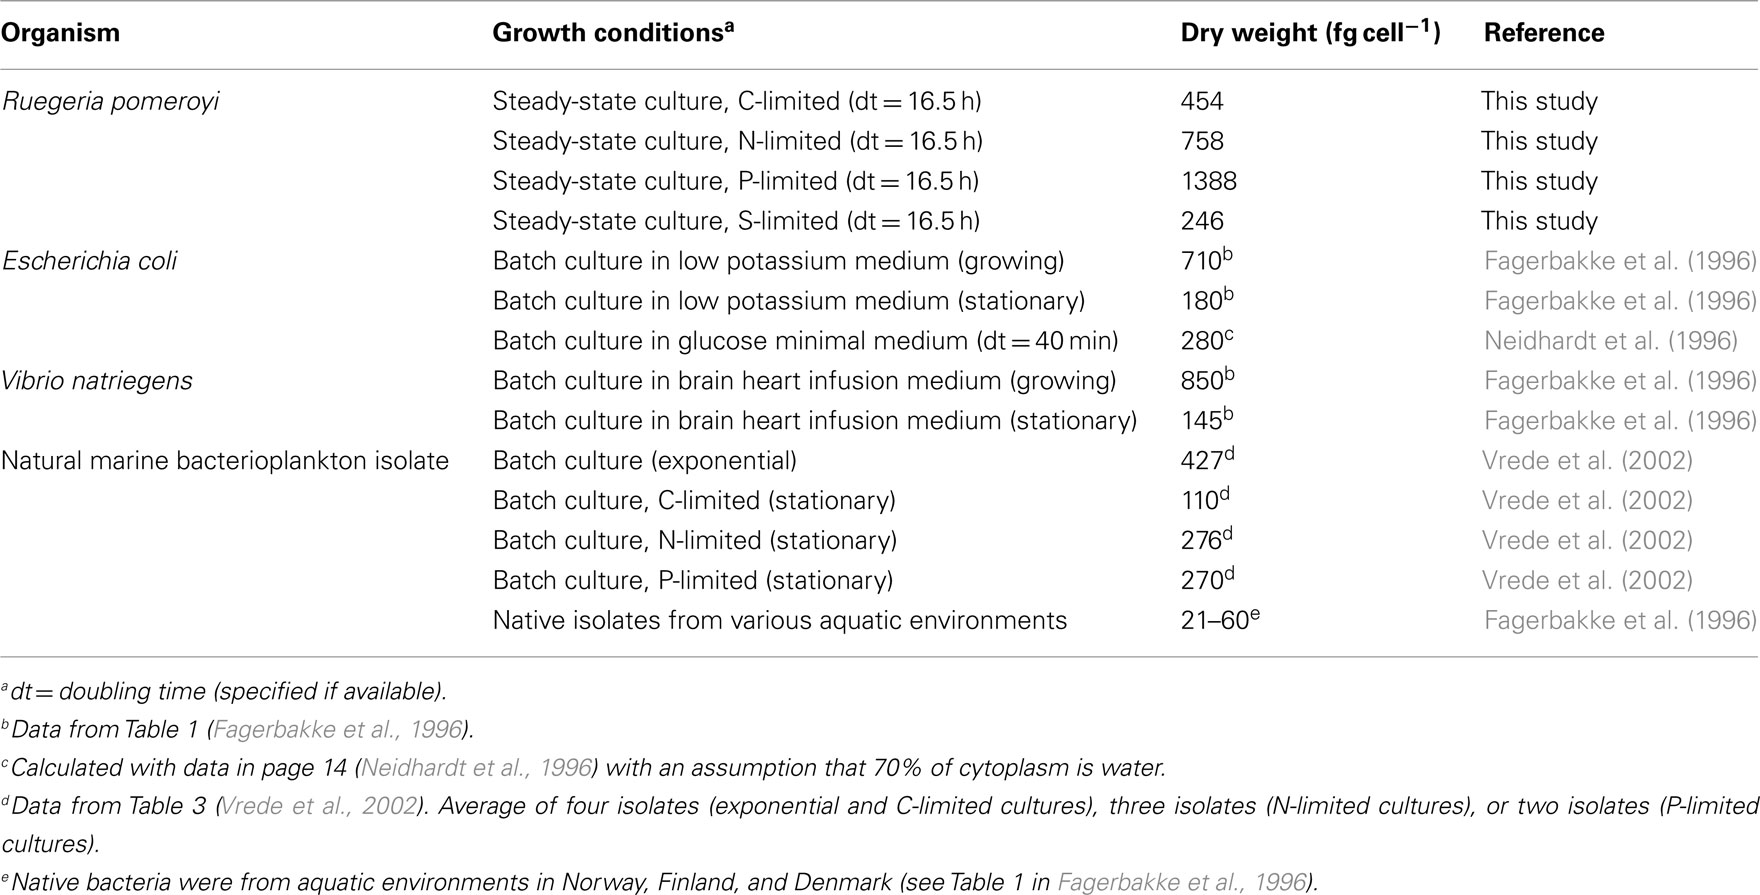
Table A3. Bacterial dry weights.
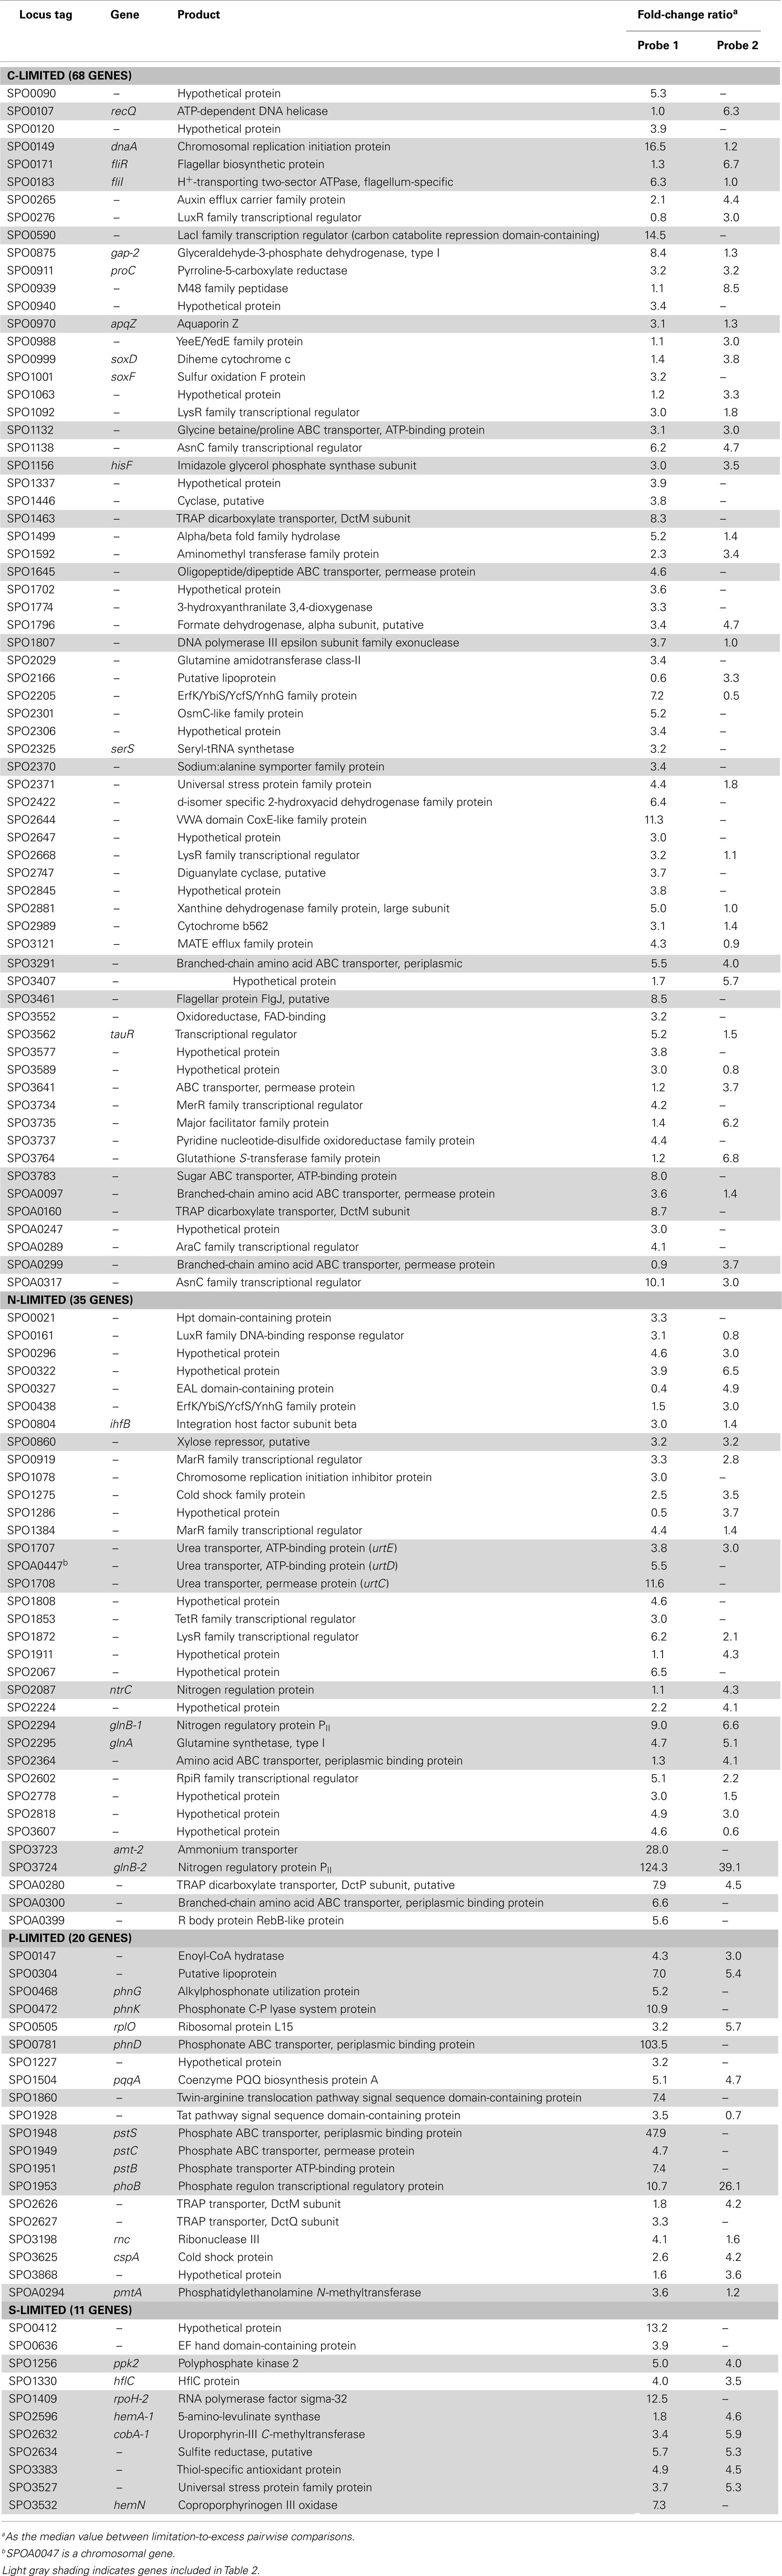
Table A4. Transcriptionally enriched R. pomeroy i DSS-3 genes.
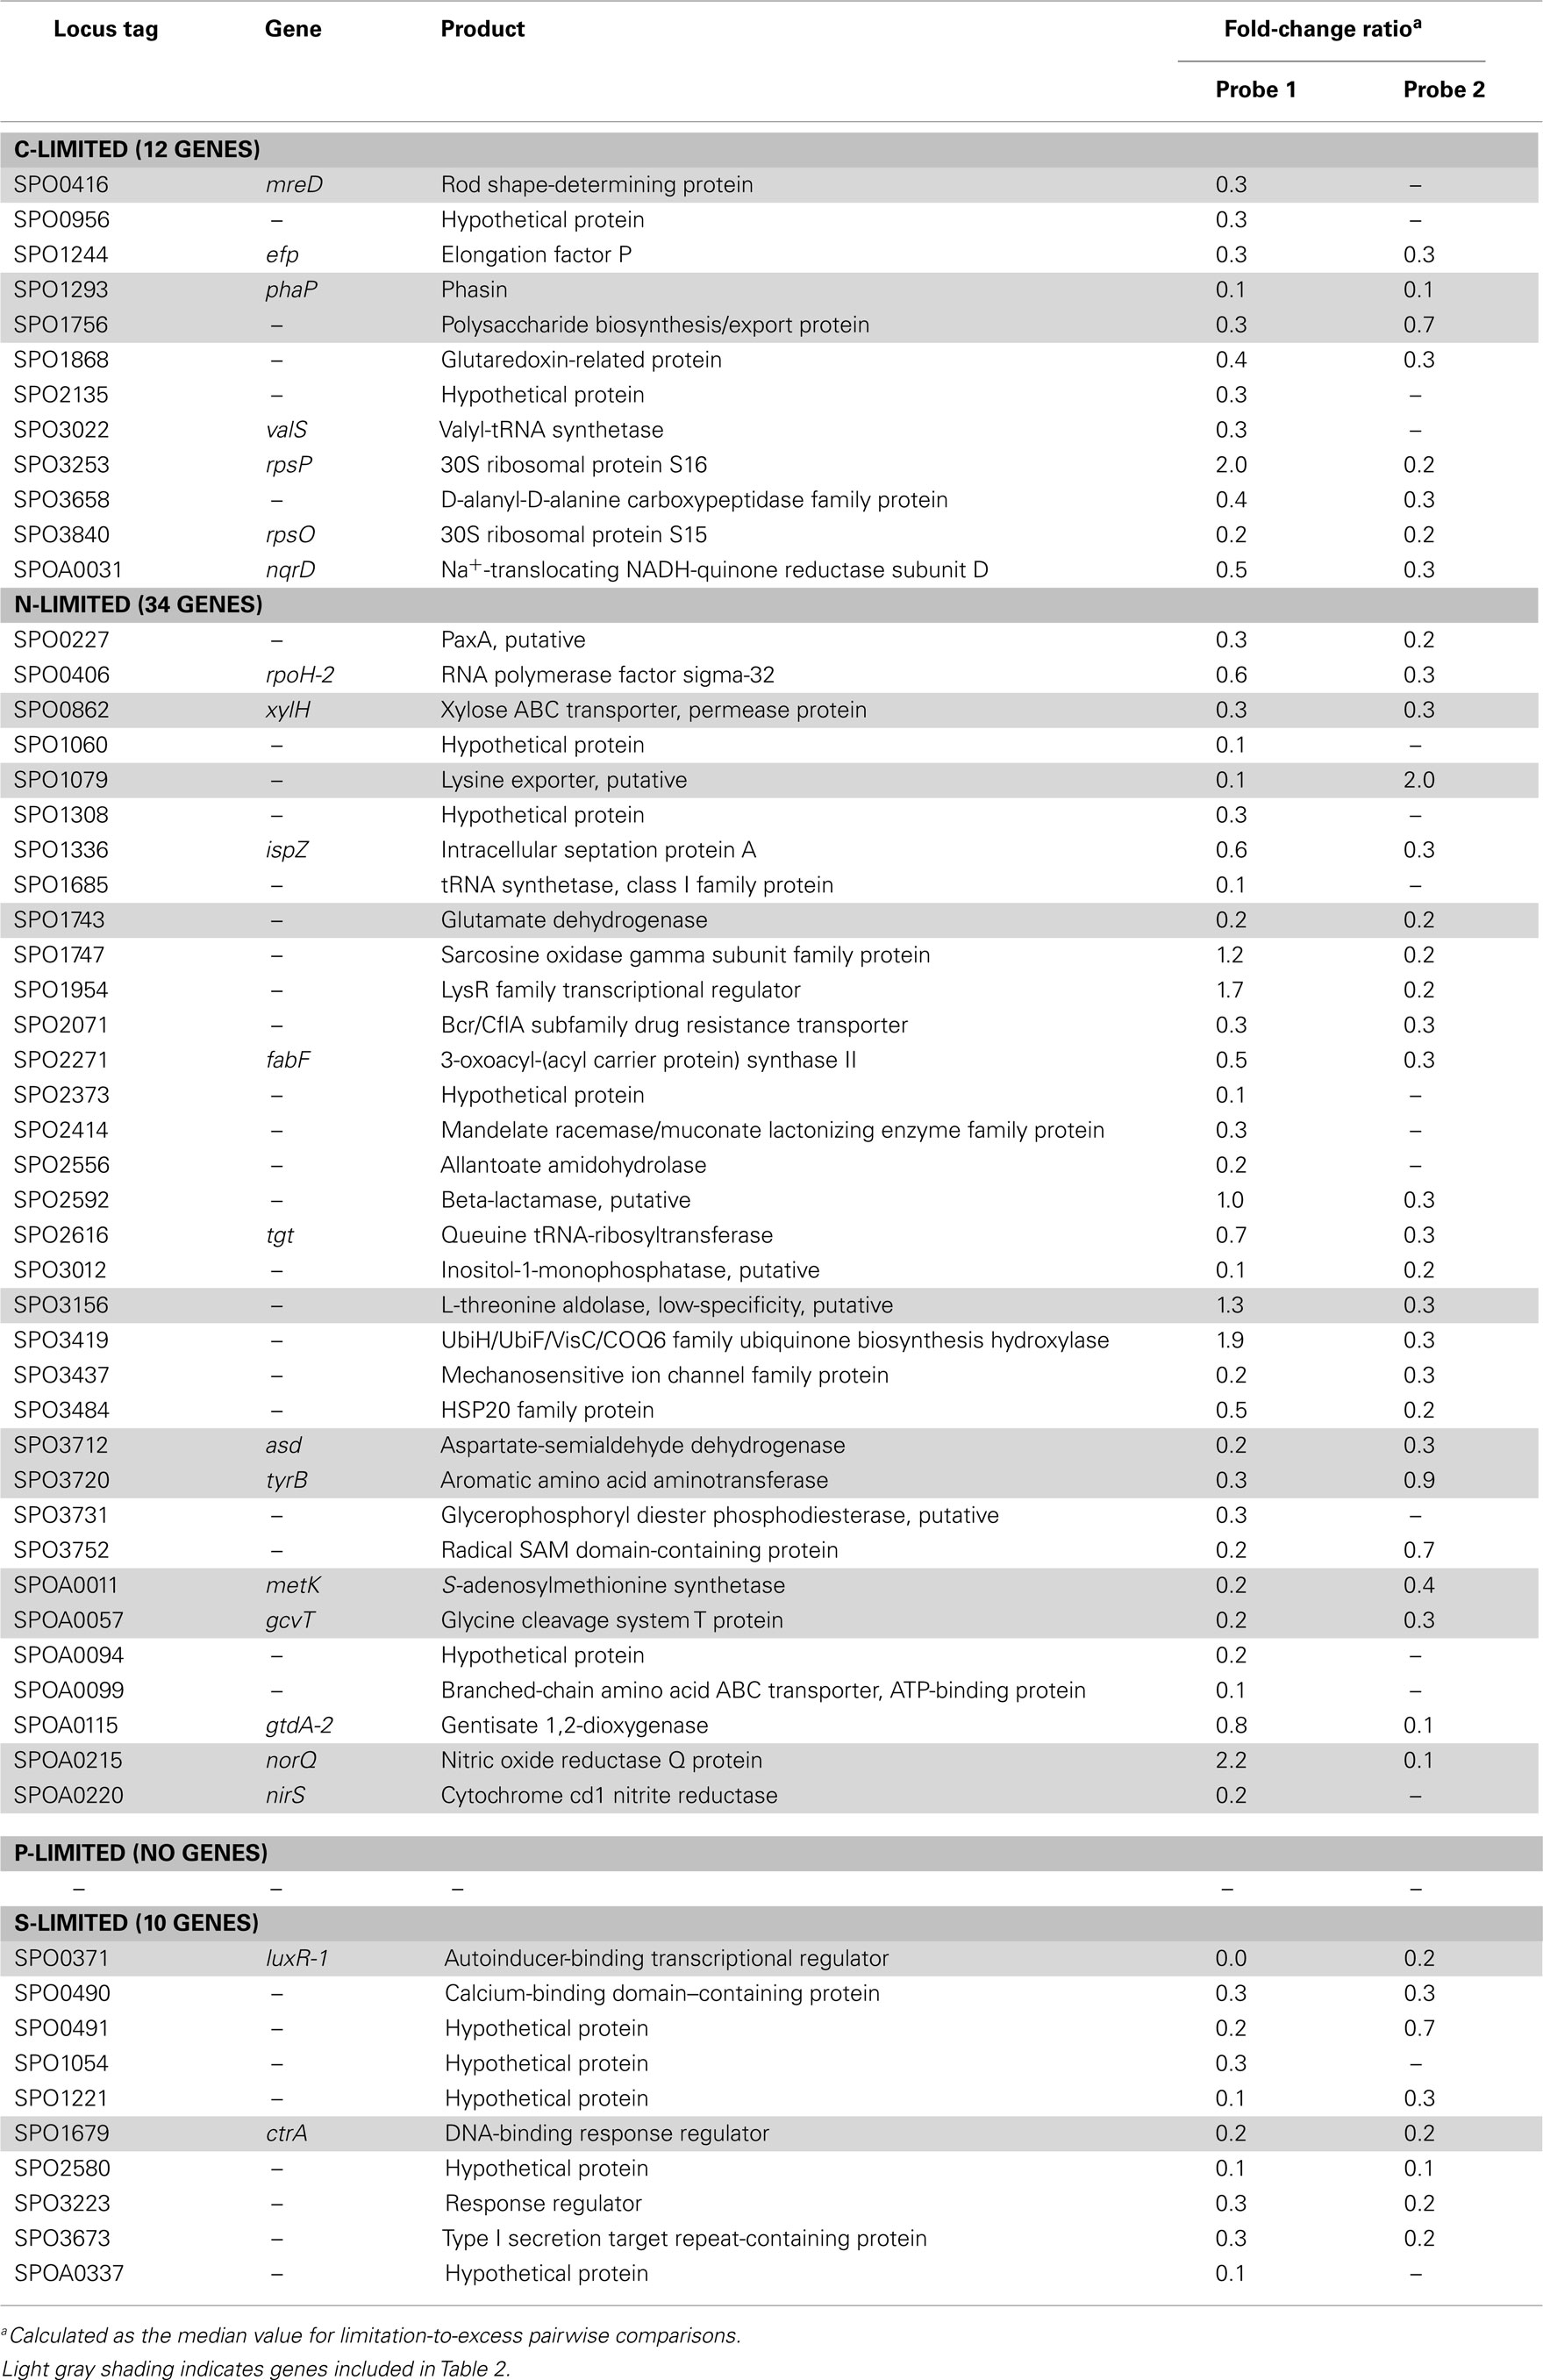
Table A5. Transcriptionally depleted R. pomeroy i DSS-3 genes.
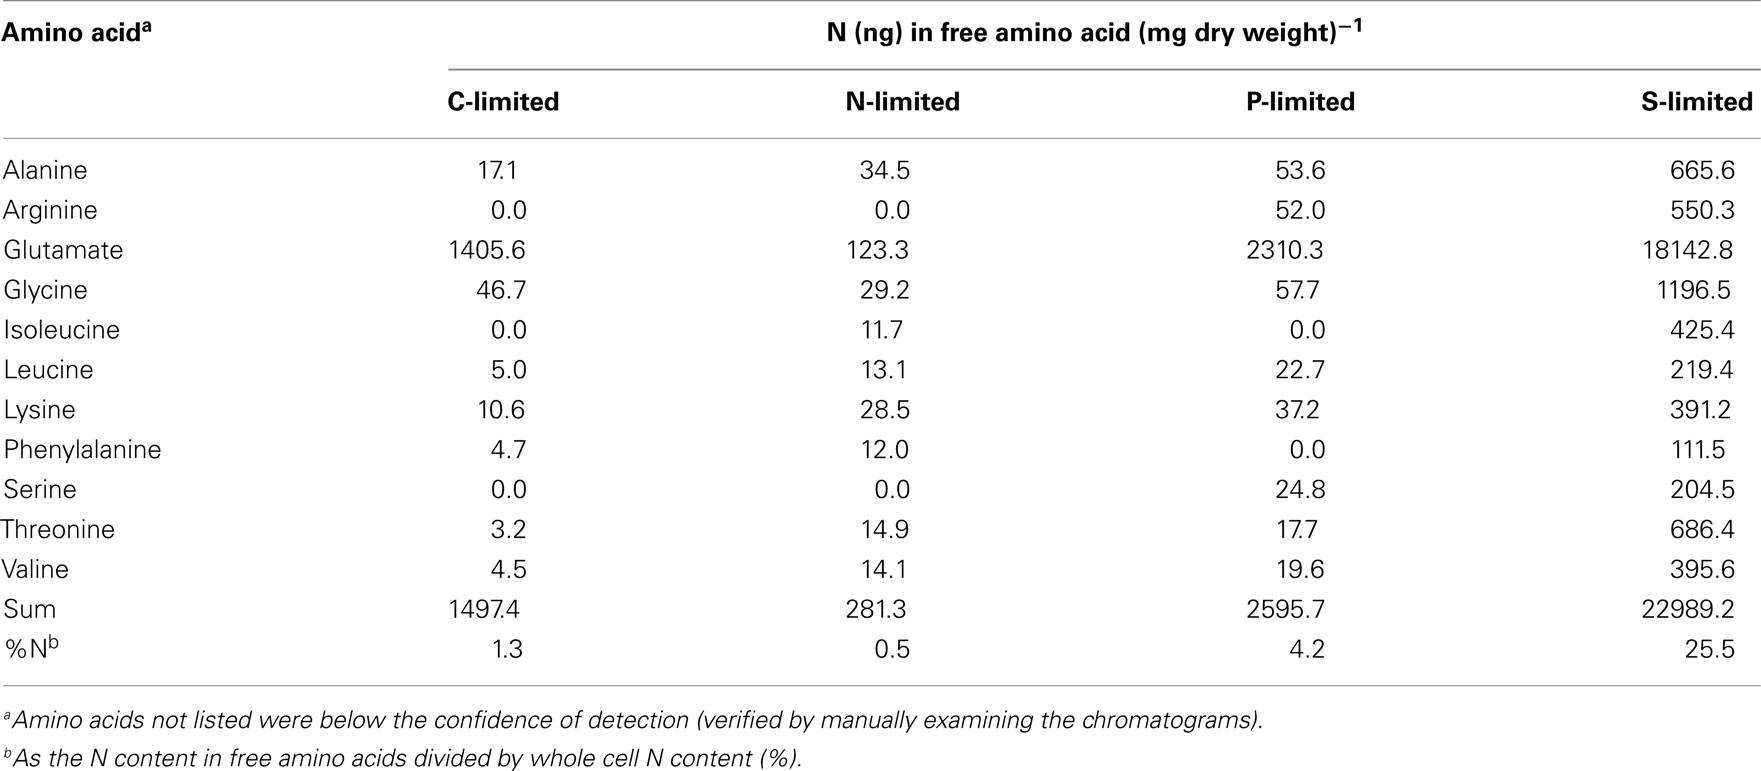
Table A6. N content in free amino acids measured in steady-state R. pomeroy i DSS-3 cells.
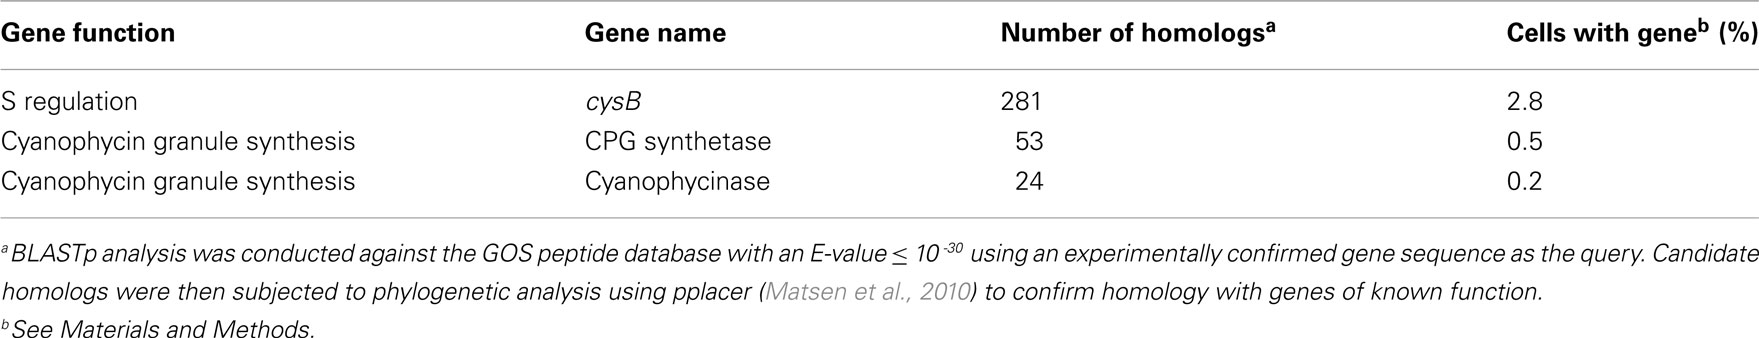
Table A7. Abundance of homologs for cysB and N storage genes in the unassembled Global Ocean Sampling (GOS) metagenomic data set (through the April 2008 release).
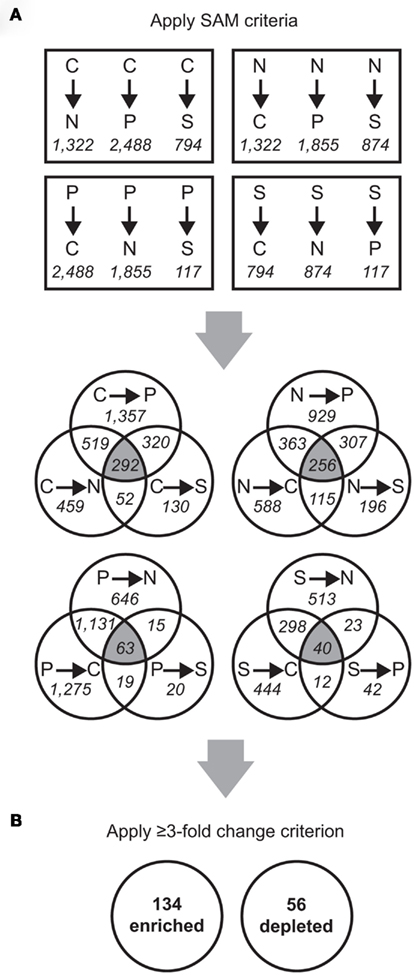
Figure A1. Schematic of microarray data analysis. Probe counts are shown in italicized font and gene counts are in bold font. (A) Significant Analysis of Microarray (SAM) was used to analyze the microarray data (pairwise SAM comparisons with 5,000 permutations and a false discovery rate ≤ 2%). From these results, probes significantly different in all three comparisons to the other treatments (that is, falling into the three-way overlap region of each Venn diagram) were selected for further analyses. (B) From the normalized fluorescence values, the fold-change for each probe was calculated as the median value between all limitation-to-excess pairwise comparisons and genes whose fold-change was ≥ 3 were retained.
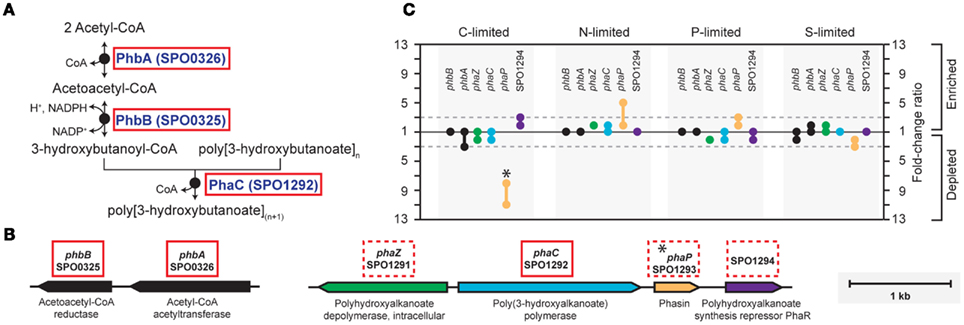
Figure A2. Biosynthesis of polyhydroxyalkanoate (PHA) in R. pomeroyi DSS-3. (A) Pathway inferred from BioCyc; (B) arrangement of genes for PHA synthesis (phbAB, phaC), degradation (phaZ), and regulation (phaR) on R. pomeroyi DSS-3 chromosome; (C) transcriptional ratios for relevant genes; values are shown for genes listed in the pathway (solid red box) and genes that are not in the pathway, but are located proximal to PHA synthesis genes (dotted red box). Genes in the same operon are identically color-coded. *, transcriptional change is significant (≥3-fold, all limitation-to-excess pairwise comparisons).
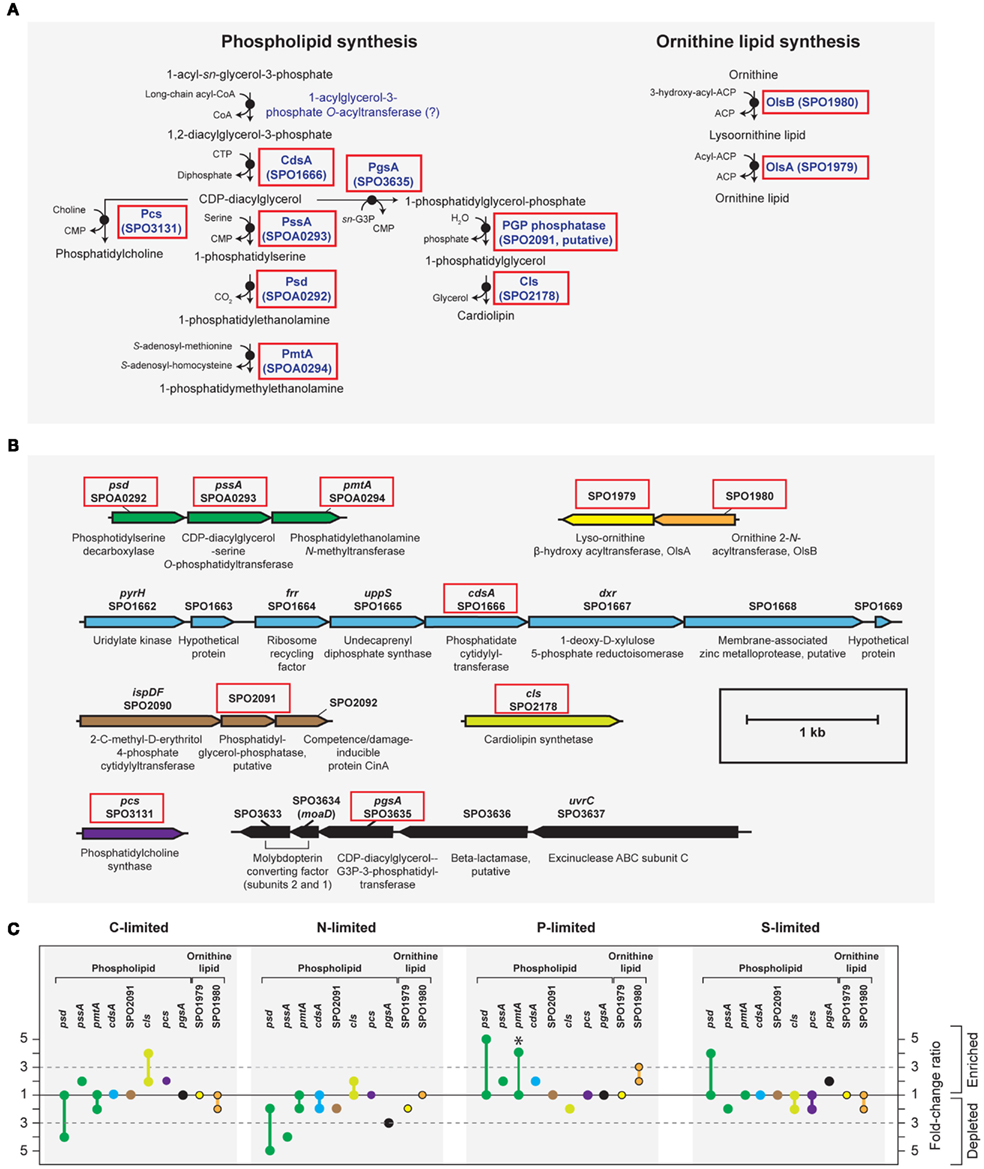
Figure A3. Biosynthesis of phospholipid and ornithine lipid in R. pomeroyi DSS-3. Strain DSS-3 does not encode genes to synthesize other bacterial P-free lipids (betaine lipid, btaAB; glycolipid/sulfolipid, sqdBCDX). (A) Pathway inferred from BioCyc; (B) arrangement of lipid synthesis genes on the chromosome; (C) transcription ratios for relevant genes; values shown for genes listed in (A,B) (solid red box). Genes in the same operon are identically color-coded. Symbols for ornithine lipid synthesis genes (yellow and orange) are bordered in black. *, transcriptional change is significant (≥3-fold, all limitation-to-excess pairwise comparisons). Abbreviation in (A,B) as follows: G3P, glyceraldehyde 3-phosphate.
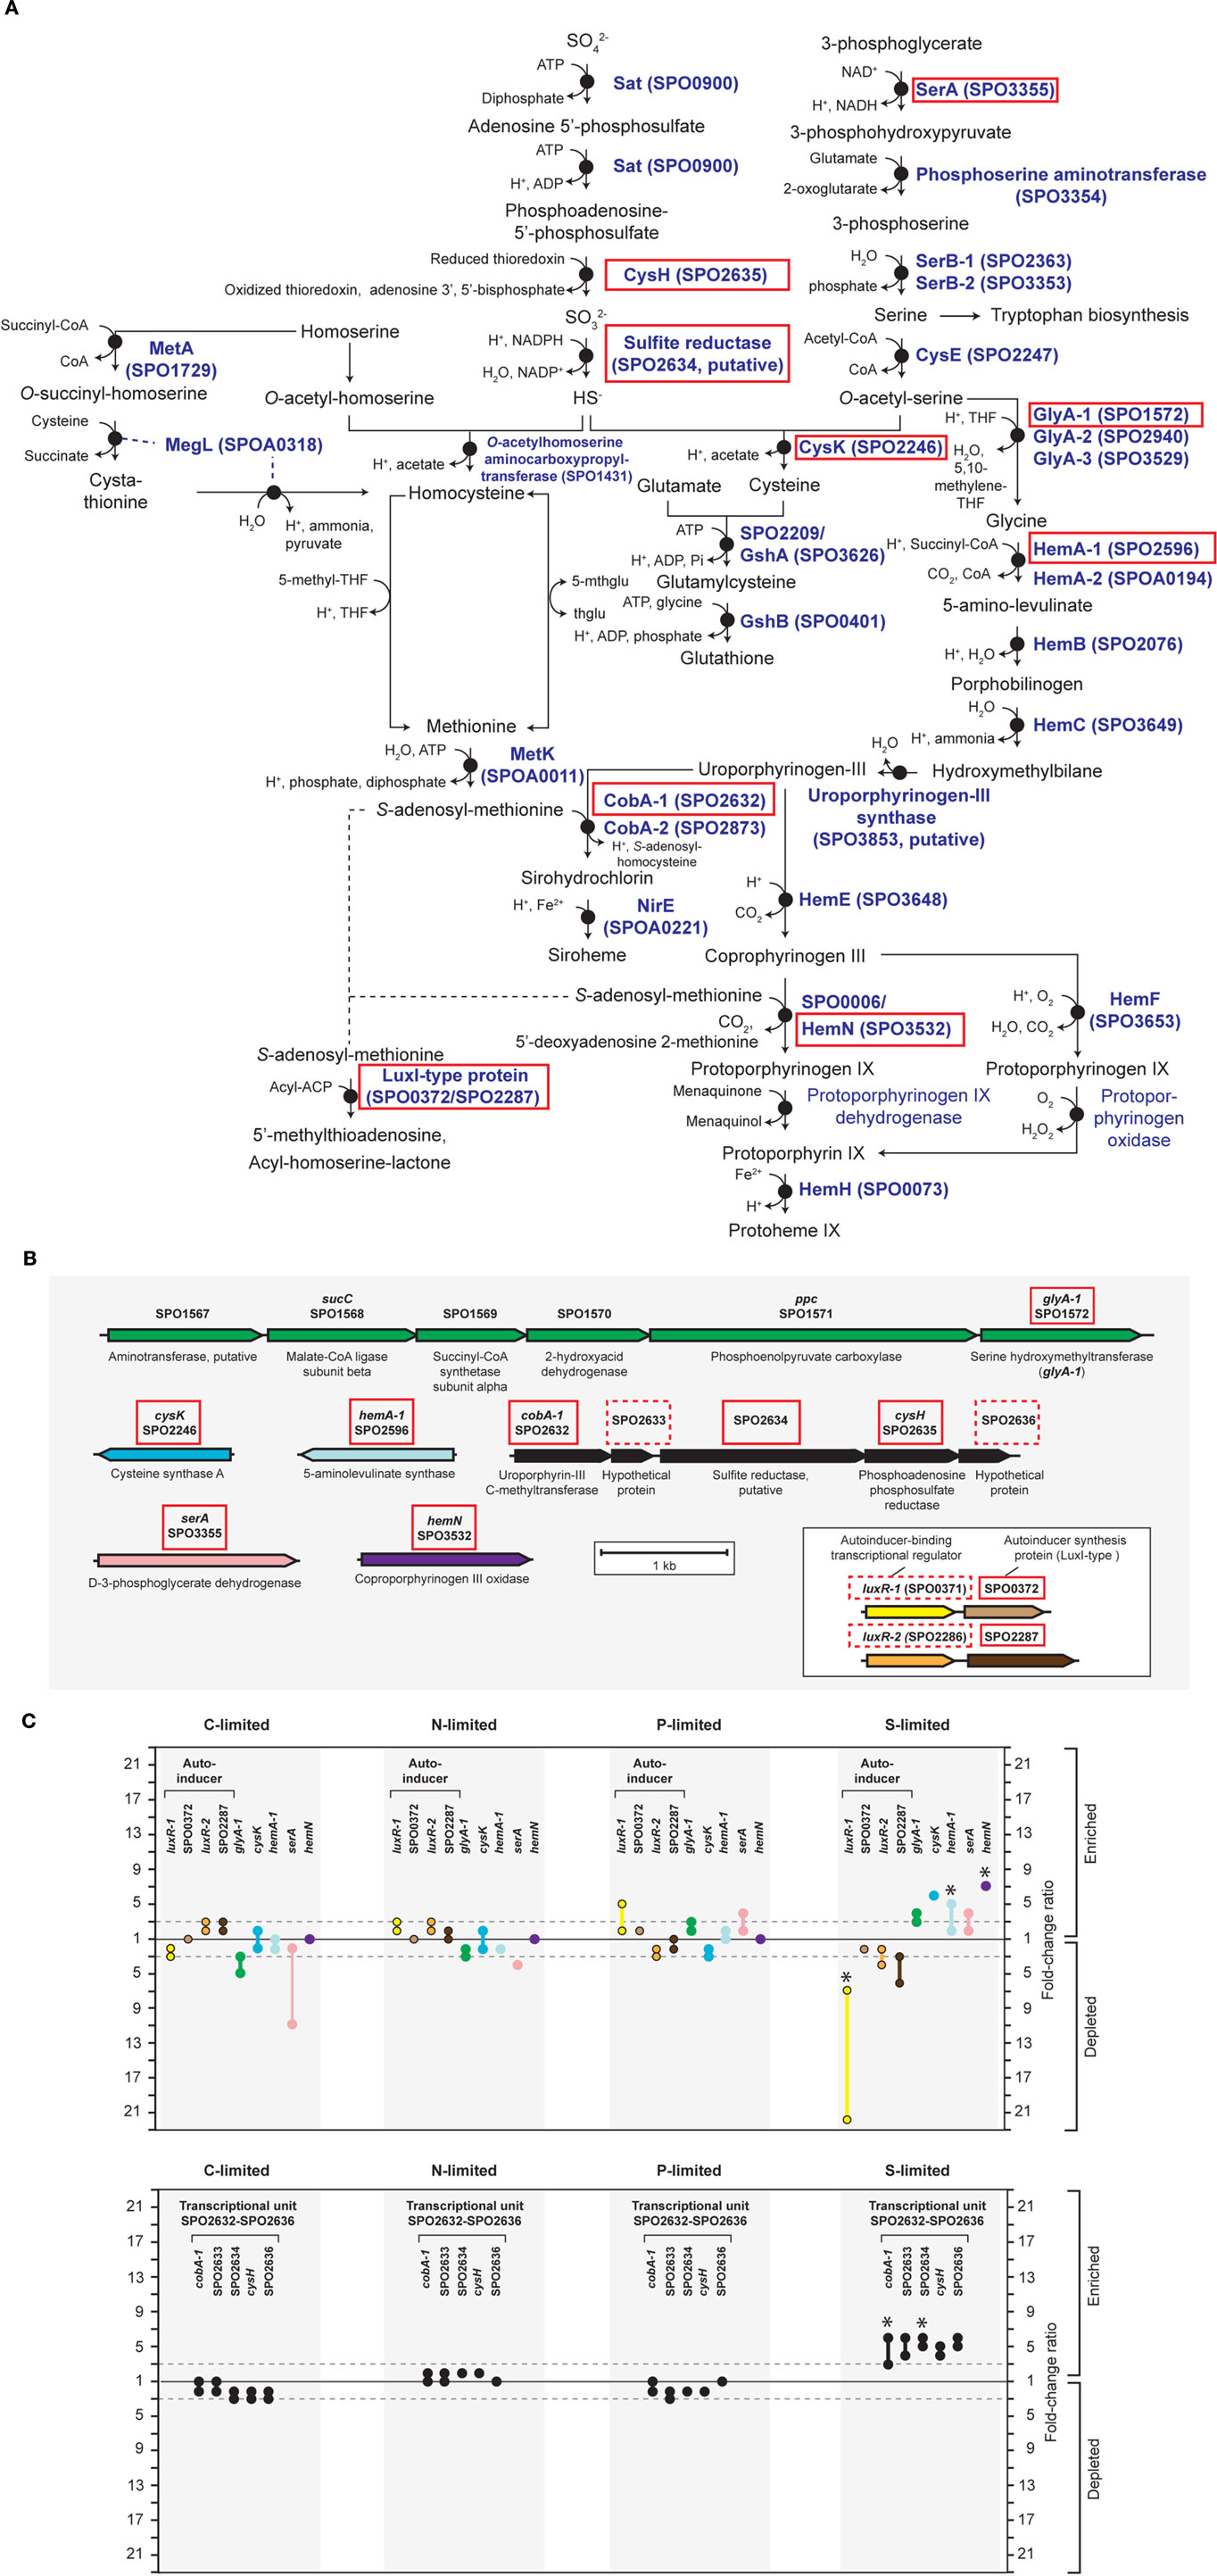
Figure A4. Relevant S-genes in R. pomeroyi DSS-3. (A) Pathway inferred from BioCyc; (B) arrangement of relevant genes on the chromosome; (C) transcriptional ratios for relevant genes; ratios are shown for genes listed in the pathway (A) (solid red box) and genes that are not in the pathway, but are located in proximity to relevant S-genes [dotted red box in (B)]. Genes located in the same operon are identically color-coded. Two sets of orthologous LuxR–LuxI-type proteins are boxed in (B). Symbols for autoinducer-binding or synthesis genes (yellow, orange, brown) are bordered in black in (C). *Transcriptional change is significant (≥3-fold, all limitation-to-excess pairwise comparisons). Abbreviations in (A) as follows: THF, tetrahydrofolate; 5-mthglu, 5-methyltetrahydropteroyltri-L-glutamate; thglu, tetrahydropteroyltri-L-glutamate.
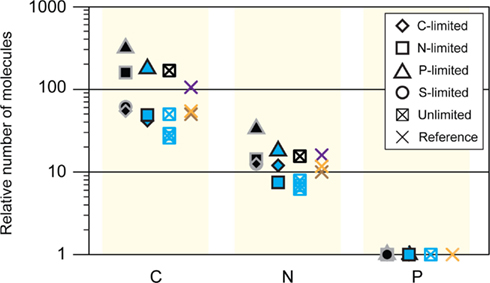
Figure A5. C:N:P ratios from various studies. Black symbols, steady-state R. pomeroyi DSS-3; the unlimited C:N:P ratio was modeled as ∼154:15:1 (this study); blue, batch-cultured marine bacterioplankton (Vrede et al., 2002); purple, Redfield ratio, marine seston (Redfield, 1934); brown, natural bacteria (Fagerbakke et al., 1996); orange, natural bacteria (Cotner et al., 1997).
References
Keywords: elemental stoichiometry, element limitation, microarray, chemostat, Ruegeria pomeroyi DSS-3
Citation: Chan L-K, Newton RJ, Sharma S, Smith CB, Rayapati P, Limardo AJ, Meile C and Moran MA (2012) Transcriptional changes underlying elemental stoichiometry shifts in a marine heterotrophic bacterium. Front. Microbio. 3:159. doi: 10.3389/fmicb.2012.00159
Received: 31 December 2011; Accepted: 09 April 2012;
Published online: 16 May 2012.
Edited by:
James Cotner, University of Minnesota, USAReviewed by:
Katherine McMahon, University of Wisconsin-Madison, USAEdward Hall, United States Geological Survey, USA
Copyright: © 2012 Chan, Newton, Sharma, Smith, Rayapati, Limardo, Meile and Moran. This is an open-access article distributed under the terms of the Creative Commons Attribution Non Commercial License, which permits non-commercial use, distribution, and reproduction in other forums, provided the original authors and source are credited.
*Correspondence: Mary Ann Moran, Department of Marine Sciences, University of Georgia, Athens, GA 30602-3636, USA. e-mail: mmoran@uga.edu
†Present address: Leong-Keat Chan, DOE Joint Genome Institute, 2800 Mitchell Drive, Walnut Creek, CA, USA; Pratibha Rayapati, Georgia Health Sciences University, Augusta, GA, USA.
‡Leong-Keat Chan and Ryan J. Newton have contributed equally to this work.