
- National Reference Laboratory for Antimicrobial Resistance, Department of Microbiology, National Veterinary Research Institute, Puławy, Poland
Monitoring of antimicrobial resistance in commensal Escherichia coli (N = 3430) isolated from slaughtered broilers, laying hens, turkeys, swine, and cattle in Poland has been run between 2009 and 2012. Based on minimal inhibitory concentration (MIC) microbiological resistance to each of 14 tested antimicrobials was found reaching the highest values for tetracycline (43.3%), ampicillin (42.3%), and ciprofloxacin (39.0%) whereas the lowest for colistin (0.9%), cephalosporins (3.6 ÷ 3.8%), and florfenicol (3.8%). The highest prevalence of resistance was noted in broiler and turkey isolates, whereas it was rare in cattle. That finding along with resistance patterns specific to isolation source might reflect antimicrobial consumption, usage preferences or management practices in specific animals. Regression analysis has identified changes in prevalence of microbiological resistance and shifts of MIC values. Critically important fluoroquinolone resistance was worrisome in poultry isolates, but did not change over the study period. The difference (4.7%) between resistance to ciprofloxacin and nalidixic acid indicated the scale of plasmid-mediated quinolone resistance. Cephalosporin resistance were found in less than 3.8% of the isolates but an increasing trends were observed in poultry and MIC shift in the ones from cattle. Gentamycin resistance was also increasing in E. coli of turkey and cattle origin although prevalence of streptomycin resistance in laying hens decreased considerably. Simultaneously, decreasing MIC for phenicols observed in cattle and layers isolates as well as tetracycline values in E. coli from laying hens prove that antimicrobial resistance is multivariable phenomenon not only directly related to antimicrobial usage. Further studies should elucidate the scope of commensal E. coli as reservoirs of resistance genes, their spread and possible threats for human and animal health.
Introduction
Bacterial resistance to antimicrobials has always been intriguing academic communities. Although high-tech methods are being available still there are gaps in understanding how bacteria can cope with chemicals, how they develop resistance strategies and transfer them between bacterial cells, species, or hosts. Some of the crucial restrictions are complexity of microbiota present in various ecosystems (Allen et al., 2013; Perchec-Merien and Lewis, 2013) and studies focused on selected issues at a given point of time (Dahmen et al., 2012; Wasyl et al., 2012). Human mobility and easy transfer of goods in globalized world further tangles up epidemiology of resistance (SVARM, 2012).
Resistant bacteria can compromise public and animal health and lead to severe economic losses in animal production (Morfin-Otero et al., 2012; Tadesse et al., 2012). Antimicrobial resistance affecting humans might develop either in public health area or food production chain where it can be transmitted from resistant bacteria to humans via several pathways, including direct contact with animals or indirect transfer via foods (EFSA, 2009). Monitoring of resistance in bacterial pathogens such as Salmonella aims at the timely counter-actions to combat life or welfare threatening infections (Morfin-Otero et al., 2012). Eradication, hygiene, and public awareness have diminished the major epidemiological threats. Subsequently, the number of pathogens available for antimicrobial resistance testing becomes insufficient. Commensal bacteria such as E. coli, give an alternative (Tadesse et al., 2012; Allen et al., 2013). Although there are some pathogenic phenotypes (Pitout, 2012), most of randomly selected E. coli from human or animal gut flora might be considered as non-pathogenic indicators for antimicrobial resistance (Kaesbohrer et al., 2012; Tadesse et al., 2012). The advantages of resistance monitoring in commensals result from their high prevalence, simple and efficient isolation procedures (Allen et al., 2013) and, compared to pathogenic bacteria, limited possibility for clonal spread.
Methods used for resistance detection should fit into the purpose of the testing. Novel molecular techniques offering optimal sensitivity for detection and characterization of resistance mechanisms, might be cost and time-consuming for routine application in clinical settings (Van Der Bij et al., 2012). Finding of resistance determinant in a bacterium might not correspond to its phenotypic resistance and vice versa (Ozaki et al., 2011; Wasyl et al., 2012). Therefore, classical microbiological methods are preferred for monitoring purposes (De Jong et al., 2012; EFSA, 2012b; EFSA and ECDC, 2012; Tadesse et al., 2012). No matter what method is used, resistance data need to be carefully interpreted. Clinical breakpoints are useful for assessment of probability of therapeutic success in clinical situation (Morfin-Otero et al., 2012; Van Der Bij et al., 2012). Epidemiological approach is appropriate for monitoring of pathogens and commensal bacteria, since it early detects the changes in resistance (EFSA, 2008). Evaluation of resistance trends in bacteria might be improved with quantitative data analyses (EFSA, 2012a; Van Der Bij et al., 2012).
Increase in antimicrobial resistance have led to enhanced world-wide studies on clinical aspects of resistance and its monitoring in both pathogens and commensal bacteria being potential reservoir of transmissible resistance determinants and indicator of antimicrobial use (EFSA, 2008, 2012b; EFSA and ECDC, 2012; Tadesse et al., 2012; Van Der Bij et al., 2012; Allen et al., 2013; Schroeter et al., 2013). Country-wide antimicrobial resistance monitoring in commensal Escherichia coli has been implemented in Poland since 2009 (Wasyl et al., 2010, 2012). Herewith, the four-year results are shown with special attention to the temporal trends analysis (EFSA, 2012a).
Materials and Methods
Antimicrobial resistance monitoring of indicator E. coli has been implemented in broilers, laying hens, turkey, cattle, and swine slaughtered in Poland.
Sampling
On January the numbers of animals slaughtered over the previous year in each abattoir in the country were reported by veterinary service. Slaughterhouses contributing to the substantial national annual production were designated for sampling in the upcoming year. Two hundred samples per studied animal population were assigned for sampling evenly distributed over the upcoming 12 months. Characteristics of national production of slaughter animals, numbers of slaughterhouses and sampling plan criteria were shown in Table 1. Each sample, consisting of three rectal or cloacal swabs, was taken by veterinary officers from three consecutive, random animals from slaughter line immediately after slaughter. Transport medium cotton swabs were submitted to the laboratory via courier service and proceeded within a week after collection. A minimum set of information on the date, location and sample source was collected and submitted electronically to the central database designed for managing of the project.
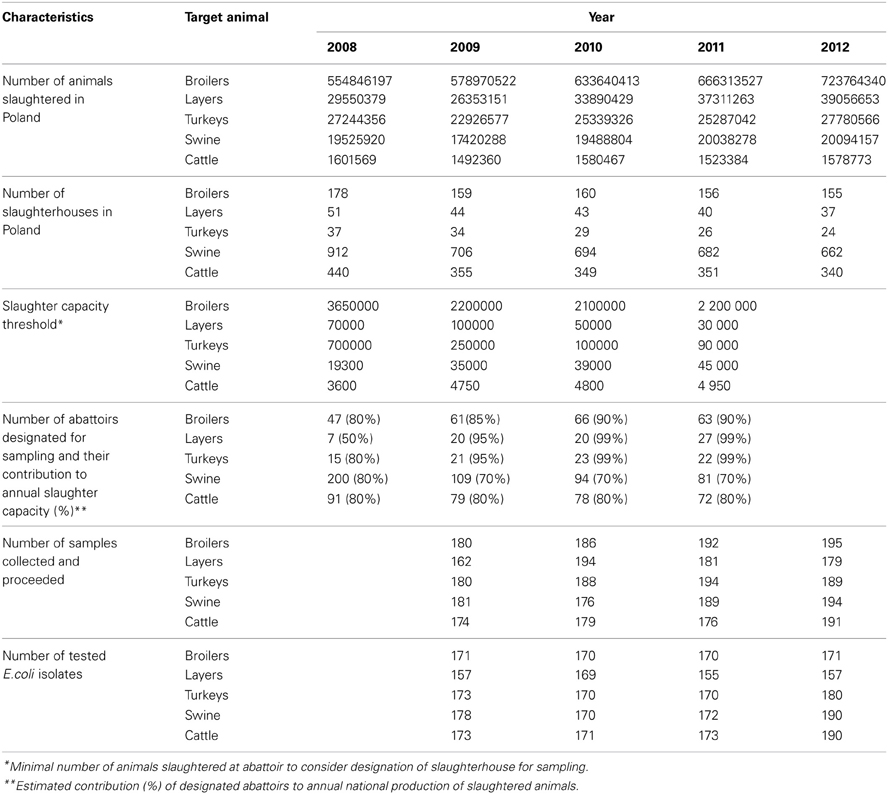
Table 1. Descriptive characteristics of studied populations relevant for sampling planning, number of samples collected and E. coli isolates used in the study.
Laboratory Testing
Swabs were streaked directly on MacConkey agar. Colonies showing typical E. coli morphology were confirmed biochemically and a single isolate representing each sample was selected for antimicrobial resistance testing with microbroth dilution method (Sensititre, TREK D. S.). Minimal Inhibitory Concentration (MIC) of 14 antimicrobials (Table 2) representing beta-lactams and cephalosporins, quinolones and fluoroquinolones, phenicols, aminoglycosides, folate-path inhibitors, tetracyclines and polymyxins were interpreted according to epidemiological criteria (EUCAST, www.eucast.org). Non-wild type (NWT) MICs above the cut-off values were classified as microbiological resistance and the isolate was supposed to carry relevant resistance determinant. Only phenotypic resistance was considered and resistance patterns were used to give possible insight into co-resistance and cross-resistance. Multi-drug resistance (MDR) was defined with the profile comprising at least one agent in three or more antimicrobial classes, extensive drug resistance (XDR)—from at least seven classes, and pan-drug resistance (PDR)—if antimicrobials from all but one tested classes were included in the profile (Magiorakos et al., 2012).
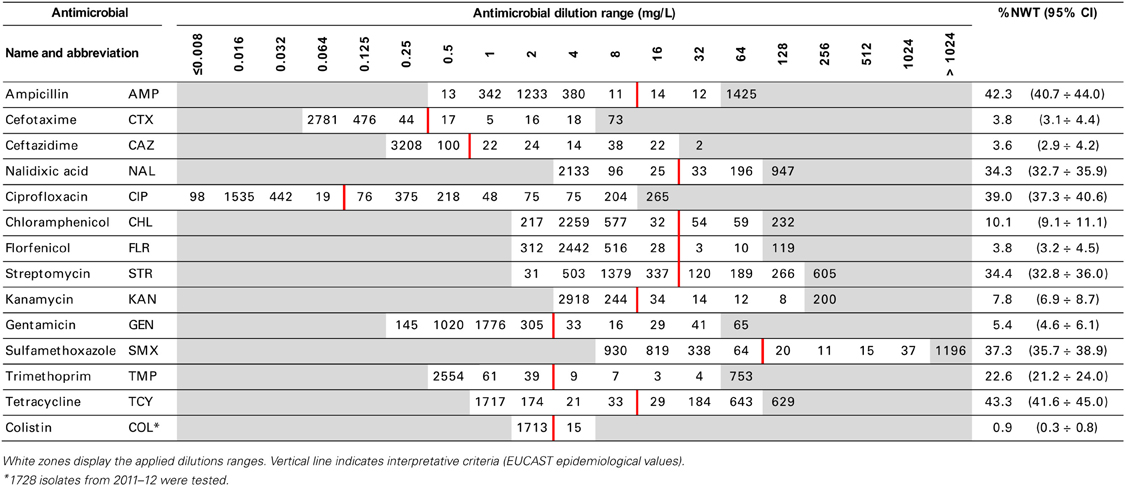
Table 2. Minimal inhibitory concentration distribution of E. coli isolates (N = 3430).
Statistical Analysis
The prevalence of resistance was calculated as a fraction of isolates with microbiological resistance, within 95% confidence interval (95% CI). Temporal trends for each study population and all tested compounds besides colistin were assessed on qualitative and quantitative results using regression analysis (EFSA, 2012b). Qualitative results were analysed in logistic model, whereas linear regression was applied for log-2 MIC data. The p-values lower than 0.05 indicated significant trends graphically displayed on bar graphs (Figures 1–6).
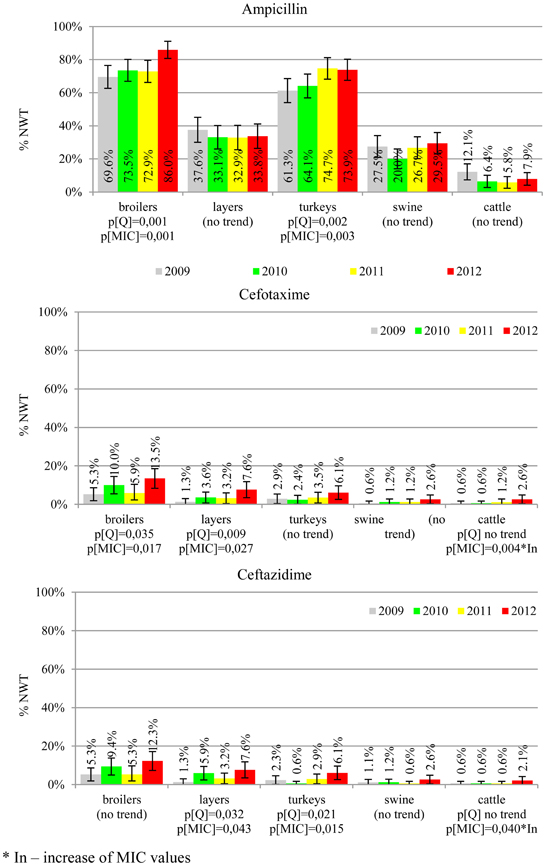
Figure 1. Microbiological resistance to beta-lactams and cephalosporins.
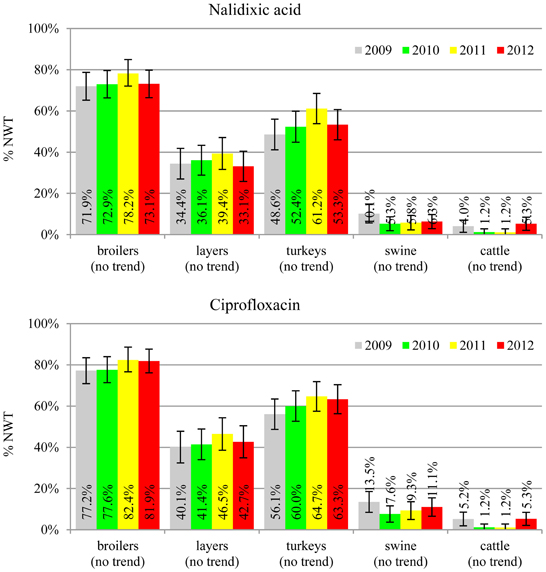
Figure 2. Microbiological resistance to quinolones and fluroquinolones.
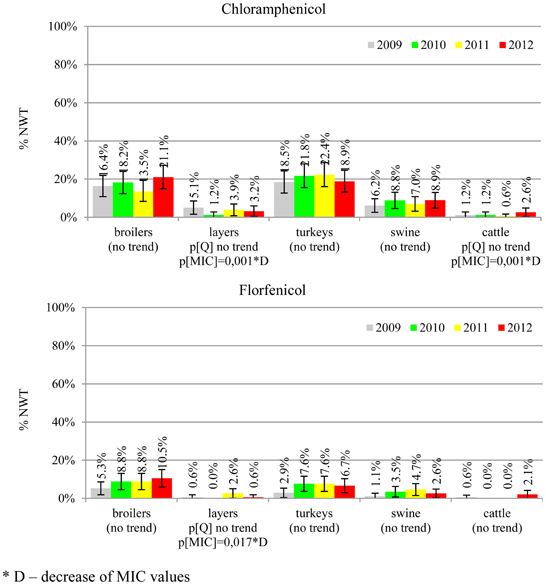
Figure 3. Microbiological resistance to phenicols.
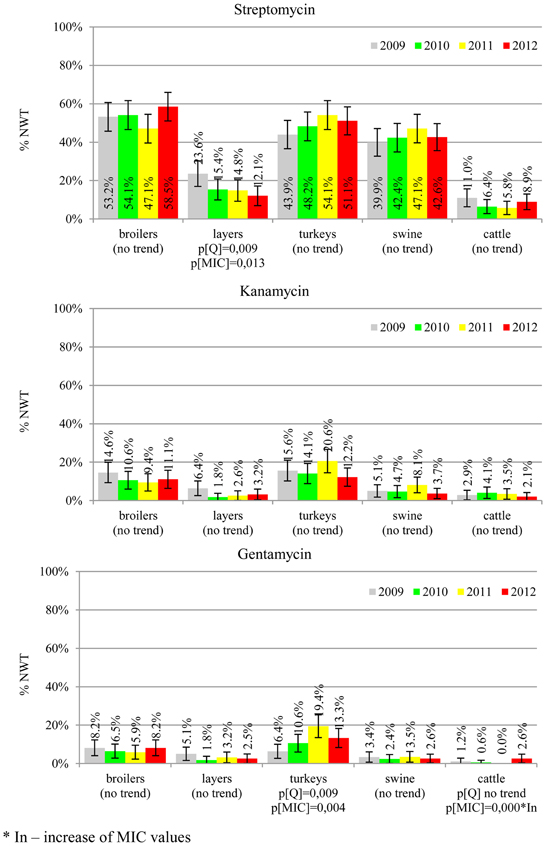
Figure 4. Microbiological resistance to aminoglycosides.
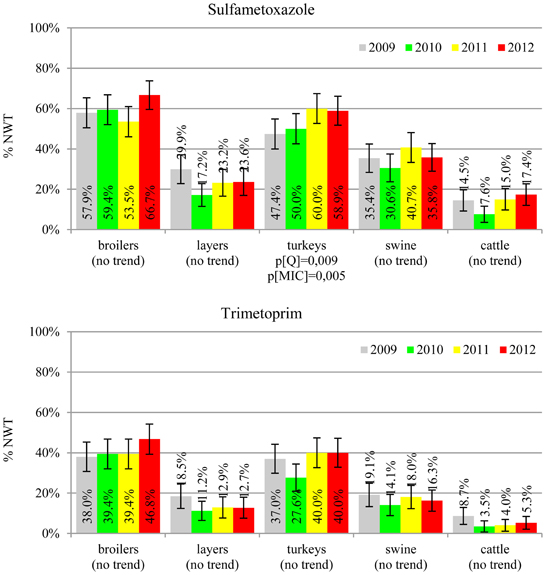
Figure 5. Microbiological resistance to folate-path inhibitors.
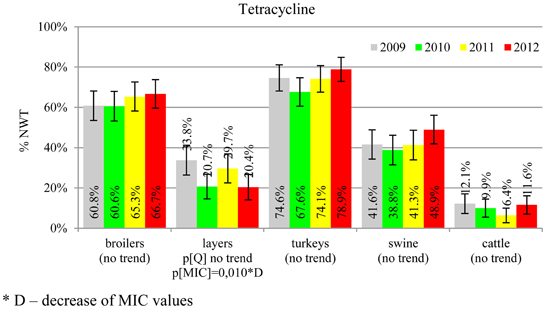
Figure 6. Microbiological resistance to tetracycline.
Results
During four-year study the number of animals slaughtered in Poland was steadily increasing although the number of slaughter plants was declining (Table 1). The adopted slaughter capacity thresholds and the numbers of selected abattoirs have been adjusted to reach finally from 70% (swine) to 99% (turkeys and laying hens) of national yearly production. The samples were collected at 439 abattoirs, on 770 (53%) days of the study period. Considering sample source (target animal), slaughterhouse ID, and sampling date, 3165 sampling events were identified and the calculated index of diversity (D = 0.9999) confirmed satisfactory randomization. Sampling efficacy reached 92% of 4000 planned incidents with 93.2% E. coli isolation rate. The target number of 170 isolates (EFSA, 2008) was achieved for all animal types but laying hens slaughtered after laying period (Table 1). As much as 70 out of 638 (11.0%) layer isolates were retrieved from animals imported from the Netherlands (N = 21), Germany (N = 17), Slovakia (N = 11), and Austria, Belgium, Czech Republic, Latvia and Lithuania. Imported samples were rarely (≤0.6%) recorded in other animal species but cattle.
MIC distributions of tested compounds were shown in Table 2. Microbiological resistance to all antimicrobials was identified at variable frequencies ranging from 0.9% (colistin) to 43.3% (tetracycline) but it differed considerably between antimicrobials and source of isolation (Figures 1–6). Temporal trends in prevalence of microbial resistance were found in 9 out of 65 tested antimicrobial/isolation source combinations (p[Q]-values shown on Figures 1–6) and in 7 further occasions MIC shifts were recorded (p[MIC]-values).
The average ampicillin resistance varied considerably from 75.5% in broiler isolates to 8.1% in those from cattle. Similar pattern but at several times lower frequencies was observed for cephalosporins. An increasing resistance to those antimicrobials was found in poultry isolates, but also MIC shift toward higher cephalosporin values was noted in cattle isolates (Figure 1). Nalidixic acid and ciprofloxacin resistances were observed mostly in poultry (on average at 74.0 and 79.8% in broilers, 53.8 and 61% in turkey, and 35.7 and 42.6% in layers), 6.9 and 10.4% in swine and 3.0 and 3.3% in cattle isolates. No temporal trends were found both on qualitative and quantitative results (Figure 2). The medium chloramphenicol resistance reached the highest values in turkeys and broilers (20.3 and 17.3%, respectively). Much lower levels were found in pigs (7.7%) and the lowest in laying hens (3.3%) and cattle isolates (1.4%). Florfenicol values stretched to approximately half as much in the case of chloramphenicol. Decreasing MIC values (Figure 3) were observed in layers (chloramphenicol and florfenicol) and cattle isolates (chloramphenicol). Streptomycin resistance reached the highest average values in broilers (53.2%), turkeys (49.4%), and pigs (43.0%), whereas much lower in layers (16.5%) and cattle isolates (8.1%). Kanamycin and gentamycin resistance levels were several times less frequent in comparison to streptomycin. The temporal trends analysis indicated a decrease of streptomycin resistance in laying hen isolates, an increase of gentamycin resistance in turkeys and shift in gentamycin MIC among cattle isolates (Figure 4). To exemplify the shift within wild-type population: 18% of isolates tested in 2009 showed MICGen ≤0.25 mg/L and 39% MICGen ≤ 1 mg/L whereas in 2012 those MIC values were noted in 2% and 47%, respectively. Sulfamethoxazole resistance was observed in up to 59.4% broiler and 54.1% turkey isolates, 35.6% in swine, 23.4% in layers and 13.7% cattle isolates. NWT trimetoprim values were generally by 10% (cattle, layers) or 20% lower than those observed for sulphonamides. The increasing trend was noted only for sulfamethoxazole in turkey isolates (Figure 5). The highest average resistance was found in turkey (73.9%) and broiler isolates (63.3%). Swine and layers isolates were resistant at 42.8% and 26.0% whereas 10.0% in cattle. Diminishing MIC values were noted in laying hens E. coli (Figure 6): the lowest tested concentration of 1 mg/L was found at 48% E. coli isolated in 2009 and 75% of the ones from the end of study period. Colistin resistance was the less frequent (Table 2), ranging from ≤0.4 to 1.6% (data not shown).
Of the 348 resistance profiles 164 were observed in the isolates originating from broilers, 111 from layers, 185 from turkeys, 120 from swine, and 56 from cattle. As much as 177 profiles were observed in single isolates, whereas 18 most frequent profiles (Table 3), each represented by at least 30 isolates, gathered 48% of E. coli (N = 1086) resistant to at least one compound. Each of them profiles tend to show up in E. coli originated from given animal population, i.e. Smx in cattle, Str and StrTcy in swine, NalCip in Gallus gallus (both broilers and layers), AmpNalCipChlStrSmxTmpTcy in slaughter poultry (broiler and turkey), or AmpNalCipStrKanSmxTmpTcy in broiler isolates. The source of E. coli isolation considerably influenced the complexity of resistance patterns (Table 4). MDR profiles were the least frequent in cattle (6.9 ÷ 11.2%) and approximately three times more frequent in swine and layer isolates. Up to 70.3 and 80.6% of, respectively, turkey and broiler isolates were MDR. The more complex the profiles were, the more frequently they occurred among turkey isolates: XDR and PDR profiles were at the similar frequencies found in broilers and turkeys. Two the most comprehensive profiles, each combining all tested compounds but colistin or florfenicol, were observed in E. coli originating from turkey (data not shown).
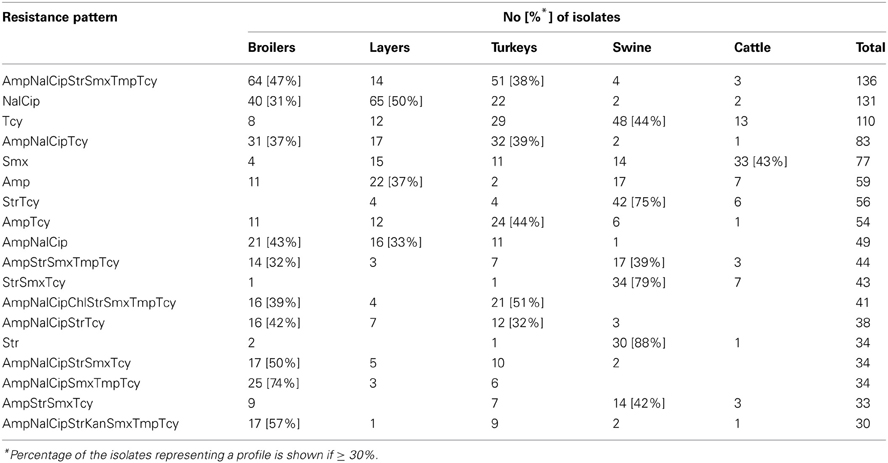
Table 3. The 18 most common resistance patterns found in E. coli.
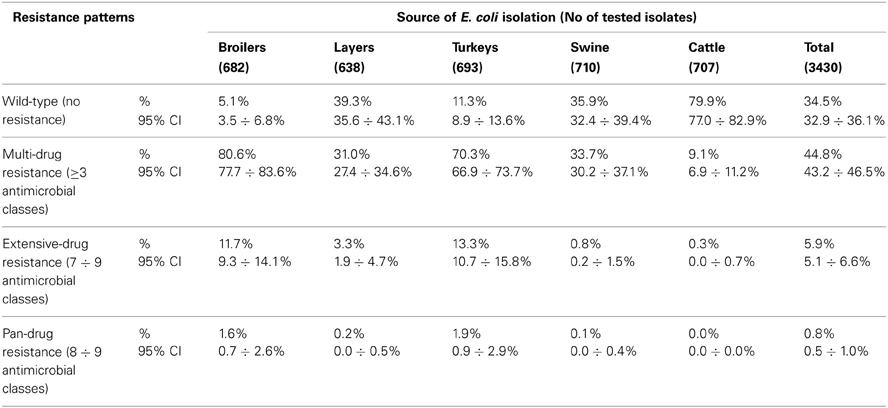
Table 4. Complexity of resistance patterns by source of E. coli isolation.
Discussion
Multiple resistance monitoring systems have been introduced world-wide (Bronzwaer et al., 2008; Deckert et al., 2010; Ozaki et al., 2011; Morfin-Otero et al., 2012; Tadesse et al., 2012). Current study, although sampling involved only a sparse fraction of animals slaughtered in the country, due to harmonized methodology and comparable numbers of random isolates collected regularly over the study period (SVARM, 2012; Tadesse et al., 2012) offers direct comparison between isolates from different sources, geographical locations and time frames (MARAN, 2012; Schroeter et al., 2013). The use of commensal intestinal E. coli as indicator for the presence of resistance determinants in bacterial flora is considered a key component of surveillance programs both in food-producing animals and wildlife (De Jong et al., 2012; EFSA and ECDC, 2012; SVARM, 2012; Allen et al., 2013). The frequency of resistance is considered a marker of selection pressure exerted by antimicrobial use in the host animal population (MARAN, 2012; SVARM, 2012; Allen et al., 2013). Resistant isolates found in current study in samples collected from imported animals (data not shown) indicate animal trade as a vector of resistance dissemination (Wasyl et al., 2012). The reflection of antimicrobial usage policies in different animal husbandry has been noted in current results. Most (79.9%) of cattle E. coli showed no resistance (Table 4). Since those isolates originated mostly from adult cattle (medium age at slaughter: 46 months, max. 214 months; data not shown) it might be presumed that some animals were slaughtered due to insufficient milk productivity and had not been treated with antimicrobials due to restriction on milk during withdrawal period. On the opposite, poultry might be treated until few days before slaughter and thus high resistance levels were found: only 5.1% of broiler and 11.3% of turkey isolates showed no resistance (Table 4). Some correlation between source of isolation and resistance profile complexity was noted. The most relevant one was increasing number of extensively and pan-drug resistances in turkey isolates compared to broilers. Those public health relevant resistances (Magiorakos et al., 2012) were rarely detected in isolates from layers, pigs and cattle. The antimicrobial consumption data support that observation as well as some resistance pattern overlap with preferences of antimicrobial usage in different animal species (EMA, 2012; Krasucka et al., 2012). Low prevalence of resistant E. coli in adult cattle or frequent tetracycline, penicillins, sulphonamides, and trimetoprim resistances in pig isolates were also reported from other countries (MARAN, 2012; SVARM, 2012). Finding of specific resistance profiles in isolates originating from defined animal population (Table 3) might further support the selective effect of antimicrobial usage. Based on broad time and geographical sampling frame as well as PFGE typing of a selection the isolates (data not shown), the clonal spread of certain resistance phenotypes might be neglected.
Interpretation criteria as an essential part of resistance monitoring should also be addressed. Epidemiological cut-off values are often criticized by clinicians (De Jong et al., 2012). Herewith it has been proved, that besides being appropriate for the isolates originating from non-diseased animals, current approach gives a great opportunity for temporal trend analysis. Resistance trend analysis is often made on interpreted data (Kronvall, 2010; Kaesbohrer et al., 2012; Morfin-Otero et al., 2012; SVARM, 2012; Tadesse et al., 2012; Van Der Bij et al., 2012). The advantages of quantitative analysis of MIC values have been recently raised (EFSA, 2012a). To our knowledge, present study is one of the few full-scale MIC distributions explored with trend analysis (Lundin et al., 2008). Increasing trends observed both on qualitative and quantitative level were detected in poultry isolates being resistant to beta-lactams, cephalosporins, aminoglycosides, and sulphametoxazole. Analysis on MIC shifts gave possibility for early detection of resistance trends (Lundin et al., 2008). Surprisingly, decreasing MIC values were found in layers isolates for chloramphenicol, florfenicol, and tetracycline, as well as chloramphenicol in E. coli from cattle. That finding is in disagreement to the general perception of antimicrobial resistance as emerging problem (Collignon et al., 2009) and should be of relevance for clinical surveys (De Jong et al., 2012).
Even though no temporal trends were noted in quinolone and fluoroquinolone resistance, its prevalence in poultry isolates is worrisome (Figure 2). The MIC values higher than clinical breakpoint (≥0.5 mg/L) found in 19.4% of non-pathogenic isolates (Table 2) indicate potential clinical consequences. The compounds are considered critically important for human medicine (Collignon et al., 2009), but the mechanisms behind, namely step-wise chromosomal resistance due to gyrase and topoisomerase IV genes mutations, may not be shared between bacteria (Hordijk et al., 2012). Plasmid mediated resistance was less common, but of possible importance (EFSA, 2008; Veldman et al., 2011). The 4.7% difference between microbiological resistance to ciprofloxacin and nalidixic acid might indicate the scale of the problem that peaked up to 8.8, 9.6 and 10.0% in, respectively, broiler, layer and turkey E. coli isolated in 2012. Such high occurrence of plasmid mediated determinants in Poland has already been reported (Veldman et al., 2011).
E. coli resistance to cephalosporins results from various transmissible and chromosomally encoded mechanisms (Dahmen et al., 2012; Wasyl et al., 2012). The observed levels of cefotaxime (3.8%) and ceftazidime (3.6%) NWT MICs (Table 2) indicate on both animal reservoirs and imperfection of cephalosporin resistance screening in random commensal E. coli. The previous studies showed that selective screening might result in 10-fold increase of isolates conferring ESBL or ampC-type resistance (Wasyl et al., 2010). Interestingly, the resistance determinants differed from the ones found in humans (Empel et al., 2008; Dahmen et al., 2012; Wasyl et al., 2012). Resistance to ampicillin, ranked the second highest (43.3%) and reaching 86.0% of broiler isolates in 2012, may also compromise critical importance in human and animal use. Such high prevalence might result from both long period of application of the old antimicrobial class, and co-selection of resistance mechanisms by other compounds. Remarkably, the resistances are very dynamic since 8 out of 12 increasing trends were noted in beta-lactams and cephalosporins (Figure 1). Some dynamics were observed also in tetracyclines (decreasing MIC values in layer isolates) and sulfametoxazole (increasing resistance in turkeys isolates). Those compounds, including sulphonamides combinations with trimethoprim, have been used for decades and are still of clinical importance (EFSA, 2008; Pedersen et al., 2009; Van Der Bij et al., 2012) although resistance has usually ranked amongst the highest both in human and animal E. coli (Deckert et al., 2010; De Jong et al., 2012; Kaesbohrer et al., 2012; SVARM, 2012; Tadesse et al., 2012). Therapeutic applications of colistin, another decades-old antimicrobial, was limited due to high toxicity. Currently it has been re-discovered as a last resort drug for control of multidrug resistant gram-negative bacteria (Collignon et al., 2009; Pogue et al., 2011). The observed resistance (0.9%) was found either alone or as MDR component (data not shown) and should be considered highly important (Collignon et al., 2009). The aforementioned levels and trends of resistance might suggest, that the concept of higher resistance against older antimicrobials compared to newly introduced compounds (Tadesse et al., 2012) is not entirely justified.
Streptomycin has been used extensively in animals and resistance is common in commensal and pathogenic E. coli (Hendriksen et al., 2008; Pedersen et al., 2009; Stannarius et al., 2009; SVARM, 2012; Tadesse et al., 2012). Though the resistance testing is tricky and multiple genes are involved, the compound is useful epidemiological marker for various resistance phenotypes, and it should be considered important besides minor clinical importance of streptomycin in humans (EFSA, 2008; Collignon et al., 2009). Noteworthy, layer isolates revealed the only decreasing trend on interpreted data found in current study (Figure 4). The remaining aminoglycosides showed much less resistance, with prevalence comparable to other countries and the highest values observed in turkey isolates (Kaesbohrer et al., 2012; MARAN, 2012; SVARM, 2012; Tadesse et al., 2012).
Different levels of chloramphenicol (10.1%) and florfenicol (3.8%) resistance allowed at rough differentiation of background mechanisms (Bronzwaer et al., 2008; EFSA, 2008) commonly associated with mobile genetic elements playing major role in dissemination of multiple antimicrobial drug resistance (Tadesse et al., 2012). Chloramphenicol resistance can smoothly evolve under selective pressure (Toprak et al., 2011), but presumably due to its ban for animal use, a diminishing MIC values were observed in layer and cattle isolates (Figure 3). Resistance to florfenicol, a veterinary used derivative remains low and might even decrease.
Our study has shown that antimicrobial resistance is an ever evolving issue driven by antimicrobial usage pressure. It was proved by variable resistances observed in commensal E. coli from different slaughter animals and increasing resistance trends observed in several occasions. However, decrease in proportion of microbiologically resistant isolates, as well as diminishing MIC values indicate on complex and multivariable aspects of resistance. Definitely E. coli may act as reservoir of resistance genes for other bacteria, including pathogenic bacteria (Veldman et al., 2011; Dahmen et al., 2012; Wasyl et al., 2012). Current results might be considered reliable background for assessment of effects of antimicrobial usage in animal and indicate the needs and areas for in-depth research on resistance mechanisms, their development and spread
Conflict of Interest Statement
The authors declare that the research was conducted in the absence of any commercial or financial relationships that could be construed as a potential conflict of interest.
Acknowledgments
Numerous veterinary officers throughout the country are acknowledged for randomized sample collection. We thank Anna Lalak, Magdalena Skarżyńska, Ilona Samcik, and Danuta Wnuk for excellent technical assistance. Special thanks are addressed to Łukasz Bocian for preforming statistical trend analyses. The study was fully supported by governmental founding of the multi-annual research project Protection of Animal and Human Health (Ministry of Council Resolution 244/2008 of October 28, 2008).
References
Allen, S. E., Janecko, N., Pearl, D. L., Boerlin, P., Reid-Smith, R. J., and Jardine, C. M. (2013). Comparison of Escherichia coli recovery and antimicrobial resistance in cecal, colon, and fecal samples collected from wild house mice (Mus musculus). J. Wildl. Dis. 49, 432–436. doi: 10.7589/2012-05-142
Bronzwaer, S., Aarestrup, F., Battisti, A., Bengtsson, B., Piriz Duran, S., Emborg, H.-D., et al. (2008). Harmonised monitoring of antimicrobial resistance in Salmonella and Campylobacter isolates from food animals in the European Union. Clin. Microbiol. Infec. 14, 522–533. doi: 10.1111/j.1469-0691.2008.02000.x
Collignon, P., Powers, J. H., Chiller, T. M., Aidara-Kane, A., and Aarestrup, F. M. (2009). World Health Organization ranking of antimicrobials according to their importance in human medicine: a critical step for developing risk management strategies for the use of antimicrobials in food production animals. Clin. Infect. Dis. 49, 132–141. doi: 10.1086/599374
Dahmen, S., Haenni, M., and Madec, J. Y. (2012). IncI1/ST3 plasmids contribute to the dissemination of the blaCTX-M-1 gene in Escherichia coli from several animal species in France. J. Antimicrob. Chemother. 67, 3011–3012. doi: 10.1093/jac/dks308
Deckert, A., Gow, S., Rosengren, L., Leger, D., Avery, B., Daignault, D., et al. (2010). Canadian integrated program for antimicrobial resistance surveillance (CIPARS) farm program: results from finisher pig surveillance. Zoonoses Public Health 57, 71–84. doi: 10.1111/j.1863-2378.2010.01356.x
De Jong, A., Thomas, V., Simjee, S., Godinho, K., Schiessl, B., Klein, U., et al. (2012). Pan-European monitoring of susceptibility to human-use antimicrobial agents in enteric bacteria isolated from healthy food-producing animals. J. Antimicrob. Chemother. 67, 638–651. doi: 10.1093/jac/dkr539
EFSA. (2008). Report from the task force on zoonoses data collection including guidance for harmonized monitoring and reporting of antimicrobial resistance in commensal Escherichia coli and Enterococcus spp. from food animals. EFSA J. 141, 1–44.
EFSA. (2009). Joint opinion on antimicrobial resistance (AMR) focused on zoonotic infections. Scientific opinion of the European Centre for Disease Prevention and Control; Scientific Opinion of the Panel on Biological Hazards; Opinion of the Committee for Medicinal Products for Veterinary Use; Scientific Opinion of the Scientific Committee on Emerging and Newly Identified Health Risks. EFSA J. 7, 1–78.
EFSA. (2012a). Technical specifications for the analysis and reporting of data on antimicrobial resistance in the European Union summary report. EFSA J. 10, 1–53.
EFSA. (2012b). Technical specifications on the harmonised monitoring and reporting of antimicrobial resistance in Salmonella, Campylobacter and indicator Escherichia coli and Enterococcus spp. bacteria transmitted through food. EFSA J. 10, 1–64.
EFSA ECDC. (2012). The European Union Summary report on antimicrobial resistance in zoonotic and indicator bacteria from humans, animals and food in 2010. EFSA J. 10, 1–233.
EMA. (2012). Sales of Veterinary Antimicrobial Agents in 19 EU/EEA Countries in 2010. ESVAC report EMA/88728/2012, London.
Empel, J., Baraniak, A., Literacka, E., Mrowka, A., Fiett, J., Sadowy, E., et al. (2008). Molecular survey of beta-lactamases conferring resistance to newer beta-lactams in enterobacteriaceae isolates from Polish hospitals. Antimicrob. Agents Chemother. 52, 2449–2454. doi: 10.1128/AAC.00043-08
Hendriksen, R. S., Mevius, D. J., Schroeter, A., Teale, C., Meunier, D., Butaye, P., et al. (2008). Prevalence of antimicrobial resistance among bacterial pathogens isolated from cattle in different European countries: 2002-2004. Acta Vet. Scand. 50, 28.
Hordijk, J., Veldman, K., Dierikx, C., Van Essen-Zandbergen, A., Wagenaar, J. A., and Mevius, D. (2012). Prevalence and characteristics of quinolone resistance in Escherichia coli in veal calves. Vet. Microbiol. 156, 136–142. doi: 10.1016/j.vetmic.2011.10.006
Kaesbohrer, A., Schroeter, A., Tenhagen, B. A., Alt, K., Guerra, B., and Appel, B. (2012). Emerging antimicrobial resistance in commensal Escherichia coli with public health relevance. Zoonoses Public Health 59, 158–165. doi: 10.1111/j.1863-2378.2011.01451.x
Krasucka, D., Cybulski, W., and Klimowicz, A. (2012). Ocena stosowania substancji przeciwdrobnoustrojowych u świń i bydła w Polsce na podstawie badań sondażowych w 2010 roku. Medycyna Weterynaryjna 68, 106–109.
Kronvall, G. (2010). Antimicrobial resistance 1979-2009 at Karolinska hospital, Sweden: normalized resistance interpretation during a 30-year follow-up on Staphylococcus aureus and Escherichia coli resistance development. APMIS 118, 621–639. doi: 10.1111/j.1600-0463.2010.02660.x
Lundin, J. I., Dargatz, D. A., Wagner, B. A., Lombard, J. E., Hill, A. E., Ladely, S. R., et al. (2008). Antimicrobial drug resistance of fecal Escherichia coli and Salmonella spp. isolates from United States dairy cows. Foodborne Pathog. Dis. 5, 7–19. doi: 10.1089/fpd.2007.0018
Magiorakos, A. P., Srinivasan, A., Carey, R. B., Carmeli, Y., Falagas, M. E., Giske, C. G., et al. (2012). Multidrug-resistant, extensively drug-resistant and pandrug-resistant bacteria: an international expert proposal for interim standard definitions for acquired resistance. Clin. Microbiol. Infect. 18, 268–281. doi: 10.1111/j.1469-0691.2011.03570.x
MARAN. (2012). Monitoring of Antimicrobial Resistance and Antibiotic Usage in Animals in the Netherlands. Wageningen, Central Veterinary Institute, Agricultural Economics Research Institute. Available online at: www.maran.wur.nl
Morfin-Otero, R., Tinoco-Favila, J. C., Sader, H. S., Salcido-Gutierrez, L., Perez-Gomez, H. R., Gonzalez-Diaz, E., et al. (2012). Resistance trends in gram-negative bacteria: surveillance results from two Mexican hospitals, 2005-2010. BMC Res. Notes 5:277. doi: 10.1186/1756–0500-5-277
Ozaki, H., Esaki, H., Takemoto, K., Ikeda, A., Nakatani, Y., Someya, A., et al. (2011). Antimicrobial resistance in fecal Escherichia coli isolated from growing chickens on commercial broiler farms. Vet. Microbiol. 150, 132–139. doi: 10.1016/j.vetmic.2010.12.020
Pedersen, K., Hammer, A. S., Sorensen, C. M., and Heuer, O. E. (2009). Usage of antimicrobials and occurrence of antimicrobial resistance among bacteria from mink. Vet. Microbiol. 133, 115–122. doi: 10.1016/j.vetmic.2008.06.005
Perchec-Merien, A. M., and Lewis, G. D. (2013). Naturalized Escherichia coli from New Zealand wetland and stream environments. FEMS Microbiol. Ecol. 83, 494–503. doi: 10.1111/1574-6941.12010
Pitout, J. D. (2012). Extraintestinal pathogenic Escherichia coli: a combination of virulence with antibiotic resistance. Front. Microbiol. 3:9. doi: 10.3389/fmicb.2012.00009
Pogue, J. M., Marchaim, D., Kaye, D., and Kaye, K. S. (2011). Revisiting “older” antimicrobials in the era of multidrug resistance. Pharmacotherapy 31, 912–921. doi: 10.1592/phco.31.9.912
Schroeter, A., Tenhagen, B.-A., Alt, K., Fetsch, A., Stingl, K., Guerra, B., et al. (2013). German Antimicrobial Resistance Situation in the Food Chain – Darlink 2009. Berlin: BfR Wissenschaft.
Stannarius, C., Burgi, E., Regula, G., Zychowska, M. A., Zweifel, C., and Stephan, R. (2009). Antimicrobial resistance in Escherichia coli strains isolated from Swiss weaned pigs and sows. Schweizer Archiv für Tierheilkunde 151, 119–125. doi: 10.1024/0036-7281.151.3.119
SVARM. (2012). Swedish Veterinary Antimicrobial Resistance Monitoring. Uppsala, Sweden: The National Veterinary Institute (SVA).
Tadesse, D. A., Zhao, S., Tong, E., Ayers, S., Singh, A., Bartholomew, M. J., et al. (2012). Antimicrobial drug resistance in Escherichia coli from humans and food animals, United States, 1950-2002. Emerg. Infect. Dis. 18, 741–749. doi: 10.3201/eid1805.111153
Toprak, E., Veres, A., Michel, J. B., Chait, R., Hartl, D. L., and Kishony, R. (2011). Evolutionary paths to antibiotic resistance under dynamically sustained drug selection. Nat. Genet. 44, 101–105. doi: 10.1038/ng.1034
Van Der Bij, A. K., Van Dijk, K., Muilwijk, J., Thijsen, S. F., Notermans, D. W., De Greeff, S., et al. (2012). Clinical breakpoint changes and their impact on surveillance of antimicrobial resistance in Escherichia coli causing bacteraemia. Clin. Microbiol. Infect. 18, E466–E472.
Veldman, K., Cavaco, L. M., Mevius, D., Battisti, A., Franco, A., Botteldoorn, N., et al. (2011). International collaborative study on the occurrence of plasmid-mediated quinolone resistance in Salmonella enterica and Escherichia coli isolated from animals, humans, food and the environment in 13 European countries. J. Antimicrob. Chemother. 66, 1278–1286. doi: 10.1093/jac/dkr084
Keywords: Escherichia coli, commensal, indicator bacteria, antimicrobial resistance, resistance trends, resistance phenotypes
Citation: Wasyl D, Hoszowski A, Zając M and Szulowski K (2013) Antimicrobial resistance in commensal Escherichia coli isolated from animals at slaughter. Front. Microbiol. 4:221. doi: 10.3389/fmicb.2013.00221
Received: 30 April 2013; Accepted: 17 July 2013;
Published online: 05 August 2013.
Edited by:
Axel Cloeckaert, Institut National de la Recherche Agronomique, FranceReviewed by:
Jian-Hua Liu, South China Agricultural University, ChinaJean-Yves Madec, ANSES, France
Copyright © 2013 Wasyl, Hoszowski, Zając and Szulowski. This is an open-access article distributed under the terms of the Creative Commons Attribution License (CC BY). The use, distribution or reproduction in other forums is permitted, provided the original author(s) or licensor are credited and that the original publication in this journal is cited, in accordance with accepted academic practice. No use, distribution or reproduction is permitted which does not comply with these terms.
*Correspondence: Dariusz Wasyl, National Reference Laboratory for Antimicrobial Resistance, Department of Microbiology, National Veterinary Research Institute, Partyzantów 57, 24-100 Puławy, Poland e-mail: wasyl@piwet.pulawy.pl