 Mohammad A. A. Al-Najjar1,2*
 Alban Ramette3
 Michael Kühl4,5
 Waleed Hamza6
 Judith M. Klatt1
 Lubos Polerecky1,7*
- 1Microsensor Group, Max-Planck Institute for Marine Microbiology, Bremen, Germany
- 2Marine Microbial Ecology Group, Red Sea Research Center, KAUST, Thuwal, Saudi Arabia
- 3Microbial Habitat Group, Max-Planck Institute for Marine Microbiology, Bremen, Germany
- 4Marine Biological Section, Department of Biology, University of Copenhagen, Helsingør, Denmark
- 5Plant Functional Biology and Climate Change Cluster, University of Technology Sydney, Sydney, NSW, Australia
- 6Biology Department, UAE University, Al-Ain, UAE
- 7Department of Earth Sciences – Geochemistry, Utrecht University, Utrecht, Netherlands
We imaged reflectance and variable fluorescence in 25 cyanobacterial mats from four distant sites around the globe to assess, at different scales of resolution, spatial variabilities in the physiological parameters characterizing their photosynthetic capacity, including the absorptivity by chlorophyll a (Achl), maximum quantum yield of photosynthesis (Ymax), and light acclimation irradiance (Ik). Generally, these parameters significantly varied within individual mats on a sub-millimeter scale, with about 2-fold higher variability in the vertical than in the horizontal direction. The average vertical profiles of Ymax and Ik decreased with depth in the mat, while Achl exhibited a sub-surface maximum. The within-mat variability was comparable to, but often larger than, the between-sites variability, whereas the within-site variabilities (i.e., between samples from the same site) were generally lowest. When compared based on averaged values of their photosynthetic parameters, mats clustered according to their site of origin. Similar clustering was found when the community composition of the mats' cyanobacterial layers were compared by automated ribosomal intergenic spacer analysis (ARISA), indicating a significant link between the microbial community composition and function. Although this link is likely the result of community adaptation to the prevailing site-specific environmental conditions, our present data is insufficient to identify the main factors determining these patterns. Nevertheless, this study demonstrates that the spatial variability in the photosynthetic capacity and light acclimation of benthic phototrophic microbial communities is at least as large on a sub-millimeter scale as it is on a global scale, and suggests that this pattern of variability scaling is similar for the microbial community composition.
Introduction
A major challenge in microbial ecology is to understand how the structure, composition, and function of microbial communities are linked, how microbial communities are influenced by environmental conditions, and how they contribute to the local and global cycling of elements. Examples of microbial communities that have been extensively studied from all of these perspectives are cyanobacterial mats, which are highly compacted microbial ecosystems consisting of diverse phototrophic and heterotrophic populations (van Gemerden, 1993; Stal, 2000). The interest in their study stems from the generally accepted assumption that they represent a modern analog of the earliest complex ecosystems on Earth (Seckbach and Oren, 2010). Additionally, their vertically stratified and compact structure offers good possibilities for studying microbial and biogeochemical interactions in well-controlled laboratory mesocosms.
Environments that harbor cyanobacterial mats vary greatly with respect to parameters such as nutrient concentrations, temperature, salinity, or input of mineral particles. This variability leads to differences in the structure of the mats with respect to the density and distribution of microbial cells, content of inorganic particles, and characteristics of exopolymers that bind the mat matrix together. In spite of these differences, one feature that these environments have in common is their extremity with respect to at least one of the environmental parameters, typically salinity, temperature, or pH (Caumette et al., 1994; Garcia-Pichel et al., 1999; Des Marais, 2003; Abed et al., 2006; Seckbach and Oren, 2010). This environmental constraint is essential for excluding, or at least minimizing, the influence of grazing and bioturbation, which would otherwise disturb the perennial growth and laminated structure of the mats.
A typical feature of cyanobacterial mats are steep vertical gradients of physical and chemical parameters such as light, O2, pH, and H2S (van Gemerden, 1993; Stal, 2000). While the gradients in light intensity and spectral composition are the consequence of strong and wavelength-dependent absorption and scattering by photosynthetically active (photopigments) and inactive (mineral particles, organic detritus) components in the mat (Kühl and Jørgensen, 1992, 1994; Kühl et al., 1994), the steep chemical gradients form due to mass transfer limitation in a volume that is densely packed with active microbial cells (Kühl et al., 1996; Wieland and Kühl, 2000a; Jonkers et al., 2003; Garcia de Lomas et al., 2005).
A critical process in cyanobacterial mats is the photosynthetic activity of the cyanobacterial population, which occurs in the uppermost layer of the mat (so-called euphotic zone) and supports diverse heterotrophic populations in the mat ecosystem through the production of organic substrates and O2 (Nübel et al., 1999; Roeselers et al., 2007). Cyanobacterial photosynthesis depends on a number of environmental parameters, including temperature, salinity, concentration of nutrients, intensity and spectral quality of light, and exposure to H2S (Kühl, 1993, 2005; Kühl and Fenchel, 2000; Wieland et al., 2003; Pinckney et al., 2011). Since these parameters vary between different sites that harbor cyanobacterial mats as well as within the mats themselves (see above), it is expected that the rate and efficiency of photosynthesis in the mats will exhibit strong geographical as well as micrometer-scale variability. Although previous measurements demonstrated that photosynthetic rates and efficiency are strongly variable within mats (Kühl et al., 1994; Al-Najjar et al., 2010), presently it is not known how this within-mat variability compares to the variability between mats from different environments. Additionally, it is not known whether there is a link between the photosynthetic capacity in the euphotic zone of the mats and the composition of the corresponding microbial community, and to which extent are these properties of the mats determined by the parameters characterizing their environment.
To address these issues, we compared 25 samples of cyanobacterial mats collected from four distant geographical locations (United Arab Emirates, Australia, Brazil, and Spain) with respect to their photosynthetic capacity and microbial community composition. Our focus was on the cyanobacterial layer at the top of the mats, which was assumed to be a good proxy for the mats' photosynthetically active zone. We used absorptivity by chlorophyll a (Achl), maximum quantum yield of photosystem II (Ymax), and light acclimation irradiance (Ik) as parameters characterizing the photosynthetic capacity and adaptation of the cyanobacterial populations. These parameters were measured with a sub-millimeter spatial resolution across vertical sections of the cyanobacterial layers using hyper-spectral and variable chlorophyll fluorescence imaging. Differences in the microbial community composition of the cyanobacterial layers were quantified by automated ribosomal intergenic spacer analysis (ARISA). Possible links between the parameters characterizing the photosynthetic capacity, microbial community composition, and environmental parameters were identified using multivariate statistical methods. We hypothesized that the microbial community composition and photosynthetic capacity in the cyanobacterial layers are linked, and that the photosynthetic potential and light acclimation of the cyanobacterial populations are more strongly influenced by the steep vertical gradients within the mat ecosystem than by the environmental parameters characterizing their habitat.
Materials and Methods
Samples
The studied cyanobacterial mats originated from four sites: an intertidal flat near Abu-Dhabi, UAE (AD mats), an intertidal flat in the Exmouth Gulf in Australia (AU mats; Lovelock et al., 2010; Adame et al., 2012), the hypersaline lake Lagoa Vermelha in Brazil (BR mats; Vasconcelos et al., 2006), and the hypersaline lake La Salada de Chiprana in Spain (SP mats; Jonkers et al., 2003). The mat samples were collected between 2003 and 2008 in at least two replicates from each site and incubated under artificial illumination (10 h light/14 h dark cycles, wavelength range 400–700 nm) and at approximately constant temperature until the measurements, which were conducted in 2009. More details about the collection sites and incubation conditions are given in Table 1. During the incubation, the appearance of the AD, AU, and BR mats did not change, whereas the SP mats gradually changed from thinly laminated structures (see Jonkers et al., 2003) to thicker structures featuring a loosen upper layer composed of a mixture of exopolymers and suspended particles.
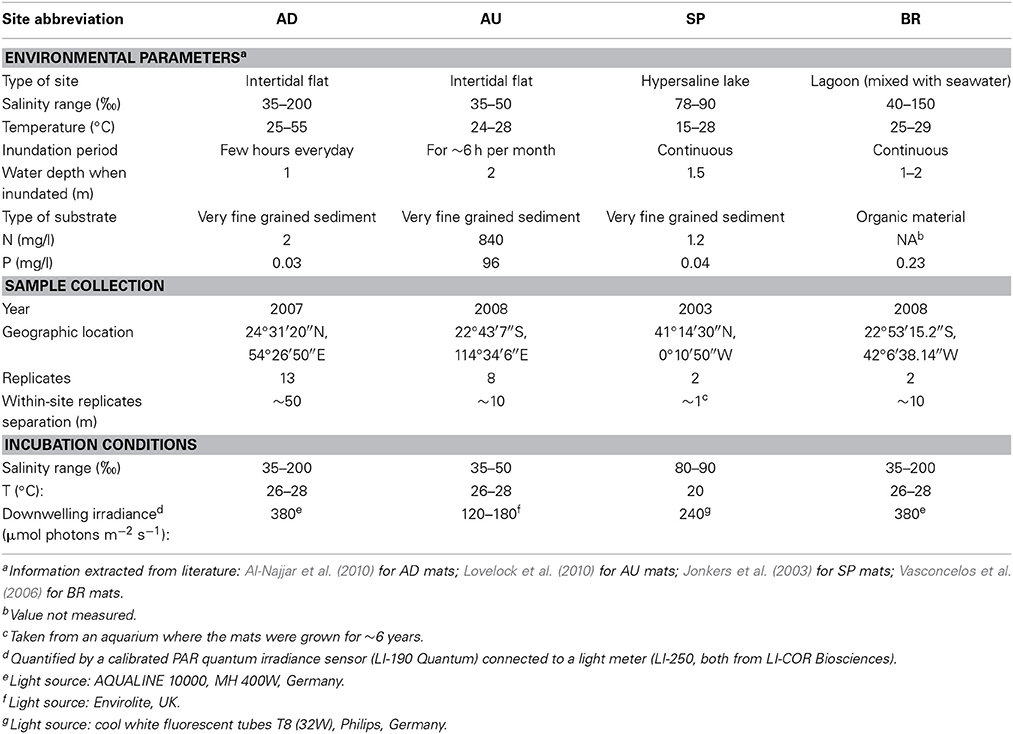
Table 1. Characteristics of the sampling sites, collection details, and incubation conditions for the studied microbial mats.
Measurement Protocol
First, the mat samples were pre-incubated for about 12 h at room temperature and incident irradiance of 100 μmol photons m−2 s−1. Subsequently, they were vertically sectioned and immediately afterwards variable chlorophyll fluorescence and spectral reflectance were measured to characterize, respectively, the photosynthetic potential and pigments in the mats. This was done with a high spatial resolution (~20 μm) across the vertical sections of the mats using imaging cameras (see below). Immediately after imaging, cyanobacteria-dominated layers close to the mats surface were cut-off with a sterile scalpel and prepared for the ARISA (see below). Identification of these layers was based on their characteristic dark-green appearance, microscopic observations and the results of the imaging analyses, which were rapidly obtained by the image processing routines developed during this study (see below).
PAM Imaging of the Variable Chlorophyll Fluorescence
Pulse amplitude modulated (PAM) imaging of the variable chlorophyll fluorescence was done with the Imaging-PAM system (Walz GmbH, Germany), using red light-emitting diodes for the excitation of the chlorophyll a fluorescence from cyanobacteria. For each mat, a vertical section of the mat sample was placed on its side in a Petri dish and covered with a few millimeters of seawater (salinity of 32, temperature 15°C). After 15 min of dark adaptation, images of the minimum (Fo) and maximum (Fm) fluorescence yields in the dark-adapted state were recorded. Subsequently, rapid light curves (RLC) (Schreiber et al., 1996, 1997) were measured by increasing the actinic irradiance from 0 to 1700 μmol photons m−2 s−1 in time intervals of 3 min for each irradiance and acquiring the fluorescence yield images under actinic illumination (F') and during the saturating pulse (Fm′) at the end of each interval. The intensity and duration of the saturating pulse was ~2400 μmol photons m−2 s−1 and 0.8 s, respectively, and the irradiance levels of the actinic light were calibrated using a PAR (400–700 nm) quantum irradiance sensor (LI-190 Quantum) connected to a light meter (LI-250, both from LI-COR Biosciences) positioned in the same place as the mat sample. As the sample was relatively small and it was lying on its side, irradiance was evenly distributed across the vertical section of the mat.
Imaging of Chlorophyll a Absorptivity
In addition to variable fluorescence imaging, the Imaging-PAM system was used to image reflectance of the mats in the red (Rr) and near-infrared (Rnir) region. These images were used to calculate the chlorophyll a absorptivity as Achl = (Rnir − Rr)/Rnir, which was taken as a proxy for chlorophyll a concentration in the mats. Because the spectral resolution of these measurements was insufficient, chlorophyll a absorptivity was additionally quantified by hyper-spectral imaging (Kühl and Polerecky, 2008; Polerecky et al., 2009). Specifically, each mat sample in the Petri dish was placed on a motorized stage, illuminated with a halogen bulb (Philips, type 6423) emitting in the visible to near-infrared range (400–900 nm), and scanned with a hyper-spectral imaging system (VNIR-100, Themis, Themis Vision, USA). Spectral normalization was achieved by scanning a gray reference standard with 40% reflectance (SRS-40-020, Labsphere Inc., USA). After verification that the reflectance spectrum had a characteristic chl a edge in the wavelength range of 700–720 nm and a flat plateau above 720 nm (see, e.g., Polerecky et al., 2009), the image of chl a absorptivity was calculated as Achl = (R750 − R675)/R750, where R750 and R675 are the reflectance images measured at 750 nm (no absorption by chl a) and 675 nm (maximal chl a absorption), respectively. No difference was found between the chl a absorptivity values obtained by hyper-spectral imaging and by the Imaging-PAM system (data not shown). Therefore, the latter were used in the subsequent analysis, as they allowed perfect alignment with the variable fluorescence images.
DNA extraction and ARISA
DNA from the cyanobacterial layers in the studied mats was extracted and purified using the UltraClean soil DNA isolation kit (MO BIO Laboratories, Inc., Carlsbad, CA, USA) according to the manufacturer's instructions. For each mat sample, PCR (50 μl) were conducted in triplicates and contained 1× PCR buffer (Promega, Madison, WI, USA), 2.5 mM MgCl2 (Promega), 0.25 mM of 40 mM dNTP mix (Promega), bovine serum albumin (3 μg/μl, final concentration), 25 ng extracted DNA, 400 nM each of universal primer ITSF (5′-GTCGTAACAAGGTAGCCGTA-3′) and eubacterial ITSReub (5′-GCCAAGGCATCCACC-3′; Cardinale et al., 2004) labeled with the phosphoramidite dye HEX, and 0.05 units GoTaq polymerase (Promega). All subsequent steps, including the PCR protocol, purity of the PCR products, labeling of the products, discrimination of the PCR-amplified fragments via capillary electrophoresis (ABI PRISM 3130xl Genetic Analyzer, Applied Biosystems) and the subsequent statistical analysis of ARISA profiles (quality control, binning, merging) were done as previously described (Boer et al., 2009; Ramette, 2009).
Processing and Analysis of the Fluorescence Yield Images
Using the fluorescence yield images, the quantum yield of PSII in the dark-adapted state was calculated as Y0 = (Fm − Fo)/Fm and the effective quantum yield of PSII at a given actinic irradiance, I > 0, as Y = (Fm′ − F')/Fm′. Subsequently, the values of Y were plotted as a function of I to determine the maximum effective quantum yield of PSII (denoted as Ymax) and the actinic irradiance at which Y reached Ymax (denoted as Imax). Based on the theoretical background of the saturation pulse method (Baker, 2008), Ymax represents the maximal photosynthetic potential of the cyanobacterial population in the mat. In plants, Y decreases monotonously with I and this maximal potential is reached in the dark-adapted state, i.e., Ymax = Y0 and Imax = 0 (White and Critchley, 1999). However, in our measurements with cyanobacterial mats the Y-I relationship was not monotonous and these parameters were typically related as Ymax > Y0 and Imax > 0 (Figure 1), which is why we additionally determined also Imax.
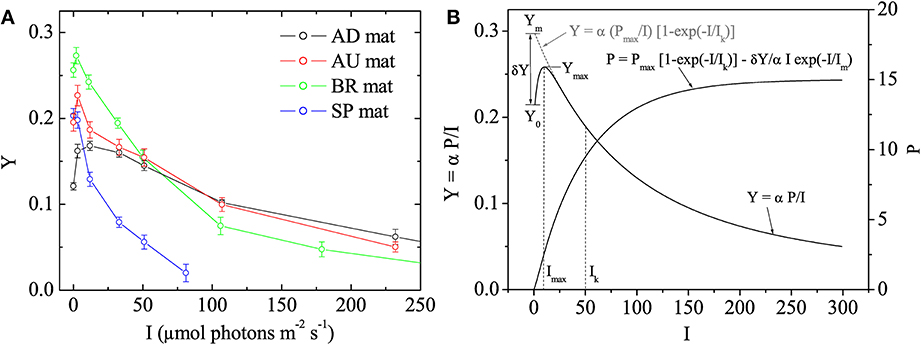
Figure 1. (A) Examples of quantum yields of photosystem II, Y, in the studied cyanobacterial mats, as measured by pulse amplitude modulated (PAM) imaging at different irradiances, I. Symbols and error bars represent, respectively, the mean and SD calculated from 5 × 5 pixels in the image. (B) Mathematical model describing the Y vs. I relationship. The main features of the relationship are annotated. The corresponding relationship between photosynthesis, P, and I is also shown.
In photosynthesis research, light acclimation is determined from the relationship between the rate of photosynthesis, P, and irradiance, I. This so-called P-I curve is close to linear at low irradiance levels and approaches saturation at high irradiance levels. The actual value of the light acclimation irradiance (denoted here as Ik) depends on the mathematical model that describes it, and is typically obtained by fitting the P-I data (see, e.g., Platt and Jassby, 1976). To obtain Ik from our data, we assumed that the parameter Y measured by the saturation pulse method is given by Y = α P/I, where α is a proportionality constant whose value is not important in this study (but see Campbell et al., 1998), and considered the following model to describe the P-I relationship:
The first term in this model is equivalent to that proposed by Webb et al. (1974), whereas the second term was necessary to describe the non-monotonous relationship between Y and I observed in this study (Figure 1). Using Equation (1) and assuming that Im ≪ Ik, which was the case in our measurements, Y can be written approximately as
where Ym = Ymax/(1 − Imax/Ik), δY = Ym − Y0 and Imax ≈ Im if Im ≪ Ik (see Figure 1B). Thus, by determining the values of Y0, Ymax, and Imax and fitting the rest of the measured Y-I values with the model in Equation (2), it was possible to determine the remaining fitting parameter Ik. Data processing required for this analysis, including quantification of the images of Ymax, Imax, and Ik, their variabilities across the vertical and horizontal directions as well as average vertical and horizontal profiles, was done in Matlab (The MathWorks Inc., Natick, MA) using the program Look@PAM developed during this study. This program is available on the internet (http://www.microsen-wiki.net/pamimaging:lookatpam).
Statistical Analyses
The significance of univariate response data as a function of categorical factors was tested using one-way analysis of variance (ANOVA), after verifying the normality (Shapiro–Wilk normality test) of the response variable at p = 0.05. Community differences were visualized by non-metric multidimensional scaling (MDS) ordination based on the Bray–Curtis dissimilarity matrix between samples, and significance of community differences between groups of samples was determined by Analysis of Similarity (ANOSIM) tests. Prior to analyzing ARISA profiles conjointly with functional or environmental variables, a consensus community profile was obtained for each sample by merging the triplicate ARISA PCR and by considering an OTU present if it appeared at least twice among the triplicates (Ramette, 2009). The merged table was Hellinger-transformed to minimize the effects of the strongly right-skewed distribution curve (Ramette, 2007). To assess the link between the microbial community composition and function, the Procrustes superimposition approach was used to estimate the concordance of scores originating from two independent ordinations after rotating, translating, and dilating one of them, while keeping the other ordination coordinates constant (Gower, 1975). Significance of the rotation statistic was assessed by Monte-Carlo permutations (Peres-Neto and Jackson, 2001). All statistical tests were carried out with the statistical platform R (http://cran.r-project.org/) and multivariate community analyses with the vegan package (Oksanen et al., 2012).
Results
All studied mats had a clear laminated structure, with a characteristic dark-green layer at or close to the mat surface in each of them (see examples of true color images in Figure 2). The AD and AU mats had a brown layer and a red layer underneath the dark-green layer, while the deepest layer was black. Additionally, the AD mats were covered by a thin orange gelatinous layer. The BR mats showed a different layering pattern with an upper dark-green layer followed by a thicker dark-pink gelatinous layer. The SP mats had a similar structure as the AD mats, except the distinct layers were thicker and the surface gelatinous layer had whitish to light-brown appearance.
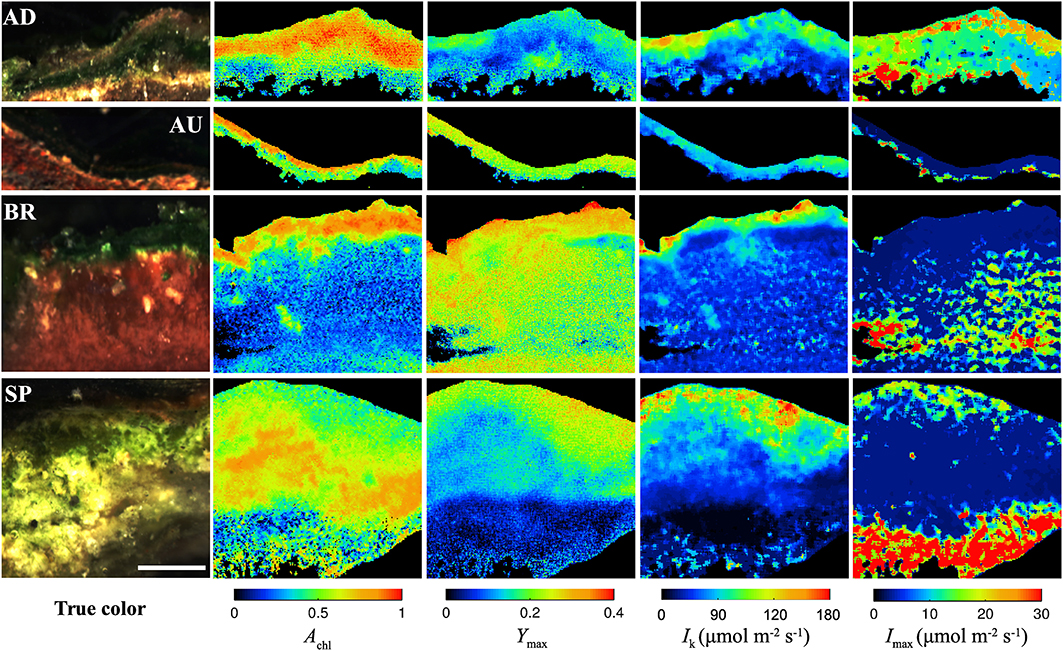
Figure 2. Example images of the AD, AU, BR, and SP mats obtained by hyperspectral imaging (column “true color”), reflectance imaging (Achl), and PAM imaging (Ymax, Ik, Imax). Scale bar is 1 mm.
Hyperspectral imaging revealed that the dark-green layer in the mats had a pronounced absorption at wavelengths corresponding to the maximal absorption by chlorophyll a (675 nm) and phycocyanin (625 nm; Figure S1). Since these pigments are characteristic for cyanobacteria, we could be confident that the dark-green layer contained abundant cyanobacterial populations and could therefore be referred to as the cyanobacterial layer. This conclusion was supported by microscopic observations (data not shown).
Variability of Physiological Parameters on Different Spatial Scales
Imaging of Achl, Ymax, Imax, and Ik in mats collected from different sites made it possible to investigate how the variability in these physiological parameters changes depending on the scale at which it is determined, including the micrometer-scale (within-mat variability), meter-scale (within-site variability), and global-scale (between-site variability). The within-mat variability was quantified in three ways: as standard deviation (SD) of the values from the entire image of the cyanobacterial layer and as SD of the average vertical and horizontal profiles. The within-site variability was calculated as SD of the average values over the cyanobacterial layer in each mat from the respective site, while the global variability as SD of the average values for each site.
As demonstrated by the images, all studied physiological parameters exhibited pronounced micrometer-scale variability within the cyanobacterial layer of the studied mats (Figure 2). Two-factorial analysis of variance performed on individual images of Achl, Ymax, and Ik, using vertical and horizontal position in the mat as factors, revealed that the percentage of the total within-mat variance explained by the vertical position (25–30% for Achl, 45–50% for Ymax, and 30–35% for Ik) was about 1.5 to 2-fold larger than the percentage of variance explained by the horizontal position (15–20% for Achl, 15–30% for Ymax, 15–25% for Ik). This was consistent with the comparison of the SD for the average vertical and horizontal profiles, which showed that the former were about 2-fold larger than the latter (Figures 3A–C). Thus, on average, the vertical variability in Achl, Ymax, and Ik was about twice as high as the horizontal one. A significant portion of the within-mat variance was explained by the interaction between the vertical and horizontal position (55–60% for Achl, 30–35% for Ymax, and 45–50% for Ik), consistent with the clearly visible variation of the vertical profiles of these parameters along the horizontal direction for each individual mat sample (Figure 2). With respect to Imax, the vertical and horizontal variabilities were similar (Figure 3D), each explaining about 10% of the total within-mat variability, while the remaining 80% was explained by their interaction. The within-mat variability of Imax in the AD mats was significantly larger than in the other mats (Figure 3D), which was mainly because the Imax values were generally larger in the AD mats.
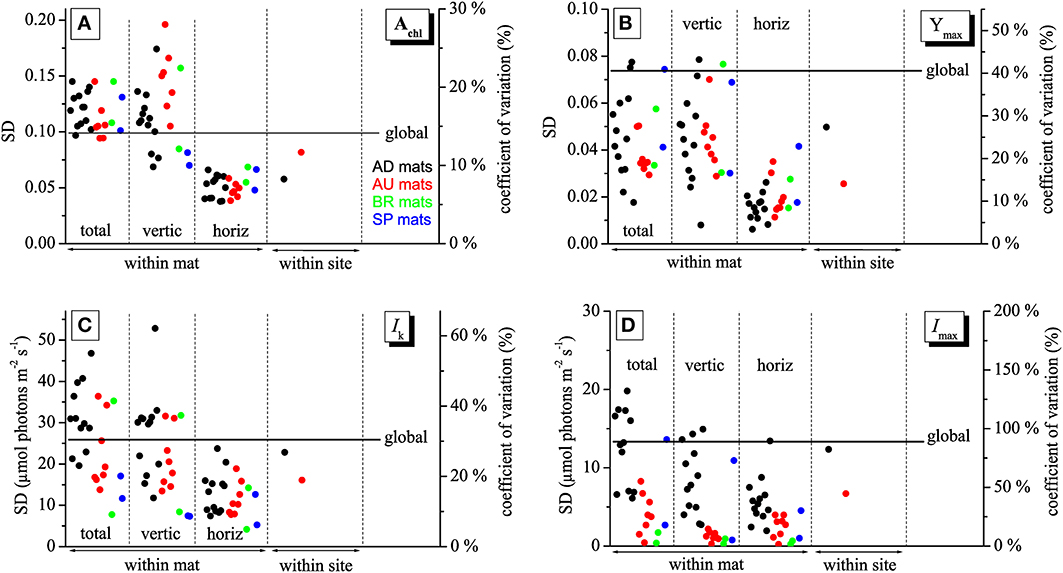
Figure 3. Variabilities of the physiological parameters Achl (A), Ymax (B), Ik (C), and Imax (D) calculated at different spatial scales, including the micrometer (within-mat), meter (within-site), and global (between sites) scales. See text for details. The variabilities are expressed as standard deviations, SD (left axis), and as a coefficient of variation (right axis).
Average vertical profiles of Achl for AD, BR, and SP mats were characterized by a subsurface maximum, whereas a monotonous decrease with depth was observed for AU mats (Figure S2A). Average Ymax and Ik generally decreased with depth (Figures S2B,C) and were significantly correlated (p < 0.001) for each mat sample. Spatial trends in Imax were not so clear, having patchy distributions for some mats while on average increasing with depth for others (Figure 2 and Figure S2D). Depending on the mats, vertical variation across the cyanobacterial layer, expressed as a coefficient of variation (SD/mean) of the average vertical profile, reached 10–30% for Achl, 5–45% for Ymax, 10–60% for Ik, and 5–100% for Imax (Figure 3).
The within-site variability of Achl calculated for the mats from the AD and AU sites was lower than the within-mat variabilities calculated for the individual mats from these sites (Figure 3A). This was often the case also for Ymax, Ik, and Imax, but sometimes the within-mat variability was lower than the within-site one (Figures 3B–D). Such comparison could not be done reliably for the BR and SP mats because of the limited number of replicates (N = 2) for these two sites.
The global-scale variability was larger than the within-site variability for all measured physiological parameters (Figure 3). In contrast, in many cases it was lower than the within-mat variability. This relationship was most pronounced for Achl and Ik, where it was observed in 21 (for Achl) and 12 (for Ik) out of 24 mat samples (Figures 3A,C). Clearly, this was primarily due to the pronounced variability in the vertical direction, whereas the horizontal within-mat variability was almost always lower than the global-scale variability. On the other hand, the global-scale variability in Ymax and Imax was mostly larger than the within-mat variability, except for a few AD mats (Figures 3B,D). The global-scale variability, expressed as a coefficient of variation, was about 15% for Achl, 40% for Ymax, 30% for Ik, and 80% for Imax (Figure 3).
Clustering of Mats Based on Average Physiological Parameters
Physiological parameters Achl, Ymax, Imax, and Ik, when averaged over the cyanobacterial layers, varied significantly between the sampled sites (Figure 4, Table 2). For example, AU and BR mats had, on average, about 2-fold larger Ymax than AD and SP mats, SP mats had the lowest Ik, whereas AD mats had the largest values of Imax. When a distance matrix was calculated from the average values of Achl, Ymax, Ik, and Imax using Euclidean metric, its visualization in an MDS plot revealed clear clustering of the mats according to the site of their origin (Figure 4C).
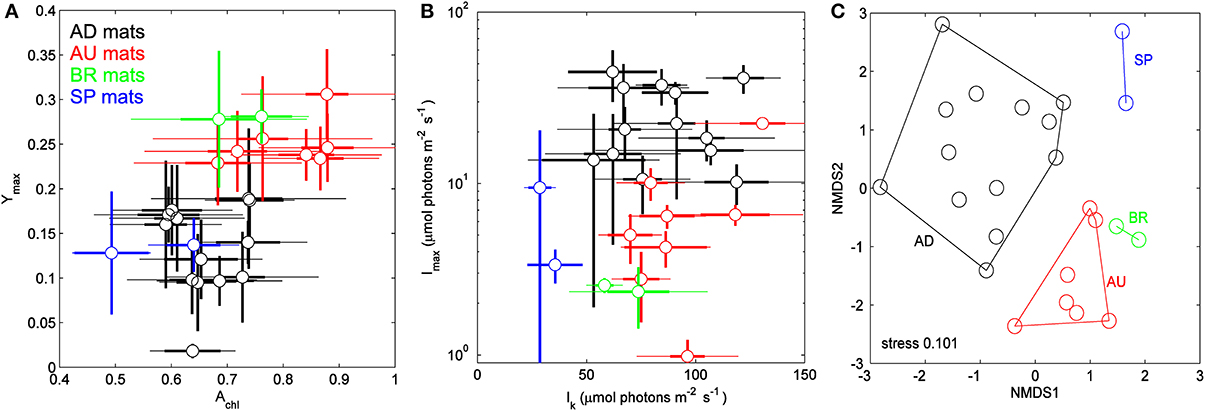
Figure 4. (A,B) Relationships between physiological parameters Achl, Ymax, Ik, and Imax in the studied cyanobacterial mats. Symbols represent averages over the cyanobacterial layers, thin and thick error-bars depict the total and vertical variability (expressed as standard deviation, SD) within the layers, respectively. (C) Multidimensional scaling plot of the distance matrix calculated based on the average values of the parameters shown in (A,B) using Euclidean metric.
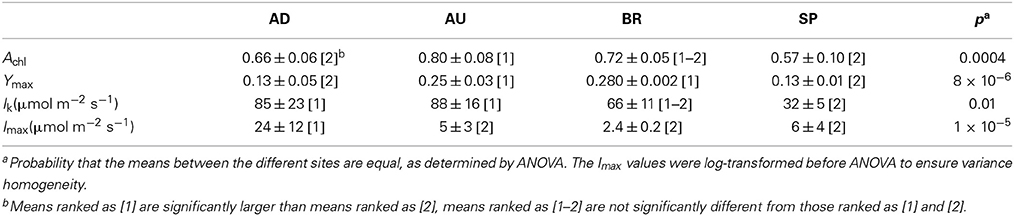
Table 2. Average values and standard deviations of the physiological parameters characterizing the mats from the different sites.
Clustering of Mats Based on the Microbial Community Composition
ARISA fingerprinting revealed that the microbial communities in the mats from a given site were more similar to each other than to those from other sites (Figure 5A). This marked endemism was further supported by significant ANOSIM test (P = 0.0001). Overall, the sampled bacterial communities shared between 18 and 34% OTUs, with 84 out of 398 OTUs (21.1%) found everywhere (i.e., at least in one mat from a given site) and 314 OTUs being mat-specific.
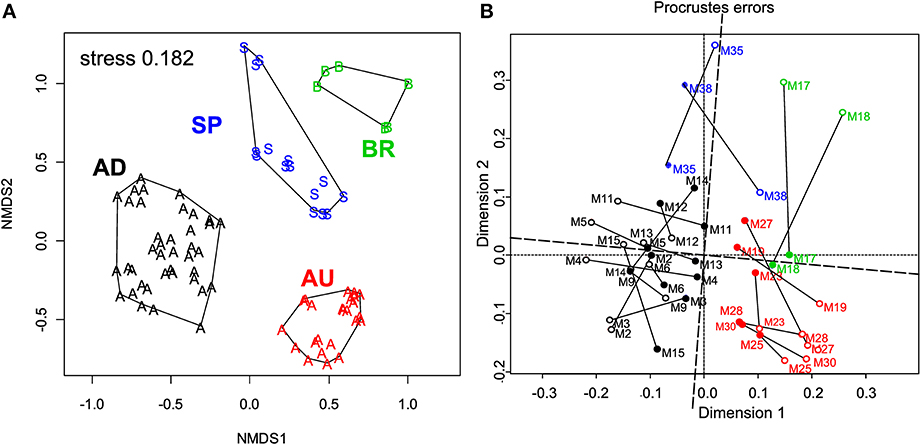
Figure 5. (A) Variation in the microbial community composition within the cyanobacterial layers of the studied mats. A Bray–Curtis dissimilarity matrix was calculated based on ARISA community profiles and is displayed in a 2D ordination space (associated stress value of 0.182). Grouping lines were added for each site a posteriori to highlight the site specificity in the community patterns. (B) Procrustes analysis of the link between the composition and function of the microbial communities in the studied mats. Open symbols represent the ARISA-based NMDS data, while the closed ones represent the functional data (Figure 4). Note the small rotation angle between the two sets of ordination axes. AD mats (m2–m15); BR mats (m17–m18); AU mats (m19–m30); SP mats (m35 and m38).
Link Between Community Composition and Function
To assess the degree of concordance between community composition and their potential function (photosynthetic capacity), we compared the bacterial community composition as depicted by the NMDS plot in Figure 5A with that of the configuration of Achl, Ymax, Ik, and Imax (Figure 4C) by Procrustes analyses. A significant concordance between ordinations was found (r = 0.605, P = 0.002, based on 1000 permutations; Figure 5B), suggesting that distinct communities were associated with distinct (potential) functions.
Environmental Parameters
Most parameters characterizing the habitat of the studied mats were obtained from literature and are summarized in Table 1. The sites strikingly differed with respect to nutrient concentrations in the overlying water, which were extremely high for the AU mats. This was very likely because the sediments at this site contained large biomass of insect larvae (alive and dead), which could be a source of nutrients (Behie et al., 2012). Additionally, the site was inundated in brief and infrequent intervals (during a spring tide). Another notable difference between the sites was due to the salinity fluctuations, which were very large at the AD and BR sites.
Discussion
Scaling of Variability in Physiological Parameters
The imaging approach used in this study enabled us to assess how the spatial variability in parameters characterizing the photosynthetic potential in cyanobacterial mats scales depending on the sampling resolution (from sub-millimeter to thousands of km). Our main result is that this scaling pattern differed depending on the studied parameter, with chlorophyll a absorptivity (Achl) and acclimation intensity (Ik) having on average the largest variability on the micrometer-scale (mostly in the vertical direction) while the maximum quantum yield of PSII (Ymax) and the irradiance at which this maximum yield is reached (Imax) were most variable on the global scale (between sites). This contrast suggests that the different physiological parameters are controlled by different environmental factors, as discussed below.
The pronounced micrometer-scale vertical variability in Achl was most likely due to the combined effects of light and nutrients. The growth of photosynthetic microbial mats is typically limited by nutrients, with most nutrients assimilated in the cyanobacterial layer originating from organic matter remineralization underneath the layer (Jonkers et al., 2003). On the other hand, light quantity strongly attenuates with depth due to intense absorption by photopigments and abiotic components of the mat matrix (Kühl and Jørgensen, 1992, 1994; Kühl et al., 1994). Thus, because of the opposing gradients in light and nutrients, cyanobacterial growth at the top and bottom of the cyanobacterial layer is likely limited by nutrients and light, respectively, whereas a location with an optimal supply of light and nutrients is somewhere in the middle. This suggests that the cyanobacterial biomass should have a maximum somewhere around this optimal location. Assuming that the measured chlorophyll a absorptivity, Achl, is a proxy for cyanobacterial biomass, our results are consistent with this interpretation: while Achl had a clear subsurface maximum in mats from sites where the N and P concentrations in the overlying water were low (AD, SP, BR), it decreased sharply from the surface in the mats from the AU site, where the nutrient concentrations in the overlying water were very high (Table 1, Figure S2). This latter characteristic of the AU site was most likely also the main factor responsible for on average the highest values of Achl (Figure 4A, Table 2) and its vertical variability (Figure 3A) in the AU mats as compared to the mats from the other sites. Additional explanation for the observed within-mat variability in Achl is the tendency of phototrophic cells to have a larger cellular pigment content when grown at lower irradiances (Falkowski, 1980; Kirk, 2011). Thus, at least in the mats from AD, SP, and BR, the observed subsurface maximum in Achl could additionally be due to this adaptation of cyanobacterial cells to light limitation that progressively increases with depth in the mat. Together, this suggests that the average cyanobacterial biomass in the cyanobacterial layer of the studied mats was mostly determined by the overlying water nutrient content, whereas the micrometer-scale distribution of the biomass, and possibly also of the average pigment content in the cyanobacterial cells, was additionally shaped by light.
With respect to the light acclimation intensity, Ik, light availability was likely the most important factor that determined both its micrometer-scale and global-scale variation. Assuming that cyanobacteria adapt to local light conditions, the sharp decrease in light intensity with depth in mats should result in cyanobacterial populations in deeper parts of the euphotic zone being acclimated to lower light intensities. This is what we generally observed for mats from all sites (Figure S2). Although we do not have reliable data on site-specific downwelling irradiances, the observation that the global-scale variability of Ik was comparable to, and in many occasions lower than, the micrometer-scale variability suggested that light variation within the photosynthetically active cyanobacterial layer was similar or larger than the variation in the average light dose received by the mats from the different sites.
Although the micrometer-scale variability of the maximum effective quantum yield, Ymax, was strongly positively correlated with the light acclimation intensity for each studied mat (see e.g., Figure S2), light availability is not a likely factor that controls its spatial distribution. This is primarily because Ymax is, by definition, a proxy for the maximum photosynthetic potential, which is reached at light intensities that are considerably lower than the acclimation intensity (in the dark for plants, at Imax ≪ Ik for the cyanobacterial populations in this study; Figure 1). Since the quantum yield of PSII determined by the PAM measurement of variable chlorophyll fluorescence relates to the redox state of the plastoquinone (PQ) pool in the photosynthetic electron transport chain (Allen, 2003), parameters that affect this redox state are likely affecting also Ymax. In the context of cyanobacterial mats, H2S and O2 are likely candidates.
The response of cyanobacterial photosynthesis to H2S is well-documented (Cohen et al., 1986; Jørgensen et al., 1986; Miller and Bebout, 2004), with several species being able to perform anoxygenic photosynthesis using H2S as the electron donor. In such cyanobacteria, H2S oxidation is facilitated by the activity of sulfide-quinone-reductase (SQR) (Bronstein et al., 2000; Griesbeck et al., 2000), which reduces the PQ molecule using the electrons transferred from H2S and can therefore decrease the apparent quantum yield of PSII. Our preliminary experiments with an axenic cyanobacterial culture embedded in agarose showed that exposure to H2S in the μM range lead to a rapid decrease in the quantum yield Y, both in the dark and light, and the yield recovery in the light occurred only after H2S decreased below a threshold in the μM range (Figure S3). A similar negative effect of H2S on Y was observed in other cyanobacterial systems (e.g., living stromatolites; Kromkamp et al., 2007). Therefore, the pronounced decrease in Ymax with depth in the cyanobacterial layer may be due to the steep increase in H2S in this layer at low-light conditions, which is a well-documented phenomenon in mats (e.g., Wieland and Kühl, 2000b; Jonkers et al., 2003; Garcia de Lomas et al., 2005; Al-Thani et al., 2014).
The effect of O2 on Y is likely because photosynthetic and respiratory electron transport chains in a cyanobacterial cell share three electron carriers in the thylakoid membrane (PQ, cytochrome b6f and the terminal oxidases; Vermaas, 2001), which makes O2 an important electron acceptor for electrons from the reduced PQ (chlororespiration) and also for those coming from PSI via ferredoxin (Mehler reaction) (Schreiber et al., 2002). Presence of O2 can therefore contribute to a partial oxidation of the PQ pool, which could manifest itself as an increase in the apparent Y. The steep decrease in O2 with depth, which is typical for cyanobacterial mats under low light conditions (Wieland and Kühl, 2000a, 2006; Al-Najjar et al., 2012), could therefore additionally be responsible for the observed decline of Ymax with depth.
In addition to environmental parameters mentioned above, part of the observed spatial variability of Ymax, Ik and Achl could be due to artifacts linked to autofluorescence (for Ymax and Ik) and absorption (for Achl) by photosynthetically inactive components in the cyanobacterial layer, such as dead/inactive cyanobacterial cells, pigment degradation products or mineral particles. Such components are abundant in the cyanobacterial layer of microbial mats (e.g., Kühl et al., 1994; Al-Najjar et al., 2012), and because their fluorescence is not variable but possibly comparable to that from the PSII of photosynthetically active cells, the detected quantum yield of PSII can appear lower. Similarly, their absorption in the same wavelength range as chlorophyll a could increase the apparent Achl. These effects may have contributed to the differences in the “baseline” of these parameters and thus also their apparent global variability. The importance of this contribution could, however, not be estimated based on our present data.
In contrast to the monotonous decrease in the effective quantum yield, Y, with the actinic irradiance, I, which is characteristic for plants (White and Critchley, 1999) and eukaryotic algae (Flameling and Kromkamp, 1998), our measurements in cyanobacterial mats showed that the relationship between Y and I was not monotonous (Figure 1). Instead, Y reached a maximum at actinic intensities Imax that varied in the range from one to several tens of μmol photons m−2 s−1 (Figure 4B). The spatial patterns for Imax within a given mat were not very clear (see, e.g., Figure 2), primarily because of the noise in the fluorescence yield images. Although we were able to find a suitable mathematical expression for this relationship (Equation 2), further research is required to understand why Y reached a maximum at intensities Imax > 0 and what controls this behavior.
Implications for Microbial Ecology
Our imaging data demonstrate that the variability of a specific function (here photosynthesis) in a microbial community (here the cyanobacterial layer) can be at least as large on the micrometer-scale within the community as it is on the global scale between communities from different locations. As discussed above, this is primarily due to the strong within-mat variability of the physico-chemical parameters that control the function. Furthermore, our comparison of the cyanobacterial layers based on their average functional (photosynthetic) potential and microbial community composition revealed that the mats clustered according to their site of origin (Figures 4C, 5A) and that the functional and compositional data were significantly linked (Figure 5B). Based on these results we expect that if physico-chemical parameters exhibit pronounced variability within a microbial community, which is common in transport-limited systems such microbial mats and sediments, the community composition will also vary at least as much on the micrometer-scale (within community) as it does on the global scale (between communities). This implies that analyses of the microbial community composition that ignore this micrometer-scale variability (e.g., by sampling bulk volumes of sediments rather than layer-by-layer) may have a limited value in identifying correlations between the microbial composition, function and the corresponding environmental settings. In other words, when sampling microbial communities in order to identify these correlations, the prefix “micro” should refer not only to the size of the inhabitants but also to the required spatial resolution of sampling.
Interestingly, despite the large micrometer-scale variability of the functional potential within each cyanobacterial layer community, distinct communities from a given site were on average characterized by a distinct, albeit highly variable, functional potential (Figure 4). This suggests that out of the environmental parameters discussed in the previous section, there are possibly one or more factors that have the most dominant influence on the composition and function of the studied cyanobacterial mats. Unfortunately, these dominant factors could not be identified from the limited dataset presented in this study.
Conflict of Interest Statement
The authors declare that the research was conducted in the absence of any commercial or financial relationships that could be construed as a potential conflict of interest.
Acknowledgments
We thank Dr. Patrick Meister and Dr. Susanne Borgwardt (both MPI Bremen, Germany) for providing samples of the mats from Brazil and Spain, Dr. Alistair Grinham (University of Queensland, Australia) for providing the mats from the Exmouth Gulf, Prof. Dr. Ulrich Fischer for providing the cyanobacteria culture. We thank the reviewers for comments and useful suggestions that helped improve the manuscript. This work was financially supported by the Max-Planck Society, the Yusef Jameel Scholarship, the Danish Council for Independent Research | Natural Sciences, and the Carlsberg Foundation.
Supplementary Material
The Supplementary Material for this article can be found online at: http://www.frontiersin.org/journal/10.3389/fmicb.2014.00406/abstract
References
Abed, R. M. M., Polerecky, L., Al Najjar, M., and De Beer, D. (2006). Effect of temperature on photosynthesis, oxygen consumption and sulfide production in an extremely hypersaline cyanobacterial mat. Aquat. Microb. Ecol. 44, 21–30. doi: 10.3354/ame044021
Adame, M. F., Reef, R., Grinham, A., Holmes, G., and Lovelock, C. E. (2012). Nutrient exchange of extensive cyanobacterial mats in an arid subtropical wetland. Marine Freshw. Res. 63, 457–467. doi: 10.1071/MF11133
Allen, J. F. (2003). State transitions - a question of balance. Science 299, 1530–1532. doi: 10.1126/science.1082833
Al-Najjar, M. A. A., De Beer, D., Jørgensen, B. B., Kühl, M., and Polerecky, L. (2010). Conversion and conservation of light energy in a photosynthetic microbial mat ecosystem. ISME J. 4, 440–449. doi: 10.1038/ismej.2009.121
Al-Najjar, M. A. A., De Beer, D., Kühl, M., and Polerecky, L. (2012). Light utilization efficiency in photosynthetic microbial mats. Environ. Microbiol. 4, 982–992. doi: 10.1111/j.1462-2920.2011.02676.x
Al-Thani, R., Al-Najjar, M. A., Al-Raei, A. M., Ferdelman, T., Thang, N. M., Al Shaikh, I., et al. (2014). Community structure and activity of a highly dynamic and nutrient-limited hypersaline microbial mat in Um Alhool Sabkha, Qatar. PLoS ONE 9:e92405. doi: 10.1371/journal.pone.0092405
Baker, N. R. (2008). Chlorophyll fluorescence: a probe of photosynthesis in vivo. Annu. Rev. Plant Biol. 59, 89–113. doi: 10.1146/annurev.arplant.59.032607.092759
Behie, S. W., Zelisko, P. M., and Bidochka, M. J. (2012). Endophytic insect-parasitic fungi translocate nitrogen directly from insects to plants. Science 336, 1576–1577. doi: 10.1126/science.1222289
Boer, S. I., Hedtkamp, S. I. C., Van Beusekom, J. E. E., Fuhrman, J. A., Boetius, A., and Ramette, A. (2009). Time- and sediment depth-related variations in bacterial diversity and community structure in subtidal sands. ISME J. 3, 780–791. doi: 10.1038/ismej.2009.29
Bronstein, M., Schutz, M., Hauska, G., Padan, E., and Shahak, Y. (2000). Cyanobacterial sulfide-quinone reductase: cloning and heterologous expression. J. Bacteriol. 182, 3336–3344. doi: 10.1128/JB.182.12.3336-3344.2000
Campbell, D., Hurry, V., Clarke, A. K., Gustafsson, P., and Oquist, G. (1998). Chlorophyll fluorescence analysis of cyanobacterial photosynthesis and acclimation. Microbiol. Mol. Biol. Rev. 62, 667–683.
Cardinale, M., Brusetti, L., Quatrini, P., Borin, S., Puglia, A. M., Rizzi, A., et al. (2004). Comparison of different primer sets for use in automated ribosomal intergenic spacer analysis of complex bacterial communities. Appl. Environ. Microbiol. 70, 6147–6156. doi: 10.1128/AEM.70.10.6147-6156.2004
Caumette, P., Matheron, R., Raymond, N., and J.C., R. (1994). Microbial mats in the hypersaline ponds of Mediterranean salterns (Salins-de-Girard, France). FEMS Microbiol. Ecol. 13, 273–286. doi: 10.1111/j.1574-6941.1994.tb00074.x
Cohen, Y., Jørgensen, B. B., Revsbech, N. P., and Poplawski, R. (1986). Adaptation to hydrogen-sulfide of oxygenic and anoxygenic photosynthesis among Cyanobacteria. Appl. Environ. Microbiol. 51, 398–407.
Des Marais, D. J. (2003). Biogeochemistry of hypersaline microbial mats illustrates the dynamics of modern microbial ecosystems and the early evolution of the biosphere. Biol. Bull. 204, 160–167. doi: 10.2307/1543552
Falkowski, P. G. (1980). “Light-shade adaptation in marine phytoplankton,” in Primary Productivity in the Sea, ed P. G. Falkowski (New York, NY: Plenum Press), 99–119.
Flameling, I. A., and Kromkamp, J. (1998). Light dependence of quantum yields for PSII charge separation and oxygen evolution in eucaryotic algae. Limnol. Oceanogr. 43, 284–297. doi: 10.4319/lo.1998.43.2.0284
Garcia de Lomas, J., Corzo, A., Garcia, C. M., and Van Bergeijk, S.,A (2005). Microbenthos in a hypersaline tidal lagoon: factors affecting microhabitat, community structure and mass exchange at the sediemnt-water interface. Aquat. Microb. Ecol. gy 38, 53–69. doi: 10.3354/ame038053
Garcia-Pichel, F., Kühl, M., Nübel, U., and Muyzer, G. (1999). Salinity-dependent limitation of photosynthesis and oxygen exchange in microbial mats. J. Phycol. 35, 227–238. doi: 10.1046/j.1529-8817.1999.3520227.x
Gower, J. C. (1975). Generalized procrustes analysis. Phychometrika 40, 33–51. doi: 10.1007/BF02291478
Griesbeck, C., Hauska, G., and Schütz, M. (2000). “Biological sulfide-oxidation: sulfide-quinone reductase (sqr), the primary reaction,” in Recent Research Developments in Microbiology, Vol. 4, ed S. G. Pandalai (Trivadrum: Research Signpost), 179–203.
Jonkers, H. M., Ludwig, R., De Wit, R., Pringault, O., Muyzer, G., Niemann, H., et al. (2003). Structural and functional analysis of a microbial mat ecosystem from a unique permanent hypersaline inland lake: ‘La Salada de Chiprana’ (NE Spain). FEMS Microbiol. Ecol. 44, 175–189. doi: 10.1016/S0168-6496(02)00464-6
Jørgensen, B. B., Cohen, Y., and Revsbech, N. P. (1986). Transition from anoxygenic to oxygenic photosynthesis in a Microcoleus-chthonoplastes cyanobacterial mat. Appl. Environ. Microbiol. 51, 408–417.
Kirk, J. T. O. (2011). Light and Photosynthesis in Aquatic Ecosystems. Cambridge: Cambridge University Press.
Kromkamp, J. C., Perkins, R., Dijkman, N., Consalvey, M., Andres, M., and Reid, R. P. (2007). Resistance to burial of cyanobacteria in stromatolites. Aquat. Microb. Ecol. 48, 123–130. doi: 10.3354/ame048123
Kühl, M. (1993). “Photosynthesis, O2 respiration and sulfur cycling in a cyanobacterial biofilm,” in Trends in Microbial Ecology, eds R. Guerrero and C. Pedros-Alio (Spanish Society for Microbiology), 163–167.
Kühl, M. (2005). Optical microsensors for analysis of microbial communities. Methods Enzymol. 397, 166–199. doi: 10.1016/S0076-6879(05)97010-9
Kühl, M., and Fenchel, T. (2000). Bio-optical characteristics and the vertical distribution of photosynthetic pigments and photosynthesis in an artificial cyanobacterial mat. Microb. Ecol. 40, 94–103. doi: 10.1007/s002480000061
Kühl, M., Glud, R. N., Ploug, H., and Ramsing, N. B. (1996). Microenvironmental control of photosynthesis and photosynthesis-coupled respiration in an epilithic cyanobacterial biofilm. J. Phycol. 32, 799–812. doi: 10.1111/j.0022-3646.1996.00799.x
Kühl, M., and Jørgensen, B. B. (1992). Spectral light measurements in microbenthic phototrophic communities with a fiber-optic microprobe coupled to a sensitive diode array detector. Limnol. Oceanogr. 37, 1813–1823. doi: 10.4319/lo.1992.37.8.1813
Kühl, M., and Jørgensen, B. B. (1994). The light-field of microbenthic communities - radiance distribution and microscale optics of sandy coastal sediments. Limnol. Oceanogr. 39, 1368–1398. doi: 10.4319/lo.1994.39.6.1368
Kühl, M., Lassen, C., and Jørgensen, B. B. (1994). “Optical properties of microbial mats: light measurements with fiber-optic microprobes,” in Microbial Mats: Structure, Development and Environmental Significance, eds J. Stal and P. Caumette (Berlin: Springer), 149–167.
Kühl, M., and Polerecky, L. (2008). Functional and structural imaging of phototrophic microbial communities and symbioses. Aquat. Microb. Ecol. 53, 99–118. doi: 10.3354/ame01224
Lovelock, C., Grinham, A., Adame, M. F., and Penrose, H. (2010). Elemental composition and productivity of cyanobacterial mats in an arid zone estuary in north Western Australia. Wetlands Ecol. Manag. 18, 37–47. doi: 10.1007/s11273-009-9146-6
Miller, S. R., and Bebout, B. M. (2004). Variation in sulfide tolerance of photosystem II in phylogenetically diverse cyanobacteria from sulfidic habitates. Appl. Environ. Microbiol. 70, 736–744. doi: 10.1128/AEM.70.2.736-744.2004
Nübel, U., Garcia-Pichel, F., Kühl, M., and Muyzer, G. (1999). Spatial scale and the diversity of benthic cyanobacteria and diatoms in a salina. Hydrobiologia 401, 199–206. doi: 10.1023/A:1003702814150
Oksanen, J., Blanchet, F. G., Kindt, R., Legendre, P., Peter, R., Minchin O'Hara, R. B., et al. (2012). Vegan: Community Ecology Package. R package Version 2.0–4.
Peres-Neto, P. R., and Jackson, D. A. (2001). How well do multivariant data sets match? The advantages of procrustean superimposition approach over the Mantel test. Oecologia 129, 169–178. doi: 10.1007/s004420100720
Pinckney, J. L., Long, R. A., and Paerl, H. W. (2011). Structural and functional responses of microbial mats to reductions in nutrient and salinity stressors in a Bahamian hypersaline lagoon. Aquat. Microb. Ecol. 62, 289–298. doi: 10.3354/ame01475
Platt, T., and Jassby, A. D. (1976). The relationship between photosynthesis and light for natural assemblages of coastal marine phytoplankton. J. Phycol. 12, 421–430.
Polerecky, L., Bissett, A., Al-Najjar, M., Faerber, P., Osmers, H., Suci, P. A., et al. (2009). Modular spectral imaging system for discrimination of pigments in cells and microbial communities. Appl. Environ. Microbiol. 75, 758–771. doi: 10.1128/AEM.00819-08
Ramette, A. (2007). Multivariate analyses in microbial ecology. FEMS Microbiol. Ecol. 62, 142–160. doi: 10.1111/j.1574-6941.2007.00375.x
Ramette, A. (2009). Quantitative community fingerprinting methods for estimating the abundance of operational taxonomic units in natural microbial communities. Appl. Environ. Microbiol. 75, 2495–2505. doi: 10.1128/AEM.02409-08
Roeselers, G., Norris, T. B., Castenholz, R. W., Rysgaard, S., Glud, R. N., Kühl, M., et al. (2007). Diversity of phototrophic bacteria in microbial mats from Arctic hot springs (Greenland). Environ. Microbiol. 9, 26–38. doi: 10.1111/j.1462-2920.2006.01103.x
Schreiber, U., Gademann, R., Bird, P., Ralph, P. J., Larkum, A. W. D., and Kühl, M. (2002). Apparent light requirement for activation of photosynthesis upon rehydration of disiccated beachrock microbial mat. J. Phycol. 38, 125–134. doi: 10.1046/j.1529-8817.2002.01103.x
Schreiber, U., Gademann, R., Ralph, P. J., and Larkum, A. W. D. (1997). Assessment of photosynthetic performance of Prochloron in Lissoclinum patella in hospite by chlorophyll fluorescence measurements. Plant Cell Physiol. 38, 945–951. doi: 10.1093/oxfordjournals.pcp.a029256
Schreiber, U., Kühl, M., Klimant, I., and Reising, H. (1996). Measurement of chlorophyll fluorescence within leaves using a modified PAM Fluorometer with a fiber-optic microprobe. Photosyn. Res. 47, 103–109. doi: 10.1007/BF00017758
Seckbach, J., and Oren, A. (2010). Microbial Mats: Modern and Ancient Microorganisms in Stratified Systems. Heidelberg: Springer.
Stal, L. (2000). “Cyanobacterial mats and stromatolites,” in The Ecology of Cyanobacteria, eds A. B. Whitton and M. Potts (Dordrecht: Kluwer Academic Publishers), 61–120.
Vasconcelos, C., Warthmann, R., Mckenzie, J. A., Visscher, P. T., Bittermann, A. G., and Van Lith, Y. (2006). Lithifying microbial mats in Lagoa Vermelha, Brazil: modern precambrian relics? Sediment. Geol. 185, 175–183. doi: 10.1016/j.sedgeo.2005.12.022
Vermaas, W. F. J. (2001). “Photosynthesis and respiration in cyanobacteria,” in Encyclopedia of Life Sciences (London: Nature Publishing Group), 245–251.
Webb, W. L., Newton, M., and Starr, D. (1974). Carbon-dioxide exchange of Alnus-Rubra - mathematical-model. Oecologia 17, 281–291. doi: 10.1007/BF00345747
White, A. J., and Critchley, C. (1999). Rapid light curves: a new fluorescence method to assess the state of the photosynthetic apparatus. Photosyn. Res. 59, 63–72. doi: 10.1023/A:1006188004189
Wieland, A., and Kühl, M. (2000a). Irradiance and temperature regulation of oxygenic photosynthesis and O-2 consumption in a hypersaline cyanobacterial mat (Solar Lake, Egypt). Mar. Biol. 137, 71–85. doi: 10.1007/s002270000331
Wieland, A., and Kühl, M. (2000b). Short-term temperature effects on oxygen and sulfide cycling in a hypersaline cyanobacterial mat (Solar Lake, Egypt). Marine Ecol. Progress Series 196, 87–102. doi: 10.3354/meps196087
Wieland, A., and Kühl, M. (2006). Regulation of photosynthesis and oxygen consumption in a hypersaline cyanobacterial mat (Camargue, France) by irradiance, temperature and salinity. FEMS Microbiol. Ecol. 55, 195–210. doi: 10.1111/j.1574-6941.2005.00031.x
Keywords: spatial link between structure and function, photosynthetic microbial mats, imaging PAM, biogeography, hyperspectral imaging, microbial community structure
Citation: Al-Najjar MAA, Ramette A, Kühl M, Hamza W, Klatt JM and Polerecky L (2014) Spatial patterns and links between microbial community composition and function in cyanobacterial mats. Front. Microbiol. 5:406. doi: 10.3389/fmicb.2014.00406
Received: 12 May 2014; Accepted: 18 July 2014;
Published online: 06 August 2014.
Edited by:
Steve Lindemann, Pacific Northwest National Laboratory, USAReviewed by:
Haluk Beyenal, Washington State University, USAHans C. Bernstein, Pacific Northwest National Laboratory, USA
Copyright © 2014 Al-Najjar, Ramette, Kühl, Hamza, Klatt and Polerecky. This is an open-access article distributed under the terms of the Creative Commons Attribution License (CC BY). The use, distribution or reproduction in other forums is permitted, provided the original author(s) or licensor are credited and that the original publication in this journal is cited, in accordance with accepted academic practice. No use, distribution or reproduction is permitted which does not comply with these terms.
*Correspondence: Mohammad A. A. Al-Najjar, Marine Microbial Ecology Group, Red Sea Research Center, KAUST, 23955-6900 Thuwal, Saudi Arabia e-mail: mohammad.alnajjar@kaust.edu.sa;
Lubos Polerecky, Department of Earth Sciences - Geochemistry, Faculty of Geosciences, Utrecht University, Budapestlaan 4, 3584 CD Utrecht, Netherlands e-mail: l.polerecky@uu.nl