 Michael Siegert
 Xiu-Fen Li
 Matthew D. Yates
 Bruce E. Logan
- 1Department of Civil and Environmental Engineering, Penn State University, University Park, PA, USA
- 2School of Environmental and Civil Engineering, Jiangnan University, Wuxi, China
High current densities in microbial electrolysis cells (MECs) result from the predominance of various Geobacter species on the anode, but it is not known if archaeal communities similarly converge to one specific genus. MECs were examined here on the basis of maximum methane production and current density relative to the inoculum community structure. We used anaerobic digester (AD) sludge dominated by acetoclastic Methanosaeta, and an anaerobic bog sediment where hydrogenotrophic methanogens were detected. Inoculation using solids to medium ratio of 25% (w/v) resulted in the highest methane production rates (0.27 mL mL−1 cm−2, gas volume normalized by liquid volume and cathode projected area) and highest peak current densities (0.5 mA cm−2) for the bog sample. Methane production was independent of solid to medium ratio when AD sludge was used as the inoculum. 16S rRNA gene community analysis using pyrosequencing and quantitative PCR confirmed the convergence of Archaea to Methanobacterium and Methanobrevibacter, and of Bacteria to Geobacter, despite their absence in AD sludge. Combined with other studies, these findings suggest that Archaea of the hydrogenotrophic genera Methanobacterium and Methanobrevibacter are the most important microorganisms for methane production in MECs and that their presence in the inoculum improves the performance.
Introduction
In a microbial electrolysis cell (MEC), the voltage generated by bacteria degrading organic matter on the anode can result in electrical current generation and hydrogen production at the cathode when additional power is added to the system (Liu et al., 2005; Rozendal et al., 2008; Logan and Rabaey, 2012). Hydrogenotrophic methanogens in the reactor can further convert hydrogen gas to methane gas by reducing CO2 (Clauwaert and Verstraete, 2009; Villano et al., 2011). It is also now known that methanogens can directly catalyze the release of electrons on the cathode to make methane via electromethanogenesis (Cheng et al., 2009; Villano et al., 2010; Lohner et al., 2014), circumventing the dependence on hydrogen gas. The production of methane rather than hydrogen gas may be desirable as methane can readily be used in the existing natural gas infrastructure. Furthermore, microbiological methane produced from CO2 and hydrogen gas is a renewable biofuel that can be stored, transported and converted to syngas. Biological conversion of hydrogen gas to methane can occur on the anode or the cathode in single-chamber MECs due to the release of the hydrogen gas into solution (Sasaki et al., 2011). Two-chamber MECs have a membrane between the electrodes to avoid hydrogen gas crossover from the cathode to the anode, but the use of a membrane can lead to pH changes in the system that reduce performance primarily due to a low anode pH (Rozendal et al., 2006; Kim et al., 2007). In single-chamber systems there is no membrane, and in general they produce higher current densities than two-chambered MECs (Call and Logan, 2008). Single-chamber MECs are simple in design, easier to construct, and they are often used for screening experiments to evaluate biodegradability of different wastewaters (Call and Logan, 2011; Ren et al., 2013).
The microorganisms that develop on the anode in MECs are well understood, particularly when acetate is used as the fuel. Most exoelectrogenic biofilms in MECs that produce high current densities consist predominantly of microorganisms most similar to various Geobacter species, and most often Geobacter sulfurreducens (Chae et al., 2008; Torres et al., 2009; Yates et al., 2012). Microbial fuel cells (MFCs) and MECs inoculated with a wide diversity of inocula, from both natural freshwater environments and engineered reactors (e.g., wastewater treatment plants), typically converge to communities containing predominantly G. sulfurreducens (Holmes et al., 2004; Yates et al., 2012). Both acetate and hydrogen can be used by G. sulfurreducens, although it has been shown that dissolved hydrogen gas can reduce acetate oxidation under iron reducing conditions (Brown et al., 2005). Based on this observation with iron as the terminal electron acceptor, it is likely that the utilization of hydrogen gas by microorganisms on the anode could reduce acetate oxidation by bacteria such as G. sulfurreducens. The use of hydrogen gas by the anodic biofilm results in high rates of hydrogen gas recycling, where hydrogen from the cathode is used to produce current at the anode (Rozendal et al., 2008; Lee et al., 2009; Tartakovsky et al., 2009). Hydrogen gas recycling is not desirable as electrical power is wasted by cycling hydrogen between the electrodes with no net gas production (Wang et al., 2009; Rader and Logan, 2010). The conversion of hydrogen to methane eliminates hydrogen gas recycling as there is no further conversion of methane to another chemical product.
The methanogenic microorganisms that develop on cathodes in single-chamber MECs are not well studied, particularly in systems where methane is the predominant gas recovered from the reactor. It seems likely that hydrogenotrophic methanogens would be most effective when using hydrogen during growth on the cathode, and electrotrophic methanogens must necessarily attach to the cathode. When acetate is used as the fuel, methane can also be produced through acetoclastic methanogenesis. Therefore, methanogens can produce methane on both the anode and cathode using either acetate or hydrogen gas. The first report of electromethanogenesis identified Methanobacterium palustre as the primary methanogen on a biocathode maintained at a set potentials ranging from −0.5 to −1.0 V vs. a standard hydrogen electrode (Cheng et al., 2009). Since then, primarily unknown Methanobacterium species have been found on methanogenic biocathodes (Sasaki et al., 2011; Van Eerten-Jansen et al., 2013; Jiang et al., 2014). Other methanogens identified to be present, but less abundant, on the cathodes and anodes of MECs and microbial fuel cells (MFCs) include Methanobrevibacter, Methanocorpusculum, Methanosarcina, and Methanoculleus species (Sasaki et al., 2011; Shehab et al., 2013; Jiang et al., 2014). All these genera are exclusively hydrogenotrophic methanogens (except Methanosarcina which uses acetate as well), despite the use of acetate as the fuel in these systems. Different communities of Archaea can develop when the operational conditions of the reactor are changed. For example, in MECs fed with waste activated sludge, air was used to try to inhibit the growth of methanogens on the anodes, and members of Methanomicrobiales, Methanosarcinaceae, and Methanosaetaceae prevailed while only low numbers of Methanobacteriales were found (Lu et al., 2012). On anodes of open circuit MFCs fed acetate, Methanocorpusculum species predominanted (Shehab et al., 2013). When ethanol was used as a substrate in two-chamber MECs, the predominant anodic genus was Methanobrevibacter (Parameswaran et al., 2010).
In order to better understand the methanogenic communities that are responsible for methane production in acetate-fed MECs operated with current generation, we examined microbial communities and gas production rates in MECs using two different inoculum sources: sediments from a natural bog; and anaerobic digester (AD) sludge from a local wastewater treatment plant. While acetate is a major precursor for methanogenesis in various freshwater sediments (Thebrath et al., 1993; Zepp Falz et al., 1999; Chan et al., 2002), although in some cases no acetoclastic methanogens are detected (Nüsslein et al., 2001), bogs in the local area of our laboratory have been found to comprise a greater variety of different methanogens among which hydrogenotrophic methanogens were found as well (Steinberg and Regan, 2008). The use of a bog sample in an MFC was found to result in more rapid acclimation of the anode for current generation, reaching maximum power production over fewer cycles than MFCs inoculated with domestic wastewater (Yates et al., 2012). AD sludge at most domestic wastewater treatment plants predominantly contains acetoclastic methanogens. The sludge has a relatively high organic load compared to the more predominantly inorganic composition of bog sediments. Therefore, we inoculated reactors with either bog sediment or AD sludge at different solids to medium ratios (0.01, 0.1, 1, 10, and 25%; w/v). We examined the effect of inoculum size on the subsequent methane production rates and current densities, and the extent of hydrogen gas recycling by Coulombic efficiencies (Coulombs produced versus those in the added substrate). To characterize microbial community in the electrode biofilms, we used 16S rRNA gene pyrosequencing to determine diversity and composition of the inocula and quantitative PCR (qPCR) to quantify archaeal and bacterial 16S rRNA genes.
Materials and Methods
MEC Reactors and Operation
Mini-MECs were prepared as described by Call and Logan (2011) using 5 mL clear glass serum bottles (Wheaton, Millville, NJ, USA). Both electrodes were graphite plates 0.32 cm thick, 1.5 cm long, and 1 cm wide, with a total of 1.5 cm2 projected surface area (Grade GM-10; GraphiteStore, Buffalo Grove, IL, USA). The graphite plates were polished using sandpaper (grit type 400 and 1500), cleaned by soaking in 1 M HCl overnight, and connected to the circuit using titanium wires (5 cm long, 0.08 cm diameter; McMaster-Carr, Cleveland, OH, USA) that pierced the thick rubber stopper used to seal the bottles with an aluminum crimp top. The headspace in the bottles was vacuumed, flushed with an oxygen-free gas mix (CO2/N2, 20/80) for 10 min, and autoclaved.
Voltage was added to the circuit using a power supply (model 1665; BK Precision, Yorba Linda, CA, USA), with reactors operated in fed-batch mode. Each test lead attached to the positive terminal had a 10 Ω resistor connected in series for recording the voltage produced by each reactor using a multimeter (model 34972A; Agilent Technologies, Santa Clara, CA, USA) in 20 min intervals. A fixed voltage of 0.7 V was applied to all reactors. All reactors were operated at 30°C in the dark without shaking.
AD sludge was collected from a secondary digester at the Pennsylvania State University Wastewater Treatment Plant (University Park, PA, USA). Sediment from a freshwater bog (Black Moshannon State Park, Philipsburg, PA, USA, 40°54 ′20.6″N, 078°03′11.1″W, 20 cm water depth) was placed into glass bottles that were completely filled to minimize oxygen contamination, and then stored at 4°C in the dark. To remove organics it was washed three times using an equal volume of the medium and centrifugation at 13000 × g for 20 min and stored at 4°C.
All chemicals were purchased from VWR (Radnor, PA, USA) in the highest available purity. The medium was a phosphate buffered saline (PBS, 100 mM, pH 7.0, containing NaH2PO4 × H2O 9.94 g/L, Na2HPO4 × H2O 5.5 g/L, NH4Cl 310 mg/L, KCl 130 mg/L) with 10 mM sodium acetate. The medium was sparged with N2 gas for 40 min, autoclaved to remove trace oxygen and cooled down under a flow of N2, supplemented with 2.5 g/L (30 mM) NaHCO3 (separately sterilized), 5 mL/L of a vitamins solution (mg/L: pyridoxine HCl, 10; thiamin HCl, 5; riboflavin, 5; nicotinic acid, 5; calcium pantothenate, 5; vitamin B12, 5; p-aminobenzoic acid, 5; thioctic acid, 5; biotin, 2; folic acid, 2; Wolin et al., 1964) and 12.5 mL/L of a minerals solution (g/L: nitrilotriacetic acid, 1.5; MgSO4 × 7H2O, 3; NaCl, 1; MnSO4 × H2O, 0.5; NiCl2 × 6H2O, 0.2; FeSO4 × 7H2O, 0.1; CoCl2, 0.1; CaCl2 × 2H2O, 0.1; ZnSO4, 0.1; CuSO4 × 5H2O, 0.01; AlK[SO4]2, 0.01; H3BO3, 0.01; Na2MoO4 × 2H2O, 0.01). All inocula were prepared in an anaerobic glove box at dilutions of 0.01, 0.1, 1, 10, and 25% (w/v) in PBS medium.
The different inocula (5 mL) were injected into mini-MECs through the stopper using a sterile needle and syringe, leaving 3 mL of headspace. Tests were conducted in triplicates. A batch cycle was considered complete when current dropped below 0.01 mA or methane did not increase. A new cycle was started by injecting 50 μL of a 1 M sodium acetate solution into each reactor. After three cycles (1–2 weeks for each cycle, over a total period of ~1 month) the inoculum-medium mixture was removed from the reactors and 5 mL fresh PBS medium was added. This procedure was repeated until methane production reached stable performance over 3 cycles. Between each cycle, the reactor headspace was vacuumed and purged using CO2/N2(20/80) for 10 min. Gas production was evaluated at the point of maximum current generation (30 h for AD, 46 h for bog).
Calculations
Reactor performance was evaluated as previously described (Logan et al., 2008; Wagner et al., 2009), except as noted. Current density was normalized by the anode surface area (mA cm−2). Methane production rate was normalized to the reactor liquid volume (mL mL−1 cm−2) and the anode surface area (1.5 × 2 cm2). Methane recovery efficiency (CH4 recovery, CRE in %), was calculated as the ratio of methane recovered to the maximum possible methane recovery based on the acetate removed (estimated from chemical oxygen demand, COD) and electrical energy input. Coulombic efficiency (CE in %) was calculated from Coulombs transferred compared to Coulombs from the substrate removed (COD).
Gas Analysis
Methane concentrations in the headspace were determined using a 250 μL airtight syringe (Hamilton, Reno, NV, USA) and a gas chromatographs (model SRI 310C, 6 foot molecular sieve column in continuous mode at 80°C, SRI Instruments, Torrance, CA, USA).
Community Analysis
Biofilms were dried on the electrodes in a sterile laminar flow hood for about 10 min and then collected by scraping the electrode surface with a sterile scalpel. DNA was extracted using a PowerSoil DNA Isolation Kit (MoBio Laboratories, Inc., Carlsbad, CA, USA) according to the manufacturer's instructions. Bacteria and Archaea were quantified using qPCR as described previously (Takai and Horikoshi, 2000; Nadkarni et al., 2002). Methanogens were quantified by targeting their mcrA genes (Steinberg and Regan, 2009) and Geobacter was quantified using an 16S rRNA gene assay (Holmes et al., 2002). To determine the microbial diversity of the two inocula and the reactor electrodes, as well as in the solutions, 16S rRNA genes were sequenced using 454 pyrosequencing with the primers 341F (5′-CCTAYGGGGYGCASCAG-3′) and 1000R (5′-GAGARGWRGTGCATGGCC-3′) for Archaea (Gantner et al., 2011) as well as 27F (5′-AGAGTTTGATCCTGGCTCAG-3′; Lane, 1991) and 519R (5′-GTNTTACNGCGGCKGCTG-3′; Ishak et al., 2011) for Bacteria. DNA extracts of the reactors with different size inocula were pooled prior to sequencing. Mothur's standard operating procedure for 454 pyrosequencing and a cutoff of at least 300 base pairs was used for data analysis (Schloss et al., 2011). Composite phylogenetic trees of the two inocula were constructed using the arb software package with the SILVA 115 NR99 database using a cutoff of 400 base pairs including redundant sequences to allow a quantitative estimate of clusters found in the samples (Pruesse et al., 2007). With this cutoff, 700 random archaeal and 900 random bacterial sequences were incorporated by the arb maximum parsimony algorithm into the tree. All raw pyrosequencing reads were deposited under the sample accession numbers SRX652342-SRX652357 in the Sequence Read Archive database (Table 1).
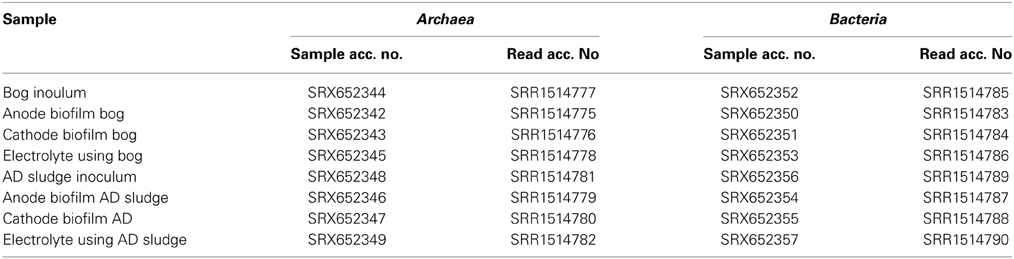
Table 1. List of samples with corresponding accession numbers for the Sequence Read Archive http://ncbi.nlm.nih.gov/sra.
To obtain the Shannon diversity indices, the mothur software package was used. The Shannon index H was calculated using:
where s is the number of species and p is the ratio of individuals counted to the total number of individuals (Shannon, 1948). The Shannon index is an indicator of the diversity of the population regardless of the abundance of individual species. A Bray-Curtis similarity coefficient C was also calculated using the mothur software, as:
where w is the lesser value of the common species in the populations A and B, a is the number of individual specimens counted in the population A, and b is the same number in the population B (Bray and Curtis, 1957). For the Bray-Curtis similarity coefficient a value of 1 means that the two populations are identical and 0 means that they are completely separate. The similarity coefficient C is related to the dissimilarity coefficient D = 1–C.
Results
Methane Production
Gas production from the bog samples increased in proportion to the mass of the inoculum, from 0.08 mL mL−1 cm−2 (0.01% original bog inoculum) to 0.27 mL mL−1 cm−2 (25%) (Figure 1). In contrast, methane gas production with the AD inoculum was nearly the same for the different inoculum masses, ranging from 0.16 mL mL−1 cm−2 (0.01%) to a maximum of 0.20 mL mL−1 cm−2 (1%). COD removal was >80% in all AD tests, but <80% and more variable using the bog inoculum (Figure 2).
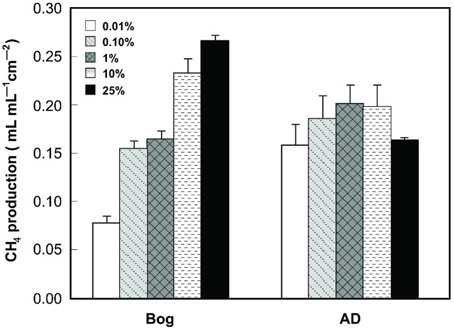
Figure 1. CH4 production (within 40 h) as a function of original inoculum size using either bog or anaerobic digester sludge (AD) inoculum after steady conditions reached after 3 cycles.
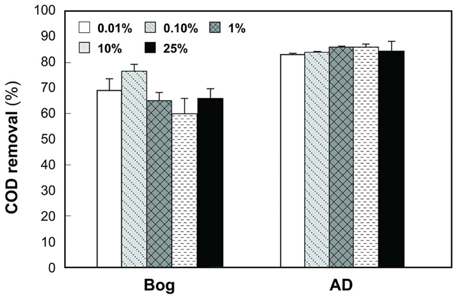
Figure 2. COD removals as a function of original inoculum size with anaerobic digester (AD) sludge or bog inocula.
Current Generation
Current densities produced by the bog and AD samples were quite different, but generally showed results consistent with methane generation rates. Peak current densities of the bog samples increased with the inoculum mass, ranging from 0.21 mA cm−2 (0.01%) to 0.50 mA cm−2 (25%, Figure 3). There were relatively small changes in current densities produced with the different AD inoculum mass. The peak current densities for the AD samples increased slightly from 0.33 mA cm−2 (0.01%) to a maximum of 0.42 mA cm−2 (25%).
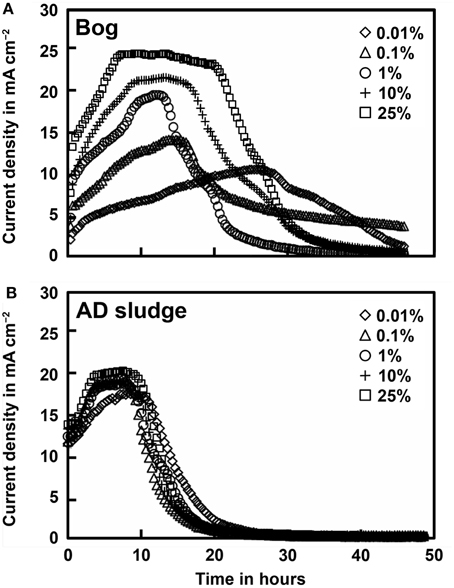
Figure 3. Current density as a function of original inoculum size of bog (A) and anaerobic digester sludge (B) inoculated reactors after full acclimation of 3 cycles.
Coulombic Efficiencies and Recoveries
The total Coulombs transferred through the circuit is a measure of overall anodic activity, and it is calculated by integrating the current production over time (area under the curves in Figure 3). The largest amount of Coulombs transferred was obtained for the bog sample, with the largest inoculum size (Figure 4). Generally, the total Coulombs transferred in the bog MECs was higher than those in AD ones. With 0.01% inoculum, it was 68 C for bog, and 48 C for AD sludge. The increase was higher for the bog when 25% inoculum was used with 104 C for bog (+53%), but only 69 C for AD sludge (+44%).
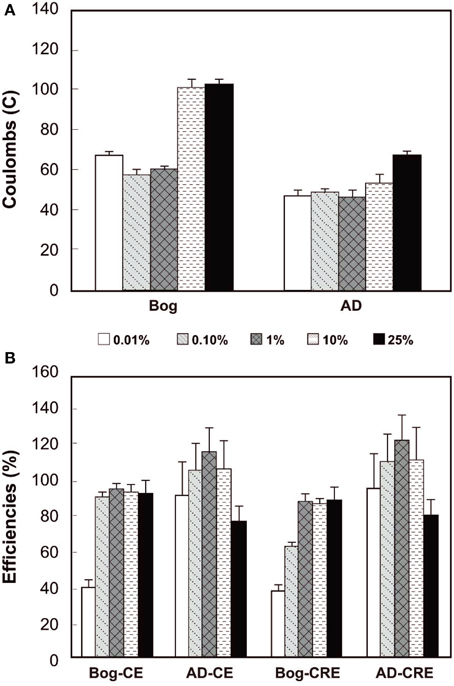
Figure 4. Coulombs transferred (A) and coulombic efficiency (CE) compared to CH4 recovery efficiency (CRE, both B) as a function of original inoculum size with bog and anaerobic digester sludge (AD) after 3 fed-batch cycles.
The CEs reflect the amount of Coulombs transferred compared to the organic matter removed, evaluated on the basis of total COD. The bog inoculum resulted in CEs less than 100%, increasing from a CE = 39% for the smallest amount (0.01% inoculum) to CEs averaging 93 ± 1% for the three largest amounts. The CEs for the AD inoculated reactors varied from 91% (0.01% inoculum) to 114% (1% inoculum) with no clear trend with the original inoculum size (Figure 4).
The CRE is a measure of total Coulombs recovered in methane compared to Coulombs transferred through the circuit. CREs for the bog samples were all less than 100%, ranging from 38% to 87%. For the AD inoculated reactors, however, some CREs were larger than 100% (e.g., CRE = 121% for the 1% inoculum).
Archaeal Communities on the Electrodes and in Solution
The Shannon diversity index of Archaea for the bog inoculum (2.7) was considerably higher than the AD sample (0.3). After 3 batch cycles, the Shannon indices in bog inoculated reactors decreased to 0.7 for the anodes, 0.4 for the solutions and 0.2 for the cathodes. The Shannon indices were slightly higher in the AD inoculated reactors with 1.0 for the anodes, 0.8 for the solutions and 0.6 for the cathodes.
Based on pyrosequencing results, the archaeal communities on the cathodes in reactors with either the bog or AD sludge were dominated by microorganisms most similar to Methanobacterium, with lesser numbers of Methanobrevibacter (Figure 5). There was a slightly increased abundance of Methanobrevibacter on the anodes relative to Methanobacterium, but overall the communities that evolved over time in these systems were mostly Methanobacterium. For all inoculum concentrations, the number of total archaeal cells in the whole reactors (both electrodes plus the medium) determined by qPCR was 2 orders of magnitude higher with the bog inoculum (about 106 for the 0.01% inoculum to 107 copies mL−1 cm−2 for the 25% inoculum, Figure 6A) than in those seeded with AD sludge (~104 for the 0.01% inoculum to ~105 copies mL−1 cm−2 for the 25% inoculum, Figure 6B) indicating that the bog sediment was a better inoculum for MEC reactors. Based on these qPCR results, methanogenic Archaea comprised about one third of the entire microbial population in the bog reactors after 3 cycles, as opposed to <1% of the microorganisms in the AD sludge reactors (Figures 6, 7). In contrast, the Archaea/Bacteria ratios in the two inocula were about the same (1/100). However, the archaeal composition of the two inocula was different as indicated by a Bray-Curtis similarity of 0.03 where 1 represents identical samples and 0 completely different samples. Methanobacterium and Methanobrevibacter species made up about 5% of the Archaea in the bog inoculum, while they were below detection limit in the AD sludge (out of 700 sequences, Figure 8).
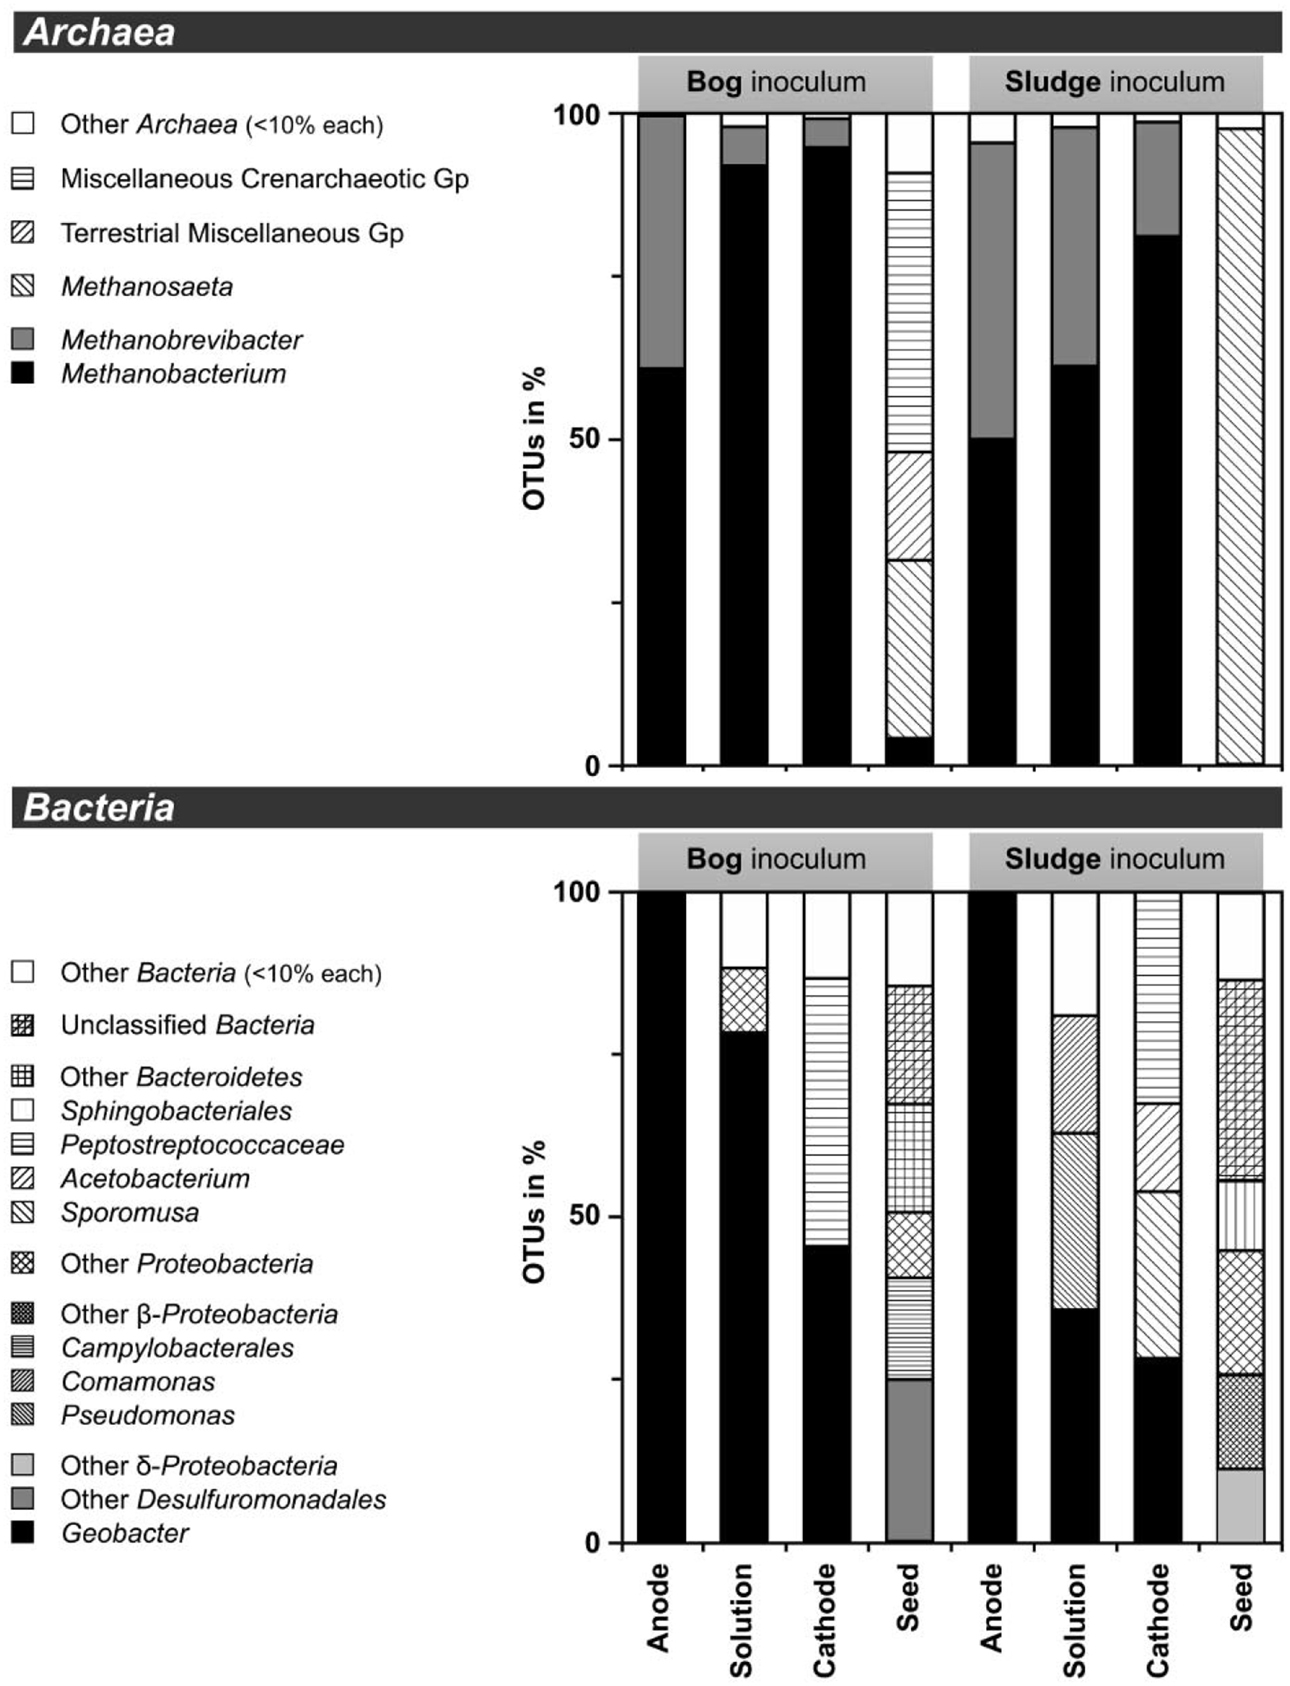
Figure 5. Distribution of operational taxonomic units (OTUs) of less than 97% sequence similarity in 16S rRNA gene extracted from MEC reactors. DNA extracts of 0.01, 0.1, 1, 10, and 25% were pooled prior to pyrosequencing. Less than 10% abudant OTUs were summarized as others (white bars). Archaea (top) and Bacteria (bottom) and were targeted. Reactors were inoculated with bog sediment (left) or AD sludge seed. Gp, group.
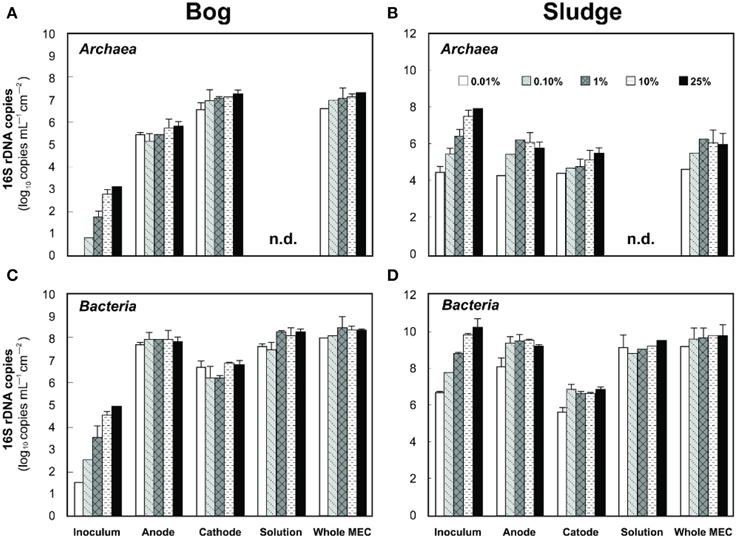
Figure 6. Left (A,C), copy numbers of Archaea (A) and Bacteria (C) populations in anodes, cathodes, and solutions of freshwater bog MECs. Right (B,D), copy numbers of Archaea (top) and Bacteria (bottom) population in anodes, cathodes and solutions of AD inoculated MECs. n.d., not detected, i.e., below the detection limit of 103 copies.
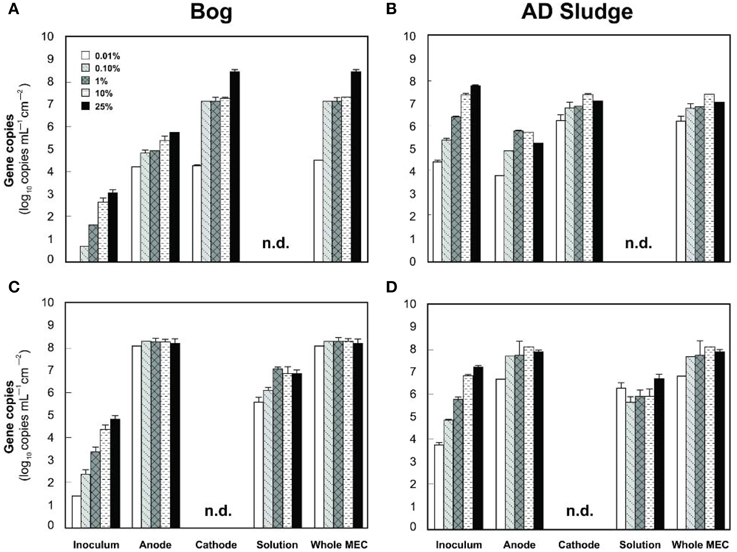
Figure 7. Copy numbers mcrA (A,B) and Geobacteraceae (C,D) detected on the anodes, cathodes or solutions of bog (A,C) and AD sludge (B,D) inoculated MECs after 6 fed batch cycles. An absence of bars shows that copy numbers were below the detection limit (103 copies). Copy numbers of 16 rRNA genes include, but are not restricted to Geobacteraceae. n.d., not detected, detection limit 103 copies.
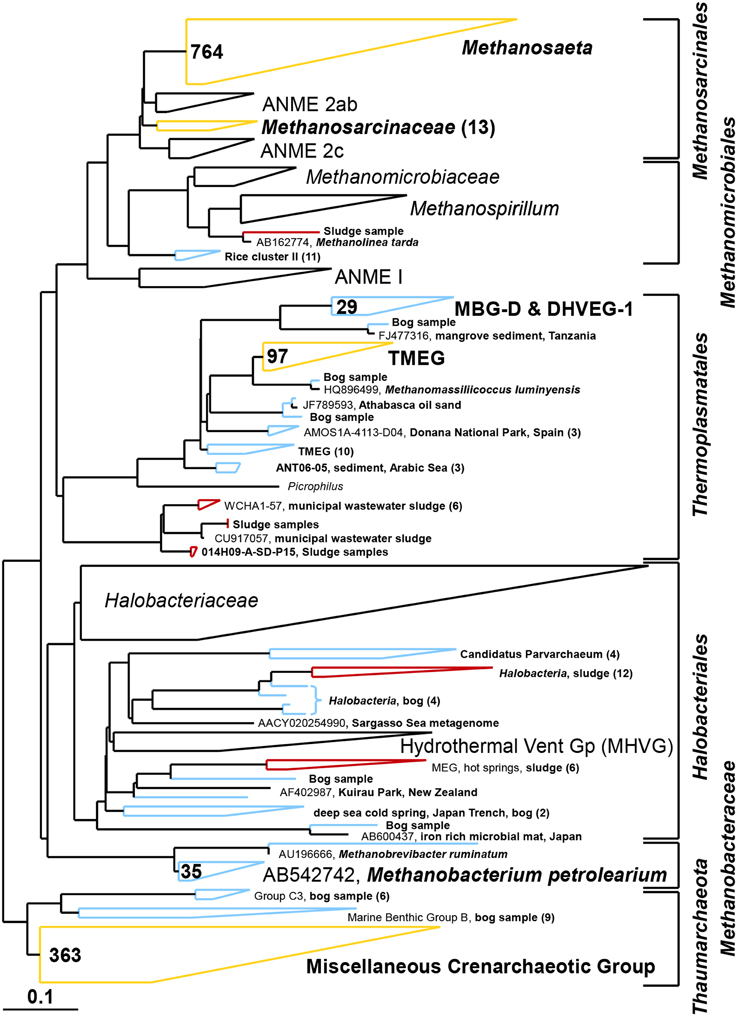
Figure 8. Composite maximum parsimony phylogenetic tree constructed by incorporating archaeal sequences of the bog sediment (blue) and the AD sludge (red) into an existing SILVA 115 NR99 tree. Yellow clusters share relatives in both inocula. Numbers indicate total numbers of sequences out of 700 for each sample. No sequences were detected in empty (black) clusters.
The analysis of the methanogens in the reactors, based on the number of mcrA genes recovered in samples, yielded results similar to those obtained by pyrosequencing. Methanogens in the bog-inoculated reactor were predominantly found on the cathode, except for the 0.01% inoculum where they were equal numbers on both electrodes (Figure 7A). The total number of mcrA gene copies recovered from reactors that were inoculated with bog increased from 104 (0.01% inoculum) to 108 mL−1 cm−2 (25% inoculum), an increase consistent with higher methane production as a function of inoculum size. For the AD sludge inoculated reactors, methanogens were also more abundant (Figure 7B) on the cathode than on the anode, independent of the original inoculum size. In general, final copy numbers of methanogens increased with inoculum mass on the anode to a maximum of 105 copies mL−1 cm−2 (1% inoculum), and on the cathode to 107 (10% inoculum).
Bacterial Communities on the Electrodes
The bacterial communities of both inocula were highly diverse (Shannon diversity index 4.7 for bog and 4.9 for AD sludge) comprising sequences affiliated with α–, β–, γ–, and δ–Proteobacteria in both samples (Figure 9). The bog inoculum also contained ε –Proteobacteria. Among the δ–Proteobacteria, Geobacter, Syntrophus, and Smithella species were detected in the bog sample, but not in the AD sludge (out of 900 sequences). Anaerobic ammonium oxidizers (anammox, Kuenenia) were only detected in the bog sample. Chloroflexi (among them Anaerolinaceae, Caldilinaceae and Dehalococcoida) and Bacteroidetes were observed in both inocula but only the Bacteroidetes were different. Barnesiella, Flaviobacteraceae, Proteiniphilum and Meniscus were discovered only in the AD sludge and Paludibacter, Marinilabiaceae, Flexibacter only in the bog sediment. Also Cyanobacteria were present in both inocula but Thermotogaceae only in the AD sludge. Pseudomonas species were observed in both inocula but were more diverse in the bog sediment.
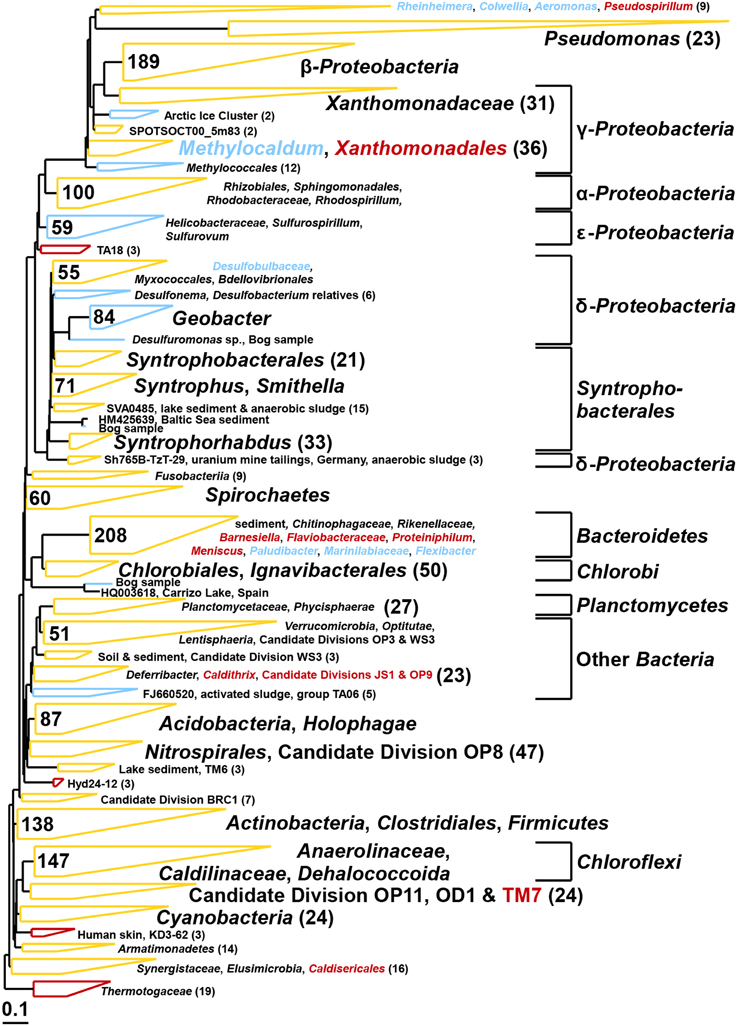
Figure 9. Composite maximum parsimony phylogenetic tree constructed by incorporating bacterial 16S rRNA gene sequences of the bog sediment (blue) and the AD sludge (red) into an existing SILVA 115 NR99 tree. Yellow clusters share relatives in both inocula. Numbers indicate total numbers of sequences out of 900 for each sample.
After 3 batch cycles, the genus Geobacter dominated the electrodes (Figure 5). Geobacter species accounted for 98% of the anode Bacteria, while they made up 45% (bog) and 26% (AD sludge) of the cathode Bacteria. The only other Bacteria in the bog reactors were Proteobacteria and Peptostreptococcaceae. The Shannon diversity indices decreased to 0.1 for the bog anode, but were higher in the solution with (1.3) and on the cathodes (2.0). Despite the absence of Geobacter in the AD inoculum, this genus became dominant over time (98%), resulting in a final Shannon index of 0.2. The solution contained Pseudomonas and Comamonas species as well, and had a higher Shannon index of 2.0, as did the cathode. Unlike the bog cathode, the AD sludge inoculated reactor had a cathode inhabited by Acetobacterium and Sporomusa, but both had members of the Peptostreptococcaceae.
Discussion
The performance of the reactors was improved, in terms of current and methane production, by using the bog inoculum. Both inocula resulted in current generation linked to methane production (Figures 1, 3). However, only the AD sludge produced CEs greater than 100% (Figure 4). This could be due to hydrogen gas recycling, as has previously been observed in MECs (Rozendal et al., 2008; Lee et al., 2009; Tartakovsky et al., 2009; Rader and Logan, 2010). Hydrogen gas recycling results from oxidation of hydrogen produced at the cathode by microorganisms on the anode, and thus current is produced with no net gas production. CEs larger than 100% can also be due to oxidation of solid organic matter or utilization of stored energy in the cells. The observation that CEs were larger than 100% for the AD sample, but not the bog sample, suggests that hydrogen gas recycling was occurring in the AD sample due to a lack of efficient conversion of hydrogen gas on the cathode. The rapid conversion of hydrogen to methane by the bog microorganisms may have helped to limit hydrogen gas recycling.
CREs greater than 100% were also observed. Values above 100% could be due to methane production without current generation, which could have been supported by the use of acetate, solid organic matter provided in the inoculum, stored substrates in the cells, or corrosion of the cathode (Siegert et al., 2014). The organic matter added in the AD sample, although washed with medium, was likely much more readily biodegradable than that present in the bog sample, which could have contributed to the large CREs for the AD reactors. However, after 3 cycles all remaining organics from the inoculum were likely degraded. Thus, high CREs were more likely due to corrosion of graphite electrodes. Ultimately, it is not possible to conclusively attribute CREs larger than 100% to any one mechanism as several different mechanisms likely contributed to methane production.
Methanobacterium Dominated Archaeal Communities
It is clear using both inocula that the cathodes were dominated primarily by the genus Methanobacterium, as well as to a lesser extent by Methanobrevibacter (Figure 5). Apparently, members of these genera which made up about 5–10% of the archaeal bog population were better suited to proliferate using the cathode in the applied voltage MEC conditions than the Methanosaeta species which were the only methanogens found in the AD sludge (out of 700 sequences, Figure 5). Methanobacterium and Methanobrevibacter made up most of the final archaeal population on the cathode in the MEC. The better performance of the bog sample than the AD sludge can be explained by their abundance in the bog inoculum (35 out of 700 sequences, Figure 8). The relative abundance of Methanobacterium and Methanobrevibacter in these acetate-fed MECs is also consistent with previous reports on archaeal communities in methanogenic biocathodes (Cheng et al., 2009; Sasaki et al., 2011; Van Eerten-Jansen et al., 2013) and iron corrosion (Dinh et al., 2004).
Examination of electrodes and solution using qPCR with mcrA primers further supported the conclusion that the bog sediment was better suited for MEC inoculation (Figures 7A,B). It is surprising that more AD sludge inoculum did not result in higher archaeal copy numbers on the cathodes compared with the cell numbers of the inoculum, as seen for the bog sediment (Figures 6, 7). A possible reason could be the use of a graphite electrode material. Graphite, like other carbon based electrodes, is readily colonized by methanogenic communities even under open circuit conditions (Siegert et al., 2014). It seems likely that microorganisms predominant in the AD sludge inoculum would initially adhere to the electrodes, resulting in high colonization of the surface independent of the mass of sludge applied to the surface. Subsequently, there would be less electrode surface available for slower growing Methanobacterium and Methanobrevibacter species following this initial colonization. Since this start-up condition (negligible Methanobacterium and Methanobrevibacter compared to Methanosaeta) was the same for all AD sludge reactors, but not in the bog reactors (4–10% Methanobacterium of all Archaea in the inoculum), the final outcome relative to microbial abundance was the same in all AD sludge but not in bog reactors. This hypothesis is also supported by the observation that the Shannon diversity index of the AD reactor doubled from 0.3 in the inoculum to 0.6 on the cathodes. The additional diversity after 3 batch cycles came from the Methanonbacterium and Methanobrevibacter that were below the detection limit (1 out of 700 sequences) in the AD inoculum. At the same time the diversity index of the bog reactors decreased from 2.7 (inoculum) to 0.2 (cathodes), demonstrating that the remaining archaeal species of the inoculum were not required under operating conditions. Higher numbers of hydrogenotrophic methanogens were found on the cathode than on the anode for both samples (Figure 5), suggesting that hydrogenotrophic or electrotrophic methanogens were predominant in the reactor.
Geobacter Dominated Anodic Bacterial Communities
As expected, the anodes in the MECs were dominated by Geobacter independent from the inoculum (Figure 5). The good current densities of the MECs here and the prevalence of Geobacter on the anodes, are consistent with MFC results where Geobacter was essential for good bioelectrochemical reactor performance (Yates et al., 2012). Geobacter species were clearly present in the bog inoculum (84 out of 900 sequences, Figure 9), but absent the AD (non-detectable in 900 sequences). Hence, the bog sediment, although containing less than 1% Geobacter, was better suited than the AD sludge for inoculating MEC anodes.
The qPCR results confirmed the dominance of the Geobacter genus at the anodes. However, the SINA online primer test (Klindworth et al., 2013) showed that the Geobacter primers used here (Holmes et al., 2002) also bind to Desulfuromonadaceae, Desulfobacterales and Syntrophobacterales sequences without mismatches. Since members of these other groups were detected in the AD sludge inoculum and inoculated reactors as well (Figure 5), a quantification of Geobacteraceae using this qPCR assay by itself is inconclusive, only supportive of the pyrosequencing results. These results are displayed in the Figures 7C,D.
On the cathodes of reactors inoculated with either inoculum Peptostreptococcaceae coexisted with Geobacter but could be assigned to Sporomusa and Acetobacterium only in AD-inoculated reactors (Figure 5). Sporomusa is a typical cathodic acetogen (Nevin et al., 2010; Zhang et al., 2013) as well as Acetobacterium (Nevin et al., 2011; Marshall et al., 2012). The presence of these two homoacetogenic species could indicate that electrons were not exclusively directed to methanogenesis, and that acetogenesis possibly played a role in methanogen growth. However, the high CE of at least 91% is an indicator that most available electrons were converted to methane. The prevalence of hydrogenotrophic methanogens and the high concentrations of acetate added to the reactor make acetate negligible as an intermediate for biocathode methanogenesis.
Conclusions
These results show that the bog samples were a better inoculum than AD sludge for both improved current generation and methane gas production in MECs. The reason for this was likely due to the relative abundance of Methanobacterium and Geobacter species in the bog inoculum. The use of the bog inoculum reduced hydrogen gas recycling compared to the AD sample, based on CEs that were all less than 100% for the bog sample. On the basis of the different percentages of inoculum used, the AD sample was optimal at 1%, while the bog sample continued to improve in performance up to the maximum of 25%. In all cases, the gas contained methane and no hydrogen gas, indicating either source was effective for methane production.
Conflict of Interest Statement
The authors declare that the research was conducted in the absence of any commercial or financial relationships that could be construed as a potential conflict of interest.
Acknowledgments
This research was supported by the Global Climate and Energy Program (GCEP) and the King Abdullah University of Science and Technology (KAUST, award KUS-I1-003-13).
References
Bray, J. R., and Curtis, J. T. (1957). An ordination of the upland forest communities of southern Wisconsin. Ecol. Monogr. 27, 326–349. doi: 10.2307/1942268
Brown, D. G., Komlos, J., and Jaffé, P. R. (2005). Simultaneous utilization of acetate and hydrogen by Geobacter sulfurreducens and implications for use of hydrogen as an indicator of redox conditions. Environ. Sci. Technol. 39, 3069–3076. doi: 10.1021/es048613p
Pubmed Abstract | Pubmed Full Text | CrossRef Full Text | Google Scholar
Call, D. F., and Logan, B. E. (2011). A method for high throughput bioelectrochemical research based on small scale microbial electrolysis cells. Biosens. Bioelectron. 26, 4526–4531. doi: 10.1016/j.bios.2011.05.014
Pubmed Abstract | Pubmed Full Text | CrossRef Full Text | Google Scholar
Call, D., and Logan, B. E. (2008). Hydrogen production in a single chamber microbial electrolysis cell lacking a membrane. Environ. Sci. Technol. 42, 3401–3406. doi: 10.1021/es8001822
Pubmed Abstract | Pubmed Full Text | CrossRef Full Text | Google Scholar
Chae, K.-J., Choi, M.-J., Lee, J., Ajayi, F. F., and Kim, I. S. (2008). Biohydrogen production via biocatalyzed electrolysis in acetate-fed bioelectrochemical cells and microbial community analysis. Int. J. Hydrogen Energy 33, 5184–5192. doi: 10.1016/j.ijhydene.2008.05.013
Chan, O. C., Wolf, M., Hepperle, D., and Casper, P. (2002). Methanogenic archaeal community in the sediment of an artificially partitioned acidic bog lake. FEMS Microbiol. Ecol. 42, 119–129. doi: 10.1111/j.1574-6941.2002.tb01001.x
Pubmed Abstract | Pubmed Full Text | CrossRef Full Text | Google Scholar
Cheng, S., Xing, D., Call, D. F., and Logan, B. E. (2009). Direct biological conversion of electrical current into methane by electromethanogenesis. Environ. Sci. Technol. 43, 3953–3958. doi: 10.1021/es803531g
Pubmed Abstract | Pubmed Full Text | CrossRef Full Text | Google Scholar
Clauwaert, P., and Verstraete, W. (2009). Methanogenesis in membraneless microbial electrolysis cells. Appl. Microbiol. Biotechnol. 82, 829–836. doi: 10.1007/s00253-008-1796-4
Pubmed Abstract | Pubmed Full Text | CrossRef Full Text | Google Scholar
Dinh, H. T., Kuever, J., Mußmann, M., Hassel, A. W., Stratmann, M., and Widdel, F. (2004). Iron corrosion by novel anaerobic microorganisms. Nature 427, 829–832. doi: 10.1038/nature02321
Pubmed Abstract | Pubmed Full Text | CrossRef Full Text | Google Scholar
Gantner, S., Andersson, A. F., Alonso-Sáez, L., and Bertilsson, S. (2011). Novel primers for 16S rRNA-based archaeal community analyses in environmental samples. J. Microbiol. Methods 84, 12–18. doi: 10.1016/j.mimet.2010.10.001
Pubmed Abstract | Pubmed Full Text | CrossRef Full Text | Google Scholar
Holmes, D. E., Bond, D. R., O'neil, R. A., Reimers, C. E., Tender, L. R., and Lovley, D. R. (2004). Microbial communities associated with electrodes harvesting electricity from a variety of aquatic sediments. Microb. Ecol. 48, 178–190. doi: 10.1007/s00248-003-0004-4
Pubmed Abstract | Pubmed Full Text | CrossRef Full Text | Google Scholar
Holmes, D. E., Finneran, K. T., O'neil, R. A., and Lovley, D. R. (2002). Enrichment of members of the family Geobacteraceae associated with stimulation of dissimilatory metal reduction in uranium-contaminated aquifer sediments. Appl. Environ. Microbiol. 68, 2300–2306. doi: 10.1128/AEM.68.5.2300–2306.2002
Pubmed Abstract | Pubmed Full Text | CrossRef Full Text | Google Scholar
Ishak, H., Plowes, R., Sen, R., Kellner, K., Meyer, E., Estrada, D., et al. (2011). Bacterial diversity in Solenopsis invicta and Solenopsis geminata ant colonies characterized by 16S amplicon 454 pyrosequencing. Microb. Ecol. 61, 821–831. doi: 10.1007/s00248-010-9793-4
Pubmed Abstract | Pubmed Full Text | CrossRef Full Text | Google Scholar
Jiang, Y., Su, M., and Li, D. (2014). Removal of sulfide and production of methane from carbon dioxide in microbial fuel cells-microbial electrolysis cell (MFCs-MEC) coupled system. Appl. Biochem. Biotechnol. 172, 2720–2731. doi: 10.1007/s12010-013-0718-9
Pubmed Abstract | Pubmed Full Text | CrossRef Full Text | Google Scholar
Kim, J. R., Cheng, S., Oh, S.-E., and Logan, B. E. (2007). Power generation using different cation, anion and ultrafiltration membranes in microbial fuel cells. Environ. Sci. Technol. 41, 1004–1009. doi: 10.1021/es062202m
Pubmed Abstract | Pubmed Full Text | CrossRef Full Text | Google Scholar
Klindworth, A., Pruesse, E., Schweer, T., Peplies, J., Quast, C., Horn, M., et al. (2013). Evaluation of general 16S ribosomal RNA gene PCR primers for classical and next-generation sequencing-based diversity studies. Nucleic Acids Res. 41, e1. doi: 10.1093/nar/gks808
Pubmed Abstract | Pubmed Full Text | CrossRef Full Text | Google Scholar
Lane, D. (1991). “16S/23S rRNA sequencing,” in Nucleic Acid Techniques in Bacterial Systematics, eds E. Stackebrandt and M. Goodfellow (Chichester: John Wiley & Sons), 115–174.
Lee, H.-S., Torres, C. I., Parameswaran, P., and Rittmann, B. E. (2009). Fate of H2 in an upflow single-chamber microbial electrolysis cell using a metal-catalyst-free cathode. Environ. Sci. Technol. 43, 7971–7976. doi: 10.1021/es900204j
Pubmed Abstract | Pubmed Full Text | CrossRef Full Text | Google Scholar
Liu, H., Grot, S., and Logan, B. E. (2005). Electrochemically assisted microbial production of hydrogen from acetate. Environ. Sci. Technol. 39, 4317–4320. doi: 10.1021/es050244p
Pubmed Abstract | Pubmed Full Text | CrossRef Full Text | Google Scholar
Logan, B. E., and Rabaey, K. (2012). Conversion of wastes into bioelectricity and chemicals by using microbial electrochemical technologies. Science 337, 686–690. doi: 10.1126/science.1217412
Pubmed Abstract | Pubmed Full Text | CrossRef Full Text | Google Scholar
Logan, B. E., Call, D., Cheng, S., Hamelers, H. V. M., Sleutels, T. H. J. A., Jeremiasse, A. W., et al. (2008). Microbial electrolysis cells for high yield hydrogen gas production from organic matter. Environ. Sci. Technol. 42, 8630–8640. doi: 10.1021/es801553z
Pubmed Abstract | Pubmed Full Text | CrossRef Full Text | Google Scholar
Lohner, S. T., Deutzmann, J. S., Logan, B. E., Leigh, J., and Spormann, A. M. (2014). Hydrogenase-independent uptake and metabolism of electrons by the archaeon Methanococcus maripaludis. ISME J. 8, 1673–1681. doi: 10.1038/ismej.2014.82
Pubmed Abstract | Pubmed Full Text | CrossRef Full Text | Google Scholar
Lu, L., Xing, D., and Ren, N. (2012). Pyrosequencing reveals highly diverse microbial communities in microbial electrolysis cells involved in enhanced H2 production from waste activated sludge. Water Res. 46, 2425–2434. doi: 10.1016/j.watres.2012.02.005
Pubmed Abstract | Pubmed Full Text | CrossRef Full Text | Google Scholar
Marshall, C. W., Ross, D. E., Fichot, E. B., Norman, R. S., and May, H. D. (2012). Electrosynthesis of commodity chemicals by an autotrophic microbial community. Appl. Environ. Microbiol. 78, 8412–8420. doi: 10.1128/aem.02401-12
Pubmed Abstract | Pubmed Full Text | CrossRef Full Text | Google Scholar
Nadkarni, M. A., Martin, F. E., Jacques, N. A., and Hunter, N. (2002). Determination of bacterial load by real-time PCR using a broad-range (universal) probe and primers set. Microbiology 148, 257–266. Available online at: http://mic.sgmjournals.org/content/148/1/257.abstract
Nevin, K. P., Hensley, S. A., Franks, A. E., Summers, Z. M., Ou, J., Woodard, T. L., et al. (2011). Electrosynthesis of organic compounds from carbon dioxide is catalyzed by a diversity of acetogenic microorganisms. Appl. Environ. Microbiol. 77, 2882–2886. doi: 10.1128/aem.02642-10
Pubmed Abstract | Pubmed Full Text | CrossRef Full Text | Google Scholar
Nevin, K. P., Woodard, T. L., Franks, A. E., Summers, Z. M., and Lovley, D. R. (2010). Microbial electrosynthesis: feeding microbes electricity to convert carbon dioxide and water to multicarbon extracellular organic compounds. mBio 1:e00103-00110. doi: 10.1128/mBio.00103-10
Pubmed Abstract | Pubmed Full Text | CrossRef Full Text | Google Scholar
Nüsslein, B., Chin, K.-J., Eckert, W., and Conrad, R. (2001). Evidence for anaerobic syntrophic acetate oxidation during methane production in the profundal sediment of subtropical Lake Kinneret (Israel). Environ. Microbiol. 3, 460–470. doi: 10.1046/j.1462-2920.2001.00215.x
Parameswaran, P., Zhang, H., Torres, C. S. I., Rittmann, B. E., and Krajmalnik-Brown, R. (2010). Microbial community structure in a biofilm anode fed with a fermentable substrate: the significance of hydrogen scavengers. Biotechnol. Bioeng. 105, 69–78. doi: 10.1002/bit.22508
Pubmed Abstract | Pubmed Full Text | CrossRef Full Text | Google Scholar
Pruesse, E., Quast, C., Knittel, K., Fuchs, B., Ludwig, W., Peplies, J., et al. (2007). SILVA: a comprehensive online resource for quality checked and aligned ribosomal RNA sequence data compatible with ARB. Nucleic Acids Res. 35, 7188–7196. doi: 10.1093/nar/gkm864
Pubmed Abstract | Pubmed Full Text | CrossRef Full Text | Google Scholar
Rader, G. K., and Logan, B. E. (2010). Multi-electrode continuous flow microbial electrolysis cell for biogas production from acetate. Int. J. Hydrogen Energy 35, 8848–8854. doi: 10.1016/j.ijhydene.2010.06.033
Ren, L., Siegert, M., Ivanov, I., Pisciotta, J. M., and Logan, B. E. (2013). Treatability studies on different refinery wastewater samples using high-throughput microbial electrolysis cells (MECs). Bioresour. Technol. 136, 322–328. doi: 10.1016/j.biortech.2013.03.060
Pubmed Abstract | Pubmed Full Text | CrossRef Full Text | Google Scholar
Rozendal, R. A., Hamelers, H. V. V., and Buisman, C. J. N. (2006). Effects of membrane cation transport on pH and microbial fuel cell performance. Environ. Sci. Technol. 40, 5206–5211. doi: 10.1021/es060387r
Pubmed Abstract | Pubmed Full Text | CrossRef Full Text | Google Scholar
Rozendal, R. A., Jeremiasse, A. W., Hamelers, H. V. M., and Buisman, C. J. N. (2008). Hydrogen production with a microbial biocathode. Environ. Sci. Technol. 42, 629–634. doi: 10.1021/es071720+
Pubmed Abstract | Pubmed Full Text | CrossRef Full Text | Google Scholar
Sasaki, K., Morita, M., Sasaki, D., Hirano, S.-I., Matsumoto, N., Ohmura, N., et al. (2011). Methanogenic communities on the electrodes of bioelectrochemical reactors without membranes. J. Biosci. Bioeng. 111, 47–49. doi: 10.1016/j.jbiosc.2010.08.010
Pubmed Abstract | Pubmed Full Text | CrossRef Full Text | Google Scholar
Schloss, P. D., Gevers, D., and Westcott, S. L. (2011). Reducing the effects of PCR amplification and sequencing artifacts on 16S rRNA-based studies. PLoS ONE 6:e27310. doi: 10.1371/journal.pone.0027310
Pubmed Abstract | Pubmed Full Text | CrossRef Full Text | Google Scholar
Shannon, C. E. (1948). A mathematical theory of communication. Bell Syst. Tech. J. 27, 379–423. doi: 10.1002/j.1538-7305.1948.tb01338.x
Shehab, N., Li, D., Amy, G., Logan, B., and Saikaly, P. (2013). Characterization of bacterial and archaeal communities in air-cathode microbial fuel cells, open circuit and sealed-off reactors. Appl. Microbiol. Biotechnol. 97, 9885–9895. doi: 10.1007/s00253-013-5025-4
Pubmed Abstract | Pubmed Full Text | CrossRef Full Text | Google Scholar
Siegert, M., Yates, M. D., Call, D. F., Zhu, X., Spormann, A., and Logan, B. E. (2014). Comparison of nonprecious metal cathode materials for methane production by electromethanogenesis. ACS Sustainable Chem. Eng. 2, 910–917. doi: 10.1021/sc400520x
Pubmed Abstract | Pubmed Full Text | CrossRef Full Text | Google Scholar
Steinberg, L. M., and Regan, J. M. (2008). Phylogenetic comparison of the methanogenic communities from an acidic, oligotrophic fen and an anaerobic digester treating municipal wastewater sludge. Appl. Environ. Microbiol. 74, 6663–6671. doi: 10.1128/aem.00553-08
Pubmed Abstract | Pubmed Full Text | CrossRef Full Text | Google Scholar
Steinberg, L. M., and Regan, J. M. (2009). mcrA-targeted real-time quantitative PCR method to examine methanogen communities. Appl. Environ. Microbiol. 75, 4435–4442. doi: 10.1128/aem.02858-08
Pubmed Abstract | Pubmed Full Text | CrossRef Full Text | Google Scholar
Takai, K., and Horikoshi, K. (2000). Rapid detection and quantification of members of the archaeal community by quantitative PCR using fluorogenic probes. Appl. Environ. Microbiol. 6, 5066–5072. doi: 10.1128/AEM.66.11.5066-5072.2000
Pubmed Abstract | Pubmed Full Text | CrossRef Full Text | Google Scholar
Tartakovsky, B., Manuel, M. F., Wang, H., and Guiot, S. R. (2009). High rate membrane-less microbial electrolysis cell for continuous hydrogen production. Int. J. Hydrogen Energy 34, 672–677. doi: 10.1016/j.ijhydene.2008.11.003
Thebrath, B., Rothfuss, F., Whiticar, M. J., and Conrad, R. (1993). Methane production in littoral sediment of Lake Constance. FEMS Microbiol. Lett. 102, 279–289. doi: 10.1111/j.1574-6968.1993.tb05819.x
Torres, C. I., Krajmalnik-Brown, R., Parameswaran, P., Marcus, A. K., Wanger, G., Gorby, Y. A., et al. (2009). Selecting anode-respiring bacteria based on anode potential: phylogenetic, electrochemical, and microscopic characterization. Environ. Sci. Technol. 43, 9519–9524. doi: 10.1021/es902165y
Pubmed Abstract | Pubmed Full Text | CrossRef Full Text | Google Scholar
Van Eerten-Jansen, M. C. A. A., Veldhoen, A. B., Plugge, C. M., Stams, A. J. M., Buisman, C. J. N., and Ter Heijne, A. (2013). Microbial community analysis of a methane-producing biocathode in a bioelectrochemical system. Archaea. 2013:481784. doi: 10.1155/2013/481784
Pubmed Abstract | Pubmed Full Text | CrossRef Full Text | Google Scholar
Villano, M., Aulenta, F., Ciucci, C., Ferri, T., Giuliano, A., and Majone, M. (2010). Bioelectrochemical reduction of CO2 to CH4 via direct and indirect extracellular electron transfer by a hydrogenophilic methanogenic culture. Bioresour. Technol. 101, 3085–3090. doi: 10.1016/j.biortech.2009.12.077
Pubmed Abstract | Pubmed Full Text | CrossRef Full Text | Google Scholar
Villano, M., Monaco, G., Aulenta, F., and Majone, M. (2011). Electrochemically assisted methane production in a biofilm reactor. J. Power Sources 196, 9467–9472. doi: 10.1016/j.jpowsour.2011.07.016
Wagner, R. C., Regan, J. M., Oh, S.-E., Zuo, Y., and Logan, B. E. (2009). Hydrogen and methane production from swine wastewater using microbial electrolysis cells. Water Res. 43, 1480–1488. doi: 10.1016/j.watres.2008.12.037
Pubmed Abstract | Pubmed Full Text | CrossRef Full Text | Google Scholar
Wang, A., Liu, W., Cheng, S., Xing, D., Zhou, J., and Logan, B. E. (2009). Source of methane and methods to control its formation in single chamber microbial electrolysis cells. Int. J. Hydrogen Energy 34, 3653–3658. doi: 10.1016/j.ijhydene.2009.03.005
Wolin, E. A., Wolfe, R. S., and Wolin, M. J. (1964). Viologen dye inhibition of methane formation by Methanobacillus omelianskii. J. Bacteriol. 87, 993–998.
Yates, M. D., Kiely, P. D., Call, D. F., Rismani-Yazdi, H., Bibby, K., Peccia, J., et al. (2012). Convergent development of anodic bacterial communities in microbial fuel cells. ISME J. 6, 2002–2013. doi: 10.1038/ismej.2012.42
Pubmed Abstract | Pubmed Full Text | CrossRef Full Text | Google Scholar
Zepp Falz, K., Holliger, C., Großkopf, R., Liesack, W., Nozhevnikova, A. N., Müller, B., et al. (1999). Vertical distribution of methanogens in the anoxic sediment of Rotsee (Switzerland). Appl. Environ. Microbiol. 65, 2402–2408.
Keywords: electromethanogenesis, biocathode, power-to-gas, microbially influenced corrosion, bog sediment, Geobacter, Methanobacterium, Methanobrevibacter
Citation: Siegert M, Li X-F, Yates MD and Logan BE (2015) The presence of hydrogenotrophic methanogens in the inoculum improves methane gas production in microbial electrolysis cells. Front. Microbiol. 5:778. doi: 10.3389/fmicb.2014.00778
Received: 05 September 2014; Accepted: 18 December 2014;
Published online: 15 January 2015.
Edited by:
Gavin J. Collins, National University of Ireland, IrelandReviewed by:
Jun-Jie Zhang, Chinese Academy of Sciences, ChinaZhongli Cui, Nanjing Agricultural University, China
Albert Guisasola, Universitat Autònoma de Barcelona, Spain
Copyright © 2015 Siegert, Li, Yates and Logan. This is an open-access article distributed under the terms of the Creative Commons Attribution License (CC BY). The use, distribution or reproduction in other forums is permitted, provided the original author(s) or licensor are credited and that the original publication in this journal is cited, in accordance with accepted academic practice. No use, distribution or reproduction is permitted which does not comply with these terms.
*Correspondence: Xiu-Fen Li, School of Environmental and Civil Engineering, Jiangnan University, Wuxi, 1800 Lihu Ave, Jiangsu Province 214122, China e-mail: xfli@jiangnan.edu.cn;
Bruce E. Logan, Department of Civil and Environmental Engineering, Penn State University, 231Q Sackett Bldg, Penn State, University Park, PA 16802, USA e-mail: blogan@psu.edu