 Cindy J. Smith
- 1Department of Biological Sciences, University of Essex, Colchester, UK
- 2Department of Animal and Plant Sciences, The University of Sheffield, Sheffield, UK
- 3NERC Life Sciences Mass Spectrometry Facility, Centre for Ecology and Hydrology, Lancaster Environment Centre, Lancaster, UK
This research investigated spatial-temporal variation in benthic bacterial community structure, rates of denitrification and dissimilatory nitrate reduction to ammonium (DNRA) processes and abundances of corresponding genes and transcripts at three sites—the estuary-head, mid-estuary and the estuary mouth (EM) along the nitrate gradient of the Colne estuary over an annual cycle. Denitrification rates declined down the estuary, while DNRA rates were higher at the estuary head and middle than the EM. In four out of the six 2-monthly time-points, rates of DNRA were greater than denitrification at each site. Abundance of gene markers for nitrate-reduction (nitrate reductase narG and napA), denitrification (nitrite reductase nirS) and DNRA (DNRA nitrite reductase nrfA) declined along the estuary with significant relationships between denitrification and nirS abundance, and DNRA and nrfA abundance. Spatially, rates of denitrification, DNRA and corresponding functional gene abundances decreased along the estuary. However, temporal correlations between rate processes and functional gene and transcript abundances were not observed.
Introduction
Estuarine sediments are natural environmental gradients of nutrients and salinity, and significant sites of microbial diversity and activity. Bacterial diversity within these sediments is often higher than in other environments (Lozupone and Knight, 2007) and the bacteria present drive essential nutrient cycles with direct consequences for ecosystem function. Previously, we showed that the largest nutrient loads to all mainland UK estuaries were attributable to nitrate: at least an order of magnitude greater than ammonium (Nedwell et al., 2002; Earl et al., 2014). Benthic microorganisms mediate the nitrate load entering coastal waters via denitrification, dissimilatory nitrate reduction to ammonia (DNRA) and anaerobic ammonia oxidation (anammox) processes.
Heterotrophic denitrification by facultatively anaerobic bacteria using nitrate to respire organic matter, produces N2 and to a lesser extent the greenhouse gas N2O (Seitzinger, 1988; Nedwell et al., 1999; Dong et al., 2002), removing up to 50% of the nitrate load from estuaries (Nedwell et al., 1999). Anammox, the anaerobic autotrophic oxidization of NH4+, uses NO2– as an electron acceptor yielding N2 (Strous et al., 1999; Kuenen, 2008). Reported values of N2 production from anammox in estuarine sediments range from 0 to 30% (Dong et al., 2009; Nicholls and Trimmer, 2009; Brin et al., 2014). Denitrification and anammox are significant pathways that remove nitrate as gaseous products from ecosystems, thus reducing the risk of eutrophication. In contrast, DNRA is an alternative pathway that reduces nitrate and nitrite to ammonium. It is a significant, but often overlooked processes in coastal benthic sediments accounting for up to 30% of nitrate reduction activity (Giblin et al., 2013). DNRA may contribute to eutrophication by retaining biologically available nitrogen within the system as NH4+. Thus the balance between the two predominant nitrate reduction pathways of denitrification and DNRA in benthic estuarine sediments influence the nutrient load entering costal waters.
Both denitrification and DNRA compete for NO3– and NO2– as an electron acceptor. Nitrogen transformations by denitrification and DNRA in estuarine sediments are influenced by interactions between a number of factors, primarily NO3– and organic carbon concentrations, temperature and pH. Previous studies in estuarine sediments have indicated that denitrification may be favored when nitrate concentrations are high while DNRA tends to outcompete denitrification where there is high availability of organic electron donor and low nitrate (King and Nedwell, 1985; Dong et al., 2011).
Denitrification and DNRA are catalyzed by a series of nitrate and nitrite reductase enzymes encoded by genes whose abundance can be used as proxies in determining potential for nitrate reduction within environments (Philippot and Hallin, 2005). narG and napA genes encode subunits of two distinct nitrate reductases (NAR and NAP) that mediate reduction of nitrate to nitrite. Nitrite can enter the denitrification pathway in processes mediated by nitrite reductase enzymes encoded by nirS or nirK genes (see Zumft, 1997). Alternatively, in DNRA nitrite is reduced to NH4+ by the NrfA enzyme encoded by nrfA (see Simon, 2002). Consequently, molecular analyses of nirS/nirK and nrfA genes can be used to investigate the genetic potential in an environment for either denitrification or DNRA.
Previously, we demonstrated a decline in rates of denitrification and DNRA, and a corresponding decline in abundance of genetic markers for these processes, down the nitrate gradient of the Colne estuary (Dong et al., 2009) at a single time point (February 2005). Furthermore, previous research revealed seasonal variability in rates of denitrification (Dong et al., 2000); and spatial variability in rates of nitrate exchange across the sediment/water interface, with highest rates in the upper Colne estuary and lowest at the mouth (Thornton et al., 2007). These studies did not however, simultaneously study the fate of nitrate via benthic denitrification or DNRA nor the nitrate and nitrite reducing communities driving these processes over an annual period to determine seasonal effects. Therefore the aim of this study was to determine rates of nitrate reduction processes linked to corresponding functional gene and transcript abundances along the Colne estuary at 2 monthly intervals over a 12-month period. Based on previous studies we propose the following hypotheses: first, the trend of decreasing rates of denitrification and DNRA along the estuary gradient is seasonally stable. Second, the relative importance of denitrification and DNRA will vary seasonally, with DNRA higher in the summer. Third, that the abundance of key functional genes and transcripts will correlate spatially and seasonally with corresponding rate processes along the estuary.
Materials and Methods
Site Description, Field Sampling and Nutrient Analysis
Three sites along the Colne estuary, U.K. the estuary head (EH) at the Hythe, mid-estuary (ME) at Alresford Creek and the estuary mouth (EM) at Brightlingsea were sampled at 2-monthly intervals from April 2005 to February 2006. The EH is characterized by fine silt sediments (87–98% silt:clay < 65 μM) and salinity range between 2 and 17 ppt; ME sediments are fine silt (80–95% silt:clay < 65 μM), with salinity range between 20 and 32 ppt while EM sediments are clay with a thin layer of fine mud sand (silt:clay < 65 μM) and salinity ranging from 28 to 32 ppt. At each site replicate small cores of sediment (10 cm length in core tubes, 3.4 cm internal diameter by 22 cm length) were taken to measure process rates (n = 5 per each process). Triplicate sediment samples were also taken from the top 1 cm of sediment for molecular analysis, and returned on ice to the laboratory within 1 h of sampling, prior to storage at –70°C of aliquots (0.5 g wet weight) of sediment. Water samples were also collected at high tide at the three sites, then samples (10 ml) were filtered through glass fiber filter papers (GF/F, Whatman, UK) and frozen at –20°C prior to subsequent colorimetric nutrient analyses (Strickland and Parsons, 1972) using a segmented flow autoanalyzer (Skalar Analytical B.V., Breda, Netherlands). Limits of detection for nitrate and nitrite were 0.002 μM, ammonium 0.003 μM. Analytical accuracy for nutrient analysis was maintained by membership of a quality assurance scheme (www.quasimeme.org).
Measurement of Rates of Denitrification and DNRA
Denitrification rates to both N2 and N2O (Dong et al., 2006) and DNRA rates (Dong et al., 2009) were determined simultaneously on intact sediment cores. Briefly, denitrification and DNRA rates were measured by 15N-labeled nitrate addition to sediment cores. Five cores of sediment (∼10 cm deep) were collected in Perspex tubes (3.4 cm internal diameter, 22 cm length) from each site. On return to the laboratory, the cores were put in an incubation tank at in situ water temperature and submerged in site water that was vigorously bubbled with air overnight to re-equilibrate. Next day, the rates of denitrification and DNRA were measured by 15N labeled nitrate addition to sediment cores. After a 3-h incubation of the cores, the sediment core and the overlying water were mixed to form a slurry. Slurry samples (12.5 ml) were removed for the quantification of denitrification gaseous products (N2 and N2O). Subsamples (10 ml) of the slurried sediment cores were taken for the subsequent recovery of 15NH4+ to determine rates of DNRA. Ammonium in the slurry samples was extracted by steam distillation and ammonium gas was trapped in acid solution. Ammonium in the acid solution was then absorbed onto zeolite, which was then combusted and reduced to N2. Isotope ratios of N2 in samples were measured by isotope ratio mass spectrometry using the 14:15N2 ratio in air as a standard. DNRA rates were calculated using the isotope ratio of N2. The DNRA calculation in the previous (Dong et al., 2009, 2011) and present work used the ratios of 14:15NO3– in the water column, thus showing only the rate of DNRA supported by nitrate from the water column.
Nucleic Acid Extraction
DNA and RNA were co-extracted from 0.5 g sediment, using Lysing Matrix B tubes (Bio-101) as described previously in Smith et al. (2007). Briefly, to each 0.5 g sediment sample, 0.5 ml of 240 mM sodium phosphate buffer (pH 8) and 0.5 ml of phenol:chloroform:isoamyl alcohol (25:24:1) (pH 4) were added. Samples were lysed by bead beating for 30 s at 2,000 rpm, and centrifuged for 10 mins at 17,563 × g. The aqueous phase was added to 0.5 ml chloroform:isoamyl (24:1), mixed and centrifuged for a further 10 min at 17,563 × g. The aqueous phase was removed for DNA and RNA precipitation with 2.5 volumes of ice-cold ethanol and 1/10 volume of 3 M sodium acetate (pH 5.2). Total nucleic acids were pelleted by centrifugation and washed twice in ice cold 70% ethanol, air dried and suspended in 100 μl of DEPC water. Total RNA was prepared by diluting a 25 μl aliquot of total nucleic acids with an equal volume of DEPC-treated sterile water, followed by digestion using TURBO DNA-free (Ambion, Austin, TX, USA) in accordance with the manufacturer’s protocol.
16S Ribosomal RNA Gene T-RFLP Analysis, Clone library Construction and Q-PCR Analysis
For Terminal Restriction Fragment Length Polymorphism (T-RFLP) analysis, PCR amplification of 16S rRNA genes from DNA was carried out with the primers FAM 63F (5′-CAGGCCTAACACATGGCAAGTC-3′) (Marchesi et al., 1998) and 518R (5′-CGTATTACCGCGGCTGCTCG-3′) (Lane, 1991). 50 μl reactions contained 0.4 μM forward and reverse primer, 0.1 mM dNTPs, 2.5U Taq polymerase, 5 μl of the reaction buffer supplied with the enzyme (Qiagen, Crawley, UK), and 1 μl of 10–1 dilution of DNA template. PCR amplification was carried out in an ABI 2720 Thermo-cycler (Applied Biosystems, Warrington, UK) as follows; 95°C for 2 min then 30 cycles of 95°C for 45 sec, 55°C for 1 min and 72°C for 30 s and a final extension step of 72°C for 10 min.
Amplified 16S rRNA genes were purified by using a Qiagen PCR purification kit (Qiagen, Crawley, UK) according to the manufacturer’s protocol and subsequently independently digested with AluI and CfoI (Roche Diagnostics, Basel, Switzerland) at 37°C for 3 h. 5 μl of each digest was desalted; glycogen (20 mg ml–1) (Thermo Scientific, Waltham, MA, USA) was added to a final concentration of 0.1 μg/ml and ethanol precipitated with 1/10 volume of 3M sodium acetate (pH 5.2) and 2 volumes of ice-cold ethanol. 0.5 μl of the desalted digestion reaction was added to 9.5 μl of deionised formamide and 0.5 μl ROX- labeled Genescan 500 internal size standard (both Applied Biosystems, Warrington, UK). Samples were denatured at 94°C for 5 min, cooled on ice and separated on an ABI 3700 (Applied Biosystems, Warrington, UK) using a 10 s injection and a 8.5 kV separation voltage.
Quantitative PCR was used to quantify 16S rRNA genes in sediments using an ABI Prism 7000 detection system as described by Smith et al. (2006) using the primers 1369F and 1492R and the TaqMan probe TM1389F (Table 1).
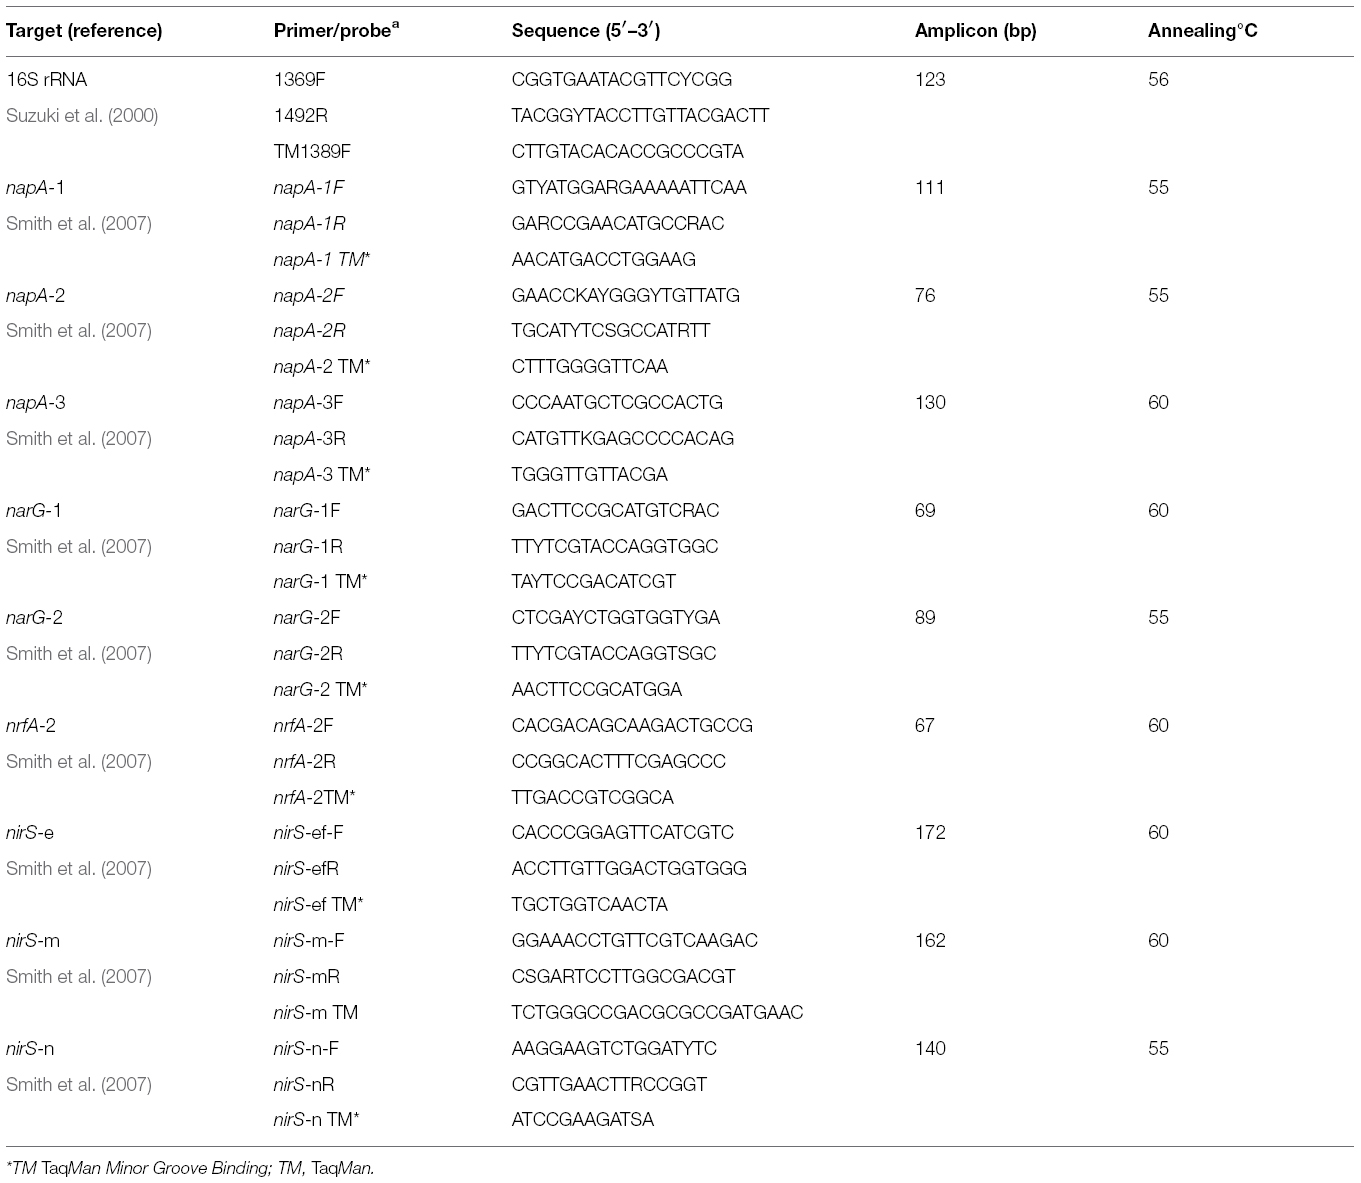
Table 1. Q- (RT)-PCR primer and probe sets used in this study.
Q-(RT)-PCR of Nitrate and Nitrite Reducates Genes and Transcripts
Nitrate reductase genes (narG and napA) and nitrite reductase (nirS and nrfA) genes and transcripts were quantified from triplicate sediment samples from each site using Q-(RT)-PCR TaqMan assays as described in Smith et al. (2007, 2006). Briefly, TaqMan primer and probe sets targeting two narG (narG-1 and 2), three napA (napA-1, 2, and 3), three nirS (nirS-ef, nirS-m, nirS-n) and a single nrfA phylotype were targeted as genetic markers of nitrate reduction, denitrification and DNRA, respectively. nirK was targeted but it was not detected along the estuary at any of the time points in question (data not shown). For transcript quantification, narG-1 and nirS-ef gene transcripts were targeted at the EH and ME sites only based on results of our earlier study (Dong et al., 2009). Details of primer and probe sequences are provided in Table 1. Gene and transcript abundances were calculated from standard curves (Table 2).
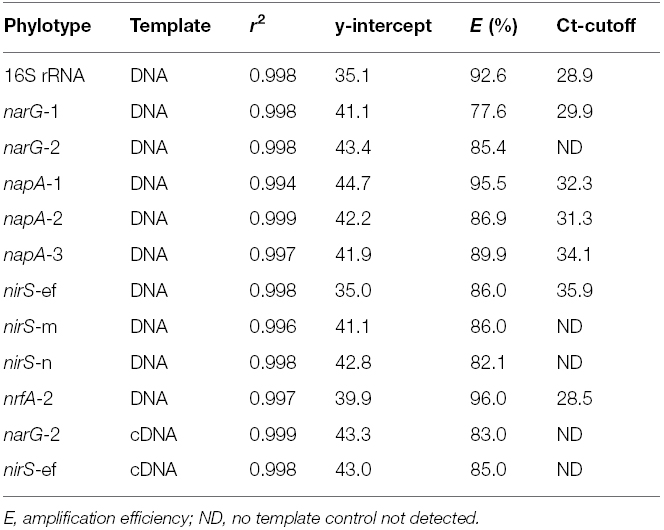
Table 2. Quantitative and reverse transcriptase quantitative-PCR standard curve descriptors.
Statistical Analyses
T-RFLP profiles were aligned on the basis of T-RF size in base pairs and the individual peak areas of the T-RFs identified by using T-Align (Smith et al., 2005) based on a 0.5-bp moving average, resulting in the generation of datasets of aligned T-RFs that gave individual relative peak areas as a proportion (%) of the overall profile. All T-RFs that contributed less than 1% of the total peak area for a profile were excluded from further analysis. The aligned T-RFs were transformed by log(X+1) to remove any weighting from dominant peaks and analyzed with a Bray-Curtis similarity matrix (Clarke et al., 2006) in Primer v6 (Primer-E, Plymouth, UK). The resultant similarity matrix was analyzed in a two-dimensional multidimensional scaling (MDS) plot.
Variation in nitrate reduction rates or gene abundances between sites and within sites at different months were analyzed using a one-way ANOVA followed by a post hoc test (Tukey, 1953) in SPSS v14. Data was log(x+1) transformed, as necessary. Spearman’s rank correlation analysis was performed to investigate correlations between denitrification or DNRA rates and gene abundances of corresponding genetic determinants in SPSS. A Bray-Curtis resemblance matrix (Clarke et al., 2006) of quantitative PCR gene abundances was generated from the log (x+1) transformed data and an Euclidean distance resemblance matrix was constructed from rate process data and nutrient concentrations and used to construct MDS. Variation among sites was assessed using ANOSIM a one-way analysis of similarity in Primer-6 (Clarke, 1993). BIO-ENV and LINKTREE were used to link gene abundance patterns with rate process and nutrient data. Seasonal trajectories were added to MDS plots by ordering sampling months numerically using the overlay trajectory function within PRIMER-6. MDS, ANOSIM, BIO-ENV, and LINKTREE analysis were carried out in Primer 6 (PRIMER-E Ltd, Plymouth Marine Laboratory, UK).
Results
In situ Nitrate Concentrations and Water Temperature
Nitrate concentrations in water decreased from the EH to EM with an annual mean (± SE) of 399.7 ± 50.0 μM at EH, 98.8 ± 23.4 μM at ME, and 43.1 ± 10.2 μM at EM. (NO3– and NH4+ concentrations for individual months are shown in Figures 1A,B). Water temperatures varied seasonally ranging from 4 to 19°C (in February and August respectively).
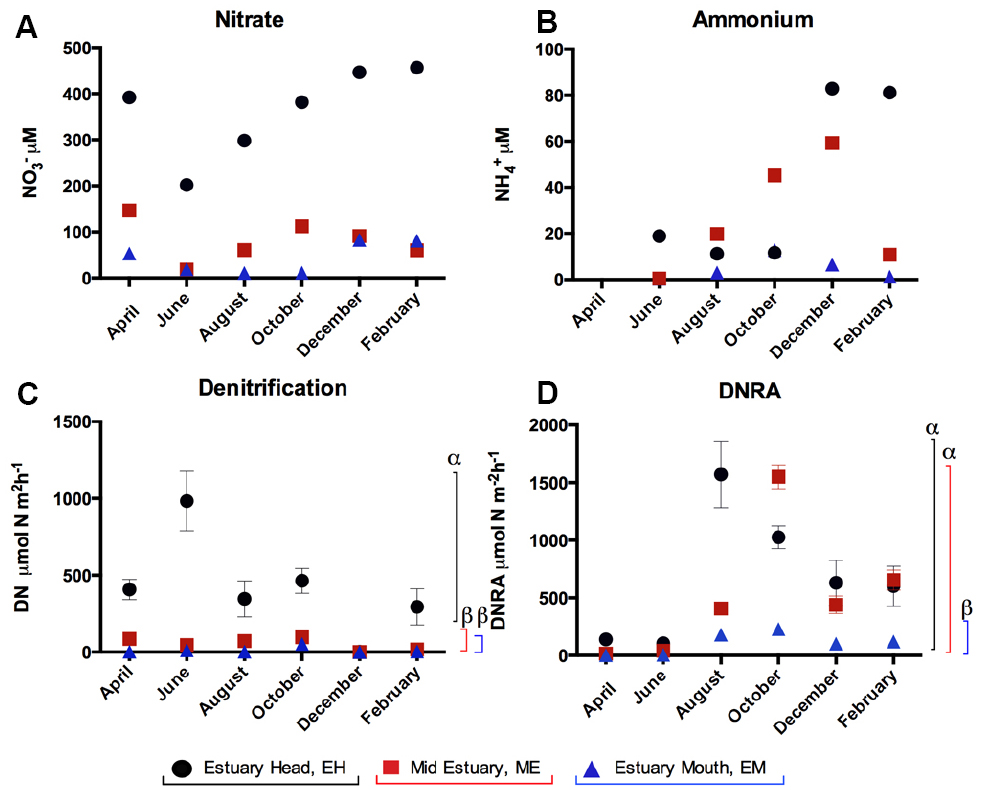
Figure 1. Temporal and spatial variation in (A) nitrate and (B) ammonium concentrations and rates (±SE, n = 5) of (C) denitrification and (D) DNRA in sediments along the Colne estuary sampled from April 2005 to February 2006. For each process, significant differences in the overall process rates between sites along the estuary are indicated by different Greek letters above the colored lines [black, estuary head (EH); red, mid-estuary (ME); and blue, estuary mouth (EM)].
Spatial and Temporal Variation in Rates of Benthic Denitrification and DNRA
Rates of benthic denitrification decreased from the head toward the mouth of the estuary (Figures 1C,D) following the nitrate concentration gradient in the water column. At the EH, the mean (±SE) annual rate of denitrification (415.6 ± 131.2 μmol N m–2 h–1) was significantly higher (ANOVA, P < 0.05) than ME (53.1 ± 16.1 μmol N m–2 h–1) and the EM (12.3 ± 8.2 μmol N m–2 h–1), while the latter two did not differ significantly from each other (Figure 1; P = 0.388). Mean annual rates of DNRA at the EH (679.1 ± 226.9 μmol N m–2 h–1) and ME (516.5 ± 230.1 μmol N m–2 h–1) did not differ significantly from each other (P > 0.05) but were significantly higher (Figure 1, P < 0.05) than at EM (106.3 ± 37.2 μmol N m–2 h–1). Rates of denitrification and DNRA at all three sites showed significant seasonal variability (P < 0.05, Figure 1). At each site, benthic rates of denitrification were greater than DNRA in April and June only. Rates of DNRA were greater than denitrification at all sites in August, October, December and February (Figure 1).
Spatial and Temporal Variation in 16S rRNA Community Structure, Abundance, and Diversity
Changes in community structure along the estuary over the year were assessed by 16S rRNA gene T-RFLP analysis. The results of a Bray-Curtis similarity matrix of T-RFLP profiles generated in triplicate from each site along the estuary over the year revealed two distinct clusters (Figure 2), with the EH forming a separate cluster from the lower estuary sites of ME and EM which were more similar to each other than to the EH (Figure 2). This separation were supported by ANOSIM analysis: EH verses ME R = 0.58, P < 0.001, EH verses EM R = 0.913, p < 0.001 and ME verses EM R = 0.218, p < 0.001. At the EH a sequential seasonal shift in community structure was observed as illustrated by the trajectory (Figure 2), but seasonal cycles in community structure were not evident at the other two sites.
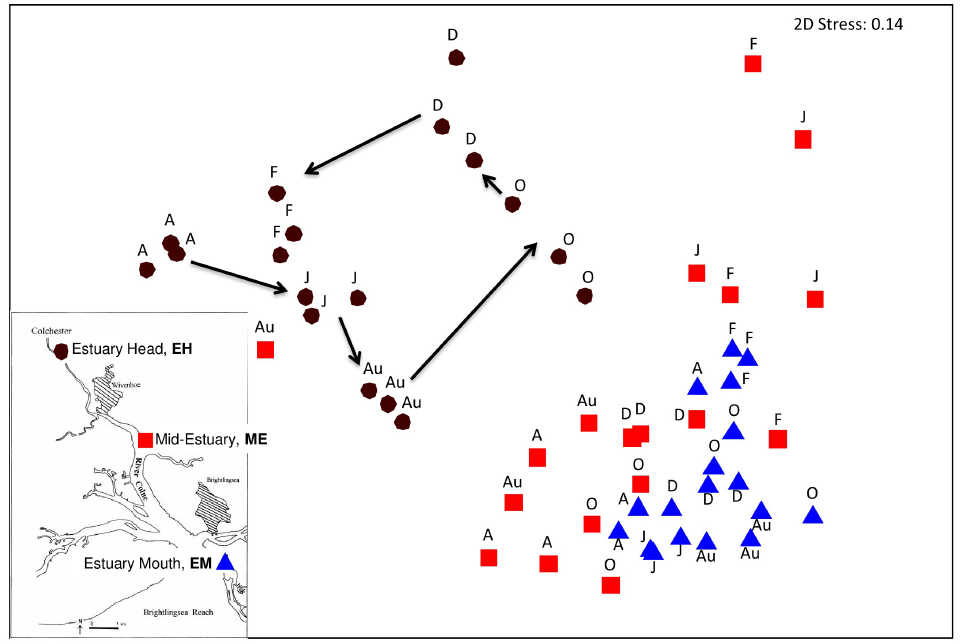
Figure 2. Non-metric multi-dimensional scaling plot of total community T-RFLP profiles from three sites along the estuary sampled at 2-monthly intervals from April 2005 to February 2006. Each month is represented in biological triplicates and coded according to site. Insert map showing sample location along the Colne estuary. Black circles represent the estuary head (EH), red squares mid-estuary (ME) and blue triangles the estuary mouth (EM). A, April; J, June; Au, August; O, October; D, December; F, February 2006.
16S rRNA gene abundances at each site from April 2005 to February 2006 (Figure 3) indicated a significant site and time effect (two way ANOVA, P < 0.001). Gene abundances were highest at the EH and significantly higher than in sediments from ME and the EM (P < 0.001); while there were no significant differences between ME and EM sediments (P = 0.071). Within individual sites, there was only significant variation in 16S rRNA gene copy abundances between months at ME in October (ANOVA P < 0.008, Bonferroni correction).
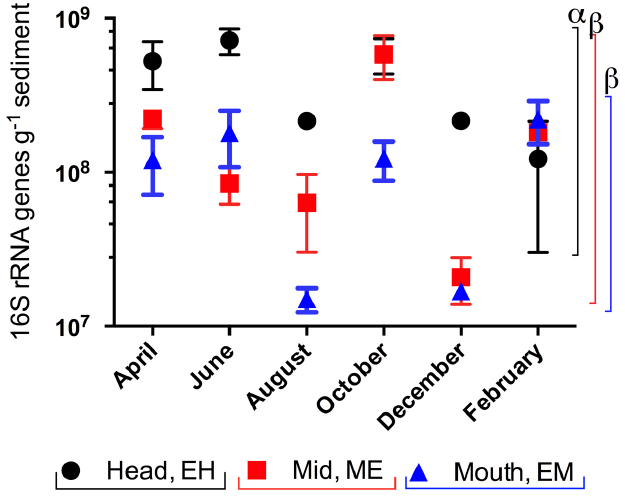
Figure 3. Spatial and temporal variation in 16S rRNA gene copy abundances in sediments from the Colne estuary from April 2005 to February 2006. Standard errors (n = 3) are shown. Greek letters above colored lines [black, estuary head (EH); red, mid-estuary (ME); and blue, estuary mouth (ME)] indicate statistical differences in the overall gene abundances across the year between sites (p < 0.001).
Spatial and Temporal Variation in the Abundance of Nitrate Reductase (narG and napA) and Nitrite Reductase (nirS and nrfA) Genes
In our previous study of the Colne estuary, a suite of nine TaqMan primer and probe sets were designed targeting indigenous nitrate and nitrite reducing phylotypes present (Smith et al., 2007). These included two narG (narG-1 and 2), three napA (napA-1, 2, and 3), three nirS (nirS-e, m and n) and one nrfA (nrfA-2) gene targets. Nitrate (Figure 4) and nitrite (Figure 5) reductase gene abundances were greatest at the EH and lowest at the EM (P < 0.05) for eight of the nine phylotypes. The napA-3 phylotype was the exception, with no significant difference in gene abundances observed along the estuary (P < 0.05). Within individual sites there was only limited temporal variability in gene abundances for both nitrate and nitrite reductase phylotypes (Figures 4 and 5).
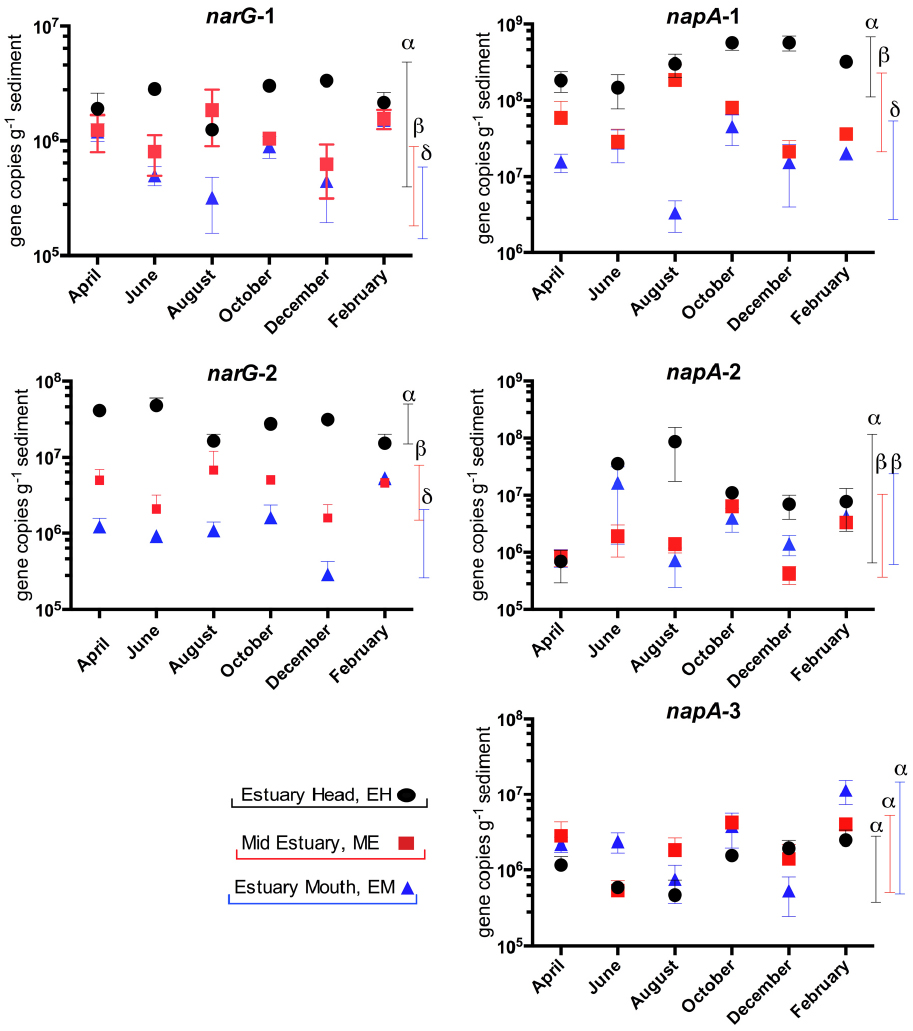
Figure 4. Variation in abundance (gene copies g–1 sediment ±SE, n = 3) of nitrate reductase genes (narG and napA) in sediments along the Colne estuary sampled from April 2005 to February 2006. For each phylotype, significant differences in annual gene abundances between sites along the estuary are indicated by different Greek letters above colored lines [black, estuary head (EH); red, mid-estuary (ME); and blue, estuary mouth (EM)].
Figure 5. Variation in abundance (gene copies g–1 sediment ±SE, n = 3) of nitrite reductase genes (nirS and nrfA) in sediments along the Colne estuary sampled from April 2005 to February 2006. For each phylotype, significant differences in annual gene abundances between sites along the estuary are indicated by different Greek letters above colored lines [black, estuary head (EH); red, mid-estuary (ME); and blue, estuary mouth (EM)].
Percentage relative abundance of nitrate- and nitrite- reducing functional gene abundances to 16S rRNA gene abundances were calculated for each phylotype (Figure 6). In general the highest relative abundance of nitrate- or nitrite-reducing functional gene abundances to 16S rRNA gene abundances were observed at the EH (Figure 6) indicating this site as having not only the most abundant bacterial community but also the highest proportion of nitrate reducers in that community: commensurate with the highest nitrate concentrations along the estuary. Exceptions to this trend were the narG-1 and napA-3 phylotypes, which were greatest at ME and EM sites respectively. For all genes a peak in relative abundance was observed at the EH in February 2006 corresponding to a peak in nitrate and ammonium concentrations (Figure 1).
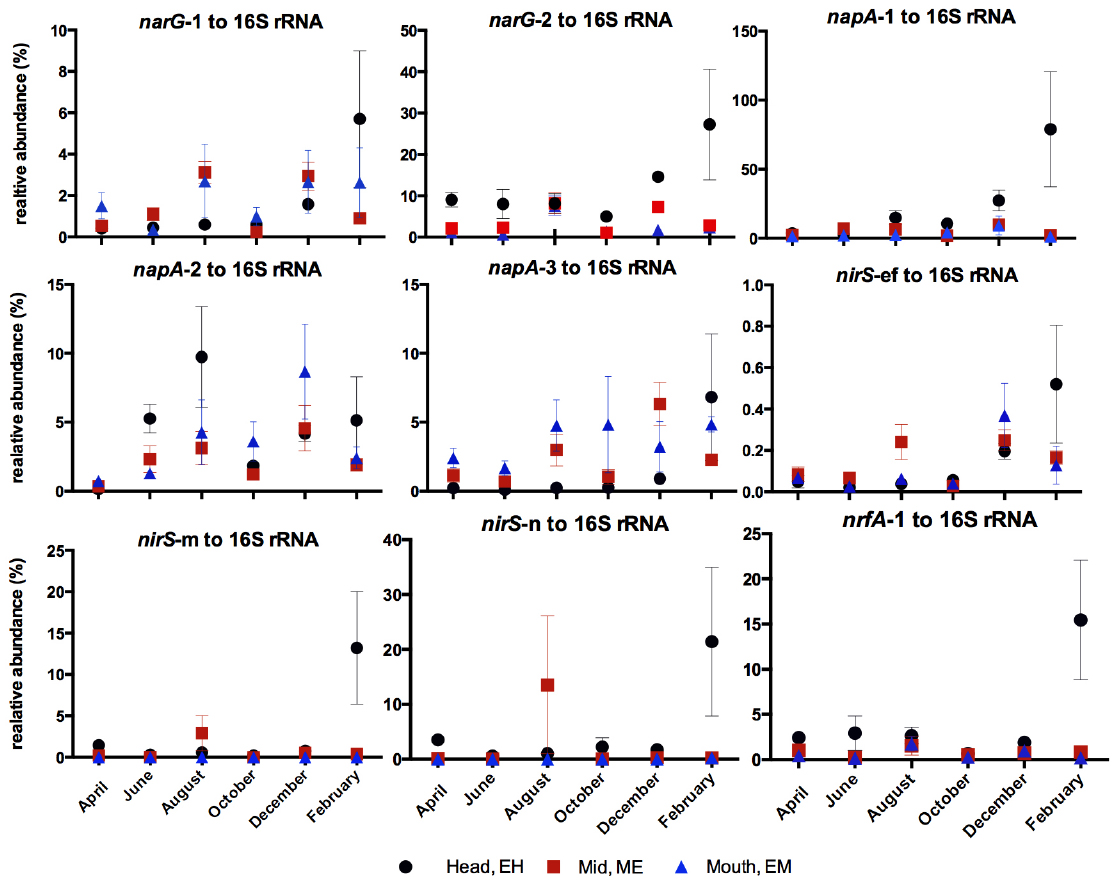
Figure 6. Relative abundance (%) of nitrate- and nitrite- reductase phylotype gene abundances to 16S rRNA gene abundances along the estuary over the annual sampling period.
Spatial and Temporal Variation in narG and nirS Gene Transcription
Trends of transcript abundances reflected those observed at the DNA level—narG transcript abundances were highest at the EH, while differences in nirS-ef transcripts numbers were not observed between sites (Figure 7, P > 0.05).
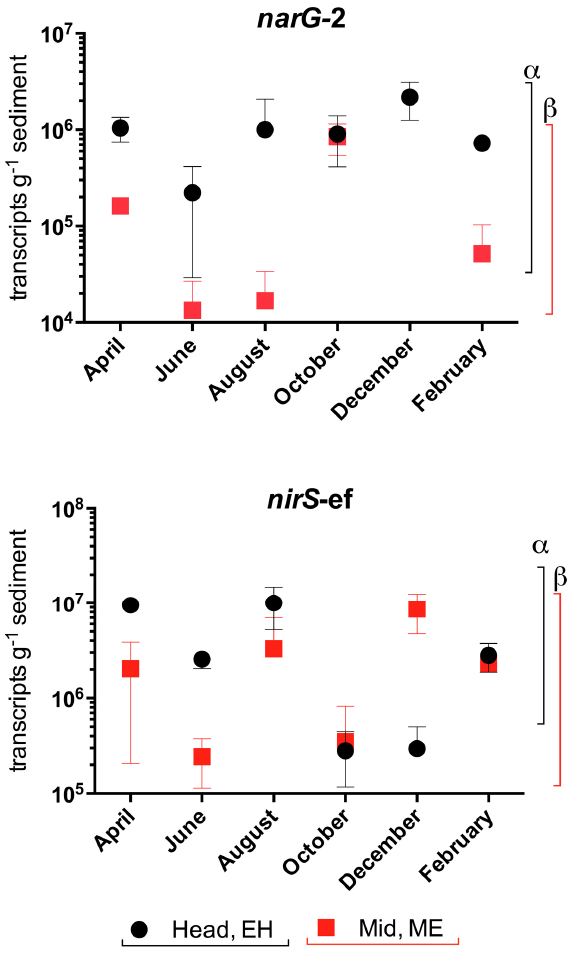
Figure 7. Variation in nitrate (narG-2) and nitrite (nirS-ef) reductase gene transcript abundances (transcripts g–1 sediment +/–SE, n = 3) in sediments along the Colne estuary sampled from April 2005 to February 2006. For each phylotype, significant differences in annual transcript abundances between sites along the estuary are indicated by different Greek letters above the colored lines representing each site [black, estuary head (EH); red, mid-estuary (ME)].
Inter-relationships between Functional Gene Abundances, Nitrate Concentrations, Rates of Denitrification and DNRA
An MDS plot of Bray-Curtis square-root transformed mean gene abundances (i.e., four genes; totalling nine phylotypes) at each site from April to February (Figure 8A) shows spatial and temporal variation in the abundance of the nitrate- and nitrite-reductase genes along the estuary. Gene abundances at the EH site clustered separately from those at ME and EM sites. A one-way ANOSIM indicated a significant difference in the abundance of nitrate- and nitrite-reductases genes at the three sites (R = 0.679, P < 0.001). As with the 16S rRNA community analysis (Figure 2), there was evidence of community change over time (seasonality) at the EH in nitrate- and nitrite reductase gene abundances as indicated by the trajectory on Figure 8A. Relationships between gene abundances, denitrification and DNRA rates and nitrate and ammonia concentrations were explored using BIO-ENV and LINKTREE in PRIMER-6 (Clarke and Ainsworth, 1993). BIO-ENV identified nitrate (R = 0.639, p < 0.001) as the single measured abiotic variable that best explained the clustering of nitrate and nitrite reductase gene abundances along the estuary. To further explore the observed clustering of nitrate and nitrite reductase gene abundances, a LINKTREE non-parametric analysis was conducted in PRIMER6 (Figure 8B), to link the gene abundance clusters to the range of nutrient concentrations or rates of denitrification and DNRA. Three distinct splits labeled 1, 2, and 3, formed in the LINKTREE dendrogram. The first split was observed between the EH and the lower estuary sites and was defined by NO3– concentrations > 202 μM. All other sites, fell into split two where NO3– concentrations were < 146 μM. The next split separated the EM site in August from the rest based on the lowest observed nitrate concentration. Split 3, divided EM sites in April, August and October based on denitrification rates > 71 μmol N m2 h–1 with remaining sites characterized by rates of denitrification below < 53 μmol N m2 h–1.
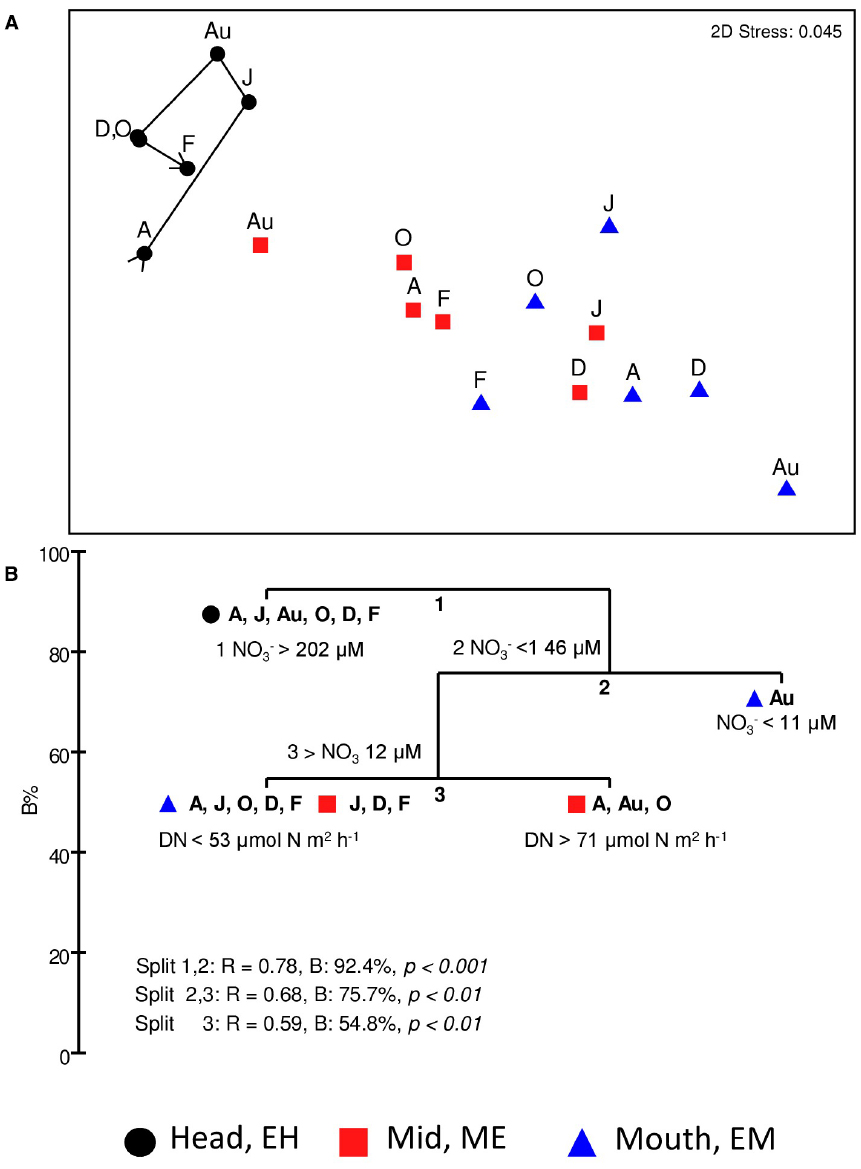
Figure 8. (A) Non-metric multidimensional scaling (MDS) ordination of a Bray-Curtis resemblance matrix calculated from square-root transformed mean Q-PCR nitrate- and nitrite-reductase gene abundances quantified at 2-monthly intervals from sediments at each site; temporal variation at the estuary head (EH) is illustrated by a time-line trajectory drawn through sampling time points. (B) LINKTREE analysis of all sites and time points to identify environmental variable range (nitrate, ammonia, denitrification or DNRA) driving clustering of nitrate-nitrite reducing community observed in 8A. Three splits (1–3) and variable range responsible for the divide are shown. %B, an absolute measure of group difference is shown on the x-axis. ANOSIM R value and p-values are reported for each split. Months: A, April; J, June; Au, August; O, October; D, December; F, February (2006).
Spearman’s correlation co-efficient analysis was preformed to examine correlations between rates of denitrification or DNRA and the abundance of their corresponding genetic determinants (Table 3). For denitrification significant weak to strong (correlations absolute value of r range between 0.40 and 0.79) were observed between the rates of denitrification and corresponding abundances of nirS-n and nirS-m phylotypes. nirS-n, m, and e primer and probe sets target nirS phylotypes first recovered as mRNA nirS gene sequences from sediments at the head of the Colne estuary similar to nirS from gamma and alpha proteobacteria (Nogales et al., 2002; Smith et al., 2007). Weak to moderate, but not significant correlations were observed between denitrification and nirS-e and DNRA and nrfA gene abundances (Table 3). The nirS-e primer and probe set target nirS gene sequences first retrieved from the ME site of the Colne as mRNA and phylogenetically group with gamma proteobacteria (Nogales et al., 2002; Smith et al., 2007). The nrfA primer set targeted nrfA phylotypes retrieved from the Colne EH site that phylogenetically group with epsilon-proteobacteria (Smith et al., 2007).
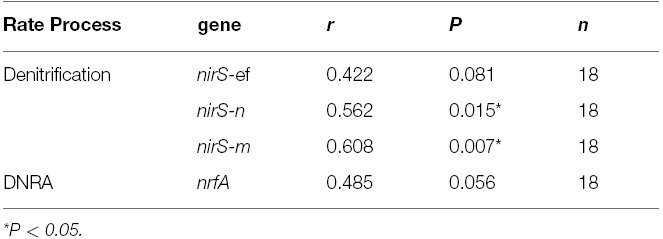
Table 3. Spearman’s rank correlation co-efficient between rate process measurements and functional gene abundances.
Discussion
In this study, we report spatial and temporal dynamics in the activity of benthic nitrate reduction coupled to quantification of nitrate reducing functional genes and transcripts along an estuarine gradient. Denitrification, DNRA and corresponding nitrate and nitrite functional gene abundances decreased along the estuary, following the nitrate gradient in the water column as previously observed in the Colne estuary (Ogilvie et al., 1997; Dong et al., 2009) and the Thames (Trimmer et al., 2000). Denitrification at the EH greatly exceeded that of the other sites. At the EH, rates of denitrification were highest in June, whereas in the middle of the estuary and at the mouth rates peaked in October. Lowest rates of denitrification at all three sites were observed in December. Our earlier studies of the Colne (Dong et al., 2000) and the Great Ouse (Trimmer et al., 1998) had shown highest denitrification rates during late spring/summer and lowest denitrification activity during the winter.
The separation of the EH from sites lower down the estuary was not as pronounced when it came to DNRA. Rates of DNRA at the EH and middle sites were similar, and DNRA at the middle estuary site was, in fact, greater than at the EH in four out of six months (October and February). Seasonal variability was also observed for DNRA, with the highest rates in late summer and early autumn, and lowest rates in spring (Figure 1). Giblin et al. (2010) measured denitrification and DNRA in the Parker River estuary for 13 years at a single upstream site (salinity between 0 and 18 ppt) between 1993 and 2006. Large seasonal and inter-annual variation in denitrification and DNRA was reported, primarily driven by salinity not temperature. Rates of DNRA in the Parker River Estuary were highest in late summer (August) and lowest in early spring (March). Spatially, denitrification in the Parker River exhibited the opposite trend to the Colne estuary, as it was inversely related to the salinity gradient with a peak in denitrification in late spring in this estuary. In the Norsminde Fjord, Denmark, Jørgensen (1989) reported two maxima in denitrification, the first in early spring and the second in autumn. A peak in DNRA was observed in late summer, attributed to the more highly reduced sediments within the estuary at this time. The results from the Colne data are in agreement with modeling studies (Kelly-Gerreyn et al., 2001), and data from tropical estuaries (Dong et al., 2011) that suggested DNRA tends to become increasingly important at higher environmental temperatures.
Denitrification has in the past been considered the dominant nitrate reduction pathway in coastal and marine sediments and DNRA less important, if considered at all (for a review, see Burgin and Hamilton, 2007; Giblin et al., 2013). Our previous single time-point study of denitrification, DNRA and anammox, showed that more nitrate was removed from the system via denitrification than was reduced to ammonia by DNRA (Dong et al., 2009). Anammox was detected only at the EH and accounted for 30% of the N2 formation. In this study anammox was not measured, due to logistical limitations, instead focusing on nitrate reduction pathways of denitrification and DNRA. Over the annual time period, denitrification rates exceeded those of DNRA only in the late spring/early summer (April and June) at all three sites along the estuary. For the remainder of the year, at the time points measured, rates of DNRA exceeded those of denitrification indicating that more nitrate was being reduced and converted to ammonia than was being lost from the system in gaseous forms via denitrification. This further highlights the importance of not relying on single time point studies to understand the dynamics of the nitrogen cycle in dynamic estuarine systems.
Denitrification and DNRA compete for nitrate and carbon within sediments. The availability of nitrate and organic carbon are key factors controlling rates of benthic denitrification (Cornwell et al., 1999; Dong et al., 2000; Fulweiler and Heiss, 2014). Previous studies of the Colne estuary have indicated that denitrification at the EH is carbon limited, while denitrification ME and at the EM is nitrate limited (Papaspyrou et al., 2014). However, the ratio of electron donor to acceptor can influence the pathway and fate of nitrate. DNRA has a higher affinity for nitrate than denitrification and may be favored in nitrate-limited, carbon-rich environments (King and Nedwell, 1985; Burgin and Hamilton, 2007; Kraft et al., 2014). This is due to the requirement of only 5 electrons to reduce nitrate in denitrification verses the eight required for DNRA (Tiedje, 1988). DNRA may therefore outcompete denitrification in nitrate-limited environments where these organisms gain more energy from DNRA than denitrifiers can from denitrification. Indeed nitrate concentrations at the ME site were much lower than at the EH and in the months where DNRA was the dominant process it was 5–2120 times greater than denitrification at this site (Alresford). Recent studies in similar environments have shown that DNRA is often the prominent nitrate reduction pathway. For examples, Giblin et al., 2013, showed DNRA was greater than denitrification in 30% of 55 coastal sediments sites examined. Similarly, Song et al. (2014), in a single time point study of benthic DNRA in the New River estuary, North Carolina, USA showed it was responsible for 44–74% of nitrate reduction and reported that DNRA rates were greater than denitrification (Lisa et al., 2014).
The results of our study have highlighted, for the first time, the importance of DNRA as a significant pathway for benthic sediment nitrate reduction in the Colne estuary. The rates of benthic DNRA of nitrate from the water column (DNRAw) in the whole estuary was estimated as 11.48 Mmol N year–1 derived by multiplying the mean annual rates of DNRA at the EH (679 μmol N m–2 h–1), ME (517 μmol N m–2 h–1), and EM (106.7 μmol N m–2 h–1) by the total area of sediment (which is defined as the 72% of the area totally immersed at spring tide; Ogilvie et al., 1997) in the sector of the river center around each site (Dong et al., 2000). Using the mass balance approach, by subtracting oxidized inorganic nitrogen (NO3– + NO2–) removal by denitrification supported by nitrate from water column (5.09 Mmol N year–1) from the total sediment uptake of oxidized inorganic nitrogen (16.28 Mmol N year–1), a very similar DNRA rate of 11.19 Mmol N year–1 was obtained (Thornton et al., 2007).
At the molecular level, the abundances of gene and transcript molecular markers for nitrate reduction (narG and napA), denitrification (nirS) and DNRA (nrfA) generally showed a consistent overall spatial trend of declining abundances from the EH to the EM (Figures 4–6) as observed in the rate process data, supporting and extending our previous studies along the Colne estuary at single time points (Smith et al., 2007; Dong et al., 2009). In contrast to our observations in the hypernutrified Colne, nirS and nirK gene abundances along the lower nutrient Fitzroy estuary, Australia showed no statistical difference between sites, despite some observed variability in the net rates of denitrification along the estuary (Abell et al., 2010). The one exception to this trend of decreasing gene abundances along the estuary was the napA-3 phylotype (alphaproteobacteria) where gene abundances throughout the 12 month sampling period remained constant along the estuary gradient (Figure 4), suggesting a different selective mechanism and different ecological significance for this nap phylotype than for the other two phylotypes (both gammaproteobacteria). While we have determined the distributions of these different functional genes and their phylotypes along the estuary, one of the key questions remaining to be elucidated is the different functions of these phylotypes, which can probably only be clarified by controlled laboratory-based studies. Richardson et al. (2001) suggested that NAR and NAP provide adaptations to different nitrate environments, the former facilitating nitrate reduction in reduced, high nitrate environments whereas NAP is adaptive to effective nitrate scavenging in lower nitrate and less reduced environments. The distributions that we measured along the Colne estuary would suggest that these different napA phylotypes, particularly napA-3 generally support this hypothesis as total bacterial numbers decline along the estuary but napA numbers remain high indicating that they are relatively more important at lower nitrate concentrations than narG.
While gene and transcript abundances generally decreased along the estuary gradients, as observed in the rate process data, finer scale correlations between rates and gene/transcript abundances on temporal scales were not observed. Some studies have shown good agreement between activity measurements and gene and/or transcript abundances, e.g., in studies of archaeal nitrification (Wuchter et al., 2006). However, there is evidence in the literature to indicate the direct measurement of functional genes at DNA and even mRNA levels can be uncoupled to activity measurements, indicating that substantial post-transcriptional, protein assembly and/or environmental factors ultimately control activity. For example, Ikeda et al. (2009) examined the roles of NAR and NAP in nitrate reduction in Pseudomonas sp. and found that nitrate reductase activity and napA or narG gene transcription were not necessarily positively correlated, leading them to conclude that there were subsequent post-translational modifications even in pure culture. In soils, Liu et al. (2010) demonstrated the dramatic effect increasing pH had on reducing denitrification activity, yet this trend was not reciprocated in nirS and nosZ gene and transcript abundance, leading them to conclude that reduction in pH affected denitrification after transcription. In the highly nutrified Colne estuary, the high nitrate concentrations in the water are drastically reduced within the surface sediment by rapid nitrate reduction in the sub-oxic zone (the surface oxic layer of sediment is usually <2–3 mm depth (Robinson et al., 1998). Consequently, benthic nitrate reducers are operating at very low pore water nitrate concentrations where rates of nitrate reduction approximate to first order kinetics; well below any nitrate-saturating concentrations when nitrate reduction might correlate with genetic potentials. The correspondence between rate processes and gene abundances/transcripts is likely to be closer the nearer in situ substrate concentrations are to saturating concentrations of substrates. Furthermore other physical-chemical factors such as temperature or pH may control key enzyme activity, and in situ rates, without necessarily directly affecting transcription. Further and future studies will focus on determining the links between environmental conditions, nitrate and nitrite reducing communities and rates of nitrate reduction and controlling factors influencing the fate of nitrate within estuarine sediments.
Conflict of Interest Statement
The authors declare that the research was conducted in the absence of any commercial or financial relationships that could be construed as a potential conflict of interest.
Acknowledgments
We thank John Green for excellent technical support in field sampling and in processing stable isotope samples. This work was supported by the Natural Environment Research Council of the UK through research grant NER/A/S/2002/00962 awarded to DN and AO. CS is currently supported by SFI Starting Investigator-COFUND fellowship (11/SIRG/B2159).
References
Abell, G. C. J., Revill, A. T., Smith, C., Bissett, A. P., Volkman, J. K., and Robert, S. S. (2010). Archaeal ammonia oxidizers and nirS-type denitrifiers dominate sediment nitrifying and denitrifying populations in a subtropical macrotidal estuary. ISME J. 4, 286–300. doi: 10.1038/ismej.2009.105
Brin, L. D., Giblin, A. E., and Rich, J. J. (2014). Environmental controls of anammox and denitrification in southern New England estuarine and shelf sediments. Limnol. Oceangr. 59, 851–860. doi: 10.4319/lo.2014.59.3.0851
Burgin, A. J., and Hamilton, S. K. (2007). Have we overemphasized the role of denitrification in aquatic ecosystems? A review of nitrate removal pathways. Front. Ecol. Environ. 5:89–96. doi: 10.1890/1540-9295(2007)5[89:HWOTRO]2.0.CO;2
Clarke, K. R. (1993). Non-parametric multivariate analyses of changes in community structure. Aust. J. Ecol. 18, 117–143. doi: 10.1111/j.1442-9993.1993.tb00438.x
Clarke, K. R., and Ainsworth, M. (1993). A method of linking multivariate community structure to environmental variables. Mar. Ecol. Prog. Ser. 92, 205–219. doi: 10.3354/meps092205
Clarke, K. R., Somerfield, P. J., and Chapman, M. G. (2006). On resemblance measures for ecological studies, including taxonomic dissimilarities and a zero-adjusted Bray–Curtis coefficient for denuded assemblages. J. Exp. Mar. Biol. Ecol. 330, 55–80. doi: 10.1016/j.jembe.2005.12.017
Cornwell, J. C., Kemp, W. M., and Kana, T. M. (1999). Denitrification in coastal ecosystems: methods, environmental controls, and ecosystem level controls, a review. Aquat. Ecol. 33, 41–54. doi: 10.1023/A:1009921414151
Dong, L. F., Nedwell, D. B., Underwood, G. J. C., Thornton, D. C. O., and Rusmana, I. (2002). Nitrous oxide formation in the Colne estuary, England: the central role of nitrite. Appl. Environ. Microbiol. 68, 1240–1249. doi: 10.1128/AEM.68.3.1240-1249.2002
Dong, L. F., Nedwell, D. B., and Stott, A. (2006). Sources of nitrogen used for denitrification and nitrous oxide formation in sediments of the hypernutrified Colne, the nutrified Humber, and the oligotrophic Conwy estuaries, United Kingdom. Limnol. Oceangr. 51, 545–557. doi: 10.4319/lo.2006.51.1_part_2.0545
Dong, L. F., Smith, C. J., Papaspyrou, S., Stott, A., Osborn, A. M., and Nedwell, D. B. (2009). Changes in benthic denitrification, nitrate ammonification, and anammox process rates and nitrate and nitrite reductase gene abundances along an estuarine nutrient gradient (the Colne estuary, United Kingdom). Appl. Environ. Microbiol. 75, 3171–3179. doi: 10.1128/AEM.02511-08
Dong, L. F., Sobey, M. N., Smith, C. J., Rusmana, I., Phillips, W., Stott, A., et al. (2011). Dissimilatory reduction of nitrate to ammonium, not denitrification or anammox, dominates benthic nitrate reduction in tropical estuaries. Limnol. Oceanogr. 56, 279–291. doi: 10.4319/lo.2011.56.1.0279
Dong, L. F., Thornton, D., and Nedwell, D. B. (2000). Denitrification in sediments of the River Colne estuary, England. Mar. Ecol. Prog. Ser. 203, 109–122. doi: 10.3354/meps203109
Earl, T. J., Upton, G. J. G., and Nedwell, D. B. (2014). UK catchments nutrient loads 1993-2003, a new approach using harmonised monitoring scheme data: temporal changes, geographical distribution, limiting nutrients and loads to coastal waters. Environ. Sci. Process. Impact. 16, 1646–1658. doi: 10.1039/c4em00021h
Fulweiler, R., and Heiss, E. (2014). (Nearly) A decade of directly measured sediment N2 fluxes: what can narragansett bay tell us about the global ocean nitrogen budget? Oceanography 27, 184–195. doi: 10.5670/oceanog.2014.22
Giblin, A. E., Tobias, C. R., Song, B., Weston, N., and Banta, G. T. (2013). The importance of dissimilatory nitrate reduction to ammonium (DNRA) in the nitrogen cycle of coastal ecosystems. Oceanography 26, 124–131. doi: 10.5670/oceanog.2013.54
Giblin, A. E., Weston, N. B., Banta, G. T., Tucker, J., and Hopkinson, C. S. (2010). The effects of salinity on nitrogen losses from an oligohaline estuarine sediment. Estuaries Coasts 33, 1054–1068. doi: 10.1007/s12237-010-9280-7
Ikeda, E., Andou, S., Iwama, U., Kato, C., Horikoshi, K., and Tamegai, H. (2009). Physiological roles of two dissimilatory nitrate reductases in the deep-sea denitrifier Pseudomonas sp. strain MT-1. Biosci. Biotechnol. Biochem. 73, 896–900. doi: 10.1271/bbb.80833
Jørgensen, K. S. (1989). Annual pattern of denitrification and nitrate ammonification in estuarine sediment. Appl. Environ. Microbiol. 55, 1841–1847.
Kelly-Gerreyn, B. A., Trimmer, M., and Hydes, D. J. (2001). A diagenetic model discriminating denitrification and dissimilatory nitrate reduction to ammonium in a temperate estuarine sediment. Mar. Ecol. Prog. Ser. 220, 33–46. doi: 10.3354/meps220033
King, D., and Nedwell, D. B. (1985). The influence of nitrate concentration upon the end-products of nitrate dissimilation by bacteria in anaerobic salt marsh sediment. FEMS Microbiol. Ecol. 1, 23–28. doi: 10.1111/j.1574-6968.1985.tb01127.x
Kraft, B., Tegetmeyer, H. E., Sharma, R., Klotz, M. G., Ferdelman, T. G., Hettich, R. L., et al. (2014). The environmental controls that govern the end product of bacterial nitrate respiration. Science 345, 676–679. doi: 10.1126/science.1254070
Kuenen, J. G. (2008). Anammox bacteria: from discovery to application. Nat. Rev. Micro. 6, 320–326. doi: 10.1038/nrmicro1857
Lane, D. J. (1991). “16S/23S rRNA sequencing,” in Nucleic Acid Techniques in Bacterial Systematics, eds E. Stackebrandt, and M. Goodfellow (Chichester: John Wiley & Sons), 115–175.
Lisa, J. A., Song, B., Tobias, C. R., and Duernberger, K. A. (2014). Impacts of freshwater flushing on anammox community structure and activities in the New River Estuary, USA. Aquat. Microb. Ecol. 72, 17–31. doi: 10.3354/ame01682
Liu, B., Mørkved, P. T., Frostegård, Å., and Bakken, L. R. (2010). Denitrification gene pools, transcription and kinetics of NO, N2O and N2 production as affected by soil pH. FEMS Microbiol. Ecol. 72, 407–417. doi: 10.1111/j.1574-6941.2010.00856.x
Lozupone, C. A., and Knight, R. (2007). Global patterns in bacterial diversity. Proc. Natl. Acad. Sci. U.S.A. 104, 11436–11440. doi: 10.1073/pnas.0611525104
Marchesi, J. R., Sato, T., and Weightman, A. J. (1998). Design and evaluation of useful bacterium-specific PCR primers that amplify genes coding for bacterial 16S rRNA. Appl. Environ. Microbiol. 64, 795–799.
Nedwell, D. B., Jickells, T. D., Trimmer, M., and Sanders, R. (1999). “Nutrients in estuaries,” in Estuaries Advances in Ecological Research, eds D. B. Nedwell, D. G. Raffaelli, and A. H. Fitter (San Diego: Academic Press), 43–92. doi: 10.1016/S0065-2504(08)60191-9
Nedwell, D. B., Dong, L. F., Sage, A., and Underwood, G. J. C. (2002). Variations of the nutrients loads to the mainland U.K. estuaries: correlation with catchment areas, urbanization and coastal eutrophication. Estuar. Coast. Mar. Sci. 54, 951–970. doi: 10.1006/ecss.2001.0867
Nicholls, J. C., and Trimmer, M. (2009). Widespread occurrence of the anammox reaction in estuarine sediments. Aquat. Microb. Ecol. 55, 105–113. doi: 10.3354/ame01285
Nogales, B., Timmis, K. N., Nedwell, D. B., and Osborn, A. M. (2002). Detection and diversity of expressed denitrification genes in estuarine sediments after reverse transcription-PCR amplification from mRNA. Appl. Environ. Microbiol. 68, 5017–5025. doi: 10.1128/AEM.68.10.5017-5025.2002
Ogilvie, B., Nedwell, D. B., Harrison, R. M., Robinson, A., and Sage, A. (1997). High nitrate, muddy estuaries as nitrogen sinks: the nitrogen budget of the River Colne estuary (United Kingdom). Mar. Ecol. Prog. Ser. 150, 217–228. doi: 10.3354/meps150217
Papaspyrou, S., Smith, C. J., Dong, L. F., Whitby, C., Dumbrell, A. J., and Nedwell, D. B. (2014). Nitrate Reduction Functional Genes and Nitrate Reduction Potentials Persist in Deeper Estuarine Sediments. Why? PLoS ONE 9:e94111. doi: 10.1371/journal.pone.0094111
Philippot, L., and Hallin, S. (2005). Finding the missing link between diversity and activity using denitrifying bacteria as a model functional community. Curr. Opin. Microbiol. 8, 234–239. doi: 10.1016/j.mib.2005.04.003
Richardson, D. J., Berks, B. C., Russell, D. A., Spiro, S., and Taylor, C. J. (2001). Functional, biochemical and genetic diversity of prokaryotic nitrate reductases. Cell. Mol. Life Sci. 58, 165–178. doi: 10.1007/PL00000845
Robinson, A. D., Nedwell, D. B., Harrison, R. M., and Ogilvie, B. G. (1998). Hypernutrified estuaries as sources of N2O emission to the atmosphere: the estuary of the River Colne, Essex, UK. Mar. Ecol. Prog. Ser. 164, 59–71. doi: 10.3354/meps164059
Seitzinger, S. P. (1988). Denitrification in freshwater and coastal marine ecosystems: ecological and geochemical significance. Limnol. Oceangr. 33, 702–724. doi: 10.4319/lo.1988.33.4_part_2.0702
Simon, J. (2002). Enzymology and bioenergetics of respiratory nitrite ammonification. FEMS Microbiol. Rev. 26, 285–309. doi: 10.1111/j.1574-6976.2002.tb00616.x
Smith, C. J., Danilowicz, B. S., Clear, A. K., Costello, F. J., Wilson, B., and Meijer, W. G. (2005). T-Align, a web-based tool for comparison of multiple terminal restriction fragment length polymorphism profiles. FEMS Microbiol. Ecol. 54, 375–380. doi: 10.1016/j.femsec.2005.05.002
Smith, C. J., Nedwell, D. B., Dong, L. F., and Osborn, A. M. (2006). Evaluation of quantitative polymerase chain reaction-based approaches for determining gene copy and gene transcript numbers in environmental samples. Environ. Microbiol. 8, 804–815. doi: 10.1111/j.1462-2920.2005.00963.x
Smith, C. J., Nedwell, D. B., Dong, L. F., and Osborn, A. M. (2007). Diversity and abundance of nitrate reductase genes (narG and napA), nitrite reductase genes (nirS and nrfA), and their transcripts in estuarine sediments. Appl. Environl. Microbiol. 73, 3612–3622. doi: 10.1128/AEM.02894-06
Song, B., Lisa, J. A., and Tobias, C. R. (2014). Linking DNRA community structure and activity in a shallow lagoonal estuarine system. Front. Microbiol. 5:460. doi: 10.3389/fmicb.2014.00460
Strickland, J. D. H., and Parsons, T. R. (1972). A Practical Handbook of Seawater Analysis, 2nd Edn. Ottawa: Fisheries Research Board of Canada, 310.
Strous, M., Fuerst, J. A., Kramer, E. H., Logemann, S., Muyzer, G., van de Pas-Schoonen, K. T., et al. (1999). Missing lithotroph identified as new planctomycete. Nature 400, 446–449. doi: 10.1038/22749
Suzuki, M. T., Taylor, L. T., and Delong, E. F. (2000). Quantitative analysis of small-subunit rRNA genes in mixed microbial populations via 5′-nuclease assays. Appl. Environ. Microbiol. 66, 4605–4614. doi: 10.1128/AEM.66.11.4605-4614.2000
Thornton, D., Dong, L. F., and Underwood, G. (2007). Sediment-water inorganic nutrient exchange and nitrogen budgets in the Colne Estuary, UK. Mar. Ecol. Prog. Ser. 337, 63–77. doi: 10.3354/meps337063
Tiedje, J. M. (1988). “Ecology of denitrification and dissimilatory nitrate reduction to ammonium,” in Environmental Microbiology of Anaerobes, ed. A. J. B. Zehnder (New York: Biology of anaerobic microorganisms), 179–244.
Trimmer, M., Nedwell, D. B., Sivyer, D. B., and Malcolm, S. J. (1998). Nitrogen fluxes through the lower estuary of the river Great Ouse, England: the role of the bottom sediments. Mar. Ecol. Prog. Ser. 163, 109–124. doi: 10.3354/meps163109
Trimmer, M., Nedwell, D. B., Sivyer, D. B., and Malcolm, S. J. (2000). Seasonal benthic organic matter mineralisation measured by oxygen uptake and denitrification along a transect of the inner and outer River Thames estuary, UK. Mar. Ecol. Prog. Ser. 197, 103–119. doi: 10.3354/meps197103
Tukey, J. W. (1953). The collected works of John W. Tukey: Multiple Comparisons, 1948–1983, ed. H. Braun (New York: Taylor & Francis).
Wuchter, C., Abbas, B., Coolen, M. J. L., Herfort, L., van Bleijswijk, J., Timmers, P., et al. (2006). Archaeal nitrification in the ocean. Proc. Natl. Acad. Sci. U.S.A. 103, 12317–12322. doi: 10.1073/pnas.0600756103
Keywords: denitrification/DNRA, narG, napA, nirS, nrfA, (RT)-Q-PCR
Citation: Smith CJ, Dong LF, Wilson J, Stott A, Osborn AM and Nedwell DB (2015) Seasonal variation in denitrification and dissimilatory nitrate reduction to ammonia process rates and corresponding key functional genes along an estuarine nitrate gradient. Front. Microbiol. 6:542. doi: 10.3389/fmicb.2015.00542
Received: 20 March 2015; Accepted: 17 May 2015;
Published: 02 June 2015.
Edited by:
Anton F. Post, Coastal Resource Center, University of Rhode Island, USACopyright © 2015 Smith, Dong, Wilson, Stott, Osborn and Nedwell. This is an open-access article distributed under the terms of the Creative Commons Attribution License (CC BY). The use, distribution or reproduction in other forums is permitted, provided the original author(s) or licensor are credited and that the original publication in this journal is cited, in accordance with accepted academic practice. No use, distribution or reproduction is permitted which does not comply with these terms.
*Correspondence: Cindy J. Smith, Microbiology, School of Natural Sciences, National University of Ireland Galway, University Road, Galway, Ireland, cindy.smith@nuigalway.ie
†Present address: Cindy J. Smith, Microbiology, School of Natural Sciences, National University of Ireland, University Road, Galway, Ireland; A. Mark Osborn, School of Applied Sciences, RMIT University, PO Box 77, Bundoora, VIC 3083, Australia
‡These authors have contributed equally to this work.