 Joshua C. McCann1*
 Shaoyu Luan1
 Felipe C. Cardoso1
 Hooman Derakhshani2
 Ehsan Khafipour2,3
 Juan J. Loor1,4*
- 1Department of Animal Sciences, University of Illinois, Urbana, IL, USA
- 2Department of Animal Science, University of Manitoba, Winnipeg, MB, Canada
- 3Department of Medical Microbiology, University of Manitoba, Winnipeg, MB, Canada
- 4Division of Nutritional Sciences, University of Illinois, Urbana, IL, USA
Subacute ruminal acidosis (SARA) negatively impacts the dairy industry by decreasing dry matter intake, milk production, profitability, and increasing culling rate and death loss. Six ruminally cannulated, lactating Holstein cows were used in a replicated incomplete Latin square design to determine the effects of SARA induction on the ruminal microbiome and epithelium. Experimental periods were 10 days with days 1–3 for ad libitum intake of control diet, followed by 50% feed restriction on day 4, and ad libitum access on day 5 to the basal diet or the basal diet with an additional 10% of a 50:50 wheat/barley pellet. Based on subsequent ruminal pH, cows were grouped (SARA grouping; SG) as Non-SARA or SARA based on time <5.6 pH (0 and 3.4 h, respectively). Ruminal samples were collected on days 1 and 6 of each period prior to feeding and separated into liquid and solid fractions. Microbial DNA was extracted for bacterial analysis using 16S rRNA gene paired-end sequencing on the MiSeq Illumina platform and quantitative PCR (qPCR). Ruminal epithelium biopsies were taken on days 1 and 6 before feeding. Quantitative RT-PCR was used to determine gene expression in rumen epithelium. Bray–Curtis similarity indicated samples within the liquid fraction separated by day and coincided with an increased relative abundance of genera Prevotella, Ruminococcus, Streptococcus, and Lactobacillus on day 6 (P < 0.06). Although Firmicutes was the predominant phyla in the solid fraction, a SG × day interaction (P < 0.01) indicated a decrease on day 6 for SARA cows. In contrast, phylum Bacteroidetes increased on day 6 (P < 0.01) for SARA cows driven by greater genera Prevotella and YRC22 (P < 0.01). Streptococcus bovis and Succinivibrio dextrinosolvens populations tended to increase on day 6 but were not affected by SG. In ruminal epithelium, CLDN1 and CLDN4 expression increased on day 6 (P < 0.03) 24 h after SARA induction and a tendency for a SG × day interaction (P < 0.10) was observed for CLDN4. Overall, results indicate more rapid adaptation to an induced bout of SARA in the solid fraction ruminal microbiome compared with ruminal epithelium.
Introduction
The nutrient density of dairy cattle diets has increased to maintain consistent improvements in milk yield (Plaizier et al., 2008). These dietary shifts, primarily achieved via greater concentrate inclusion relative to forage, can lead to an accumulation of volatile fatty acids in the rumen and reduced buffering capacity (Kleen et al., 2003; Stone, 2004). An overall reduction in ruminal pH such that it remains <5.6 for more than 3 h per day has been defined as subacute ruminal acidosis (SARA; Gozho et al., 2005). Compared with acute ruminal acidosis, SARA is not associated with accumulation of lactic acid in the rumen (Oetzel et al., 1999). The effects of SARA extend beyond ruminal pH and include rumen epithelial damage (Steele et al., 2011), laminitis (Cook et al., 2004), inflammation (Khafipour et al., 2009b), decreased dry matter intake (Stock and Smith, 2000; Kleen et al., 2003), lower milk yield (Stone, 1999), reduced in situ fiber degradation (Plaizier et al., 2001), and liver abscesses (Dirksen et al., 1985). Prevalence of SARA has been documented from 19 to 26% in early to mid-lactation cows (Garrett et al., 1997; Oetzel et al., 1999) and thus represents a significant concern for the dairy industry.
Changes in ruminal fermentation and function are the source of the multi-faceted and unfavorable consequences of SARA. Although typically described by ruminal pH, multiple reports indicate SARA effects are caused by a combination of ruminal pH and diet type (Mould and Ørskov, 1983; Russell, 1998; Calsamiglia et al., 2008; Khafipour et al., 2009a). Altering the timing and availability of dietary substrate composition may modify the bacterial community function and composition within the rumen. Understanding the shifts in the ruminal microbiome related to the observed changes in ruminal pH may uncover bacteria critical to the onset of SARA. Furthermore, effects on the microbiome may provide a more suitable definition of SARA. Advancements in high-throughput sequencing have facilitated description of bacterial communities at unprecedented detail.
Rumen epithelial tissue has many functions including nutrient absorption, metabolism, pH regulation, as well as immune and barrier functions. Impairment of barrier function has been classically linked to a decreased pH associated with periods of rapid fermentation (Gäbel et al., 1987; Aschenbach et al., 2011). The primary proteins identified in rumen epithelial tissue associated with barrier function include claudin-1 and zona occludin-1 both of which are localized in the stratum granulosum (Graham and Simmons, 2005). The molecular changes in rumen epithelium after a mild SARA bout are not well-defined. Therefore, the objectives of this experiment were to determine the effect of SARA induction on the rumen microbiome composition and predicted function in the solid and liquid fraction, describe this effect on gene expression in rumen epithelial tissue, and to link these effects with the severity of an acidotic bout.
Materials and Methods
Experiment Design
The experimental protocol was approved by the Institutional Animal Care and Use Committee at the University of Illinois at Urbana Champaign. Six ruminally cannulated Holstein cows were used in a replicated incomplete Latin square design. Three experimental periods consisted of 10 days with all animals receiving the same basal diet (Supplementary Table S1). Ad libitum intake was maintained for the initial 3 days of each period. On day 4, intake was reduced to 50% based on average intake from the previous 3 days. Subsequently, on day 5 all animals were given ad libitum access to the basal diet or the basal diet topdressed with a wheat/barley pellet at 10% of prior dry matter intake. Ruminal pH measurements were taken hourly from -2 to 22 h relative to SARA induction. Using the pH response data on day 5, cows were grouped (SARA grouping; SG) as Non-SARA (n = 7) or SARA (n = 5) if ruminal pH was <5.6 for more than 3 h (Supplementary Table S2) regardless of pellet inclusion on day 5. Data for ruminal pH, feed intake, urine pH, fecal pH, milk production have been reported previously (Luan et al., 2015). In this article, we reinterpreted the pH data in the context of effects on the ruminal microbiome and epithelium.
Rumen Sampling and Nucleic Acid Extraction
Prior to morning feeding on days 1 and 6, ruminal contents were sampled via the ruminal cannula from the ventral sac of the rumen after mixing of the contents. Ruminal contents were squeezed through three layers of cheesecloth to separate into liquid and solid fractions. Samples were immediately put on ice and stored at -20°C prior to extraction.
DNA from the solid fraction (25 g) was extracted by homo genization followed by phenol/chloroform protocol as described by Stevenson and Weimer (2007). DNA from the liquid fraction (50 mL) was extracted using the ZR-96 Fecal DNA Kit (ZYMO Research, Irvine, CA, USA), which included a bead-beating step for mechanical lysis of bacterial cell walls. Extracted DNA from the solid fraction was standardized to 8 ng/μL for quantitative PCR (qPCR) and 20 ng/μL for Illumina sequencing. Extracted DNA was stored at -80°C for later use.
Rumen epithelium biopsies were taken on days 1 and 6 of the study prior to morning feeding. Ruminal contents were evacuated from the ventral sac allowing retraction of the epithelium approximately 6–9 inches below the ruminal cannula (Kelly et al., 1995). Papillae biopsies were excised, washed with PBS, immediately frozen in liquid nitrogen, and stored at -20°C until extraction. Rumen epithelium tissue samples were weighed and 0.4–0.6 g were subjected to RNA extraction using ice-cold QIAzol Lysis Reagent and the miRNeasy Mini Kit (Qiagen, Valencia, CA, USA) following the manufacturer’s instructions. All samples were treated with DNaseI (Qiagen, Valencia, CA, USA) to remove genomic DNA and quantification was determined using a Nanodrop ND-1000 (Nanodrop Technologies, Rockland, DE, USA). The quality of extracted RNA was evaluated using the Agilent 2100 Bioanalyzer (Agilent Technologies, Santa Clara, CA, USA) with an average RNA integrity number = 8.3 (minimum RIN = 7.4). Complementary DNA was synthesized using 100 ng RNA, 1 μg dT18, 1 μL 10 mmol/L dNTP mix (Invitrogen, Corp., Carlsbad, CA, USA), 1 μL random primers (Invitrogen, Corp., Carlsbad, CA, USA), and 10 μL DNase/RNase free water. The mixture was incubated at 65°C for 5 min and kept on ice for 3 min. A total of 6 μL of master mix composed of 5.5 μL 5X Reaction Buffer, 0.25 μL (50 U) of RevertAidTM Reverse Transcriptase (Fermentas, Inc., Hanover, MD, USA), and 0.25 μL of RNase Inhibitor (10 U, Promega, Fitchburg, WI, USA) was added. The reaction was performed in an Eppendorf Mastercycler® Gradient using the following temperature program: 25°C for 5 min, 42°C for 120 min, and 70°C for 15 min.
Bacterial Quantitative PCR
Primers utilized for bacterial qPCR are listed in Supplementary Table S3 and were validated using gel electrophoresis and Sanger sequencing. Each 10 μL reaction consisted of 4 μL sample DNA, 5 μL 1× SYBR Green with ROX (Quanta BioSciences, Gaithersburg, MD, USA), 0.4 μL each of 10 μM forward and reverse primers, and 0.2 μL DNase/RNase free water in a MicroAmpTM Optical 384-Well Reaction Plate (Applied Biosystems, Foster City, CA, USA). All reactions were performed using an ABI Prism 7900 HT (Applied Biosystems, Foster City, CA, USA) using the following conditions: 5 min at 95°C, 40 cycles of 1 s at 95°C and 30 s at 60°C except an annealing temperature of 56°C used for eubacterial primer 3. The presence of a single PCR product was verified with an additional dissociation stage. All reactions were run in triplicate. Relative abundance of bacterial species was calculated using the geometric mean of two universal primers (Maeda et al., 2003; Fliegerova et al., 2014) with the efficiency-corrected Δ-CT method (Ramirez-Farias et al., 2009). A portion of the 16S gene corresponding to the target of the eubacterial primer 3 (Muyzer et al., 1993) was commercially synthesized (IDT, Coralville, IA, USA). A standard curve from 9.5 × 10⁷ to 3.0 × 10⁴ molecules per μL was used to obtain the 16S copy number from each sample. Samples were diluted to 1 ng/μL for suitable qPCR performance.
Library Construction and 16S rRNA Gene Sequencing
Amplification of the V4 region of the 16S rRNA gene used modified F515/R806 primers as described by Caporaso et al. (2012). The reverse PCR primer was indexed with 12-base Golay barcodes to facilitate multiplexing of samples. The PCR and sequencing protocol has been previously described in detail (Derakhshani et al., 2016). The 150 bp paired-end sequencing reaction was performed on a MiSeq platform (Illumina, San Diego, CA, USA) at the Gut Microbiome and Large Animal Biosecurity Laboratories, Department of Animal Science, University of Manitoba, Canada. The sequencing data were deposited into the Sequence Read Archive (SRA) of NCBI1 and can be accessed via accession number SRR3271885.
16S Read Analysis
Overlapping paired-end Illumina fastq files were merged using the PANDAseq assembler (Masella et al., 2012). All the sequences with low quality base calling scores as well as those containing uncalled bases (N) in the overlapping region were discarded. The subsequent fastq file was processed using the QIIME pipeline v1.8 (Caporaso et al., 2010b). Assembled reads were demultiplexed according to the barcode sequences, chimeric reads were filtered using UCHIME (Edgar et al., 2011), and reads were clustered into OTU (operational taxonomic units) de novo based on 97% similarity with UCLUST (Edgar, 2010). Representative sequences from each OTU were assigned a taxonomy using RDP Classifier (Wang et al., 2007) and aligned to the Greengenes reference database (McDonald et al., 2012) using PyNAST (Caporaso et al., 2010a).
After sample size standardization to the smallest library size (23,000 sequences/sample), OTU richness, and alpha- and beta-diversity metrics were estimated. Alpha rarefaction curves were generated with ten sampling iterations using the Chao1 index (Chao, 1984). Between sample comparisons of diversity (beta-diversity) were calculated using the Bray–Curtis metric (Beals, 1984). Bray–Curtis distance matrices were utilized in principal coordinate analysis (PCoA) to generate two-dimensional plots in PRIMER v6 software (Clarke and Gorley, 2006). Permutational multivariate analysis of variance (PERMANOVA) was implemented to test differences in beta-diversity among SG and time.
Functional metagenomic predictions were made using the bioinformatics tool PICRUSt (Langille et al., 2013). Quality-filtered, paired-end reads were used for closed-reference OTU picking in QIIME. The resulting OTU table was used in PICRUSt version 1.0.0 and functional predictions were made to the KEGG Ontology Pathways (Kanehisa and Goto, 2000). Within PICRUSt, the 16S copy number was normalized, molecular functions were predicted, and all results were summarized into KEGG pathways.
Rumen Epithelium Quantitative Reverse Transcription-PCR
Primers utilized for rumen epithelium quantitative reverse transcription-PCR (qRT-PCR) are listed in Supplementary Table S4. The primer for IGFBP5 was designed using Primer3 (Untergasser et al., 2012) and verified using gel electrophoresis and sequencing. The reaction components, real-time machine, and conditions were the same as described for bacterial qPCR. The presence of a single PCR product was verified with an additional dissociation stage. All reactions were run in triplicate. A six point relative standard curve was used to determine gene expression. Relative quantities were normalized using the geometric mean of genes CMTM6, MRPL39, and ERC1 (Naeem et al., 2012; Minuti et al., 2015).
Statistical Analysis
Partial least square discriminant analysis (PLS-DA) was performed on genus level assignments to identify the effect of SG and day using SIMCA P+ 13.0 (Umetrics, Umea, Sweden). In the analysis, the X variables were bacterial genera, Y variables were either SG or day comparisons, and the data were scaled using Unit Variance. Permutation was conducted to validate the models and genera with variable influence projection values below 0.5 were removed from the final model (Li et al., 2012). The R2 and Q2 estimates were used to evaluate goodness of fit and the predictive value of the model, respectively. The PLS regression coefficients were used to identify genera significantly correlated with Y variables and used to label loading scatter plots.
Relative abundance of bacteria present at >0.1% at the phyla, family, and genus taxonomic level were evaluated and logit transformed (z = log[p/(1-p)]) if necessary to ensure normal distribution of the residuals, where p represents the relative abundance of a bacterial taxa. Bacterial relative abundance and normalized epithelial gene expression data were analyzed using the MIXED procedure of SAS 9.3 (SAS Inst. Inc., Cary, NC, USA). Terms in the model included SG, day, SG × day, and period with cow nested within square as a random effect. SARA grouping means were calculated using the LSMEANS option. Additionally, bacterial relative abundance change from day 6 to day 1 was correlated with measures of pH previously reported by Luan et al. (2015) using Pearson correlations within the CORR procedure of SAS and visualized in custom heat maps. Time < 5.8 was used for correlation analysis as pH data < 5.6 in Non-SARA cows was zero-inflated. Significance was declared at P < 0.05 while tendencies are discussed at P < 0.10.
All predicted KEGG pathways by PICRUSt were subjected to a Welch’s t-test in STAMP 2.1.3 (Parks et al., 2014) using a Storey false discovery rate (FDR) correction (Storey and Tibshirani, 2003). After correcting for multiple tests, 63 pathways were different (P < 0.05) between Non-SARA and SARA cows on day 6. These pathways were then analyzed in SAS 9.4 using the MIXED procedure with the aforementioned model. All pathways with a SG × day interaction (P < 0.05) are shown in the results and supplement.
Results
A total of 1,677,722 reads were generated after quality control and chimera removal resulting in an average of about 35,000 reads per sample. Sequencing depth was not affected (P > 0.1) by any main effect and ranged from 23,621 to 110,941. After clustering reads at 97% similarity, an average of 2,094 OTUs were obtained for each sample. At the family and genus taxonomic levels, 81.1 and 54.9% of reads were identified within the Greengenes database, respectively. Within the liquid fraction, a SG × day interaction (P = 0.03) was observed for the Chao1 index as community richness was higher for SARA cows on day 1 and decreased to similar levels to Non-SARA cows on day 6 (Table 1). The Shannon and Simpson’s indices indicated that overall alpha-diversity decreased (P ≤ 0.07) on day 6 in the liquid fraction. At the community level, effects of SARA induction on the microbiome were not as strongly evidenced in the solid fraction with no change in richness (Chao1) and Simpson’s index. A SG × day interaction (P = 0.06) was observed for the Shannon index as alpha-diversity decreased on day 6 for Non-SARA cows but increased for SARA cows.
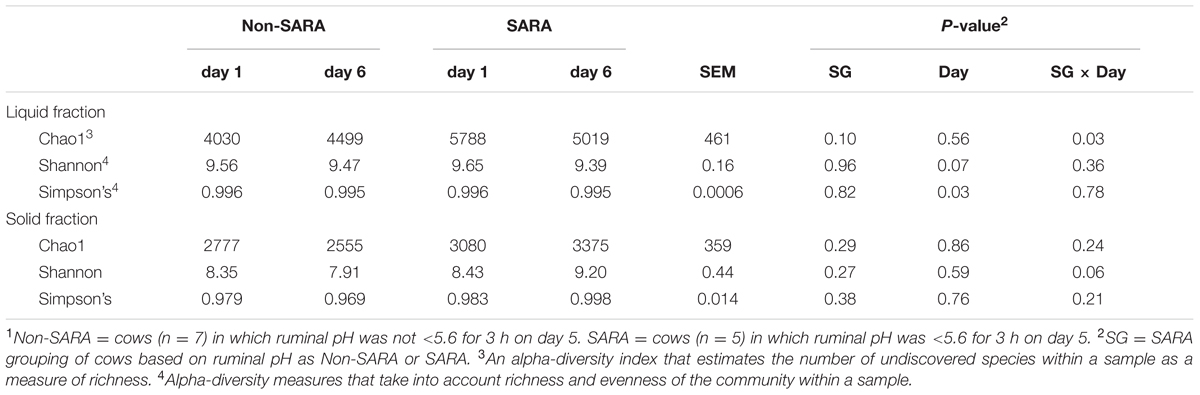
TABLE 1. Effect of SARA induction on alpha-diversity in the liquid and solid fraction of the ruminal microbiome.1
Beta-diversity, measured by Bray–Curtis similarity, was visualized in principal coordinates and separated liquid fraction samples by collection day (Figure 1A; P = 0.003). Spearman correlations greater than 0.85 indicated unclassified sequences within Clostridiales and Prevotella were associated with the separation between days 1 and 6, respectively (data not shown). Liquid fraction samples did not cluster by SG (P = 0.60) and solid fraction samples did not cluster by SG or day using Bray–Curtis similarity (P ≥ 0.19; Figure 1B).
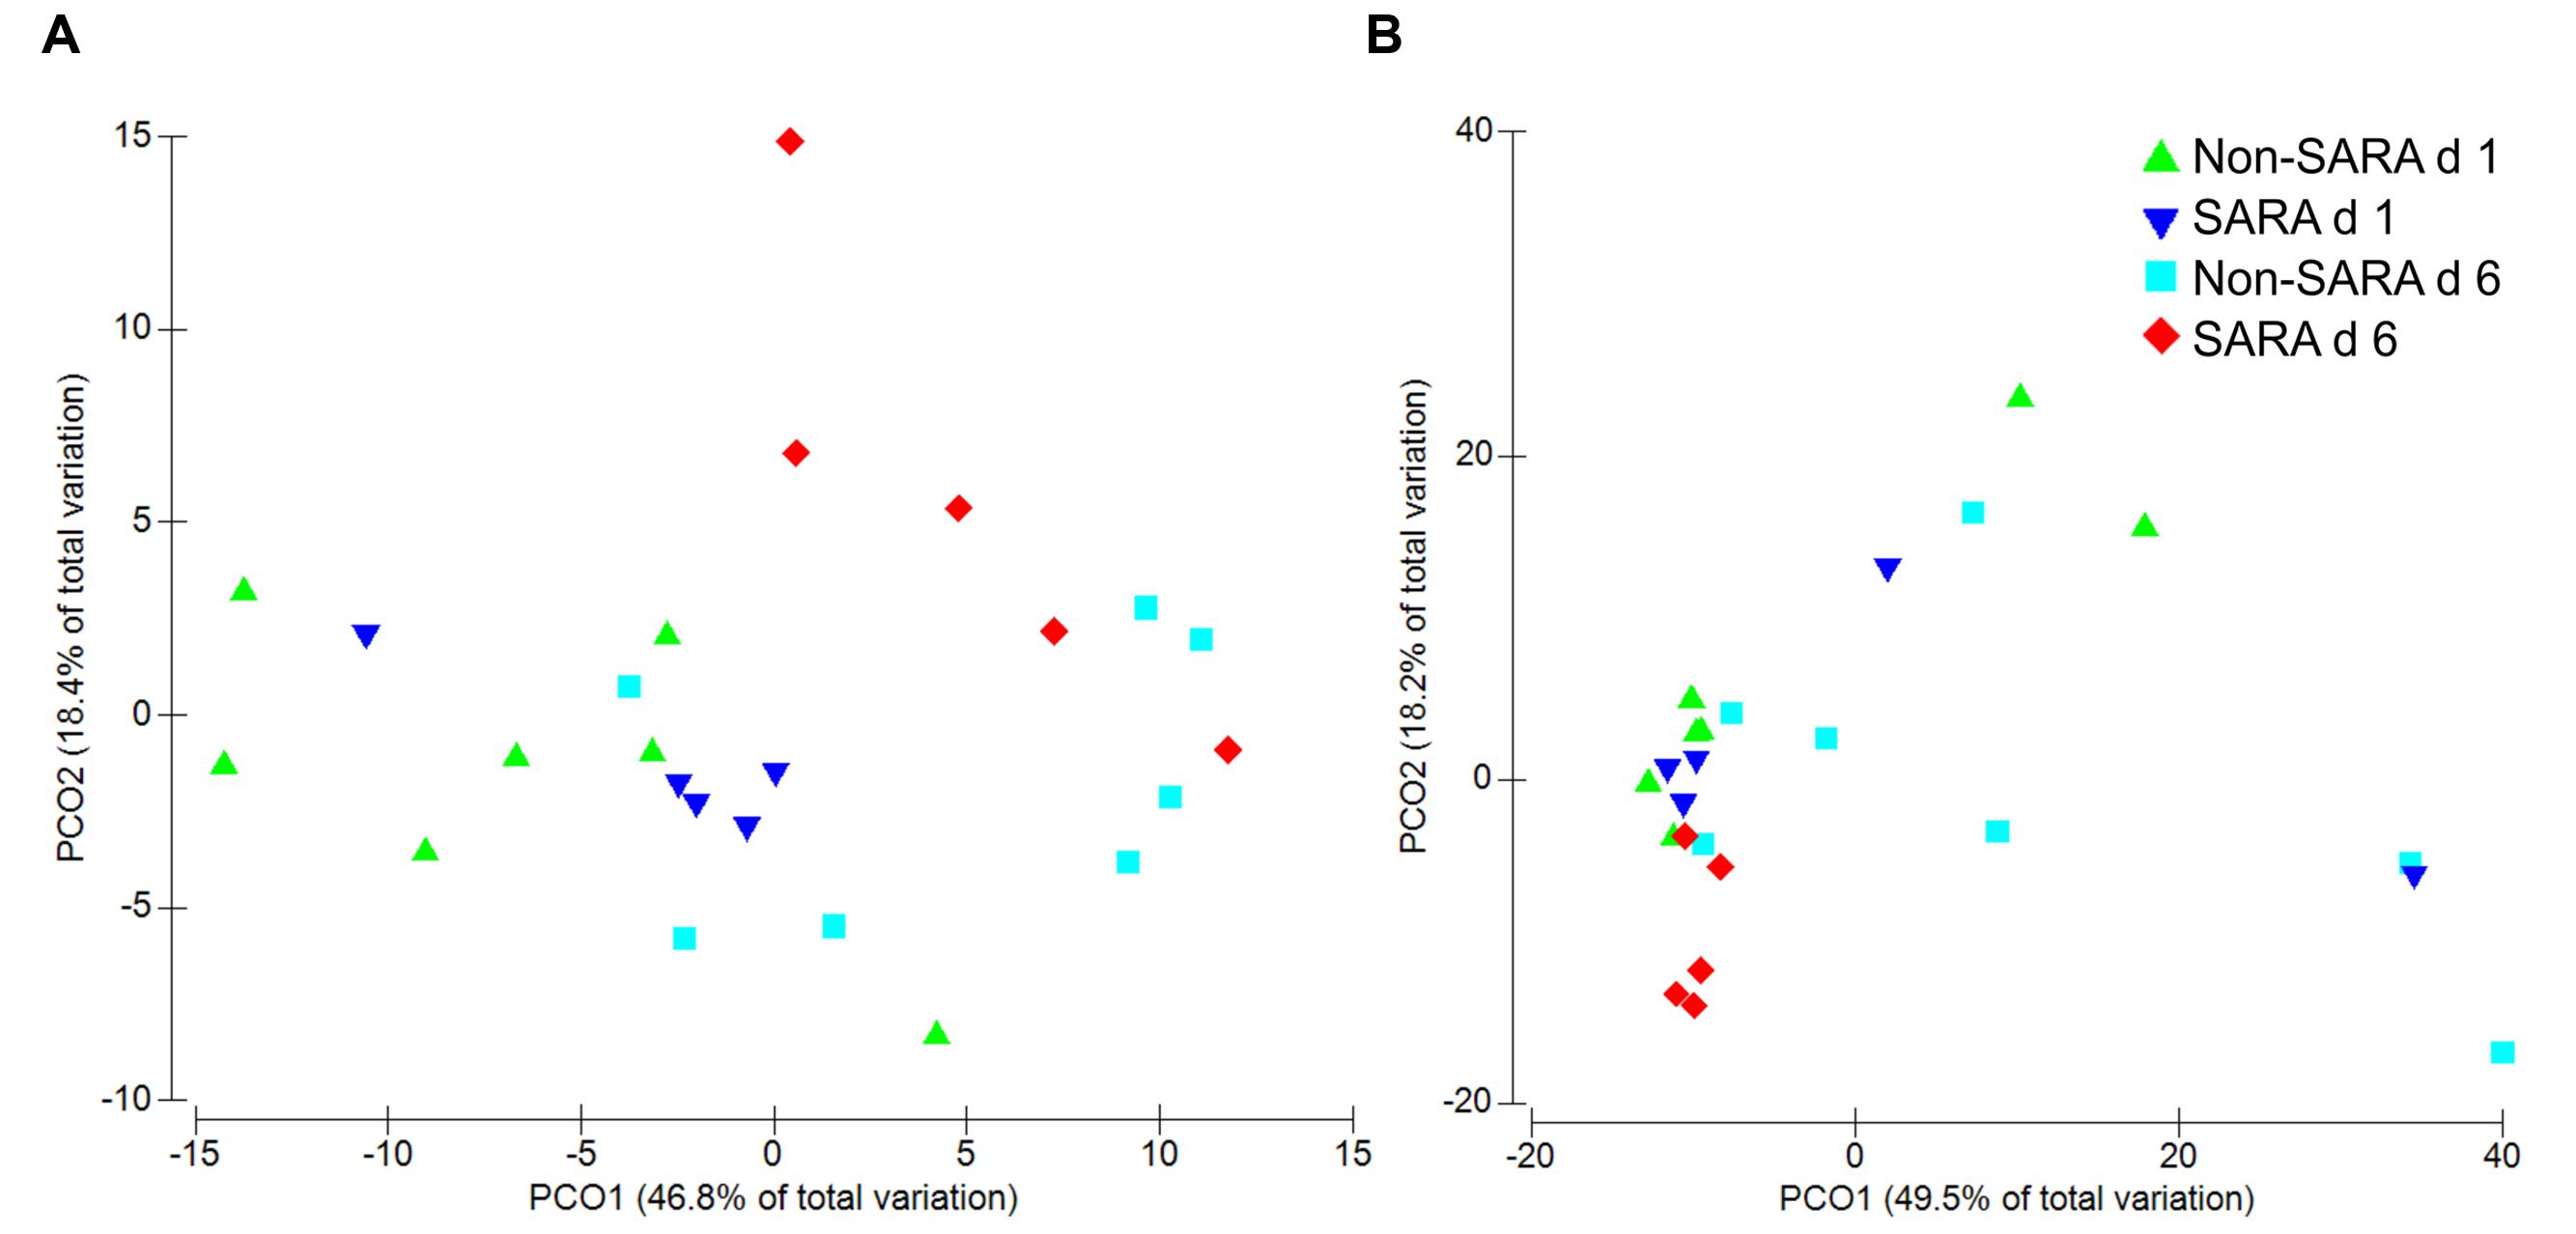
FIGURE 1. Principal coordinate analysis (PCoA) of beta-diversity in the liquid (A) and solid fraction (B) using Bray–Curtis similarity. Analysis by PERMANOVA revealed a day effect (P = 0.003), but no effect of SARA grouping (SG; P = 0.60) and SG × day (P = 0.18) was observed in the liquid fraction. In the solid fraction, PERMANOVA analysis indicated no effect of day (P = 0.19), SG (P = 0.83), or SG × day (P = 0.43).
Solid Fraction qPCR
The relative abundance of targeted bacteria species is presented in Table 2. A SG × day interaction (P < 0.04) was observed for Anaerovibrio lipolytica, Prevotella bryantii, and Succinimonas amylolytica. These bacteria increased on day 6 in SARA cows while no change or a decrease was observed on day 6 in Non-SARA cows regardless of day. The increase in relative abundance for S. amylolytica and P. bryantii was more than six- and four-fold, respectively. A SG effect (P = 0.01) was observed for Eubacterium ruminantium as it was greater in SARA cows. Streptococcus bovis, and Succinivibrio dextrinosolvens tended to be greater (P = 0.10) on day 6. The greatest value for each of these bacteria was observed on SARA day 6, but no SG effect or interaction (P > 0.16) was detected for S. bovis and S. dextrinosolvens. While there was no effect of SARA induction on relative abundance of Megasphaera elsdenii and Selenomonas ruminantium, Fibrobacter succinogenes tended to be greater (P = 0.08) on day 1.
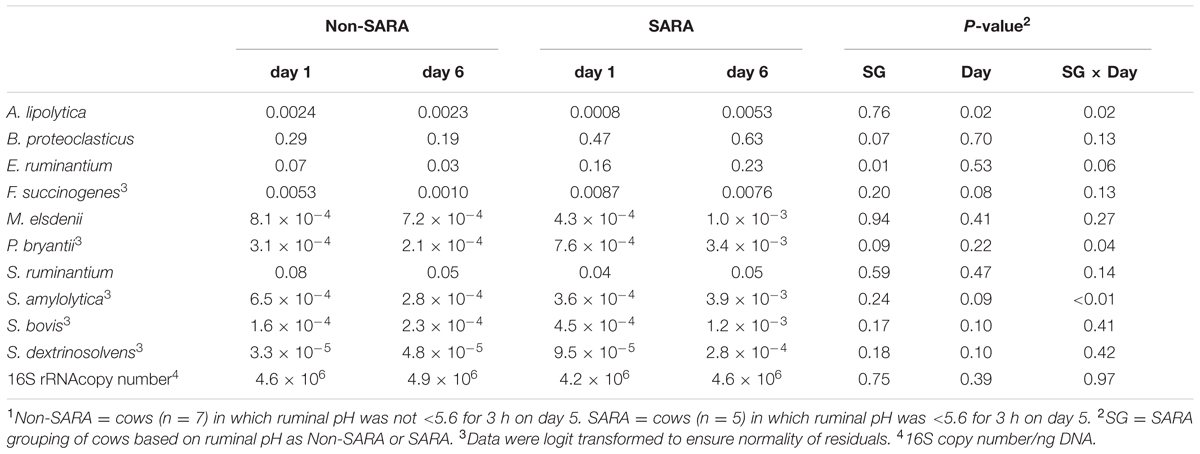
TABLE 2. Effect of SARA induction on relative abundances of bacterial genera in the solid fraction using qPCR.1
Solid Fraction Microbiome Effects
Firmicutes was the most abundant phyla in the solid fraction representing 80% of all sequences while Bacteroidetes relative abundance averaged 10% (Table 3). Both phyla had a SG × day interaction (P < 0.01) as Firmicutes on day 6 decreased for SARA and Bacteroidetes increased to 23%. The effects observed within the phylum Bacteroidetes were driven by the genus Prevotella which averaged 77% of the sequences in the phylum. Within Firmicutes, no effects were observed for the predominant families Lachnospiraceae, Ruminococcaceae, and order Clostridiales sequences not identified at the family level (Table 4). Lactobacillaceae increased on Non-SARA day 6 resulting in a SG × day interaction (P = 0.06). Genera Streptococcus and Succiniclasticum increased on day 6 (P = 0.03) but were not affected by SG (Table 5). A SG × day interaction (P ≤ 0.03) with a slight decrease on Non-SARA day 6 and a larger increase in relative abundance on SARA day 6 was observed for Clostridium, YRC22, Psuedobutyrivibrio, Anaerostipes, and Shuttleworthia.
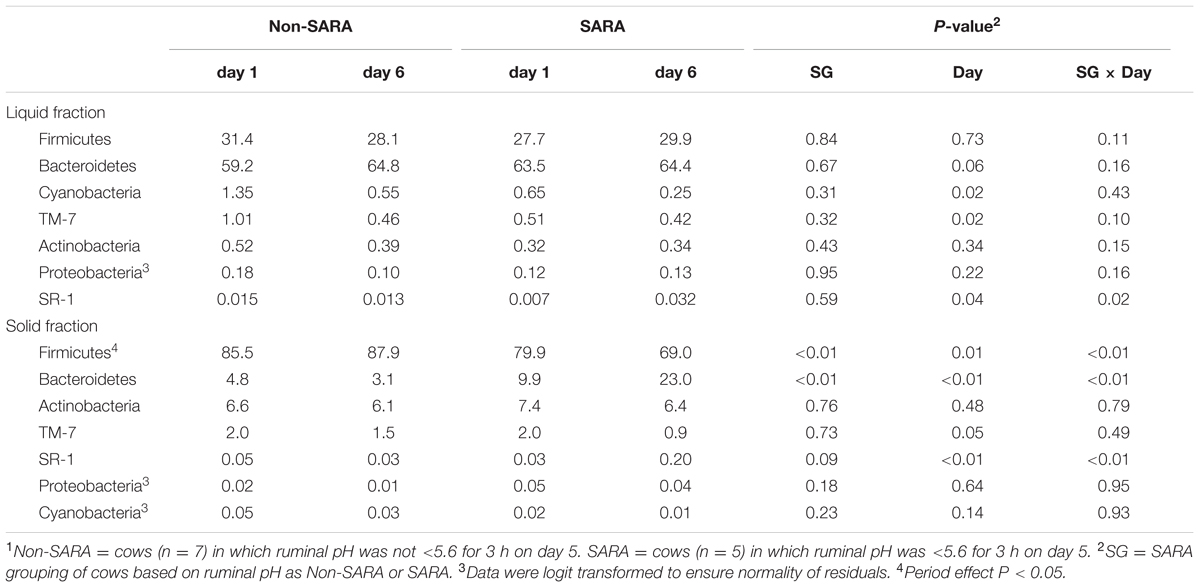
TABLE 3. Effect of SARA induction on relative abundances of bacterial phyla in the solid fraction using 16S rRNA sequencing.1
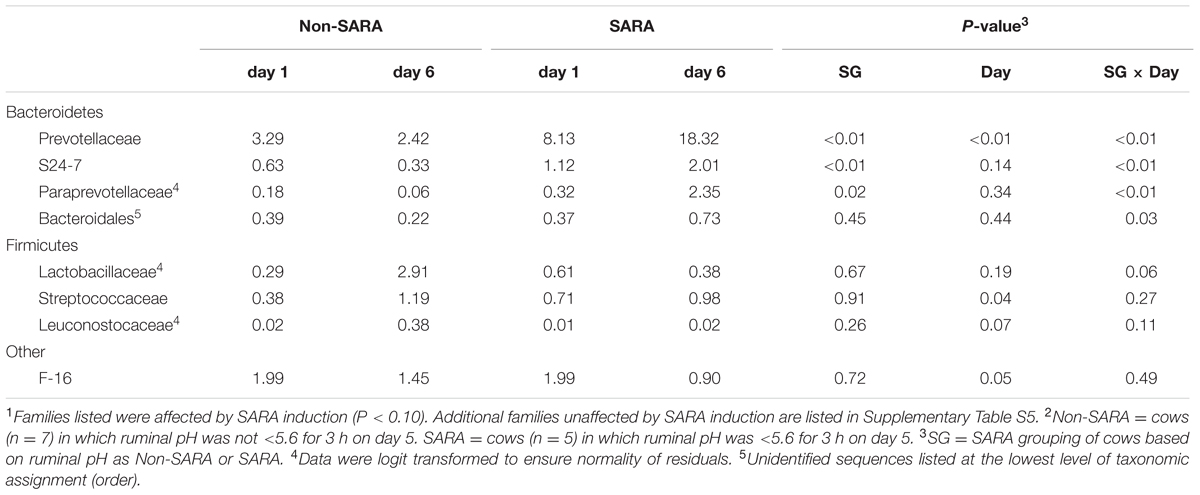
TABLE 4. Effect of SARA induction on relative abundances of bacterial families in the solid fraction using 16S rRNA sequencing.1,2
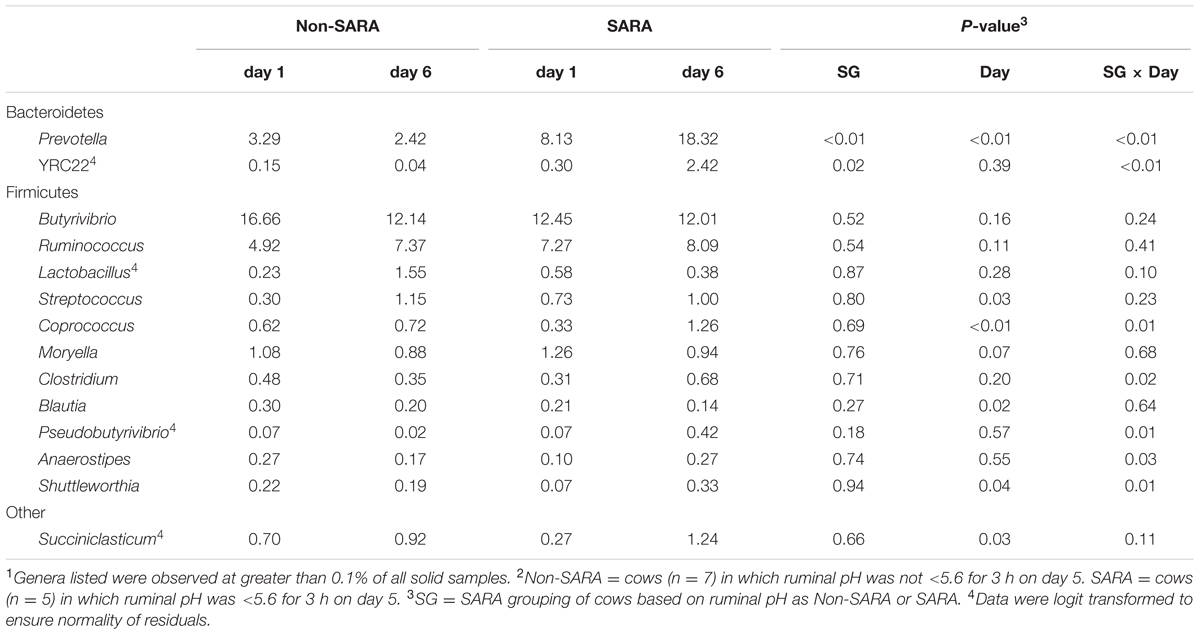
TABLE 5. Effect of SARA induction on relative abundances of bacterial genera in the solid fraction using 16S rRNA sequencing.1,2
The association heat map (Figure 2A) supports the 16S results and also indicates the change in bacterial relative abundance from day 1 to day 6 was proportional to the severity of the acidotic bout on day 5. The strongest observed relationships are positive correlations among bacteria that increased on day 6 and greater area under the curve (AUC) below a 5.8 pH. Of the measured pH parameters, AUC < 5.8 may be the most suitable indicator of SARA effects on the microbiome within our experimental pH range.
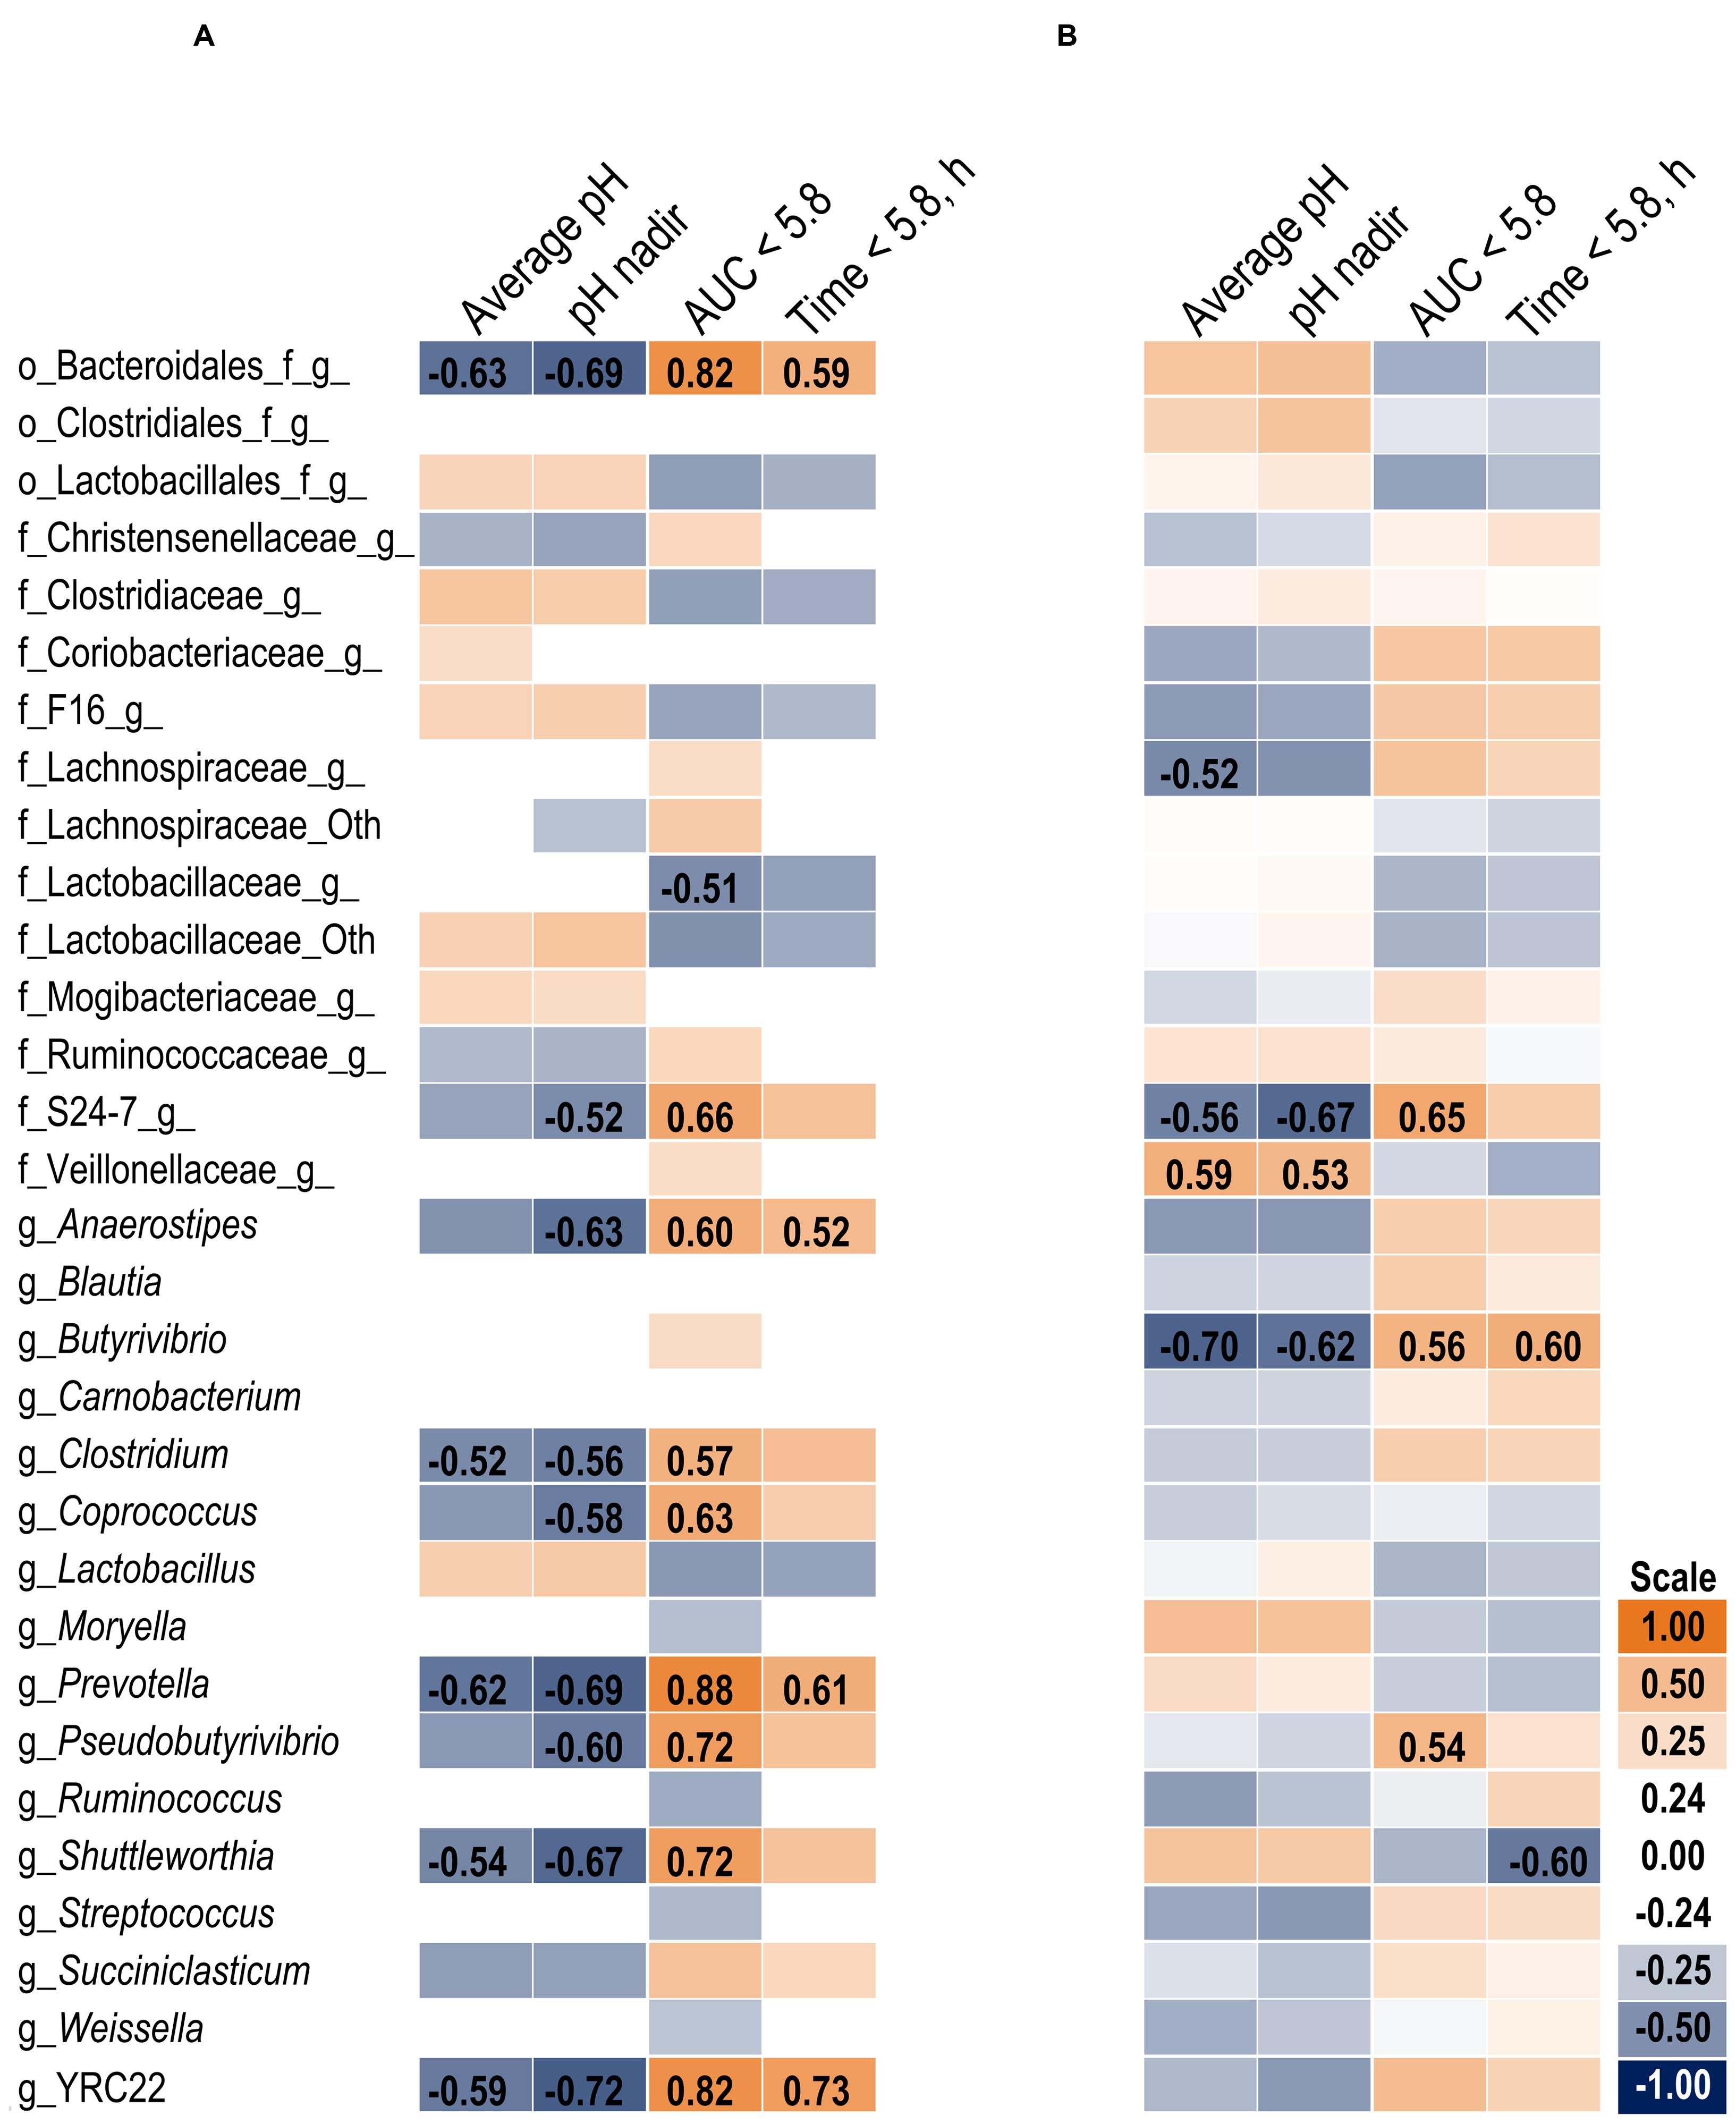
FIGURE 2. Association heat map between the change in bacterial relative abundance over time (day 6 – day 1) and ruminal pH response on day 5 in the solid (A) and liquid (B) fractions using Pearson correlations. All correlation coefficients greater than 0.5 or less than -0.5 are listed. The scale bar colors denote the correlation coefficients with 1 indicating a perfect positive correlation (orange) and -1 indicating a perfect negative correlation. Letter prefix denotes the lowest level of taxonomic identification [genus (g); family (f); and order (o)].
Liquid Fraction Microbiome Effects
At the phyla level (Table 3), Bacteroidetes, representing more than 60% of the sequences, tended to increase in relative abundance on day 6 (P = 0.06). Within Bacteroidetes, family S24-7 (Table 6) as well as genera Prevotella and YCR22 (Table 7) increased (P < 0.04) on day 6 on day 6, but unidentified sequences from order Bacteroidales decreased on day 6 (P < 0.01). While a SG × day interaction (P = 0.11) was not observed for Firmicutes, numerical trends indicated a slight decrease on day 6 for Non-SARA cows while SARA increased on day 6. This effect was realized at the family level in Lachnospiraceae (P = 0.01) and at the genus level in Butyrivibrio (P < 0.01). As expected, the relative abundance of Streptococcus and Lactobacillus increased on day 6 (P < 0.06). Collectively, in the liquid fraction many day effects (P < 0.05) were observed for bacterial families suggesting the impact of feed restriction and subsequent refeeding had a greater effect on microbiome composition than an acidotic bout. Correlations between the change in liquid fraction taxa and day 5 pH parameters are shown in Figure 2B. Relative to the solid fraction, fewer bacteria had strong correlations in the liquid fraction. Bacteria with greater correlations were also identified in the mixed model analysis with SG × day effects.
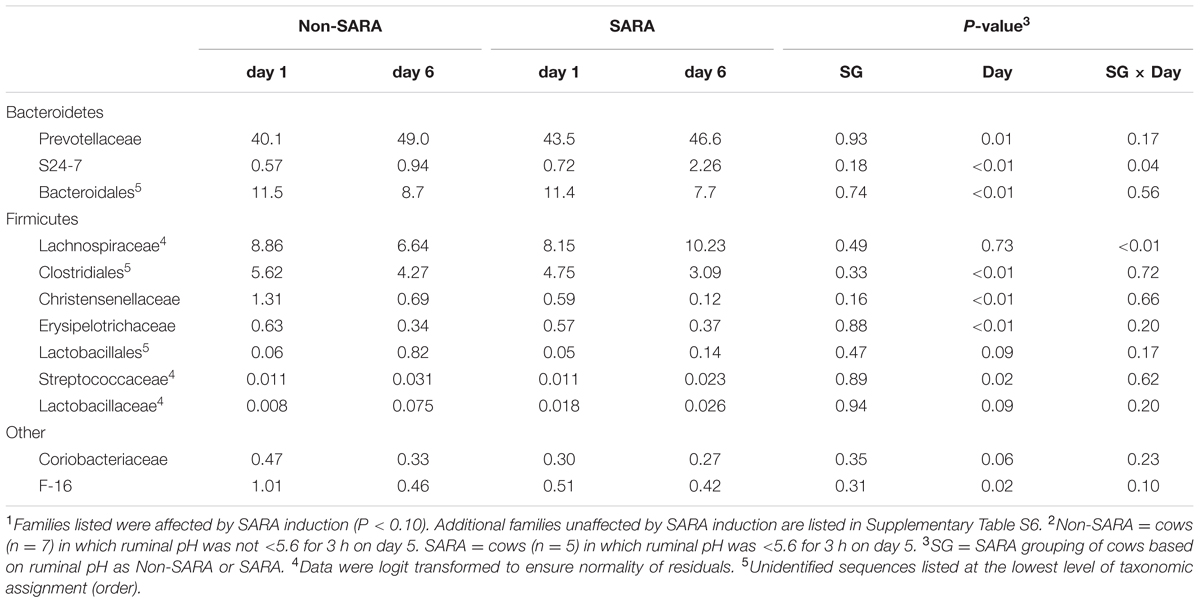
TABLE 6. Effect of SARA induction on relative abundances of bacterial families in the liquid fraction using 16S rRNA sequencing.1,2
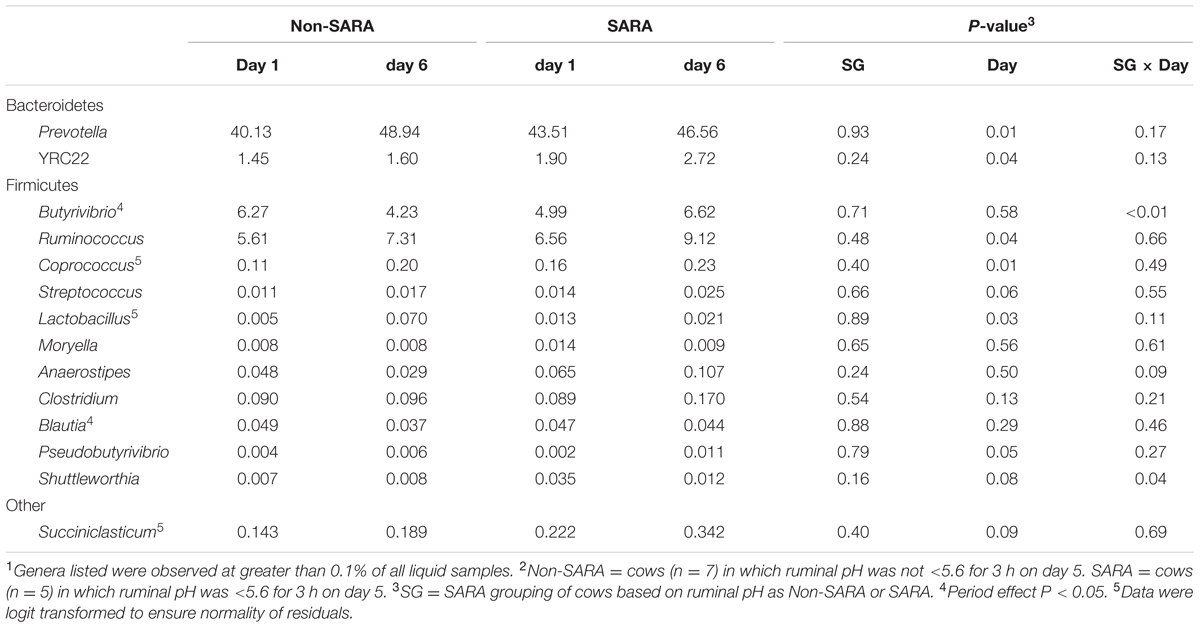
TABLE 7. Effect of SARA induction on relative abundances of bacterial genera in the liquid fraction using 16S rRNA sequencing.1,2
Multivariate Analysis
A PLS-DA was used to identify bacteria related to day and SG. Liquid fraction samples separated based on sampling day in the score plot as a three component model explained 97.1% (R2Y) and predicted 66.2% (Q2Y) of the data (Figure 3A). A loading score scatter plot was used to visualize specific groups of bacteria with significant coefficients in the model (Figure 3B). Eight bacteria had coefficients significantly different from zero that were responsible for day differences in the model; genera Bulleida, BF311, p-75-a5, and order Bacteroidales were enriched on day 1 while Clostridium, Lactobacillus, Pediococcus, and order Lactobacillales were increased on day 6. No model could be validated for an effect of SG within the liquid fraction.
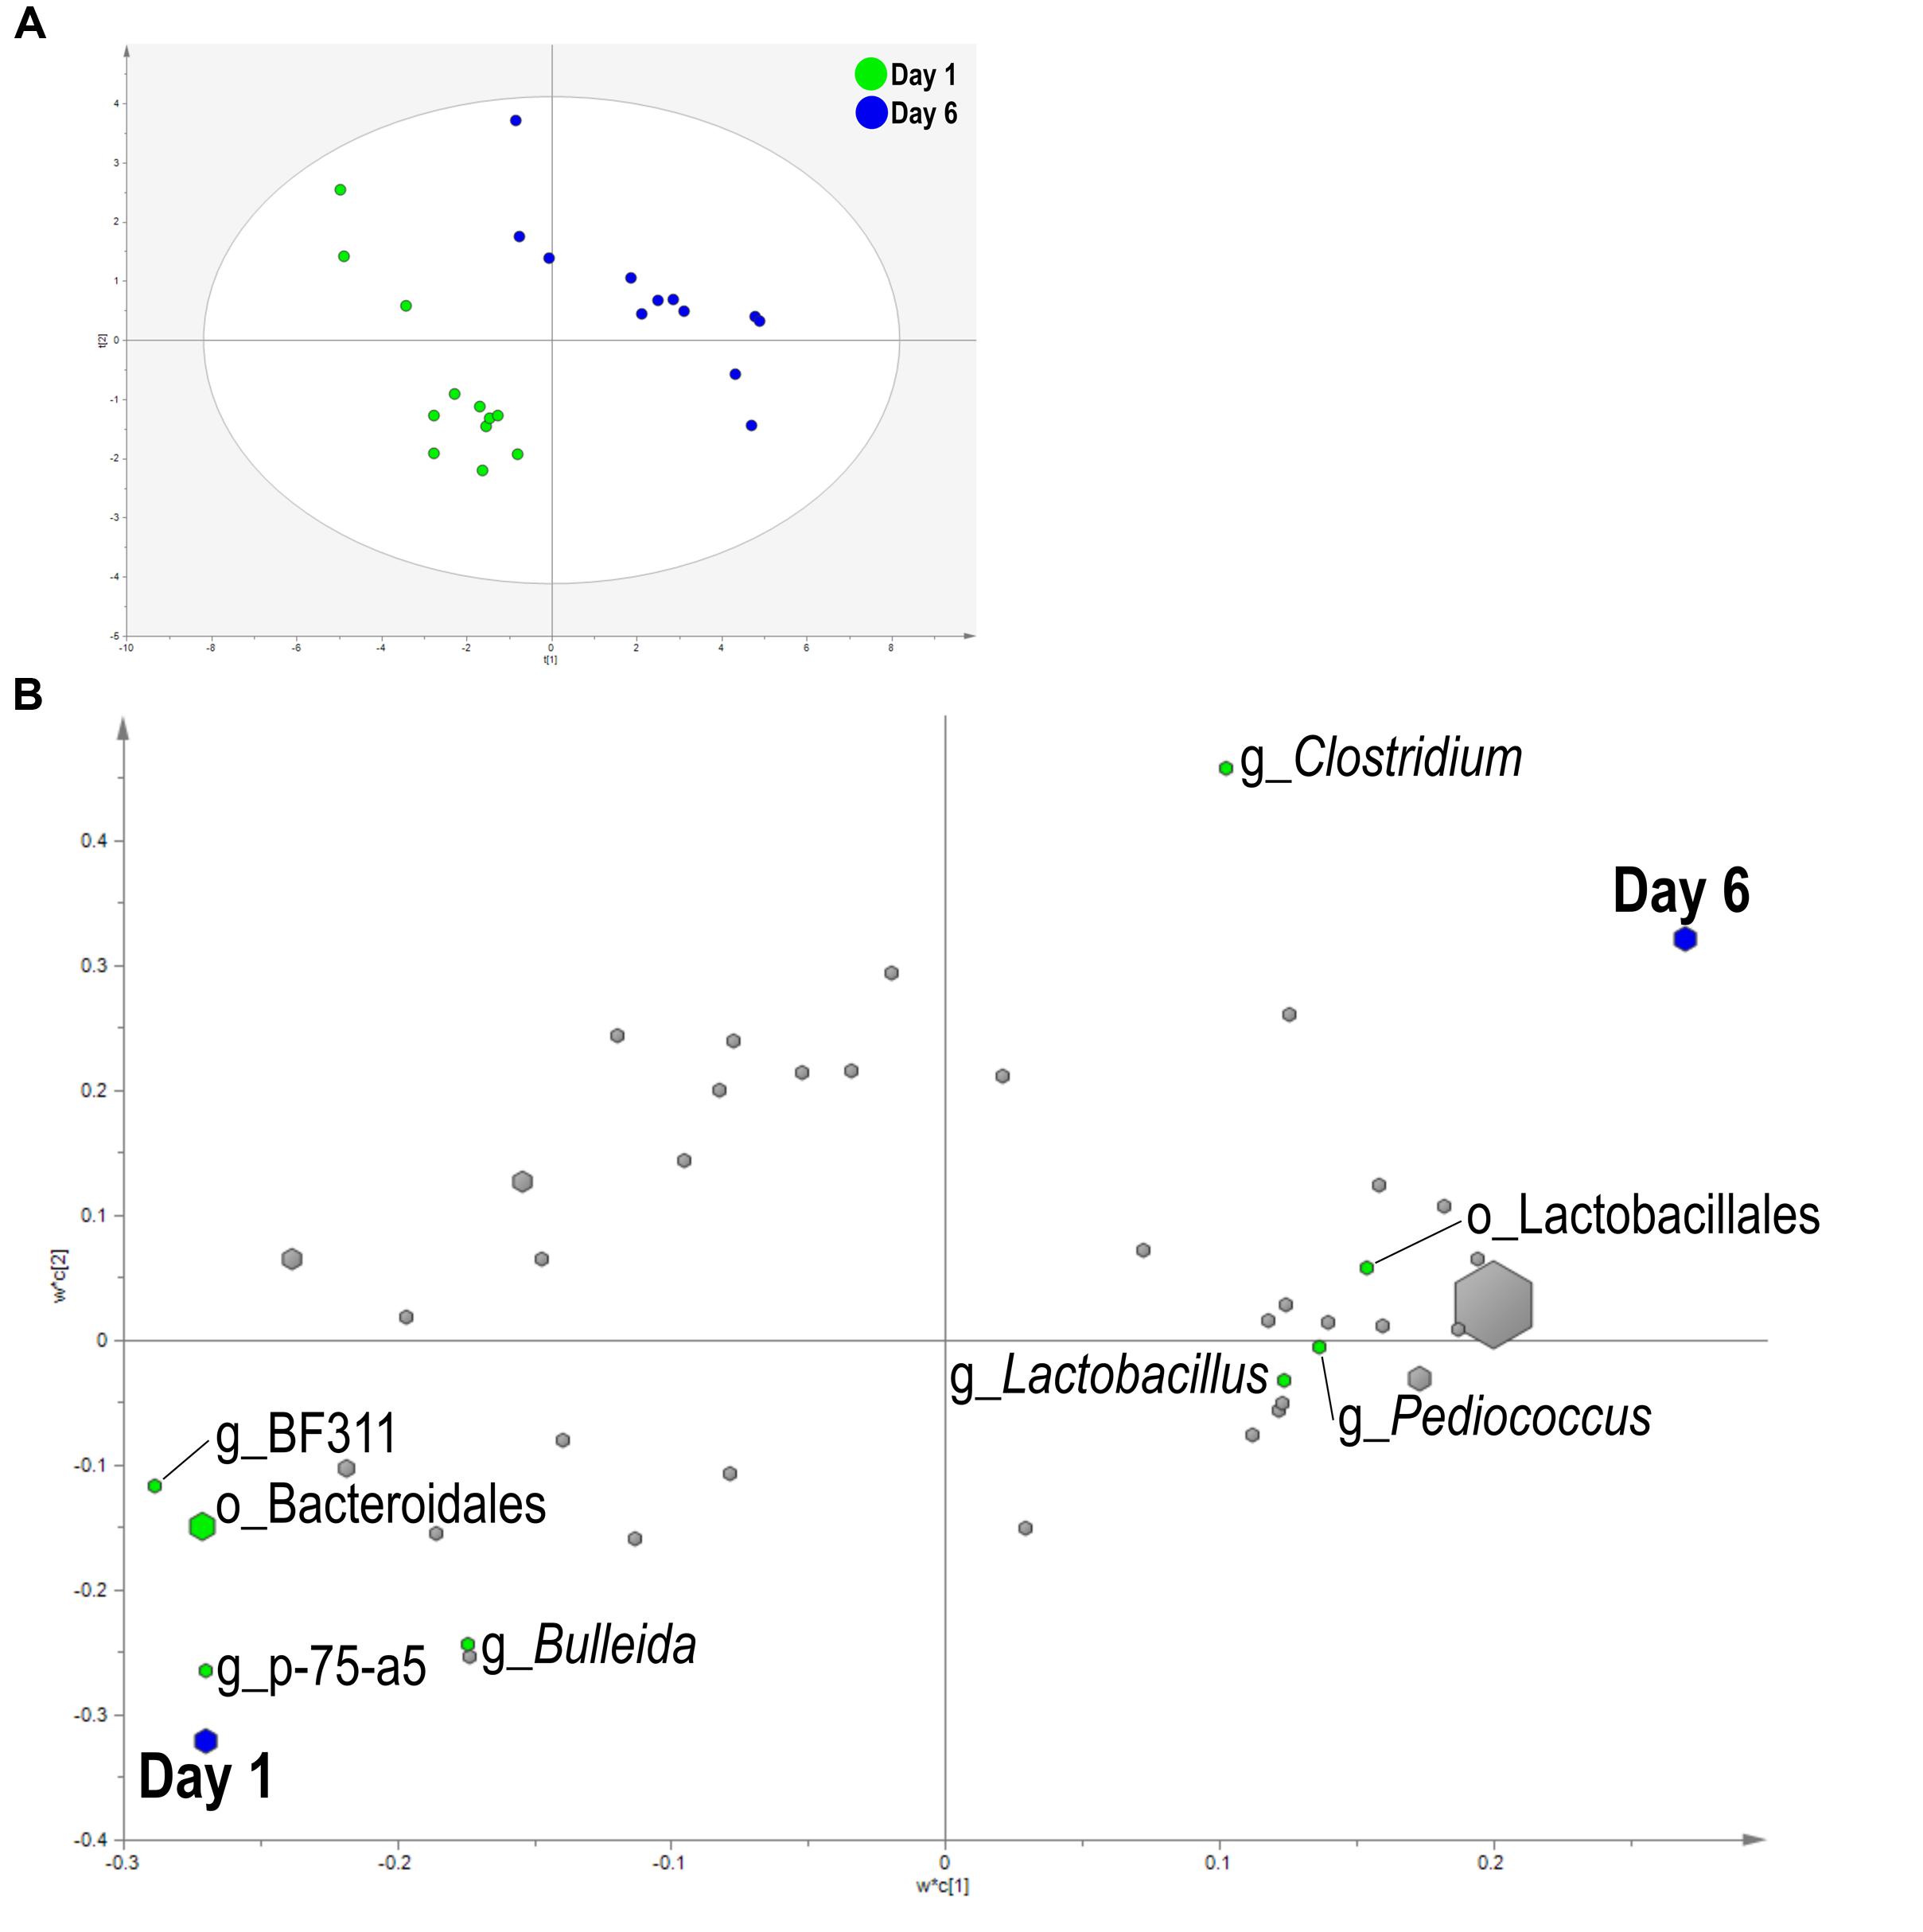
FIGURE 3. Partial least squares discriminant analysis (PLS-DA) model of the liquid fraction bacterial communities with three components. (A) PLS-DA score scatter plot discriminating between day 1 and day 6 in the liquid fraction [goodness-of-fit parameter (R2) (Y) = 0.97; predictive ability parameter (Q2) (cum) = 0.66] with each point representing a single sample. (B) PLS-DA loading scatter plot of bacteria classified to the lowest taxonomic level. Taxa with significant coefficient values (relationship between X and Y variables) are labeled. The size of each point corresponds to the average relative abundance of the taxa. Letter prefix denotes the lowest level of taxonomic identification [genus (g) and order (o)].
Within the solid fraction, a three component the model separated the samples based on SG (Figure 4A). The model explained 93.9% (R2Y) and predicted 62% (Q2Y) of the data. The loading score scatter plots revealed five bacteria with significant coefficients related to SARA including Prevotella, p-75-a5, Lachnospira, family S24-7, and phylum SR1 (Figure 4B). Three taxa were associated with Non-SARA including genus Anaerovorax, family BS11, and unidentified sequences from the order Clostridiales.
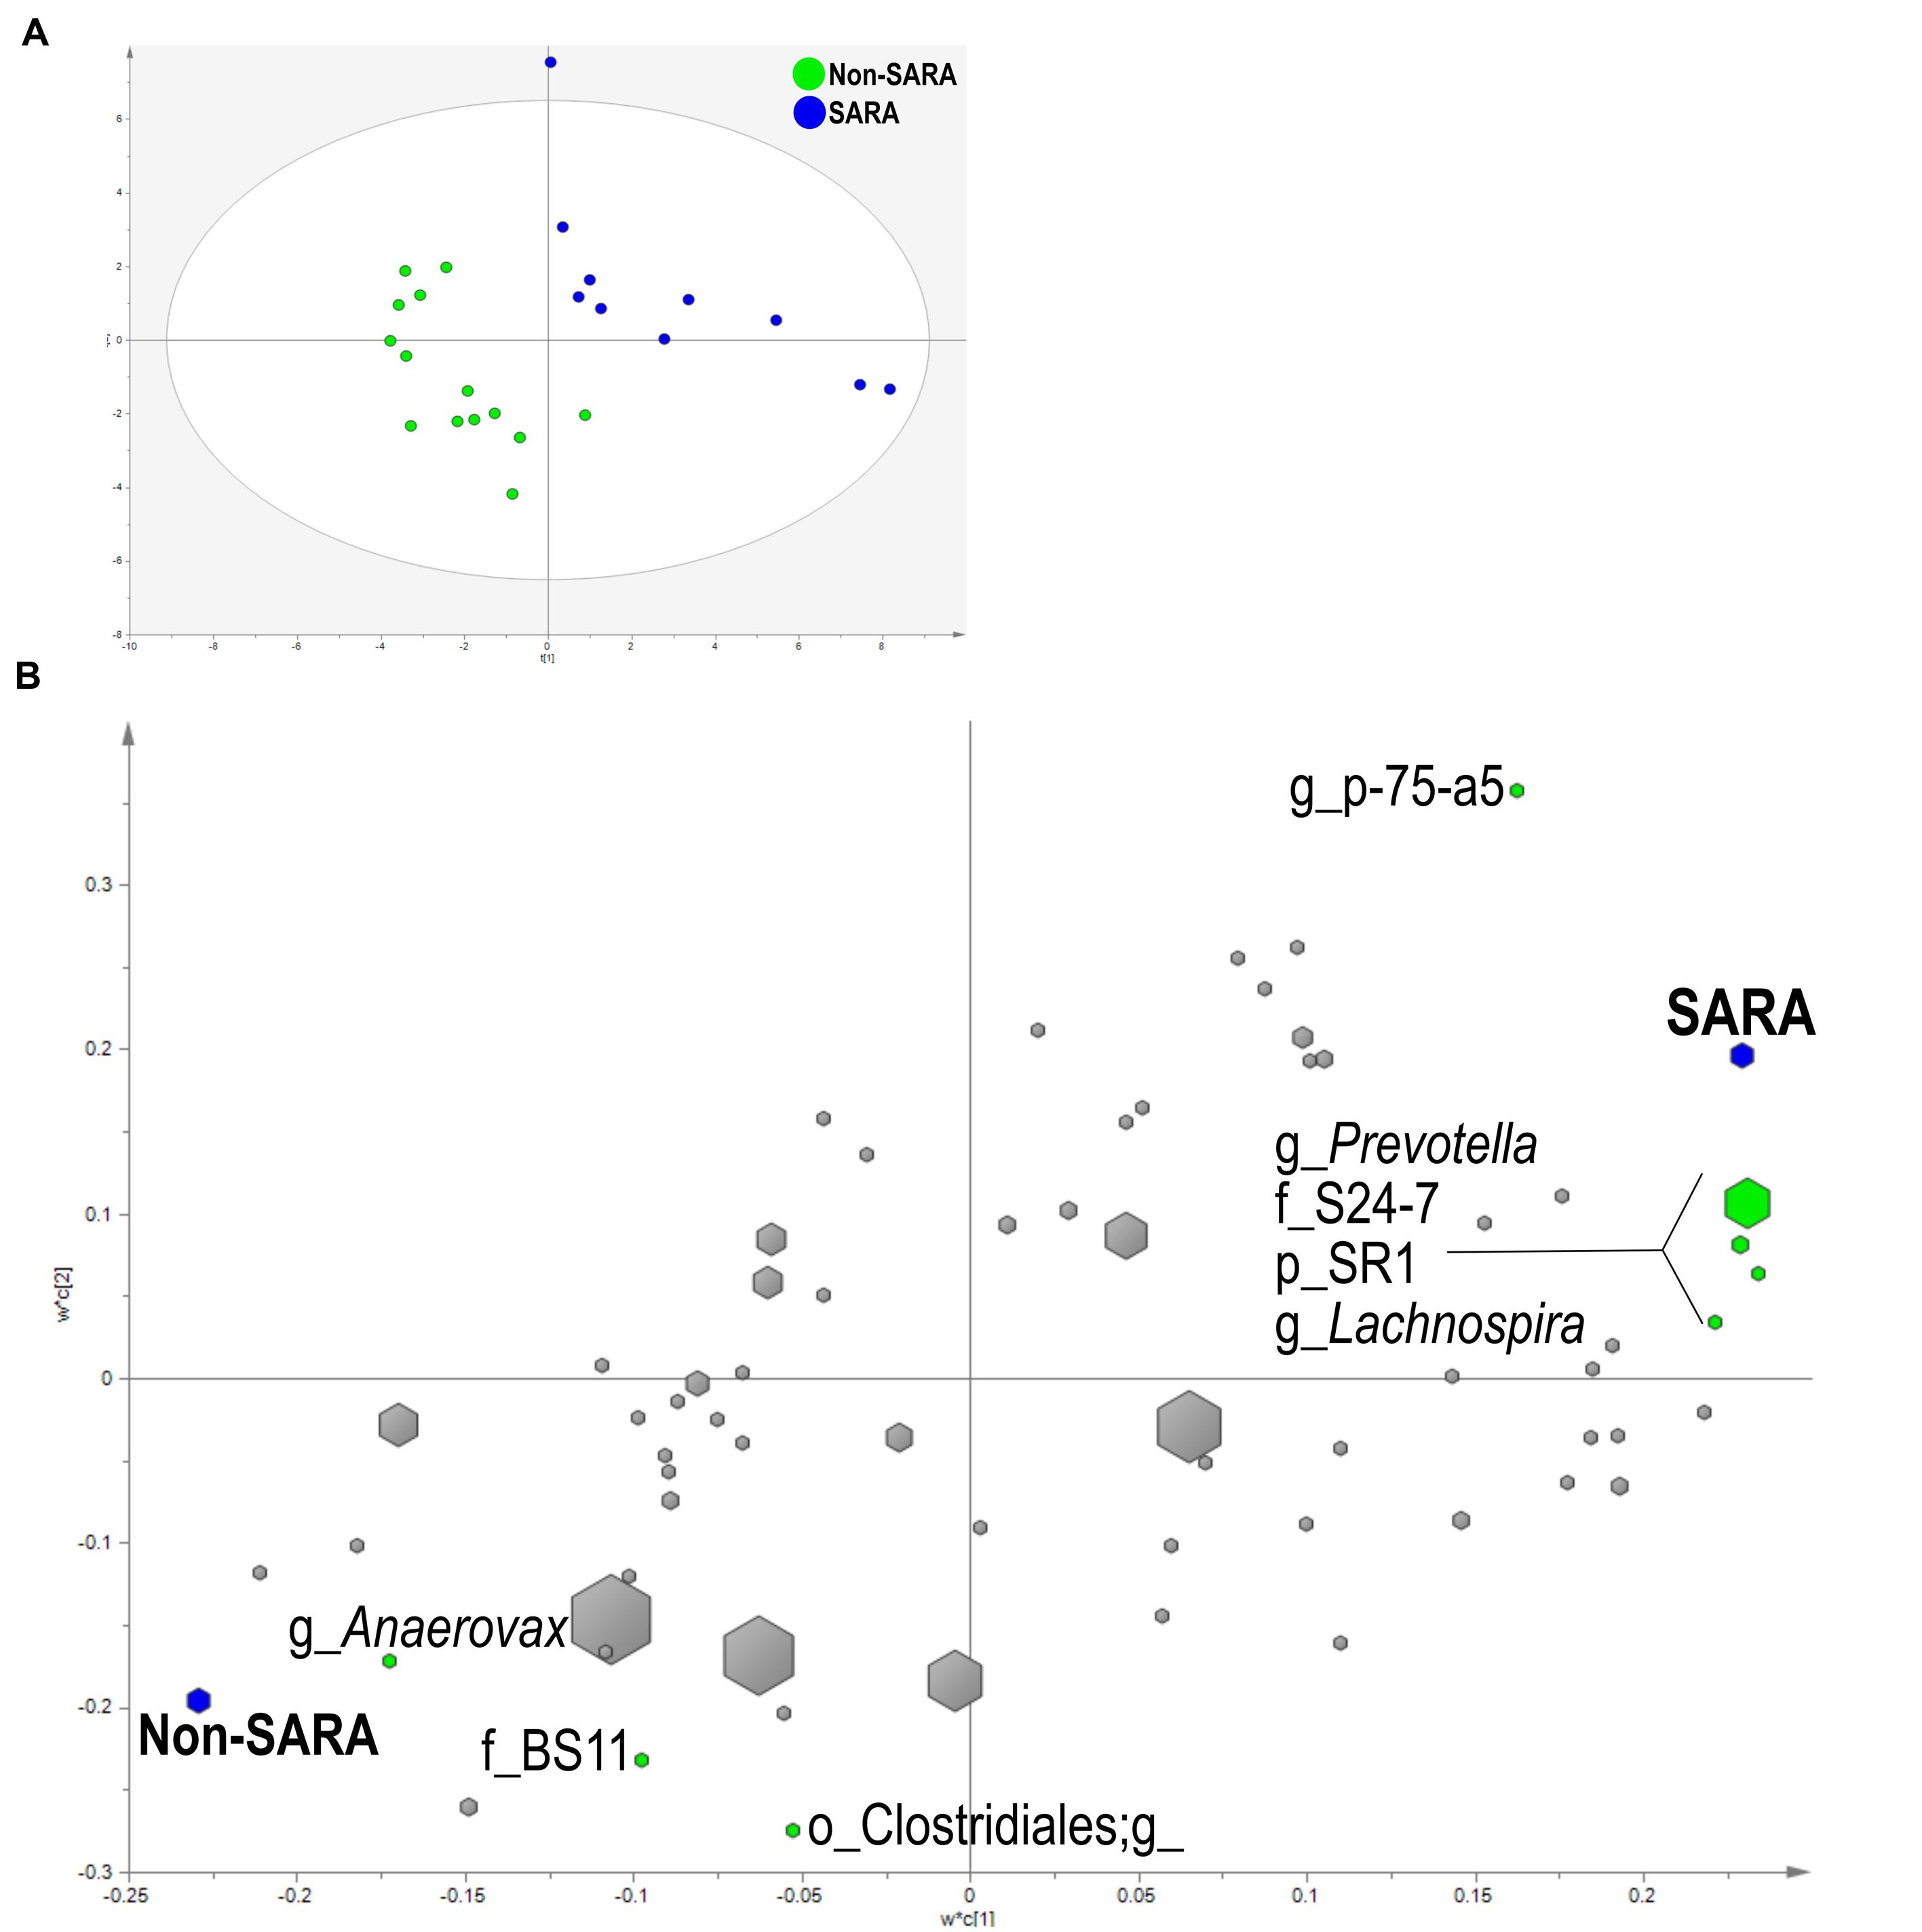
FIGURE 4. Partial least squares discriminant analysis model of the solid fraction bacterial communities with three components. (A) PLS-DA score scatter plot discriminating between Non-SARA and SARA cows in the solid fraction [goodness-of-fit parameter (R2) (Y) = 0.94; predictive ability parameter (Q2) (cum) = 0.62] with each point representing a single sample. (B) PLS-DA loading scatter plot of bacteria classified to the lowest taxonomic level. Taxa with significant coefficient values (relationship between X and Y variables) are labeled. The size of each point corresponds to the average relative abundance of the taxa. Letter prefix denotes the lowest level of taxonomic identification [genus (g); family (f); order (o); and phylum (p)].
Predicted Metagenome
The functional capability of the ruminal microbiome was predicted using PICRUSt to connect community composition changes in the functional profile. In the solid fraction, there were 43 affected level 3 KEGG pathways with a SG × day interaction (P < 0.05). The relative abundance of genes associated with the energy metabolism, oxidative phosphorylation, starch and sucrose metabolism, and sphingolipid metabolism KEGG pathways increased on day 6 for SARA compared to Non-SARA (Figure 5A). Pathways for bacterial invasion of epithelial cells, lipopolysaccharide (LPS) biosynthesis and proteins were also increased in SARA on d6 (Figure 5B). Conversely, bacterial pathways for glycolysis/gluconeogenesis, pyruvate metabolism, propanoate metabolism, and fatty acid biosynthesis were enriched on day 6 for Non-SARA cows compared to SARA. Additional significant affected pathways are listed in Supplementary Figure S1. Analysis of liquid fraction samples did not elucidate any differences with the predicted metagenome with no difference between SG on either day (data not shown).
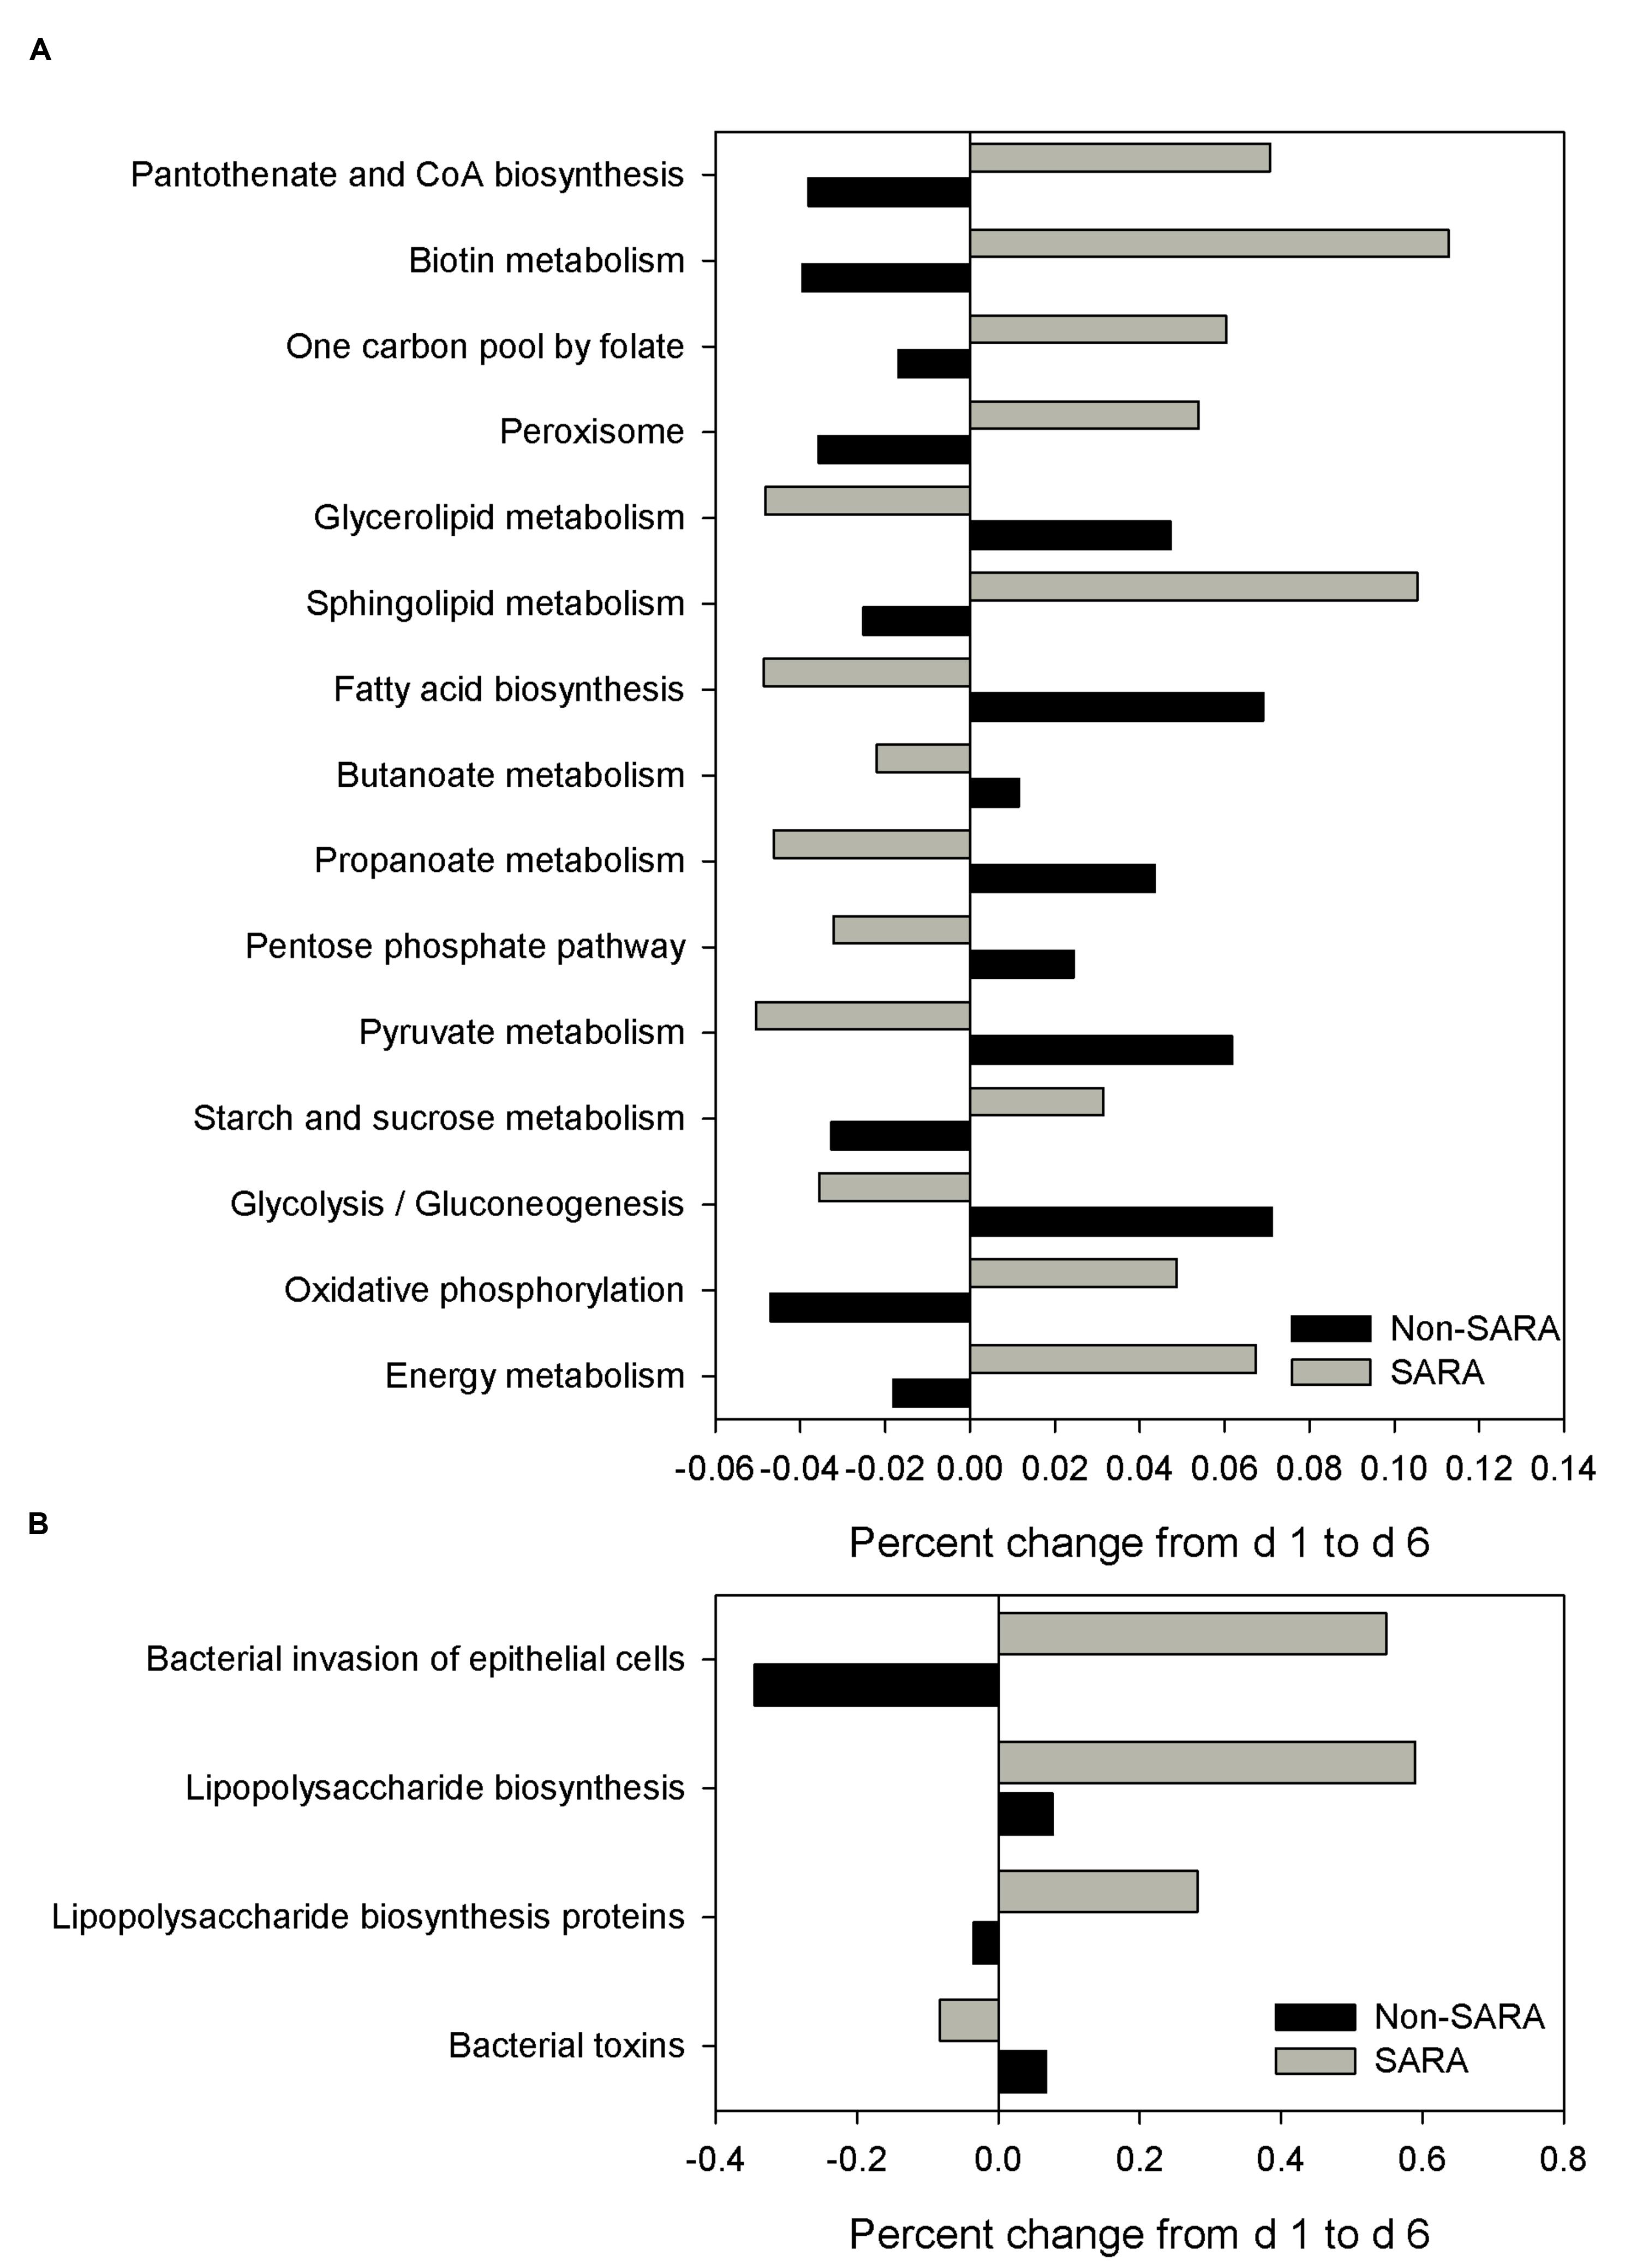
FIGURE 5. Effect of SARA induction on the predicted metagenome pathways related to energy metabolism (A) and epithelial barrier function (B) in the solid fraction. Values represent the percentage change in expression of a given pathway from day 1 to day 6. Positive values indicate an increased representation on day 6 compared with day 1 of a given pathway in the predicted metagenome, while negative values describe a percent decrease on day 6 of a predicted pathway.
Ruminal Epithelium Gene Expression
Expression of genes related to barrier function in ruminal epithelium was affected by SARA induction. Claudin 4 (CLDN4) expression was upregulated (P = 0.01) on day 6 and a tendency for a SG × day interaction (P = 0.08) was observed with a greater increase for SARA cows on day 6 (Figure 6). Claudin 1 (CLDN1) was also upregulated (P = 0.03) on day 6 but the SG × day interaction (P = 0.10) indicated only SARA cows had greater expression on day 6. A tendency for a SG × day interaction (P = 0.10) was observed for Tight junction protein 1 (TJP1) as no change in expression was detected for SARA cows while it was down-regulated in Non-SARA cows on day 6. Relative expression of Toll-like receptor 2 (TLR2) decreased on day 6 (P = 0.05; Figure 7), but no day effect was detected for TLR4 (P = 0.18). A day effect (P = 0.02) for DSG1 indicated a decrease in expression on day 6 which was due the marked decrease for Non-SARA cows. Although, there was a tendency for Coxsackie virus and adenovirus receptor (CXADR) expression to be increased on day 6 (P = 0.10), no main effects or interactions were observed for JAM2, OCLN, TLR4, IGFBP3, and IGFBP5. The change in rumen epithelium gene expression from day 1 to day 6 was correlated with pH response parameters (Figure 8). A strong association (R2 > 0.5) was revealed between expression of CLDN1 and DSG1 to the pH nadir, AUC < 5.8 and time < 5.8. An increased expression of CLDN1 and DSG1 on day 6 (relative to day 1) positively corresponded to a proportional increase in AUC < 5.8 and time < 5.8 as well as a negative correlation to the pH nadir.
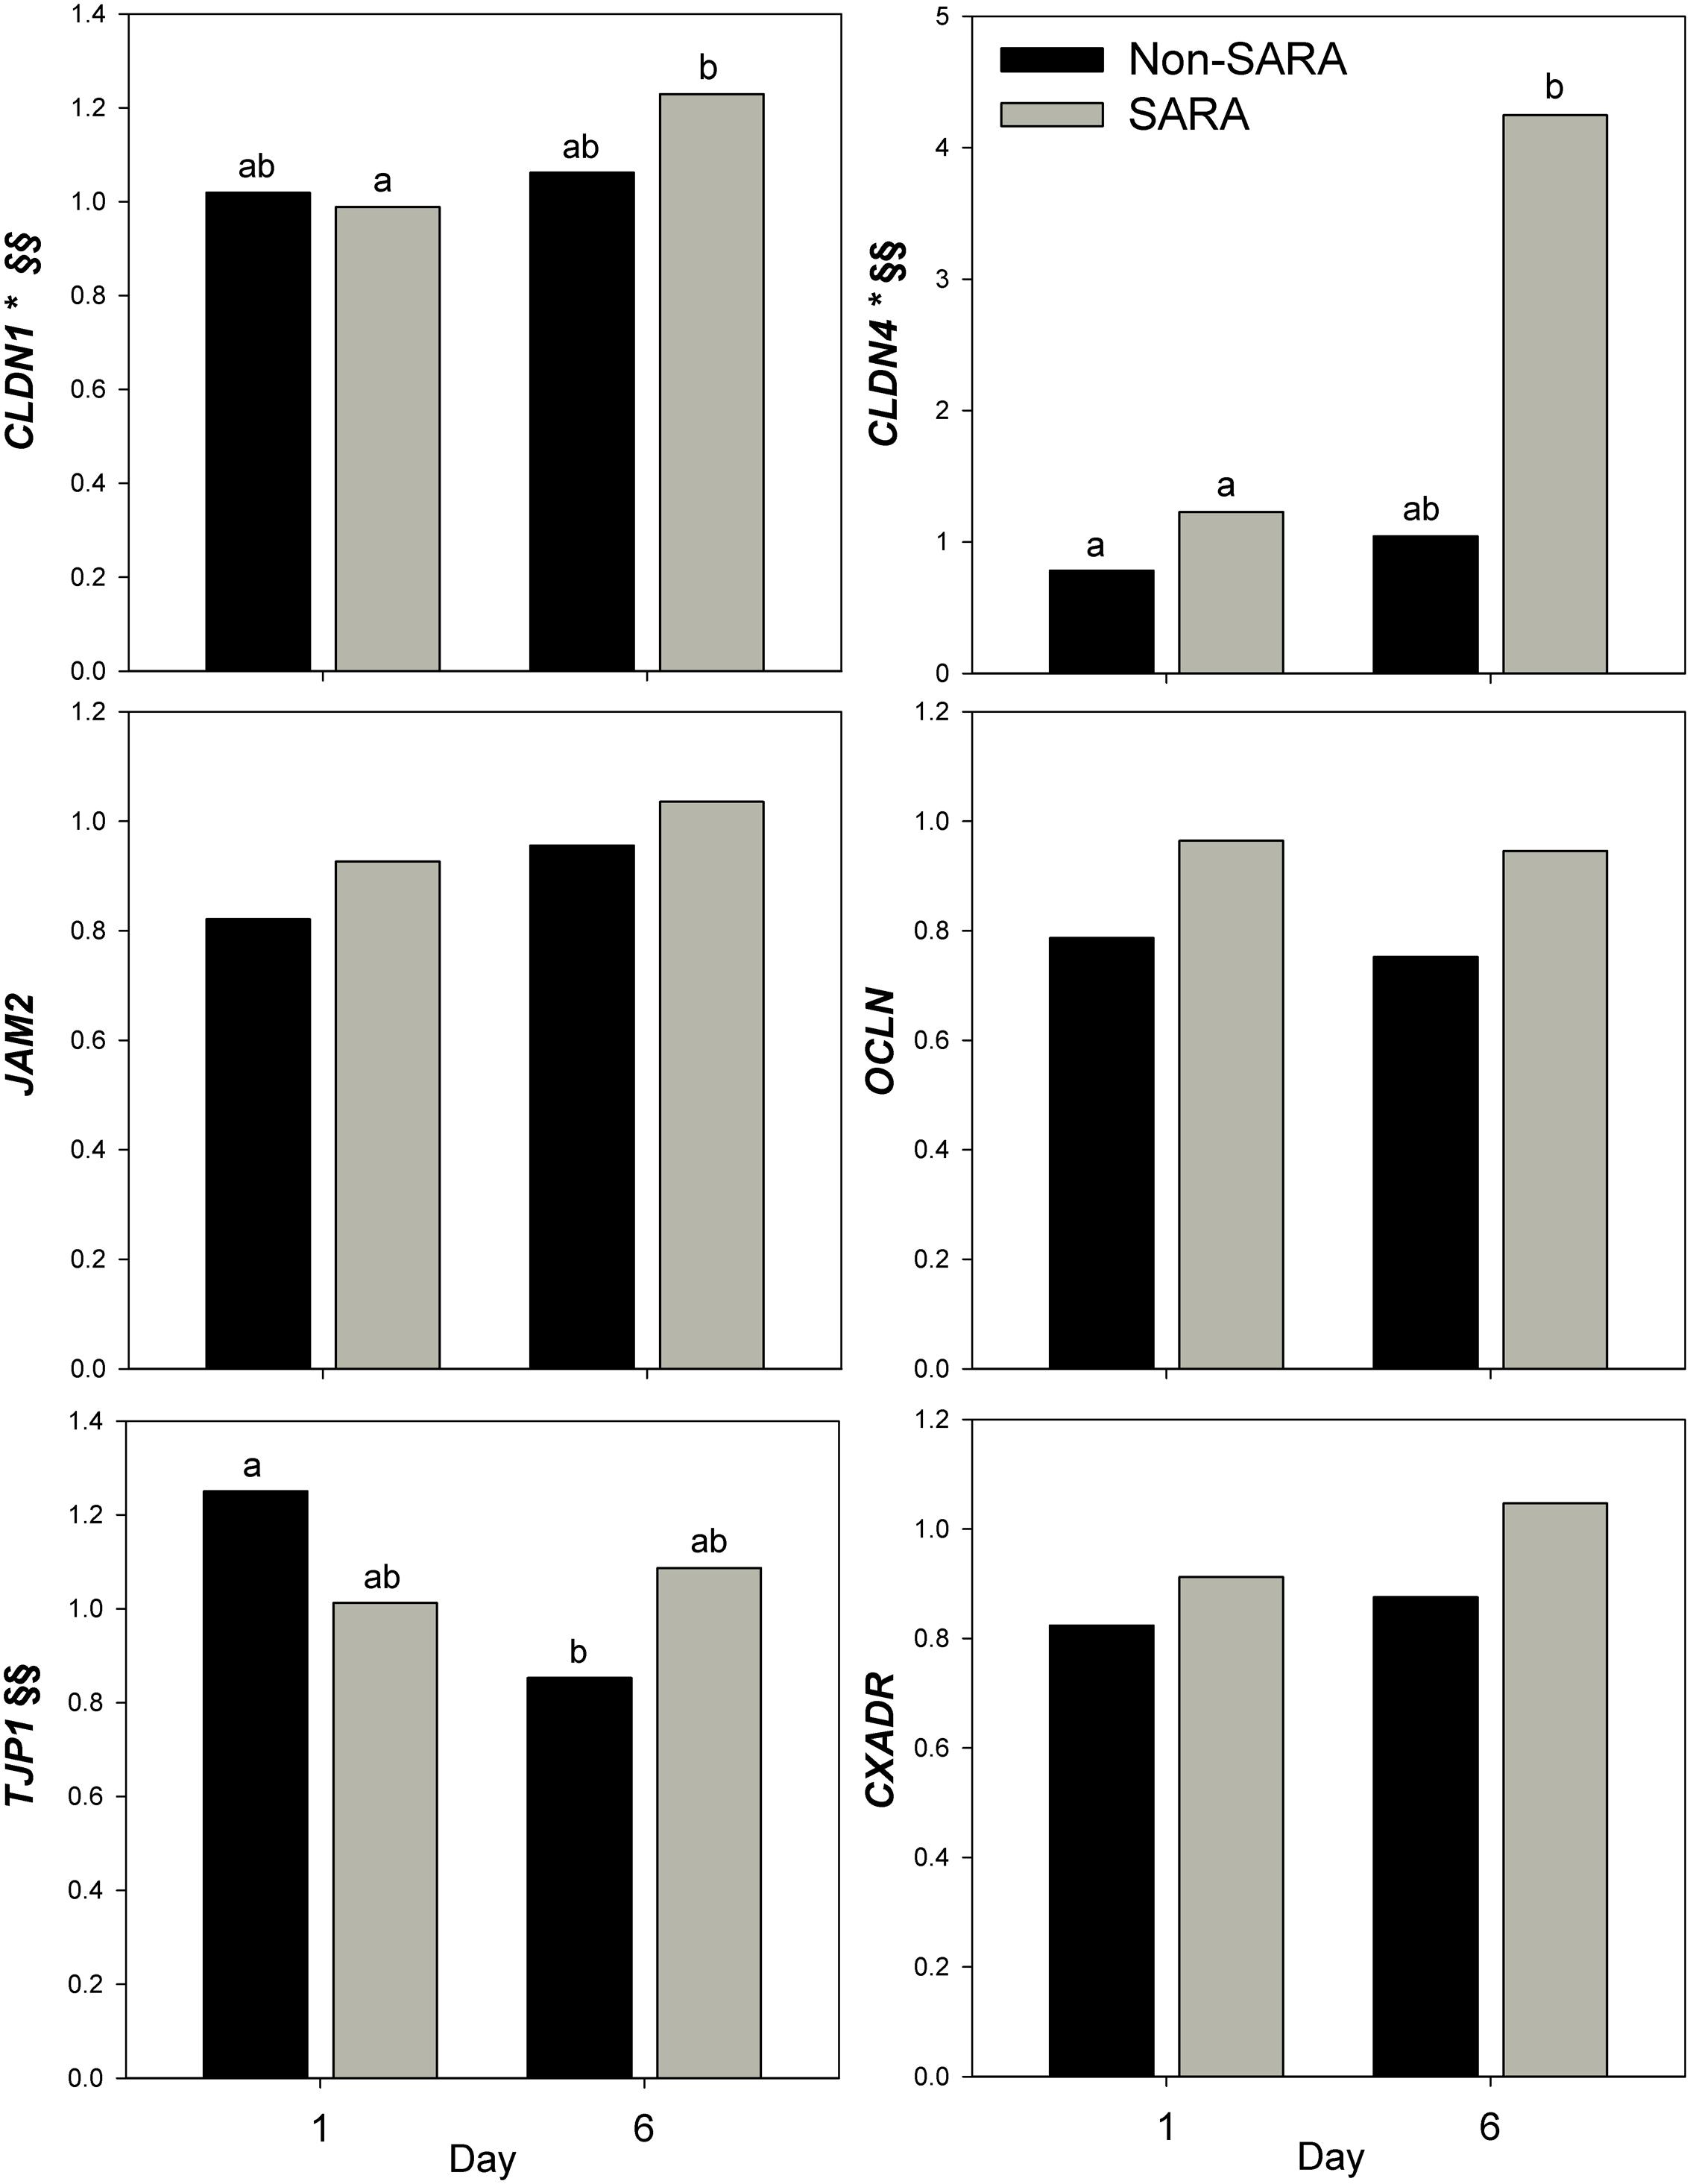
FIGURE 6. Effect of SARA induction on barrier function gene expression in rumen epithelium tissue. Effects (P ≤ 0.05) are indicated by symbols: day effect (∗), treatment effect (#), treatment × day effect (§), and period effect (‡). Tendencies (P ≤ 0.1) are indicated by symbols: day effect (∗∗), treatment effect (##), treatment × day effect (§§), and period effect (‡‡). Subscripts indicate pairwise differences of P < 0.05.
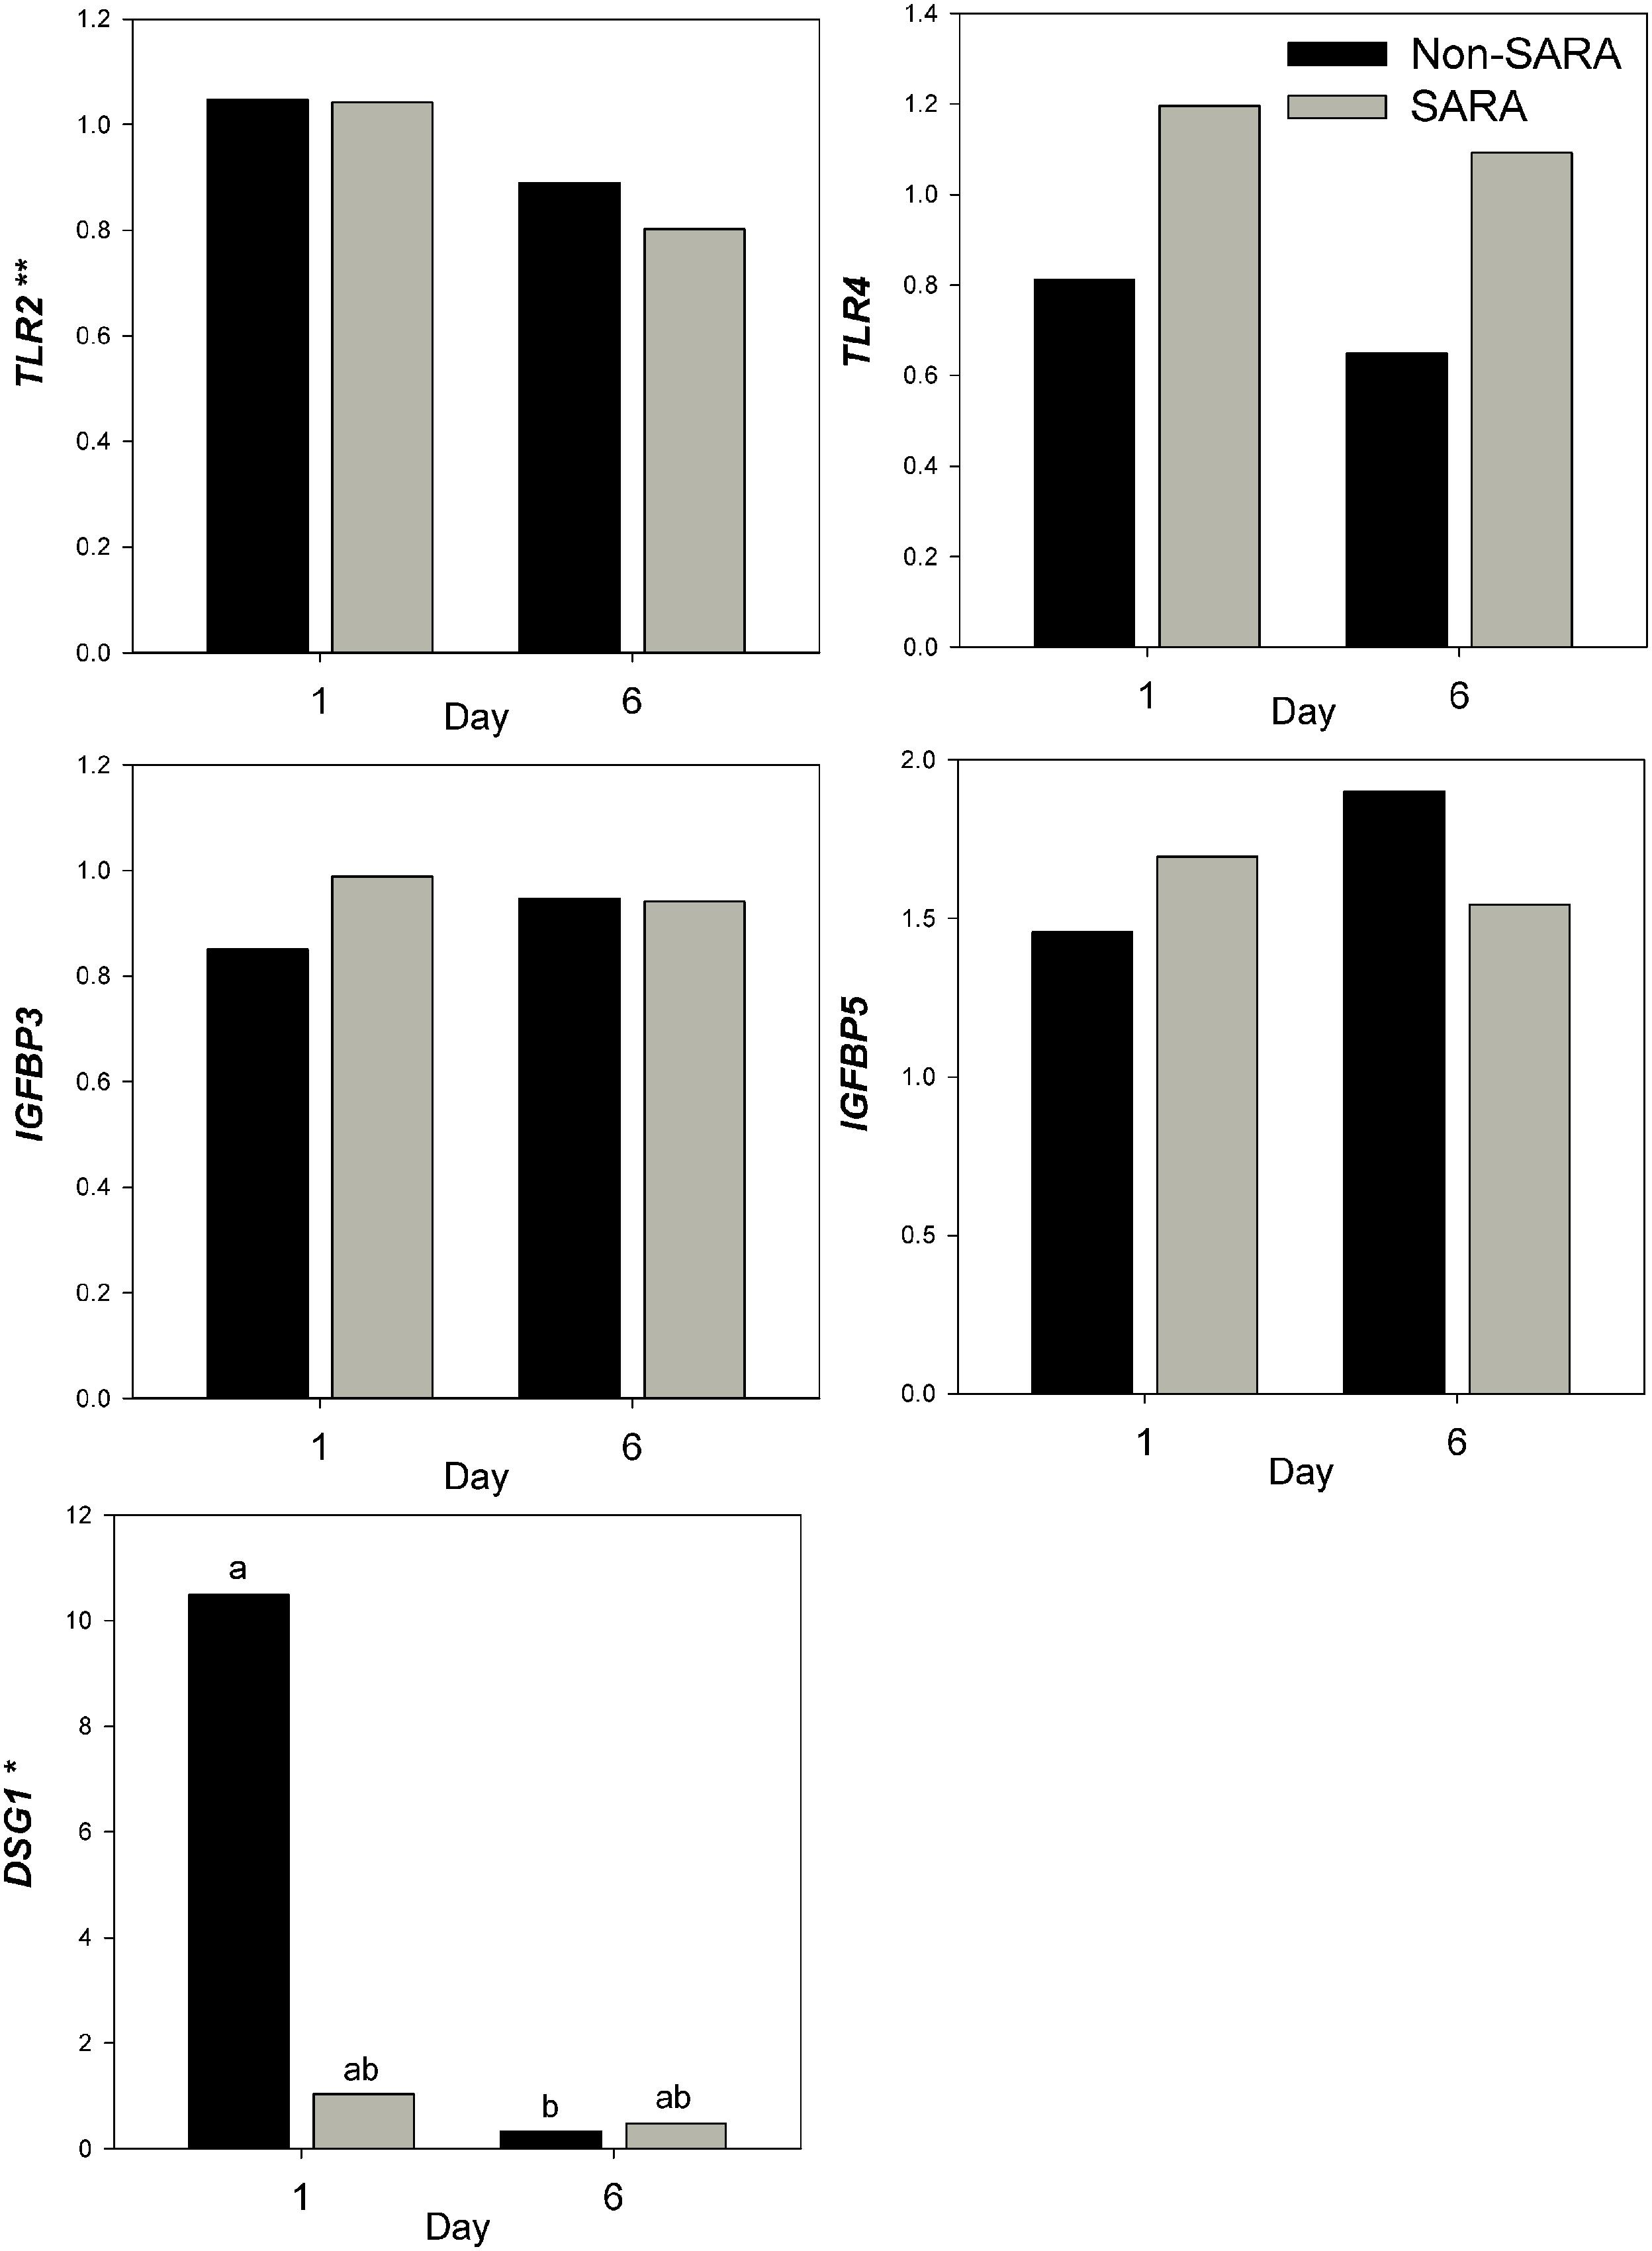
FIGURE 7. Effect of SARA induction on gene expression in rumen epithelium tissue. Effects (P ≤ 0.05) are indicated by symbols: day effect (∗), treatment effect (#), treatment × day effect (§), and period effect (‡). Tendencies (P ≤ 0.1) are indicated by symbols: day effect (∗∗), treatment effect (##), treatment × day effect (§§), and period effect (‡‡). Subscripts indicate pairwise differences of P < 0.05.
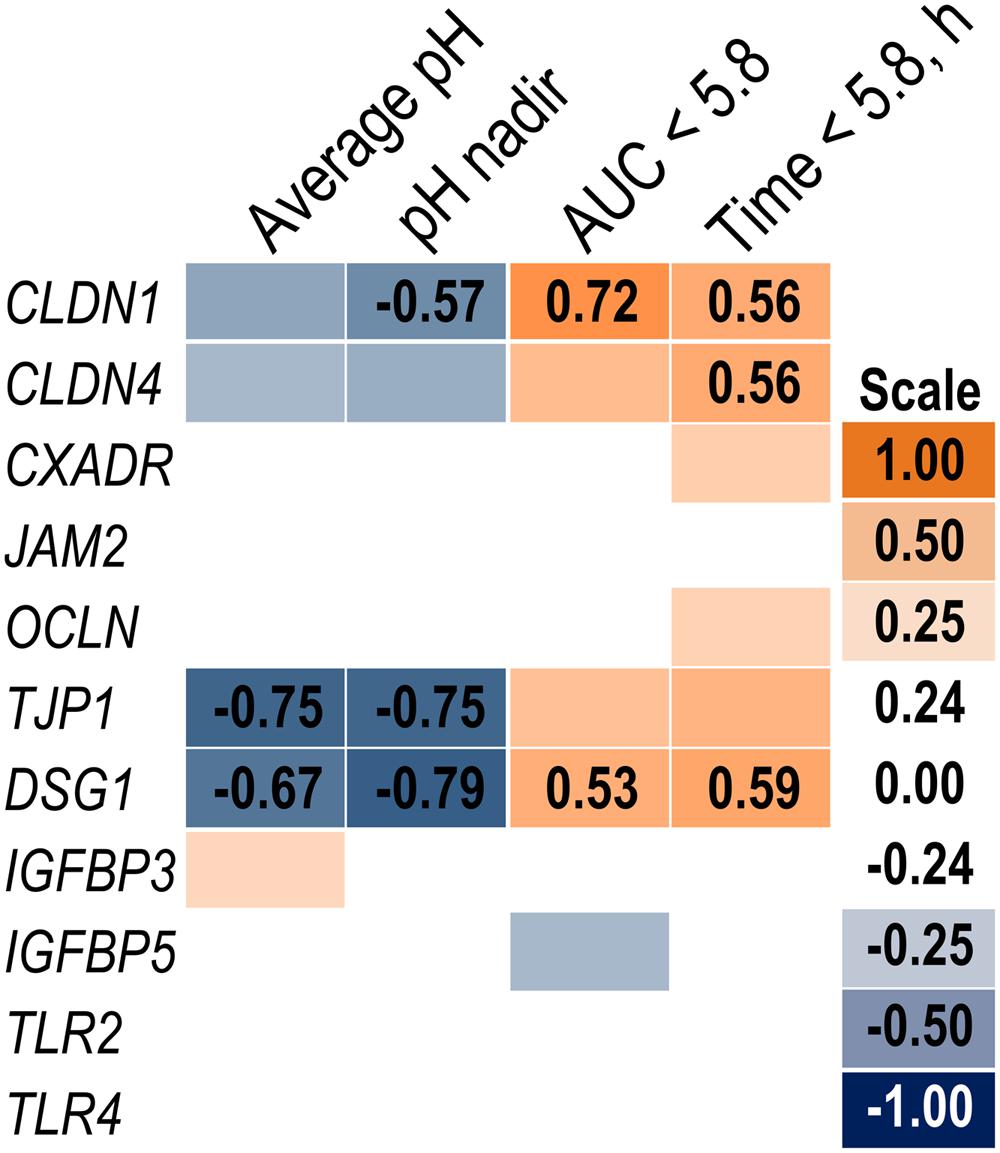
FIGURE 8. Association heat map between the change in rumen epithelium gene expression over time (day 6 – day 1) and ruminal pH response on day 5 using Pearson correlations. All correlation coefficients greater than 0.5 or less than -0.5 are listed. The scale bar colors denote the correlation coefficients with 1 indicating a perfect positive correlation (orange) and -1 indicating a perfect negative correlation.
Discussion
While current best management practices strive to minimize SARA occurrence, the continued relevance of SARA in the dairy industry is reflected in ongoing academic research. Because of the debate over the definition of SARA (Plaizier et al., 2008), the understanding of its etiology needs to be strengthened. Our objective was to elucidate effects of SARA induction using a feed restriction model on the solid and liquid fractions of the ruminal microbiome in addition to the ruminal epithelium. We defined SARA with a pH threshold of 5.6 (Gozho et al., 2005) understanding that pH is an important but not the only factor driving the onset of SARA (Calsamiglia et al., 2008). Using a post hoc grouping, we were able to ensure SARA and Non-SARA cows were on the same basal diet with a goal of understanding key mediators in the ruminal microbiome and epithelium 24 h after a single bout of SARA. Although, there was slight dietary variation based on the provision of a wheat/barley pellet to some cows on day 5, the inclusion of the pellet was ineffective at inducing SARA for some cows. While dietary composition and intake are primary causative agents of SARA, this study set out to understand the role of observed effects on the ruminal microbiome and epithelium during the onset of SARA.
We observed a reduction in richness for SARA cows on day 6 in the liquid fraction and a tendency for a decrease in alpha-diversity on day 6 overall. These findings correspond well with decreases in richness and diversity associated with SARA induction (Mao et al., 2013) as well as with grain feeding in general (Fernando et al., 2010). Moreover, the slight increase in richness on day 6 for Non-SARA cows suggests greater resilience in the community may be important to prevent the onset of SARA. While our results in the solid fraction were surprising as alpha-diversity increased on day 6 for SARA cows, additional evidence of greater richness post SARA induction has been observed using DGGE banding of whole rumen content samples (Lettat et al., 2012). Beta-diversity results suggest there was more variation among liquid samples compared with the solid fraction. Whereas day had a major effect characterizing the differences within the liquid fraction, more of the variation observed in the solid fraction was accounted for by the SG × day interaction. Others have reported greater variation in liquid samples when evaluating SARA microbiome changes using DGGE (Huo et al., 2014) as well as other diet types (McCann et al., 2014).
As noted by the increase in Bacteroidetes on day 6, the taxonomic evaluation of changes in the microbiome suggested the greatest effects of SARA were induced in the solid fraction. Relative abundance of Bacteroidetes was even greater on day 1 and then was only accentuated on day 6 after SARA induction. This may indicate greater levels of Bacteroidetes or Prevotella may predispose the rumen to the onset of SARA. Golder et al (2014) observed cows consuming higher levels of crushed wheat and ryegrass silage with greater SARA eigenvalues had greater Prevotellaceae in a predominantly liquid sample. In contrast, a longer-term induction model over 21 days with greater dietary differences resulted in lower Prevotella in whole rumen contents of cows with SARA (Mao et al., 2013). Evaluating the severity of acidosis during the transition period revealed a relationship between Prevotella in the liquid fraction and severity of acidosis (Mohammed et al., 2012), and agrees with our findings in the liquid fraction. Variation with the genus Prevotella has also been observed in response to SARA induction (Khafipour et al., 2009c). Understanding the undescribed diversity in the Prevotella genus (Bekele et al., 2010) and the limitations of taxonomic identifications with current 16S rRNA sequencing technology underscore the challenge comparing across studies given the vast differences in diet, experimental design, sampling, and methodology.
Based on pH response (Supplementary Table S2), the level of SARA experienced by cows in our study most closely matches the mild grain-induced SARA described by Khafipour et al. (2009c). Despite not having a group similar to our Non-SARA cows, the collection time at h 0 and control vs. induction period coincide well with days 1 and 6 in our study. Similarly to these findings, Anaerovibrio lipolytica and P. bryantii increased on day 6 relative to day 1 while F. succinogenes levels were not affected. The greater abundance of F. succinogenes observed for SARA cows was surprising given its pH sensitive metabolism (Chow and Russell, 1992) and lower abundance and activity of the cell membrane H+-ATPase transporter (Miwa et al., 1997). However, a similar trend for greater abundance of Fibrobacteraceae was observed in cows with greater SARA eigenvalues (Golder et al., 2014). Relative abundance of S. bovis, a well-described lactate producer, increased on day 6 but no effect of SG was detected despite numerical trends for a greater increase for SARA cows. Similarly, only day effects were observed at the genus level in the liquid and solid fraction. Overall increases in S. bovis were not related with the severity of acidotic bout within this experimental pH range which is consistent with descriptions of SARA being unassociated with lactic acid accumulation (Nagaraja and Titgemeyer, 2007). The 2.7 fold increase in S. bovis for SARA cows on day 6 coincided with a 2.3 fold increase in M. elsdenii supporting a level of synchrony between lactate producers and utilizers that may have prevented a more severe bout of SARA from developing after an abrupt feed restriction (Oetzel, 2003).
The functional capability of the rumen is more static than community composition due to functional redundancy across many community members (Weimer, 2015). In ruminants, metagenomic predictions using 16S rRNA data are comparable with shotgun sequencing data (Lopes et al., 2015). Despite a similar basal diet, energy metabolism and starch and sucrose metabolism pathways were enriched under SARA conditions which is consistent with greater glucose levels observed on higher concentrate diets with a lower ruminal pH (Ametaj et al., 2010). Significant increases in sphingolipid metabolism on day 6 in SARA cows are linked to greater relative abundance of Prevotella. While many gram-negative bacteria possess LPS on their cell membrane, a limited number of bacteria and fungi contain sphingolipids in their cell membrane including Bacteroides and Prevotella (Kato et al., 1995). Recent research has indicated bacterial sphingolipids are critical for survival during stressful oxidative conditions in Bacteroides fragilis (An et al., 2011). Although not tested under pH related stress, this mechanism may be key to the increase of Prevotella observed after the SARA bout. Increased LPS biosynthesis and proteins for SARA cows on day 6 corresponded well with greater levels of LPS observed with SARA induction and higher grain feeding (Khafipour et al., 2009b; Saleem et al., 2012; Mao et al., 2015) and is due to the increase of gram-negative phyla (primarily Bacteroidetes). Release of LPS from the outer membrane of gram-negative bacteria occurs during growth and stationary phases as well as during cell lysis (Wells and Russell, 1996). Pathways related to bacterial invasion of epithelial cells further suggest an increased presence of bacteria poised to take advantage of compromised barrier function in rumen epithelium. Enriched pathways related to cyanoamino acid metabolism were observed in SARA cows on day 6. This pathway is linked to beta-alanine metabolism via aspartate which connects to pantothenate and CoA biosynthesis. The coordinated enrichment of these pathways in SARA cows is supported by previous work reporting increased aspartate and beta-alanine in the rumen fluid with increased grain feeding (Saleem et al., 2012; Mao et al., 2015).
While long-term feeding of high grain diets is known to disrupt barrier function proteins (Liu et al., 2013), a single mild SARA induction did not affect epithelial barrier function determined in Ussing chambers in vitro (Penner et al., 2010). Claudins are tight junction proteins primarily located in the membrane of stratum granulosum cells (Graham and Simmons, 2005). Increased expression of CLDN1 and CLDN4 most closely coincided with a lower pH observed during SARA induction. Acidotic conditions increased expression of multiple claudins in the duodenum of rodents (Charoenphandhu et al., 2007). Although, claudins can be downregulated by the transcription factor SNAI1 (Ikenouchi et al., 2003), a mechanistic link with a low pH has not been elucidated. Desmosomes are a multi-protein complex responsible for intercellular adhesion (Holthöfer et al., 2007). Desmoglein (DSG1), a component of desmosomes, is highly upregulated during the recovery from an acidotic bout (Steele et al., 2011). Similarly, we observed the greatest expression levels of DSG1 on day 1 which may represent a carry-over effect from the prior period. Toll-like receptors initiate the inflammatory response by binding to pathogen-associated molecules (Akira and Takeda, 2004). While increased expression of TLR2 and TLR4 has been associated with resistance to acidosis (Chen et al., 2012), this response observed in a subsequent acidosis induction following feeding a high concentrate diet for 58 days. Our results did not suggest that these adaptations occur within 24 h of a single bout of SARA. Feeding high grain diets at SARA levels over multiple weeks has been shown to increase epithelial proliferation by IGF-1 via upregulation of IGFBP5 and downregulation of IGFBP3 (Steele et al., 2011, 2012). The fact no effect on IGFBP5 and IGFBP3 was observed suggests factors unrelated to a short-term SARA induction are responsible for their regulation.
Conclusion
These data indicate that feed restriction and subsequent SARA induction cause alterations in the ruminal microbiome and epithelium not observed in Non-SARA cows. More specifically, SARA cows had increased relative abundance of Prevotella and Eubacterium ruminantium in the solid fraction. Ruminal microbiome beta-diversity results suggest the effect of feed restriction was greater than pH differences in the liquid fraction. Predicted functional profile of the ruminal microbiome corresponded to known metabolites impacted by high concentrate feeding. Ruminal epithelium made minor adaptations 24 h after SARA including upregulation of CLDN1 and CLDN4. Overall, these results extend our understanding of the rumen microbiome’s dynamic response to acidotic conditions and may facilitate targeted mediation of these events to prevent SARA.
Author Contributions
FC designed the study. SL and FC conducted the experiment. JM and HD performed lab analysis. JM performed statistics and analyzed the data. JM, EK, and JL wrote the manuscript. All authors carefully read and approved the final version of the manuscript.
Funding
This project was partially supported by the American Jersey Cattle Association Research Foundation (Reynoldsburg, OH).
Conflict of Interest Statement
The authors declare that the research was conducted in the absence of any commercial or financial relationships that could be construed as a potential conflict of interest.
Acknowledgment
Saleh Alqarni for his assistance in sample collection.
Supplementary Material
The Supplementary Material for this article can be found online at: http://journal.frontiersin.org/article/10.3389/fmicb.2016.00701
Footnotes
References
Akira, S., and Takeda, K. (2004). Toll-like receptor signalling. Nat. Rev. Immunol. 4, 499–511. doi: 10.1038/nri1391
Ametaj, B. N., Zebeli, Q., Saleem, F., Psychogios, N., Lewis, M. J., Dunn, S. M., et al. (2010). Metabolomics reveals unhealthy alterations in rumen metabolism with increased proportion of cereal grain in the diet of dairy cows. Metabolomics 6, 583–594. doi: 10.1007/s11306-010-0227–226
An, D., Na, C., Bielawski, J., Hannun, Y. A., and Kasper, D. L. (2011). Membrane sphingolipids as essential molecular signals for Bacteroides survival in the intestine. Proc. Natl. Acad. Sci. U.S.A. 108, 4666–4671. doi: 10.1073/pnas.1001501107
Aschenbach, J. R., Penner, G. B., Stumpff, F., and Gäbel, G. (2011). Ruminant Nutrition Symposium: role of fermentation acid absorption in the regulation of ruminal pH. J. Anim. Sci. 89, 1092–1107. doi: 10.2527/jas.2010-3301
Beals, E. W. (1984). Bray–Curtis ordination: an effective strategy for analysis of multivariate ecological data. Adv. Ecol. Res. 14, 1–55. doi: 10.1016/S0065-2504(08)60168-3
Bekele, A. Z., Koike, S., and Kobayashi, Y. (2010). Genetic diversity and diet specificity of ruminal Prevotella revealed by 16S rRNA gene-based analysis. FEMS Microbiol. Lett. 305, 49–57. doi: 10.1111/j.1574-6968.2010.01911.x
Calsamiglia, S., Cardozo, P. W., Ferret, A., and Bach, A. (2008). Changes in rumen microbial fermentation are due to a combined effect of type of diet and pH. J. Anim. Sci. 86, 702–711. doi: 10.2527/jas.2007–2146
Caporaso, J. G., Bittinger, K., Bushman, F. D., DeSantis, T. Z., Andersen, G. L., and Knight, R. (2010a). PyNAST: a flexible tool for aligning sequences to a template alignment. Bioinformatics 26, 266–267. doi: 10.1093/bioinformatics/btp636
Caporaso, J. G., Kuczynski, J., Stombaugh, J., Bittinger, K., Bushman, F. D., Costello, E. K., et al. (2010b). QIIME allows analysis of high-throughput community sequencing data. Nat. Methods 7, 335–336. doi: 10.1038/nmeth.f.303
Caporaso, J. G., Lauber, C. L., Walters, W. A., Berg-Lyons, D., Huntley, J., Fierer, N., et al. (2012). Ultra-high-throughput microbial community analysis on the Illumina HiSeq and MiSeq platforms. ISME J. 6, 1621–1624. doi: 10.1038/ismej.2012.8
Chao, A. (1984). Nonparametric estimation of the number of classes in a population. Scand. J. Stat. 11, 265–270.
Charoenphandhu, N., Wongdee, K., Tudpor, K., Pandaranandaka, J., and Krishnamra, N. (2007). Chronic metabolic acidosis upregulated claudin mRNA expression in the duodenal enterocytes of female rats. Life Sci. 80, 1729–1737. doi: 10.1016/j.lfs.2007.01.063
Chen, Y., Oba, M., and Guan, L. L. (2012). Variation of bacterial communities and expression of Toll-like receptor genes in the rumen of steers differing in susceptibility to subacute ruminal acidosis. Vet. Microbiol. 159, 451–459. doi: 10.1016/j.vetmic.2012.04.032
Chow, J. M., and Russell, J. B. (1992). Effect of pH and monensin on glucose transport by Fibrobacter succinogenes, a cellulolytic ruminal bacterium. Appl. Environ. Microbiol. 58, 1115–1120.
Cook, N. B., Nordlund, K. V., and Oetzel, G. R. (2004). Environmental influences on claw horn lesions associated with laminitis and subacute ruminal acidosis in dairy cows. J. Dairy Sci. 87(Suppl.), E36–E46. doi: 10.3168/jds.S0022-0302(04)70059–70054
Derakhshani, H., Tun, H. M., and Khafipour, E. (2016). An extended single-index multiplexed 16S rRNA sequencing for microbial community analysis on MiSeq illumina platforms. J. Basic Microbiol. 56, 321–326. doi: 10.1002/jobm.201500420
Dirksen, G. U., Liebich, H. G., and Mayer, E. (1985). Adaptive changes of the ruminal mucosa and their functional and clinical significance. Bovine Pract. 20, 116–120.
Edgar, R. C. (2010). Search and clustering orders of magnitude faster than BLAST. Bioinformatics 26, 2460–2461. doi: 10.1093/bioinformatics/btq461
Edgar, R. C., Haas, B. J., Clemente, J. C., Quince, C., and Knight, R. (2011). UCHIME improves sensitivity and speed of chimera detection. Bioinformatics 27, 2194–2200. doi: 10.1093/bioinformatics/btr381
Fernando, S. C., Purvis, H. T., Najar, F. Z., Sukharnikov, L. O., Krehbiel, C. R., Nagaraja, T. G., et al. (2010). Rumen microbial population dynamics during adaptation to a high-grain diet. Appl. Environ. Microbiol. 76, 7482–7490. doi: 10.1128/aem.00388–310
Fliegerova, K., Tapio, I., Bonin, A., Mrazek, J., Callegari, M. L., Bani, P., et al. (2014). Effect of DNA extraction and sample preservation method on rumen bacterial population. Anaerobe 29, 80–84. doi: 10.1016/j.anaerobe.2013.09.015
Gäbel, G., Martens, H., Suendermann, M., and Galfi, P. (1987). The effect of diet, intraruminal pH and osmolarity on sodium, chloride and magnesium absorption from the temporatily isolated and washed reticulo-rumen of sheep. Q. J. Exp. Physiol. 72, 501–511. doi: 10.1113/expphysiol.1987.sp003092
Garrett, E. F., Nordlund, K. V., Goodger, W. J., and Oetzel, G. R. (1997). A cross-sectional field study investigating the effect of periparturient dietary management on ruminal pH in early lactation dairy cows. J. Dairy Sci. 80, 169.
Golder, H. M., Denman, S. E., McSweeney, C., Wales, W. J., Auldist, M. J., Wright, M. M., et al. (2014). Effects of partial mixed rations and supplement amounts on milk production and composition, ruminal fermentation, bacterial communities, and ruminal acidosis. J. Dairy Sci. 97, 5763–5785. doi: 10.3168/jds.2014–8049
Gozho, G. N., Plaizier, J. C., Krause, D. O., Kennedy, A. D., and Wittenberg, K. M. (2005). Subacute ruminal acidosis induces ruminal lipopolysaccharide endotoxin release and triggers an inflammatory response. J. Dairy Sci. 88, 1399–1403. doi: 10.3168/jds.S0022-0302(05)72807–72801
Graham, C., and Simmons, N. L. (2005). Functional organization of the bovine rumen epithelium. Am. J. Physiol. Regul. Integr. Comp. Physiol. 288, R173–R181. doi: 10.1152/ajpregu.00425.2004
Holthöfer, B., Windoffer, R., Troyanovsky, S., and Leube, R. E. (2007). “Structure and function of desmosomes,” in International Review of Cytology, ed. K. Jeon (Cambridge, MA: Academic Press), 65–163.
Huo, W., Zhu, W. Y., and Mao, S. Y. (2014). Impact of subacute ruminal acidosis on the diversity of liquid and solid-associated bacteria in the rumen of goats. World J. Microbiol. Biotechnol. 30, 669–680. doi: 10.1007/s11274-013-1489–1488
Ikenouchi, J., Matsuda, M., Furuse, M., and Tsukita, S. (2003). Regulation of tight junctions during the epithelium-mesenchyme transition: direct repression of the gene expression of claudins/occludin by Snail. J. Cell Sci. 116, 1959–1967. doi: 10.1242/jcs.00389
Kanehisa, M., and Goto, S. (2000). KEGG: kyoto encyclopedia of genes and genomes. Nucleic Acids Res. 28, 27–30. doi: 10.1093/nar/28.1.27
Kato, M., Muto, Y., Tanaka-Bandoh, K., Watanabe, K., and Ueno, K. (1995). Sphingolipid Composition in Bacteroides Species. Anaerobe 1, 135–139. doi: 10.1006/anae.1995.1009
Kelly, J. M., Vaage, A. S., Milligan, L. P., and McBride, B. W. (1995). In vitro ouabain-sensitive respiration and protein synthesis in rumen epithelial papillae of Hereford steers fed either timothy hay or timothy hay supplemented with cracked corn once daily. J. Anim. Sci. 73, 3775–3784.
Khafipour, E., Krause, D., and Plaizier, J. (2009a). Alfalfa pellet-induced subacute ruminal acidosis in dairy cows increases bacterial endotoxin in the rumen without causing inflammation. J. Dairy Sci. 92, 1712–1724. doi: 10.3168/jds.2008-1656
Khafipour, E., Krause, D. O., and Plaizier, J. C. (2009b). A grain-based subacute ruminal acidosis challenge causes translocation of lipopolysaccharide and triggers inflammation. J. Dairy Sci. 92, 1060–1070. doi: 10.3168/jds.2008-1389
Khafipour, E., Li, S., Plaizier, J. C., and Krause, D. O. (2009c). Rumen microbiome composition determined using two nutritional models of subacute ruminal acidosis. Appl. Environ. Microbiol 75, 7115–7124. doi: 10.1128/aem.00739–739
Kleen, J. L., Hooijer, G. A., Rehage, J., and Noordhuizen, J. P. T. M. (2003). Subacute ruminal acidosis (SARA): a review. J. Vet. Med. A. Physiol. clin. Med. 50, 406–414. doi: 10.1046/j.1439-0442.2003.00569.x
Langille, M. G., Zaneveld, J., Caporaso, J. G., McDonald, D., Knights, D., Reyes, J. A., et al. (2013). Predictive functional profiling of microbial communities using 16S rRNA marker gene sequences. Nat. Biotechnol. 31, 814–821. doi: 10.1038/nbt.2676
Lettat, A., Nozière, P., Silberberg, M., Morgavi, D. P., Berger, C., and Martin, C. (2012). Rumen microbial and fermentation characteristics are affected differently by bacterial probiotic supplementation during induced lactic and subacute acidosis in sheep. BMC Microbiol. 12:142. doi: 10.1186/1471-2180-12-142
Li, R. W., Khafipour, E., Krause, D. O., Entz, M. H., de Kievit, T. R., and Fernando, W. G. D. (2012). Pyrosequencing reveals the influence of organic and conventional farming systems on bacterial communities. PLoS ONE 7:e51897. doi: 10.1371/journal.pone.0051897
Liu, J., Xu, T., Liu, Y., Zhu, W. Y., and Mao, S. Y. (2013). A high-grain diet causes massive disruption of ruminal epithelial tight junctions in goats. Am. J. Physiol. Regul. Integr. Comp. Physiol. 305, R232–R241. doi: 10.1152/ajpregu.00068.2013
Lopes, L. D., de Souza Lima, A. O., Taketani, R. G., Darias, P., da Silva, L. R. F., Romagnoli, E. M., et al. (2015). Exploring the sheep rumen microbiome for carbohydrate-active enzymes. Antonie Van Leeuwenhoek 108, 15–30. doi: 10.1007/s10482-015-0459-6
Luan, S., Cowles, K., Murphy, M. R., and Cardoso, F. C. (2015). Effect of a grain challenge on ruminal, urine, and fecal pH, total-tract starch digestibility, and milk composition of Holstein and Jersey cows. J. Dairy Sci. 99, 2190–2200.
Maeda, H., Fujimoto, C., Haruki, Y., Maeda, T., Kokeguchi, S., Petelin, M., et al. (2003). Quantitative real-time PCR using TaqMan and SYBR Green for Actinobacillus actinomycetemcomitans, Porphyromonas gingivalis, Prevotella intermedia, tetQ gene and total bacteria. FEMS Immunol. Med. Microbiol. 39, 81–86. doi: 10.1016/s0928-8244(03)00224–224
Mao, S., Huo, W., and Zhu, W. Y. (2015). Microbiome–metabolome analysis reveals unhealthy alterations in the composition and metabolism of ruminal microbiota with increasing dietary grain in a goat model. Environ. Microbiol. 18, 525–541.
Mao, S. Y., Zhang, R. Y., Wang, D. S., and Zhu, W. Y. (2013). Impact of subacute ruminal acidosis (SARA) adaptation on rumen microbiota in dairy cattle using pyrosequencing. Anaerobe 24, 12–19. doi: 10.1016/j.anaerobe.2013.08.003
Masella, A. P., Bartram, A. K., Truszkowski, J. M., Brown, D. G., and Neufeld, J. D. (2012). PANDAseq: paired-end assembler for illumina sequences. BMC Bioinfort. 13:31. doi: 10.1186/1471-2105-13-31
McCann, J. C., Drewery, M. L., Sawyer, J. E., Pinchak, W. E., and Wickersham, T. A. (2014). Effect of postextraction algal residue supplementation on the ruminal microbiome of steers consuming low-quality forage. J. Anim. Sci. 92, 5063–5075. doi: 10.2527/jas.2014–7811
McDonald, D., Price, M. N., Goodrich, J., Nawrocki, E. P., DeSantis, T. Z., Probst, A., et al. (2012). An improved Greengenes taxonomy with explicit ranks for ecological and evolutionary analyses of bacteria and archaea. ISME J. 6, 610–618. doi: 10.1038/ismej.2011.139
Minuti, A., Palladino, A., Khan, M. J., Alqarni, S., Agrawal, A., Piccioli-Capelli, F., et al. (2015). Abundance of ruminal bacteria, epithelial gene expression, and systemic biomarkers of metabolism and inflammation are altered during the peripartal period in dairy cows. J. Dairy Sci. 98, 8940–8951. doi: 10.3168/jds.2015–9722
Miwa, T., Esaki, H., Umemori, J., and Hino, T. (1997). Activity of H+-ATPase in ruminal bacteria with special reference to acid tolerance. Appl. Environ. Microbiol. 63, 2155–2158.
Mohammed, R., Stevenson, D. M., Weimer, P. J., Penner, G. B., and Beauchemin, K. A. (2012). Individual animal variability in ruminal bacterial communities and ruminal acidosis in primiparous Holstein cows during the periparturient period. J. Dairy Sci. 95, 6716–6730.
Mould, F. L., and Ørskov, E. R. (1983). Manipulation of rumen fluid pH and its influence on cellulolysis in sacco, dry matter degradation and the rumen microflora of sheep offered either hay or concentrate. Anim. Feed Sci. Technol. 10, 1–14. doi: 10.1016/0377-8401(83)90002-0
Muyzer, G., de Waal, E. C., and Uitterlinden, A. G. (1993). Profiling of complex microbial populations by denaturing gradient gel electrophoresis analysis of polymerase chain reaction-amplified genes coding for 16S rRNA. Appl. Environ. Microbiol. 59, 695–700.
Naeem, A., Drackley, J. K., Stamey, J., and Loor, J. J. (2012). Role of metabolic and cellular proliferation genes in ruminal development in response to enhanced plane of nutrition in neonatal Holstein calves. J. Dairy Sci. 95, 1807–1820. doi: 10.3168/jds.2011–4709
Nagaraja, T. G., and Titgemeyer, E. C. (2007). Ruminal acidosis in beef cattle: the current microbiological and nutritional outlook. J. Dairy Sci. 90, E17–E38. doi: 10.3168/jds.2006-478
Oetzel, G. R., Nordlund, K. V., and Garrett, E. F. (1999). Effect of ruminal pH and stage of lactation on ruminal lactate concentrations in dairy cows. J. Dairy Sci. 82:38.
Parks, D. H., Tyson, G. W., Hugenholtz, P., and Beiko, R. G. (2014). STAMP: statistical analysis of taxonomic and functional profiles. Bioinformatics 30, 3123–3124. doi: 10.1093/bioinformatics/btu494
Penner, G. B., Oba, M., Gäbel, G., and Aschenbach, J. R. (2010). A single mild episode of subacute ruminal acidosis does not affect ruminal barrier function in the short term. J. Dairy Sci. 93, 4838–4845. doi: 10.3168/jds.2010-3406
Plaizier, J. C., Keunen, J. E., Walton, J. P., Duffield, T. F., and McBride, B. W. (2001). Effect of subacute ruminal acidosis on in situ digestion of mixed hay in lactating dairy cows. Can. J. Anim. Sci. 81, 421–423. doi: 10.4141/A00-106
Plaizier, J. C., Krause, D. O., Gozho, G. N., and McBride, B. W. (2008). Subacute ruminal acidosis in dairy cows: the physiological causes, incidence and consequences. Vet. J. 176, 21–31. doi: 10.1016/j.tvjl.2007.12.016
Ramirez-Farias, C., Slezak, K., Fuller, Z., Duncan, A., Holtrop, G., and Louis, P. (2009). Effect of inulin on the human gut microbiota: stimulation of Bifidobacterium adolescentis and Faecalibacterium prausnitzii. Br. J. Nutr. 101, 541–550. doi: 10.1017/S0007114508019880
Russell, J. B. (1998). The importance of pH in the regulation of ruminal acetate to propionate ratio and methane production in vitro. J. Dairy Sci. 81, 3222–3230. doi: 10.3168/jds.S0022-0302(98)75886-2
Saleem, F., Ametaj, B. N., Bouatra, S., Mandal, R., Zebeli, Q., Dunn, S. M., et al. (2012). A metabolomics approach to uncover the effects of grain diets on rumen health in dairy cows. J. Dairy Sci. 95, 6606–6623. doi: 10.3168/jds.2012-5403
Steele, M. A., Croom, J., Kahler, M., AlZahal, O., Hook, S. E., Plaizier, J. C., et al. (2011). Bovine rumen epithelium undergoes rapid structural adaptations during grain-induced subacute ruminal acidosis. Am. J. Physiol. Regul. Integr. Comp. Physiol. 300, R1515–R1523. doi: 10.1152/ajpregu.00120.2010
Steele, M. A., Dionissopoulos, L., AlZahal, O., Doelman, J., and McBride, B. W. (2012). Rumen epithelial adaptation to ruminal acidosis in lactating cattle involves the coordinated expression of insulin-like growth factor-binding proteins and a cholesterolgenic enzyme. J. Dairy Sci. 95, 318–327. doi: 10.3168/jds.2011–4465
Stevenson, D. M., and Weimer, P. J. (2007). Dominance of Prevotella and low abundance of classical ruminal bacterial species in the bovine rumen revealed by relative quantification real-time PCR. Appl. Microbiol. Biotechnol. 75, 165–174. doi: 10.1007/s00253-006-0802-y
Stock, R., and Smith, R. A. (2000). “Acidosis in cattle: an overview,” in Proceedings of the Thirty-Third Annual Conference, American Association of Bovine Practitioners: American Association of Bovine Practitioners, Rapid City, SD, 30–37.
Stone, W. C. (1999). “The effect of subclinical acidosis on milk components,” in Proceeding of the Cornell Nutrition Conference for Feed Manufacturers, Rochester, NY, 40–46.
Stone, W. C. (2004). Nutritional approaches to minimize subacute ruminal acidosis and laminitis in dairy cattle. J. Dairy Sci. 87(Suppl.), E13–E26. doi: 10.3168/jds.S0022-0302(04)70057–70050
Storey, J. D., and Tibshirani, R. (2003). Statistical significance for genomewide studies. Proc. Natl. Acad. Sci. U.S.A. 100, 9440–9445. doi: 10.1073/pnas.1530509100
Untergasser, A., Cutcutache, I., Koressaar, T., Ye, J., Faircloth, B. C., Remm, M., et al. (2012). Primer3—new capabilities and interfaces. Nucleic Acids Res. 40:e115. doi: 10.1093/nar/gks596
Wang, Q., Garrity, G. M., Tiedje, J. M., and Cole, J. R. (2007). Naïve Bayesian classifier for rapid assignment of rRNA sequences into the new bacterial taxonomy. Appl. Environ. Microbiol. 73, 5261–5267. doi: 10.1128/aem.00062–67
Weimer, P. J. (2015). Redundancy, resilience and host specificity of the ruminal microbiota: Implications for engineering improved ruminal fermentations. Front. Microbiol. 6:296. doi: 10.3389/fmicb.2015.00296
Keywords: subacute ruminal acidosis, rumen, microbiome, ruminal epithelium, bacteria
Citation: McCann JC, Luan S, Cardoso FC, Derakhshani H, Khafipour E and Loor JJ (2016) Induction of Subacute Ruminal Acidosis Affects the Ruminal Microbiome and Epithelium. Front. Microbiol. 7:701. doi: 10.3389/fmicb.2016.00701
Received: 15 January 2016; Accepted: 26 April 2016;
Published: 18 May 2016.
Edited by:
Zhongtang Yu, The Ohio State University, USAReviewed by:
Renee Maxine Petri, University of Veterinary Medicine Vienna, AustriaShengguo Zhao, Institute of Animal Sciences – Chinese Academy of Agricultural Sciences, China
Copyright © 2016 McCann, Luan, Cardoso, Derakhshani, Khafipour and Loor. This is an open-access article distributed under the terms of the Creative Commons Attribution License (CC BY). The use, distribution or reproduction in other forums is permitted, provided the original author(s) or licensor are credited and that the original publication in this journal is cited, in accordance with accepted academic practice. No use, distribution or reproduction is permitted which does not comply with these terms.
*Correspondence: Juan J. Loor, jloor@illinois.edu; Joshua C. McCann, jcmccan2@illinois.edu