 Qusheng Jin
 Matthew F. Kirk
- 1Department of Earth Sciences, University of Oregon, Eugene, OR, USA
- 2Department of Geology, Kansas State University, Manhattan, KS, USA
Geological carbon sequestration captures CO2 from industrial sources and stores the CO2 in subsurface reservoirs, a viable strategy for mitigating global climate change. In assessing the environmental impact of the strategy, a key question is how microbial reactions respond to the elevated CO2 concentration. This study uses biogeochemical modeling to explore the influence of CO2 on the thermodynamics and kinetics of common microbial reactions in subsurface environments, including syntrophic oxidation, iron reduction, sulfate reduction, and methanogenesis. The results show that increasing CO2 levels decreases groundwater pH and modulates chemical speciation of weak acids in groundwater, which in turn affect microbial reactions in different ways and to different extents. Specifically, a thermodynamic analysis shows that increasing CO2 partial pressure lowers the energy available from syntrophic oxidation and acetoclastic methanogenesis, but raises the available energy of microbial iron reduction, hydrogenotrophic sulfate reduction and methanogenesis. Kinetic modeling suggests that high CO2 has the potential of inhibiting microbial sulfate reduction while promoting iron reduction. These results are consistent with the observations of previous laboratory and field studies, and highlight the complexity in microbiological responses to elevated CO2 abundance, and the potential power of biogeochemical modeling in evaluating and quantifying these responses.
Introduction
Geological carbon sequestration is a potential strategy for stabilizing atmospheric CO2 levels despite future increases in fossil fuel combustion (IPCC, 2005). This strategy involves carbon capture—capturing CO2 before its emission into the atmosphere—and geological storage—injecting the CO2 into subsurface reservoirs (Benson and Cole, 2008). The anticipated depth of storage is >800 m, where CO2 can exist in the supercritical state (IPCC, 2005).
Geological carbon storage may negatively affect groundwater resources. CO2 or CO2-rich brine from storage reservoirs can diffuse through overlying caprocks, and migrate into aquifers via faults, fractures, and abandoned wells (Keating et al., 2013, 2014). The migration of CO2 into aquifers can lower groundwater pH, increase salinity, dissolve aquifer minerals, and mobilize hazardous solutes, deteriorating the quality of groundwater (Harvey et al., 2013; Humez et al., 2014; Lions et al., 2014; Shao et al., 2015).
Adding CO2 to aquifers may also adversely affect microorganisms. At pressures of 5–35 MPa, CO2 can interfere with cell metabolism through a variety of mechanisms, including cytoplasm acidification, membrane lysis, enzyme deactivation, and mobilization of toxic trace elements from mineral surfaces (Watanabe et al., 2003; Bertoloni et al., 2006; Oulé et al., 2006; Wimmer and Zarevúcka, 2010; Santillan et al., 2013). But microbes likely persist in aquifers exposed to high CO2 (Kirk et al., 2016a). Many microbes tolerate high CO2, especially those that possess Gram-positive cell walls, grow within biofilms, and form spores (Zhang et al., 2006; Mitchell et al., 2008). In addition, microbes survive better in aquifers capable of rapid pH buffering (Wu et al., 2010). Numerous studies have documented microbes in environments of elevated CO2, even microbial growth in the presence of supercritical CO2 (Yakimov et al., 2002; Inagaki et al., 2006; Videmsek et al., 2009; Oppermann et al., 2010; Emerson et al., 2016; Peet et al., 2015).
However, many questions remain to be addressed. For example, how does CO2 affect the thermodynamics and kinetics of microbial reactions in aquifers? How do CO2 levels control the outcome of the interactions between different microorganisms? Filling these knowledge gaps is important because microorganisms can affect not only the chemical composition of aquifers but also the flow of groundwater (Gerlach and Cunningham, 2010; Flynn et al., 2013). In addition, many microbial reactions also affect the fate of CO2 in aquifers. These reactions consume protons, and hence promote the dissolution and trapping of CO2 gas.
In this study, we use biogeochemical modeling to explore how high CO2 influences microbial reactions and their interactions in aquifers. Our modeling is based on a simple model that mixes CO2 gas into aquifers. Fluxes of CO2 gas into aquifers are a direct result of the CO2 leakage from deep storage (Carroll et al., 2009). During its migration from storage reservoirs to shallow aquifers, total fluid pressure decreases and supercritical CO2 transforms into the phase of gas.
The mixing of CO2 gas into groundwater raises the partial pressure of CO2. We first explore how the increases in CO2 partial pressure impact groundwater chemical properties that are relevant to microbial reactions. We then simulate how the CO2 increase affects the thermodynamics of syntrophic oxidation, iron reduction, sulfate reduction, and methanogenesis, common microbial reactions in the subsurface (Lovley and Chapelle, 1995; Bethke et al., 2011). We also carry out kinetic modeling to test the influence of CO2 on the activities and interactions of aquifer microorganisms. We then compare the modeling results to the observations of previous laboratory and field investigations. The results show that CO2 significantly impacts the thermodynamics and kinetics of microbial reactions, and can change the outcome of microbial interactions.
Methods
Hypothetical Aquifers
The simulation considers the addition of CO2 gas into two hypothetical aquifers, a carbonate-free aquifer and a calcite-rich aquifer (Figure 1). The carbonate-free aquifer has no carbonate mineral, and the calcite-rich aquifer contains abundant calcite as a representative carbonate mineral.
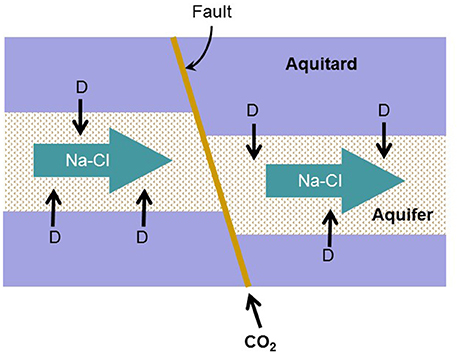
Figure 1. Conceptual model for biogeochemical reaction modeling. Na-Cl-Ca water containing sulfate flows through a quartzite aquifer confined between aquitards. In the aquitards, natural organic matter is degraded to H2 and acetate (D), which diffuse into the aquifer. CO2 from a deep storage reservoir migrates upwards along a fault into the aquifer.
CO2 addition into aquifers raises the partial pressure of CO2. A wide range of CO2 partial pressures are possible, depending on hydrogeological settings and the flux of CO2 (Carroll et al., 2009). The simulation considers the partial pressure from near 0 to 30 atm, the range commonly encountered during groundwater sampling. For example, 95% of the wells in the principal aquifers of the United States analyzed by Kirk et al. (2016b) have depths less than 300 m. At this depth, CO2 can build up to a maximum partial pressure of 30 atm.
The inclusion of the two aquifers is to account for the wide range in the pH buffering of aquifer minerals. Specifically, in groundwater of circumneutral pH, the addition of CO2 induces a hydrolysis reaction:
and decreases groundwater pH. The actual pH decrease depends in part on mineral compositions of aquifers (Gunter et al., 1997; Kampman et al., 2009). For example, carbonate minerals can buffer the change in pH by reacting with protons. A common example is the dissolution of calcite (CaCO3):
Which consumes proton and releases calcium and bicarbonate into groundwater.
Other minerals may also contribute to the buffering of pH. For example, the weathering of silicate minerals, such as feldspars and clay minerals, consumes protons, releasing aluminum and silica into groundwater. These reactions are typically much slower than the dissolution of carbonate minerals and hence not as effective as the dissolution of carbonate minerals in pH buffering (Wilkin and Digiulio, 2010). The sorption of protons onto the surface of clay minerals, metal oxides and hydroxides, and other minerals with large surface areas also consumes protons. Compared to mineral dissolution, proton sorption is relatively insignificant in pH buffering (Lions et al., 2014).
Microbial Reactions
Aquifer microbes can be separated into a series of functional groups, including fermenters, syntrophs, and respirers (Jin and Roden, 2011). Fermenting microbes degrade natural organic matter to a series of products, including H2, short-chain fatty acids (e.g., acetate, lactate, and propionate), and primary alcohols (e.g., methanol and ethanol). Syntrophs oxidize short-chain fatty acids and primary alcohols to acetate and CO2, and transfer the electrons to the reduction of protons to dihydrogen (H2). On the other hand, respirers oxidize the products of organic matter degradation, and transfer the released electrons to the reduction of O2, ferric minerals, sulfate, bicarbonate, and other electron acceptors.
The redox reactions catalyzed by syntrophs and respirers can be represented as:
where D and D+ are electron donors and their oxidized forms, respectively, A and A− are electron acceptors and their reduced forms, respectively, and νD and others are stoichiometric coefficients. In microbiology and biochemistry, the thermodynamics of redox reactions is commonly characterized using reduction potential. Specifically, for the redox couple of D and D+, the reduction potential ED (V) is calculated according to:
for the redox couple of A and A−, the reduction potential EA is calculated as:
Here and are standard potentials at pH 7, n is the number of electrons transferred per reaction, γD and others are activity coefficients (M−1), mD and others are molal concentrations, R is the gas constant (J · mol−1 · K−1), F is the Faraday's constant, and T is the absolute temperature (K). Table 1 lists the reduction reactions of redox couples commonly found in aquifers and the standard reduction potentials ( and ) at 1 atm, 25°C, and pH 7. For the purpose of comparing stoichiometric coefficients of proton and bicarbonate, the reactions are written in terms of 8 electrons (n = 8).
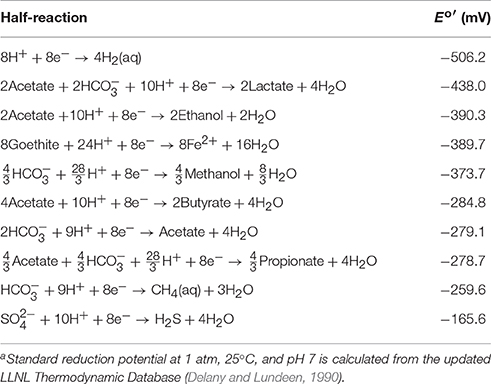
Table 1. Reduction reactions of common electron donors and acceptors in aquifers, and their standard reduction potentials Eo′ at pH 7a.
By transferring electrons, syntrophs and respirers liberate the chemical energy from redox reactions, which becomes available to their metabolisms. The available energy ΔGA [J · (mol reaction)−1, or J · mol−1] is the negative of the Gibbs free energy change of redox reactions, and is calculated from:
the difference in the reduction potentials between electron acceptors EA and donors ED. Table 2 lists the standard available energy at 1 atm, 25°C, and pH 7 for common redox reactions in aquifers. Following previous practice (Bethke et al., 2011; Jin, 2012), we compute the energy available from microbial reactions that transfer 8 electrons, or the consumption of one acetate or four dihydrogen molecules (Table 2).
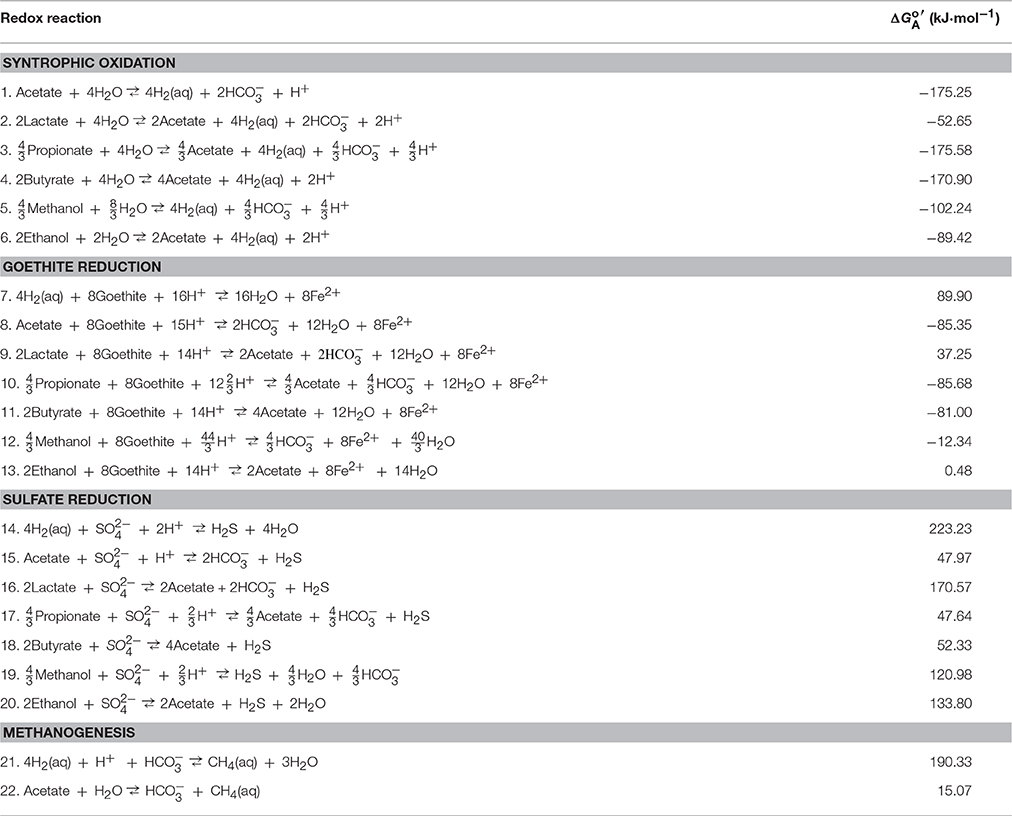
Table 2. Redox reactions, and their standard available energy at pH 7, 1 atm and 25°C.
The rate r (mol · L−1 · s−1) of microbially-driven redox reactions can be calculated according to the thermodynamically consistent rate law (Jin and Bethke, 2003, 2005, 2007):
where k is the rate constant [mol · (g dry weight)−1 · s−1, or mol · g−1 · s−1], [X] is the biomass concentration [g dry weight · L−1, or g · L−1], FD and FA are the kinetic factors of electron donor and acceptor, respectively, and FT is the thermodynamic potential factor. The kinetic factors are calculated according to:
and
where KD and KA are the half-saturation constants (M) for electron donor D and acceptor A, respectively. The thermodynamic factor is calculated according to:
where ΔGC (J · mol−1) represents the energy saved by microbes, and χ is the average stoichiometric number. The saved energy ΔGC is calculated as:
the product of the ATP yield mP of microbial reaction and the phosphorylation energy ΔGP. The phosphorylation energy is the energy required to synthesize ATP from ADP and phosphate in the cytoplasm. In this study, its value is taken as 45 kJ · (mol ATP)−1 (Jin, 2012).
For microbial reduction of ferric minerals, its rate depends on the molal concentration msurf, avail of bioavailable surface sites of the minerals. According to Roden (2006), the rate can be calculated according to:
where ksurf is the bioavailable site-specific rate constant (s−1), and is a constant in g cell dry weight per mol bioavailable surface sites (g · mol−1).
Syntrophs and respirers utilize the saved energy ΔGC to synthesize biomass. The rate at which the biomass concentration [X] changes with time is:
where μ is the specific growth rate (s−1), and D is the specific rate of maintenance (s−1). The specific growth rate μ is calculated according to:
Here Y is the growth yield, the grams of biomass synthesized per mol reaction (g · mol−1).
Model Implementation
We carried out the simulation using the React program of the software package Geochemist's Workbench version 9.0 (Bethke, 2008). The simulation assumes that aqueous chemical speciation, mineral dissolution and precipitation, and ion sorption are at thermodynamic equilibrium, and describes these reactions on the basis of the updated LLNL Thermodynamic Database (Delany and Lundeen, 1990). This database was modified to include amorphous iron sulfide (solubility product of 10−2.96) (Langmuir, 1997), and goethite (solubility product of 101.40) (Bigham et al., 1996). The activity coefficients are calculated according to an extended form of the Debye-Hückel equation (Helgeson, 1969).
The simulation describes the sorption of ferrous iron onto the surface of goethite using non-electrostatic Langmuir isotherm (Stumm and Morgan, 1996). Specifically, the sorption reaction is:
where >FeOH represents the native surface site available to bioreduction, and >FeOFe+ is ferrous iron surface species. The logarithmic equilibrium constant of the reaction is −2.5 (Appelo et al., 2002). The concentrations of the surface sites are calculated by taking a standard site density of 3.84 × 10⁻⁶ mol × m−2 (Davis and Kent, 1990) and a specific surface area of 225 m2 × g−1 for goethite (Roden, 2004). The concentration msurf, avail of bioavailable surface site is calculated as the difference in concentration between the total surface sites and those occupied by ferrous iron.
Results and Discussion
Groundwater Chemistry
The simulation assumes that both the hypothetical carbonate-free and calcite-rich aquifers contain the same Na-Cl-Ca type groundwater. According to Kirk et al. (2016b), in 18 principal aquifer systems of the United States, Ca2+ has an average concentration of 1.4 mM, and four aquifer systems have average pH values near 8.0. Thus, the simulation assumes that groundwater in the two hypothetical aquifers has pH of 8 and contains 10 mM Na+, 10 mM Cl−, and 2.0 mM Ca2+.
The simulation also assumes that in both aquifers, the groundwater is equilibrated with the precipitation or dissolution of calcite. Under this assumption, in both aquifers, the partial pressure of CO2 is 3.1 × 10⁻⁴ atm, and the dissolved inorganic carbon occurs mainly as bicarbonate (0.5 mM), dissolved CO2 (0.01 mM), and a calcium-bicarbonate complex species (0.01 mM). Figures 2–4 show, according to the simulation results, how the groundwater chemistry responds to the addition of CO2 gas into the aquifers.
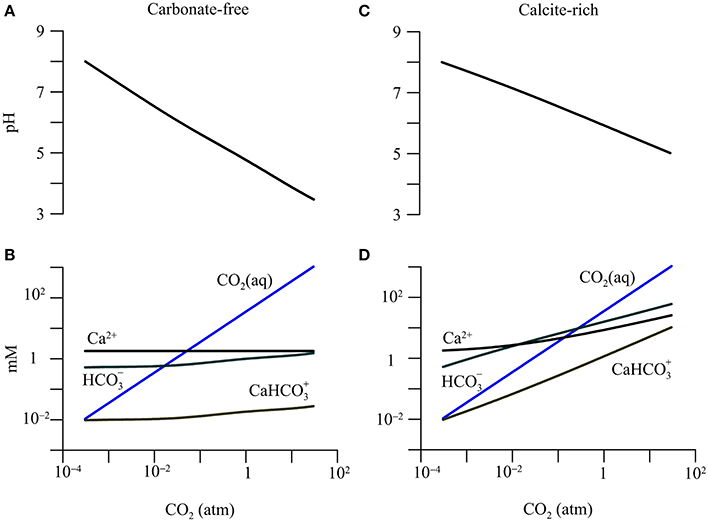
Figure 2. Variations in pH and concentrations of calcium (Ca2+), dissolved CO2(aq), bicarbonate (), and calcium-bicarbonate complex () with CO2 partial pressure in a hypothetical carbonate-free (A,B) and calcite-rich aquifer (C,D).
pH and Inorganic Carbon
The addition of CO2 lowers groundwater pH and raises the concentration of dissolved CO2 (Figure 2). Specifically, in the carbonate-free aquifer, where the partial pressure increases to 30 atm, pH decreases to 3.5, and dissolved CO2 concentration increases to 1.06 M. But there is relatively little increase in the concentration of bicarbonate or the calcium-bicarbonate complex ().
In the calcite-rich aquifer, the increase in CO2 partial pressure to 30 atm also raises the concentration of dissolved CO2 to 1.06 M, but lowers groundwater pH only to 5. In addition, the concentrations of bicarbonate and increase to 60.5 mM and 10.4 mM, respectively.
The different responses of the two aquifers arise from CO2-induced dissolution of calcite. In the carbonate-free aquifer, the simulation does not consider any reaction that consumes protons. As a result, most of the protons generated by CO2 addition and hydrolysis largely stay in the groundwater, lowering pH significantly. In comparison, in the calcite-rich aquifer, protons react with calcite, which buffers the decrease in pH, and adds bicarbonate and calcium to the groundwater (Equations 1 and 2).
In addition to pH buffering, the pH decrease by CO2 addition also depends on the pressure, temperature, and salinity of subsurface fluids. The solubility of CO2 increases with pressure, and thus depth, but decreases with temperature and salinity (Benson and Cole, 2008). Nevertheless, the simulation results agree with previous assessment. For example, several field and laboratory studies reported that CO2 addition decreased groundwater pH by 0.8–2.9 units (Lions et al., 2014). Similarly, geochemical modeling analysis indicated that, during the CO2 injection experiment in the Frio Formation, the in situ pH of groundwater decreased from about 6.5 to 3 (Kharaka et al., 2006).
Aqueous Speciation
The pH decrease in groundwater has a direct impact on the speciation of dissolved chemicals. Figure 3 shows how CO2 changes the relative abundances of acetate, lactate, propionate, butyrate, monohydrogen sulfide (HS−), and their conjugate acids in the two hypothetical aquifers.
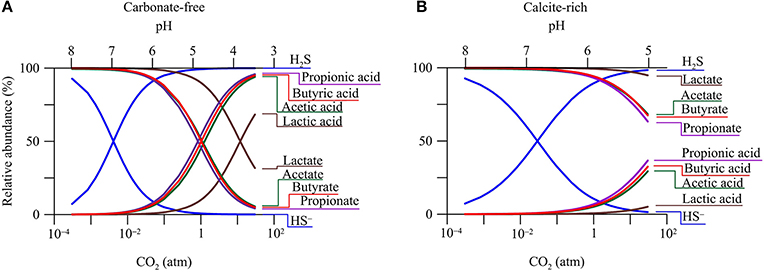
Figure 3. Variations in relative abundances of monohydrogen sulfide (HS−), acetate, lactate, propionate, butyrate, and their conjugate acids with CO2 partial pressure in a hypothetical carbonate-free (A) and calcite-rich aquifer (B).
The response of aqueous speciation is more pronounced in the carbonate-free aquifer than in the calcite-rich aquifer. In the carbonate-free aquifer (Figure 3A), the relative abundances of different acids increase, while those of the conjugate bases decrease, with the increase in CO2 partial pressure. The appearance of the cross-over points for the acids and their conjugate bases follows the sequence of acidity constant. Among these acids, dihydrogen sulfide (H2S) has the largest logarithmic acidity constant (pKa) of 7.0 (Lide, 2003), and H2S and HS− reach equal concentrations where CO2 partial pressure increases to 4.0 × 10⁻³ atm, and groundwater pH decreases to 7.0. On the other hand, lactic acid has the smallest pKa of 3.86, and lactic acid and lactate take the same concentration where CO2 partial pressure reaches 12 atm, and groundwater pH drops to 3.86.
In the calcite-rich aquifer (Figure 3B), the speciation of dihydrogen sulfide shows significant variations. At CO2 partial pressure of 2.9 × 10⁻² atm and pH of 7, the two species have the same concentration. The speciations of acetic acid, propionic acid, and butyric acid also respond to the increase in CO2 partial pressure, but to much lesser extents. These acids occur at notable concentrations, only after CO2 partial pressure increases to over 1 atm and pH decreases to 6. These modest responses reflect the limited decrease in groundwater pH (Figure 2C).
Ionic Strength and Activity Coefficient
In the calcite-rich aquifer, CO2 addition raises the ionic strength of the groundwater (Figure 4A). Where CO2 partial pressure increases from 3.1 × 10⁻⁴ to 30 atm, the ionic strength increases from 16.6 to 100 mM. This increase is mainly due to increases in the concentrations of Ca2+ and bicarbonate by the dissolution of calcite (Figure 2D). In comparison, in the carbonate-free aquifer, the ionic strength of groundwater remains nearly constant with the increase in CO2 partial pressure (data not shown).
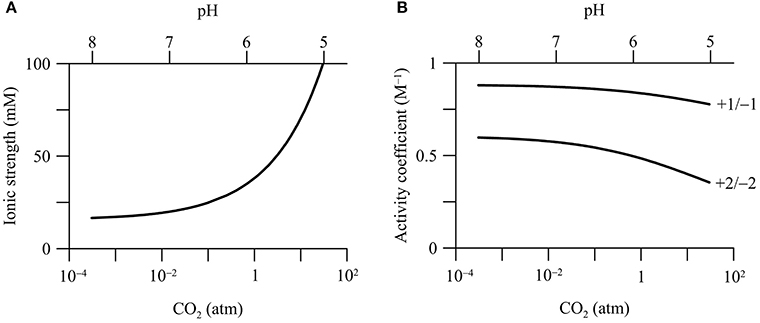
Figure 4. Variations in the ionic strength of groundwater (A) and the activity coefficients of ions (B) with CO2 partial pressure in a hypothetical calcite-rich aquifer. Labels show the charges of ions.
Increases in the ionic strength are commonly observed in previous field investigations. For example, Kharaka et al. (2010), Trautz et al. (2013) and Cahill et al. (2013) all reported temporary increases in the electrical conductivity and the concentrations of bicarbonate, Ca2+, and other ions during the injection of CO2 into shallow aquifers. Note that in our simulation, the increase of the ionic strength is due to calcite dissolution. Other factors, such as sorption reactions and mixing with deep reservoir fluids, can also raise groundwater ionic strength (Jones et al., 2015).
Ionic strength controls the thermodynamic properties of dissolved chemical species, which can be quantified using activity coefficient (see Equations 4 and 5). Among different approaches, the extended Debye-Hückel equation, or the B-dot equation, represents a robust choice for Na/Cl-dominated groundwater with ionic strength up to 2 molal (Helgeson, 1969). According to the B-dot equation, activity coefficients depend significantly on the ionic strength and the charges of chemical species. Figure 4B shows that the activity coefficients of ions decrease with the increases in CO2 partial pressure in the calcite-rich aquifer. For chemical species with +1 or −1 charge, where CO2 partial pressure increases from near 0 to 30 atm, the activity coefficients decrease by about 0.1, from near 0.89 to 0.77. For those with +2 or −2 charge, the activity coefficients decrease by about 0.2, from near 0.6 to 0.4. For neutral chemical species, the activity coefficients are set at unity, and do not vary with the ionic strength.
Reduction Potential
The above geochemical variations place a fundamental constraint on the reduction potentials of redox couples in microbial reactions. Here we focus on the electron donors produced by the degradation of natural organic matter, including dihydrogen, acetate, lactate, propionate, butyrate, methanol, and ethanol, and consider the common electron acceptors in aquifers, such as goethite, sulfate, bicarbonate, and proton (Lovley and Chapelle, 1995; Bethke et al., 2011).
We compute the changes in reduction potentials with CO2 partial pressures, not their absolute values, in order to highlight the responses of redox couples and to compare the responses among different redox couples. Using the changes, not absolute values, also avoids the need of absolute concentrations of electron donors, acceptors, and reaction products. In aquifers, there are few concentration measurements for lactate, propionate, butyrate, methanol, and ethanol. On the other hand, the concentrations of ferrous iron, sulfate, sulfide, and bicarbonate vary over orders of magnitude (Kirk et al., 2016b). Using the changes also simplifies the discussion of ferric mineral reduction. There are different ferric minerals in aquifers, such as ferrihydrite, goethite, hematite, and lepidocrocite. Their reduction potentials are different (Cornell and Schwertmann, 2003), but respond in the same fashion to pH, because the reduction of these ferric minerals consumes the same number of protons per electron. Here we take goethite as an example, but the results are applicable to ferrihydrite, hematite, and lepidocrocite.
Figure 5 shows, according to the simulation results, how the reduction potentials respond to CO2 partial pressure in both the carbonate-free and calcite-rich aquifers. The reduction potentials increase with CO2 partial pressures. For the redox couples considered by this study (see Table 1), their reduction reactions consume protons and, as a result, their reduction potentials increase with the decrease in groundwater pH (Equations 4 and 5).
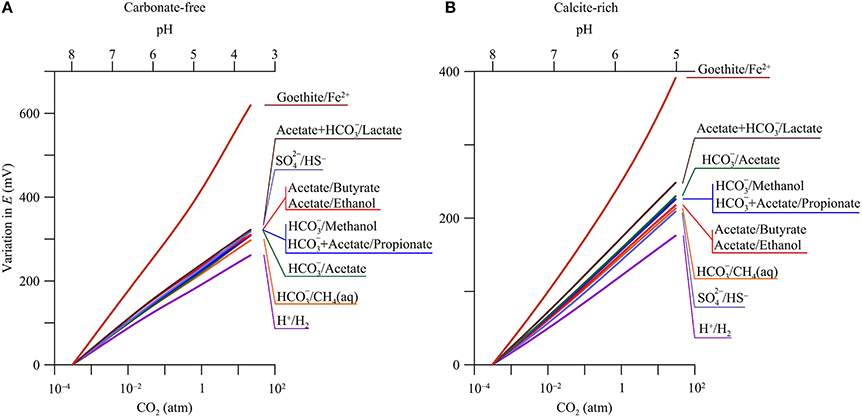
Figure 5. Variations in reduction potentials E of redox couples with CO2 partial pressure in a hypothetical carbonate-free (A) and calcite-rich aquifer (B). Labels show the redox couples; see Table 1 for reduction reactions.
Carbonate-Free Aquifer
In the carbonate-free aquifer, the changes in reduction potentials depend primarily on the stoichiometric coefficients of protons in the reduction reactions (Table 1). For example, the reduction of H+ to H2 consumes 8 protons per 8 electrons, while the reduction of Fe2+ to goethite consumes 24 protons per 8 electrons. As a result, the increase in the reduction potential of the redox couple of H+/H2 is the smallest, 267.8 mV, while the increase for the couple of Fe2+/goethite is the largest, 639.5 mV. For other redox couples, their reduction reactions consume 9–10 protons per 8 electrons, close to the stoichiometric coefficient of protons in the redox couple of H+/H2. As a result, the changes in the reduction potentials of these redox couples are larger than, but close to, the change in the potential of H+ reduction to H2.
Calcite-Rich Aquifer
Compared to those in the carbonate-free aquifer, the increases in reduction potentials are relatively small in the calcite-rich aquifer. Where CO2 partial pressure increases from near 0 to 30 atm, the reduction potential of H+/H2 increases by 176.1 mV, and that of Fe2+/goethite increases by 391.2 mV. These small increases arise from the limited decrease in pH (Figure 2C).
For the redox couples of acetate, lactate, propionate, and methanol, their reduction reactions consume bicarbonate (Table 1). As a result, their reduction potentials also vary with bicarbonate concentration or activity. Where CO2 partial pressure increases from near 0 to 30 atm, the concentration and hence activity of bicarbonate increases by about one order of magnitude (Figure 2D). The stoichiometric coefficient of bicarbonate varies from 1 per 8 electrons in the reduction reaction of bicarbonate to methane to 2 per 8 electrons in the reduction reactions of acetate and lactate. As a result, the increases in the reduction potentials of acetate and lactate with CO2 partial pressure are faster than that of /methane (Figure 5B).
Available Energy
The available energy is a key geochemical parameter that controls both the rates of microbial reactions and the growth of functional groups (Jin, 2012). We compute the energy available from the reduction potentials of electron donors and acceptors according to Equation 6. The calculation focuses on the common functional groups in aquifers, including syntrophs, ferric iron reducers, sulfate reducers, and methanogens (Table 2). As in the above case of reduction potentials, our calculation focuses on the variations in the available energy with CO2 partial pressure, in order to highlight the responses of microbial reactions. Figure 6 shows how the energy available to the microbial functional groups responds to the increase in CO2 partial pressure.
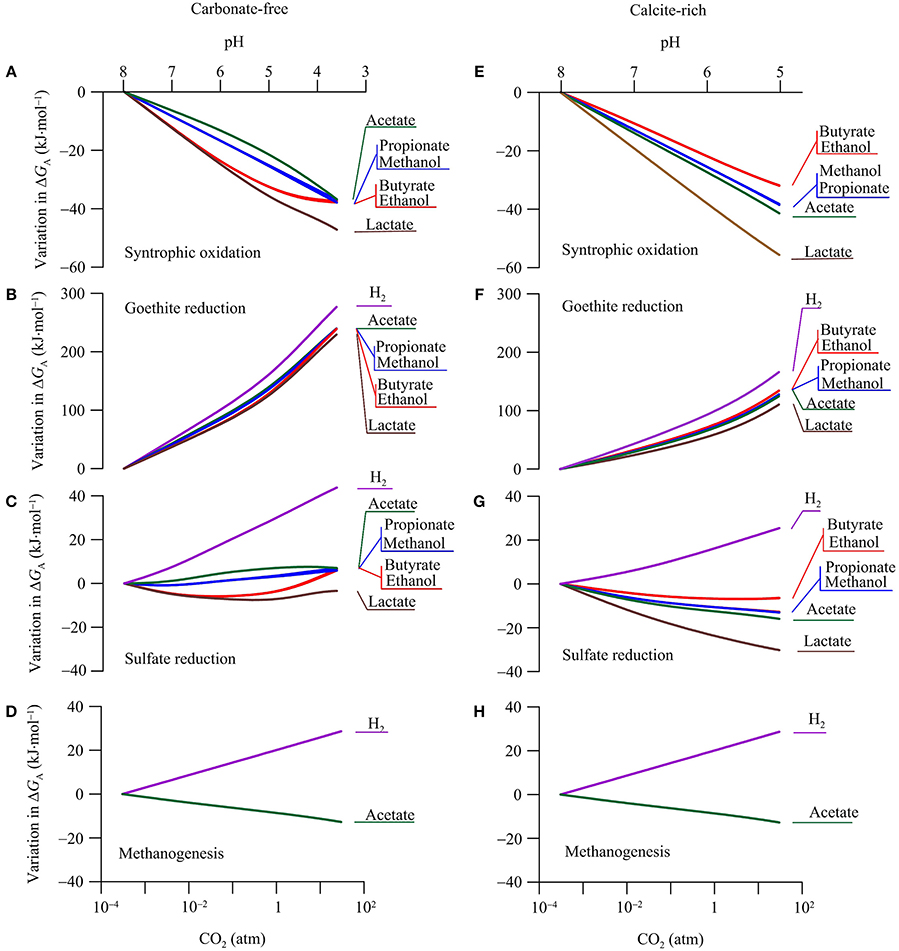
Figure 6. Variations in the available energy ΔGA of syntrophic oxidation, goethite reduction, sulfate reduction, and methanogenesis in a hypothetical carbonate-free (A–D) and calcite-rich (E–H) aquifer. Labels show the electron donors of redox reactions; see Table 2 for reaction equations.
Syntrophs
Syntrophs use organic compounds as electron donors and protons as an electron acceptor (Table 2). The above analysis shows that, in the two hypothetical aquifers, CO2 addition raises the reduction potentials of organic compounds faster than that of protons (Figure 5). As a result, the increases in CO2 partial pressure lower the available energies of syntrophic oxidations (Equation 6, Figures 6A,E).
Variations in the available energy can also be interpreted in terms of reactants and products, including proton, acetate, and bicarbonate. For example, protons are produced in the syntrophic oxidation reactions (Table 2). In both the carbonate-free and calcite-rich aquifers, CO2 addition decreases groundwater pH (Figures 2A,C), thereby lowering the available energy. Because of the difference in the pH decrease between the two aquifers, the available energy also decreases to different extents. Taking as examples the syntrophic oxidation of butyrate and ethanol, the available energy decreases more significantly in the carbonate-free aquifer than in the calcite-rich aquifer.
In the carbonate-free aquifer, for both butyrate- and ethanol-oxidizing syntrophs, the variations in the available energy level off at CO2 partial pressures greater than 1 atm. This is because the syntrophic oxidation of butyrate and ethanol produces acetate (Table 2). The increase in CO2 partial pressure decreases groundwater pH, which in turn decreases the concentration of acetate (Figure 3). At CO2 partial pressures above 1 atm, pH decreases below 5, and acetate concentration is less than half of the total concentration of acetate and acetic acid (Figure 3A). The decrease in acetate concentration increases the energy available to butyrate- and ethanol-oxidizing syntrophs, which counteracts the decreases in the available energy by the pH decrease.
On the other hand, in the carbonate-rich aquifer, the available energy of butyrate- and ethanol-oxidizing syntrophs decreases steadily with the increase in CO2 partial pressure. This is due to the modest pH decrease in this aquifer. At CO2 partial pressure of 1 atm, groundwater pH is about 6, and compared to acetic acid, acetate still remains as the dominant form (Figure 3B).
The syntrophic oxidation of acetate, lactate, propionate, and methanol produces bicarbonate (Table 2). As a result, the energy released by these reactions also depends on the concentrations of bicarbonate; an increase in bicarbonate concentration decreases the available energy. In the calcite-rich aquifer, the decrease in pH is less than that in the carbonate-free aquifer, but the increase in bicarbonate concentration is more significant than in the carbonate-free aquifer (Figure 2). Overall, the effect of increasing bicarbonate concentrations takes its toll, leading to greater decreases in the available energies in the calcite-rich aquifer than in the carbonate-free aquifer.
Iron Reducers
In both aquifers, the increases in CO2 partial pressure raise the reduction potential of ferric iron much faster than those of electron donors (Figure 5). As a result, the energy available to iron reducers increases significantly with the increase in CO2 (Figures 6B,F).
Like in the above cases of syntrohic oxidations, pH is also a key parameter in determining the available energy. But in the reduction reactions of goethite (Table 2), protons are the reactants and, as a result, the available energy increases with the decrease in pH. Also because the pH decrease is larger in the carbonate-free aquifer than in the calcite-rich aquifer, the increase in the available energy is more significant in the carbonate-free aquifer than in the calcite-rich aquifer.
In both aquifers, the increase in the available energy varies among different electron donors. Specifically, the increase is most significant for H2 oxidation, and least significant for lactate oxidation to acetate. This difference arises from the different stoichiometric coefficients of protons in goethite reduction coupled to the oxidation of different electron donors. The stoichiometric coefficient of protons in H2 oxidation is the largest, while that in lactate oxidation to acetate is the smallest (Table 2).
Sulfate Reducers
For sulfate reducers, changes in energy available in response to CO2 addition are mixed (Figures 6C,G). Adding CO2 increases the reduction potentials of sulfate and electron donors in both the carbonate-free and calcite-rich aquifers. Because the slopes of increases are similar (Figure 5), the addition of CO2 has minimal impact on energy available.
In the calcite-free aquifer (Figure 6C), only the available energy of H2-oxidizing sulfate reducers increases notably in response to the CO2 increase. Where CO2 partial pressure increases from near 0 to 30 atm, the available energy increases by 43.8 kJ·mol−1. For sulfate reducers that oxidize other electron donors, their available energy responds to the CO2 increase, but only marginally. Specifically, for sulfate reducers that oxidize acetate, propionate, and methanol, increases in available energy are less than 7.0 kJ·mol−1. For sulfate reducers that oxidize lactate, butyrate, and ethanol, their available energy first decreases with CO2 leakage and then increases, but variations remain less than 7.0 kJ·mol−1.
These variations in available energy can be accounted for using reactants and products of sulfate reduction reactions. Specifically, sulfate reduction by the oxidation of H2, acetate, propionate, and methanol consumes protons (Table 2). As a result, the available energy increases with the decrease in pH, and the significance of the increase depends on the stoichiometric coefficients of protons. Hydrogenotrophic sulfate reduction consumes most protons, and its available energy increases most significantly with the increase in CO2 partial pressure. In comparison, in sulfate reduction by the oxidation of acetate, propionate, and methanol, the stoichiometric coefficients of protons are relatively small, and the increases in available energy in response to decreasing pH are also small.
For acetate-oxidizing sulfate reduction, the increase in the available energy is further limited by the speciation of acetate and acetic acid. As shown in Figure 3A, at CO2 partial pressure above 1 atm, increase in the partial pressure decreases significantly acetate concentration, thereby decreasing the available energy.
For sulfate reduction that oxidizes lactate, butyrate, and ethanol, the initial decrease in the available energy can be explained by the production of protons under circumneutral pH condition. In writing the reaction equations for sulfate reduction, we assume that dihydrogen sulfide (H2S) is the main species of dissolved sulfide. Under this assumption, no proton is consumed by these reactions (Table 2). But under circumneutral pH conditions, a significant fraction of dissolved sulfide also occurs as monohydrogen sulfide (HS−) (Figure 3A). If we replaced H2S with HS− in the reaction equations, sulfate reduction by the oxidation of lactate, butyrate, and ethanol would generate protons. This explains the slight decreases in the available energy at the beginning of the CO2 increase, where pH of the groundwater is close to 7.
At CO2 partial pressure above 0.1 atm, the CO2 increase starts to turn groundwater from circumneutral to slightly acidic (pH < 6). Under this condition, H2S becomes the only dominant sulfide species, no proton is produced by sulfate reduction, and the available energy is no longer dependent on pH.
At pH below 6, because of the pH control on aqueous speciation (Figure 3A), the decrease in pH also starts to significantly lower acetate concentration. This explains the slight increase in available energy with increasing CO2 partial pressure. Note that the speciation effect is relatively small for sulfate reduction by lactate oxidation. This is because lactate oxidation produces acetate, and the concentrations of both acetate and lactate decreases with the increase in CO2 partial pressure.
In the calcite-rich aquifer (Figure 6G), the energy available to hydrogenotrophic sulfate reducers increases with the increase in CO2 partial pressure. For sulfate reducers using other electron donors, their available energy consistently decreases with the increase of CO2. In this aquifer, variations in the available energy result from significant changes in both bicarbonate concentration and pH (Figures 2C,D). Specifically, as discussed for the carbonate-free aquifer, under circumneutral pH condition, sulfate reduction by the oxidation of short-chain fatty acids and primary alcohols generates protons, and thus the available energy decreases with the increase in CO2 partial pressure. For sulfate reduction that oxidizes acetate, lactate, propionate, and methanol, the available energy is further decreased by the significant increase in bicarbonate concentrations.
Methanogens
The simulation results show that in both the carbonate-free and calcite-rich aquifers, the available energy of hydrogenotrophic methanogenesis increases with the increase of CO2 partial pressure, while that of acetoclastic methanogenesis decreases with the CO2 increase (Figures 6D,H). The difference between the responses of the two pathways arises from the dependence of the available energy on both pH and the concentrations of acetate and bicarbonate in the groundwater. For hydrogenotrohic methanogenesis, it utilizes protons and bicarbonate as substrates, and hence its available energy increases with the decrease in pH and the increase in bicarbonate concentration. For acetoclastic methanogenesis, its available energy depends on the concentrations of acetate and bicarbonate. In the calcite-rich aquifer, the increase in CO2 partial pressure raises significantly bicarbonate concentrations, thereby decreasing the energy available to acetoclastic methanogens. On the other hand, in the carbonate-free aquifer, the significant decrease in pH by the CO2 increase converts acetate to acetic acid (Figure 3A), which also decreases the available energy.
Microbial Kinetics
The above simulations demonstrate that the mixing of CO2 into groundwater increases or decreases the available energy of different microbial reactions to different extents (Figure 6). The available energy controls metabolic rates of microbial functional groups (Jin and Bethke, 2007). According to the thermodynamically consistent rate law (Equations 7, 10, 13, and 14), increases in the available energy increase non-linearly the rate of microbial respiration and hence the rate of microbial growth. On the other hand, decreases in the available energy decrease the rates of microbial respiration and growth. Therefore, we predict that the addition of CO2 into aquifers may accelerate some microbial reactions, but impede the progress of others.
We take as examples microbial sulfate reduction and iron reduction, and apply kinetic modeling to microbial reactions under the influence of CO2 addition. Our goal is not to describe CO2 leakage from a specific reservoir or into a specific aquifer, but to test the prediction that adding CO2 into aquifers modulates the rates of microbial reactions. For this reason, we adopt the following assumptions and simplifications:
First, we simulate geochemical and microbial reactions within a unit volume of the hypothetical calcite-rich aquifer using a flush model (Bethke, 2008). This model is analogous to a chemostat reactor (Tempest, 1970). At each time step of the simulation, a given volume of fresh groundwater is poured into the aquifer, while the same amount of the existing groundwater is removed. Chemostat reactors are often characterized using dilution rate. The simulation assumes that the aquifer has a dilution rate of 10 yr−1, which corresponds to a groundwater flow of 1 m·yr−1, a typical value for confined aquifers (Chapelle, 2001).
Second, we are interested in CO2 leakage during long-term carbon storage. The Intergovernmental Panel on Climate Change recommended that geological carbon storage should store CO2 in periods of centuries to millennia (IPCC, 2005). Thus, we set the simulation time at 800 years. The simulation breaks into two phases (Figure 7). During the first 400 years, CO2 from deep reservoirs migrates upwards toward the aquifer, but has not reached the aquifer yet. The duration of 400 years is long enough to ensure that microbial metabolisms reach steady state. In the second phase between 400 and 800 years, CO2 from the deep reservoirs mixes into the groundwater, raising the partial pressure of CO2 linearly to 30 atm at year 800.

Figure 7. Variations with time in CO2 partial pressure (A) and pH (B) in a hypothetical calcite-rich aquifer.
Third, simulating microbial reactions requires a series of microbial kinetic, growth, and thermodynamic parameters (Jin and Roden, 2011; Jin et al., 2013). We assume that the values of microbial parameters do not change with environmental conditions, including pH and CO2 abundance, and assign the values of microbial parameters on the basis of previous studies (see Table 3). These values have been applied successfully to aquifers (Bethke et al., 2008; Jin and Roden, 2011). The simulation assumes that in the aquifer, H2 and acetate, the main products of natural organic matter degradation (McMahon and Chapelle, 1991; Lovley et al., 1994), are produced at the same rate of 1.0 μmol · L−1 · yr−1. There are few measurements of H2 and acetate production in aquifers, and the equal rates are purely assumptive. Nevertheless, the assumed rates are within the ranges reported for aquifers (Chapelle, 2001; Park et al., 2006).
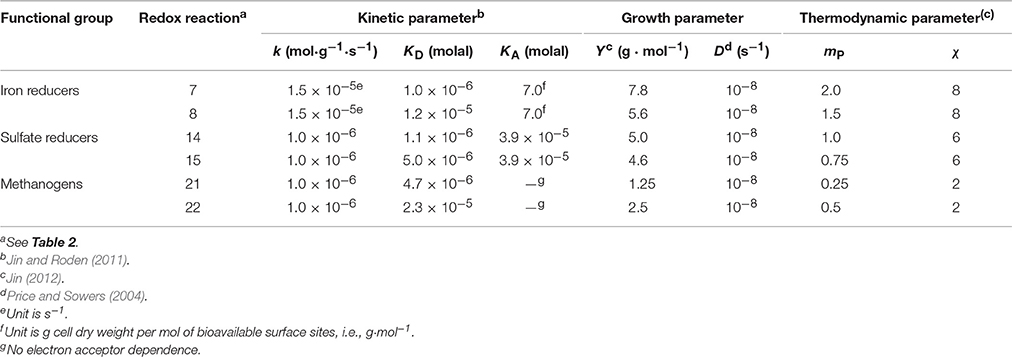
Table 3. Kinetic parameters (rate constant k, and half-saturation constant KD and KA), growth parameters (growth yield Y and specific maintenance rate D), and thermodynamic parameters (ATP yield mP and average stoichiometric number χ) of microbial functional groups.
The simulation also assumes that the half-saturation constants describe the efficiency of microbes in utilizing the total dissolved electron donors or acceptors, not any specific chemical species. In other words, in computing kinetic factors (Equations 8 and 9), we only account for the total dissolved electron donors and acceptors, or the sum of the concentrations of acids and their conjugate forms.
We carried out the simulation by seeding sulfate and iron reducers with an initial biomass concentration of 1.0 ng · L−1. As shown above (Figures 2–4), adding CO2 into aquifers can significantly change the chemistry of groundwater. Specifically, at the time of year 400, where CO2 starts to mix into the aquifer, groundwater pH decreases immediately from 8 to about 6 (Figure 7B). Afterwards, pH decreases gradually to 5 over the next 400 years. The sharp decrease in pH reflects the fact that a pH drop from 8 to 6 only requires the production of about 1 μM of protons in the groundwater. In the hypothetical calcite-rich aquifer, a relatively small increase in CO2 partial pressure from near 0 to 1 atm is sufficient to generate 1 μM of protons (Figure 2C). The subsequent gradual pH decrease can be explained by relatively large change in proton concentrations. An decrease in pH from 6 to 5 requires the production of about 10 μM of protons, which can be generated by raising the partial pressure from 1 to 30 atm and by the simutaneous dissolution of CO2 gas and calcite mineral into the groundwater.
Sulfate Reduction
The above thermodynamic analysis suggests that in the hypothetical calcite-rich aquifer, high CO2 may promote hydrogenotrophic sulfate reduction, but inhibit sulfate reducers that oxidize acetate (Figure 6G). We test this prediction by simulating both hydrogenotrophic and acetotrophic sulfate reduction in the aquifer. We assume that sulfate and sulfide in the incoming groundwater have a concentration of 1 mM and 10 μM, respectively. The assumed sulfate concentration is much larger than the half-saturation constant of sulfate reduction (see Table 3), in order to eliminate the limitation of sulfate and to ensure that the two sulfate reducers do not compete with each other for sulfate.
The simulation results suggest that both hydrogenotrophic and acetotrophic sulfate reduction persist in the first simulation phase of 0–400 years (Figure 8), and the hypothetical aquifer can be described as a redox zone of sulfate reduction (Bethke et al., 2011). Specifically, sulfate reduction reaches a steady state after 30 years into the simulation. At steady state, the groundwater contains 13 nM H2 and 0.02 mM acetate, the hydrogenotrophic and acetotrophic sulfate reducers grow to a biomass concentration of 3.4 and 9.6 μg · L−1, respectively, and the rates of sulfate reduction by oxidizing H2 and acetate are 0.2 and 0.8 μmol· L−1 · yr−1, respectively. Assuming that one cell weighs 10−12 g, the hydrogenotroph and acetotroph have a concentration of 3.4 × 10⁶ and 9.6 × 10⁶ cell · L−1, respectively.
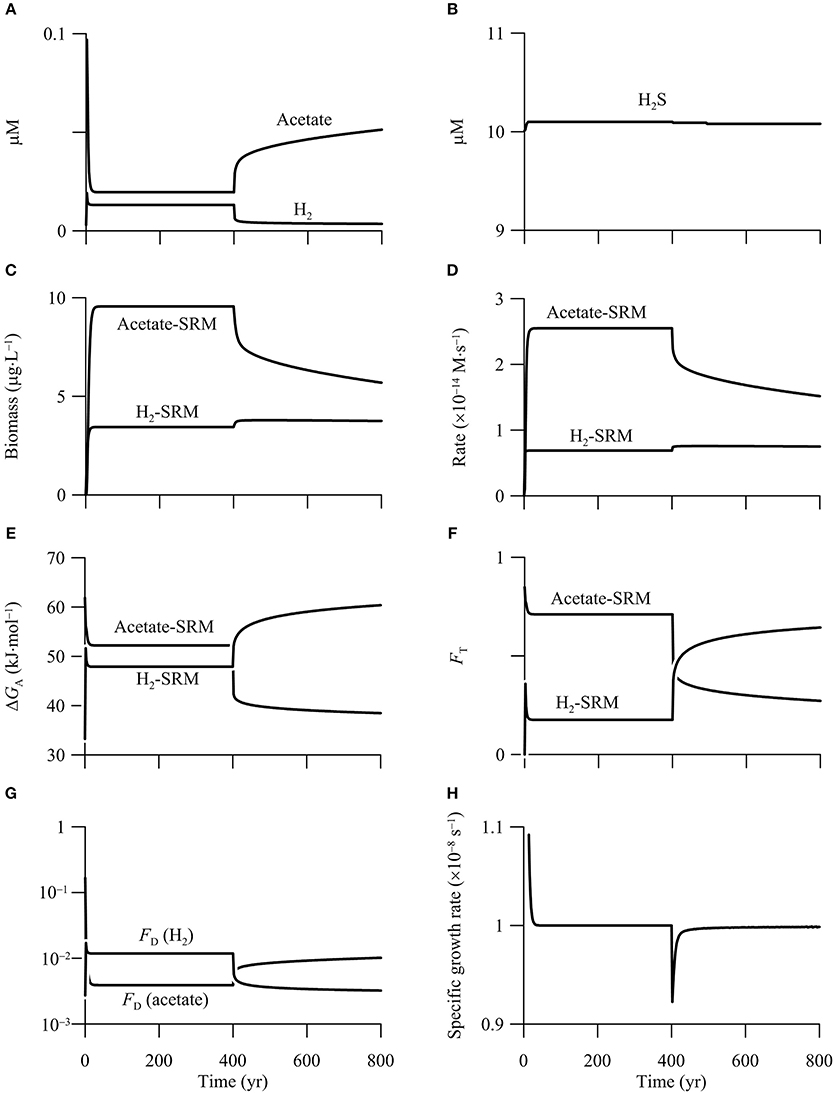
Figure 8. Variations with time in the concentrations of H2, acetate (A), and sulfide (B), the biomass concentrations of sulfate reducing microbes (SRM) (C), the rates of sulfate reduction (D), the energy available to sulfate reducers (E), the thermodynamic factor FT (F), the kinetic factor of H2 and acetate FD (G), and specific growth rate of acetotrophic sulfate reducer (H) in a hypothetical calcite-rich aquifer.
Although our simulation does not target a specific aquifer, both the predicted cell concentrations and sulfate reduction rates fall within the ranges of confined aquifers. For example, Dockins et al. (1980) applied a synthetic growth medium and the method of Most Probable Number (MPN) to the aquifers of the Northern Powder River Basin, Montana, USA, and reported that sulfate reducers ranged from 20 to >2.4 × 10⁵ cell · L−1. Because the MPN method likely underestimated cell concentration by two to three orders of magnitude (Vester and Ingvorsen, 1998), the actual concentrations might have ranged from 1000 to 108 cell · L−1.
Previous experimental studies analyzed sulfate reduction rates using 35S as a radiotracer. In the same study of Dockins et al. (1980), they determined a sulfate reduction rate of 42.8 μmol · L−1 · yr−1. Phelps et al. (1994) reported that sulfate reduction rates ranged from <0.1 to 34 μmol · L−1 · yr−1 in the Atlantic Coastal Plain aquifers. Sulfate reduction rates can also be estimated using geochemical reaction modeling. Thorstenson et al. (1979) estimated a sulfate reduction rate of 0.16 μmol · L−1 · yr−1 in the Fox Hills-basal Hell Creek Aquifer in North and South Dakota. Murphy and Schramke (1998) estimated that sulfate reduction rate varied from 1.3 × 10⁻³ to 0.25 μmol · L−1 · yr−1 in the Middendorf aquifer, one of the Atlantic Coastal Plain aquifer system. The consistency between our simulation and previous efforts suggests that despite the simplifications and assumptions, our model can be applied to microbial reactions in aquifers.
During the second phase of 400–800 years, the increase in CO2 partial pressure inhibits the metabolism of acetotrophic sulfate reducer, a result that agrees with the prediction based on reaction thermodynamics. Specifically, both the biomass concentration and sulfate reduction rate decrease sharply—by 29%—during the first 90 years. Afterwards, the biomass concentration and rate decrease almost linearly with time to 5.7 μg · L−1 and 0.48 μmol · L−1 · yr−1, respectively, at year 800.
The inhibition comes from the decrease in the available energy, and can be evaluated using the thermodynamic factor FT. This factor quantifies how the available energy, relative to the saved energy, controls microbial rate. As shown in Figure 8E, before the CO2 addition, energy available to acetotrophic sulfate reducers is 52.2 kJ · mol−1, larger than the saved energy, which is 33.75 kJ · mol−1 (Equation 11 and Table 3). As a result, the thermodynamic factor takes a value of 0.7 (Figure 8F). In the second phase, the available energy drops by 12.5 kJ · mol−1 during the first 90 years, and then decreases gradually to 38.5 kJ · mol−1 at year 800. The decrease in the available energy pulls down the thermodynamic factor to 0.27 at year 800.
The simulation also predicts that the CO2 addition ultimately drives acetotrophic sulfate reducers out of the aquifer. As shown in Figure 8G, in addition to the thermodynamic factor, acetotrophic sulfate reduction is also limited by acetate, the significance of which is quantified using the kinetic factor FD. Before the CO2 addition, because of small acetate concentration, the kinetic factor FD is only about 3.9 × 10⁻³. Note that the kinetic factor of sulfate is close to unity, because of the large sulfate concentration. Substituting these values, together with the rate constant and growth yield (see Table 3) to the rate law (Equations 7 and 14), acetotrophic sulfate reducers take a specific growth rate of 1.0 × 10⁻⁸ s−1, which equates the assumed rate of specific maintenance, and allows the growth to reach a steady state.
But after the addition of CO2 into the aquifer, the specific growth rate decreases because of the decrease in the available energy and the rate of sulfate reduction. Although the deceleration of acetotrophic sulfate reduction raises the concentration and hence the kinetic factor of acetate (Figures 8A,G), the increase is not sufficient to offset the decrease by decreasing available energy. As a result, the specific growth rate decreases below the specific maintenance rate, and the population starts to decline. Given sufficient time, acetotrophic sulfate reducers will disappear (result not shown).
During the second phase of 400–800 years, the addtion of CO2 raises the rate of hydrogenotrophic sulfate reduction, but only to a limited extent. According to the simulation results (Figures 8C,D), the biomass concentration and sulfate reduction rate increase, but only slightly—about 10%. Both the rate and biomass concentration reach maximum values after 20 years into the second phase, and remain nearly constant thereafter.
The modest response arises from the opposing effects of the increasing available energy and the decreasing H2 concentration. As shown in Figures 8E,F, before the CO2 addition, the energy available to hydrogenotrophic sulfate reducers is 47.9 kJ · mol−1, close to the saved energy, which is 45 kJ · mol−1 (Equation 11 and Table 3). The thermodynamic factor FT takes a value of about 0.2. H2 concentration is also smaller than the assumed half-saturation constant of 1.1 μM (Table 3), and the kinetic factor FD takes a value of 0.012.
After the addition of CO2, the available energy increases, raising the thermodynamic factor FT. At year 800, available energy increases to 60.4 kJ · mol−1, and the thermodynamic factor increases to 0.64. On the other hand, because the rate of H2 production by organic mater degradation is held constant, the increase in the H2 oxidation rate decreases the concentration of H2, decreasing the kinetic factor FD. At year 800, H2 concentration decreases to 3.6 nM, and the kinetic factor FD decreases to 0.003. Because the increase in rate by the increasing available energy nearly balances the decrease by decreasing H2 concentration, the sulfate reduction rate does not vary significantly.
Microbial Competition
In aquifers, microbial sulfate reduction and iron reduction may take place at the same location, competing against each other for electron donors (Flynn et al., 2013; Maamar et al., 2015). The above thermodynamic analysis suggests that in the hypothetical calcite-rich aquifer, high CO2 promotes microbial iron reduction, but inhibits sulfate reducers that utilize short-chain fatty acids (Figures 6F,G). As a result, the addition of CO2 into aquifers may change the outcome of the competition between iron reducers and sulfate reducers.
To test this prediction, we simulate the metabolisms of iron reducers and sulfate reducers that oxidize H2 and acetate in the hypothetical calcite-rich aquifer. We assume that the aquifer has a porosity of 0.15 and contains 1% goethite, and that sulfate, sulfide, and ferrous iron in the incoming groundwater has a concentration of 1.0 mM, 10 μM, and 10 μM, respectively. The simulation also includes the metabolisms of hydrogenotrophic and acetoclastic methanogens. In this way, a total of six functional groups are considered in the simulation.
Figure 9 shows the results of the simulation. In the first 400 years, before the addition of CO2, out of the six functional groups, only the two sulfate reducers survive in the aquifer. The simulated rates and biomass concentrations are the same as those in the first phase of the above example (Figure 8). In addition, there are two chemical species on the surface of goethite, free or bioavailable surface sites (>FeOH) and sorbed ferrous iron (>FeOFe+), and their bulk concentrations are about 2 mM (Figure 9D).
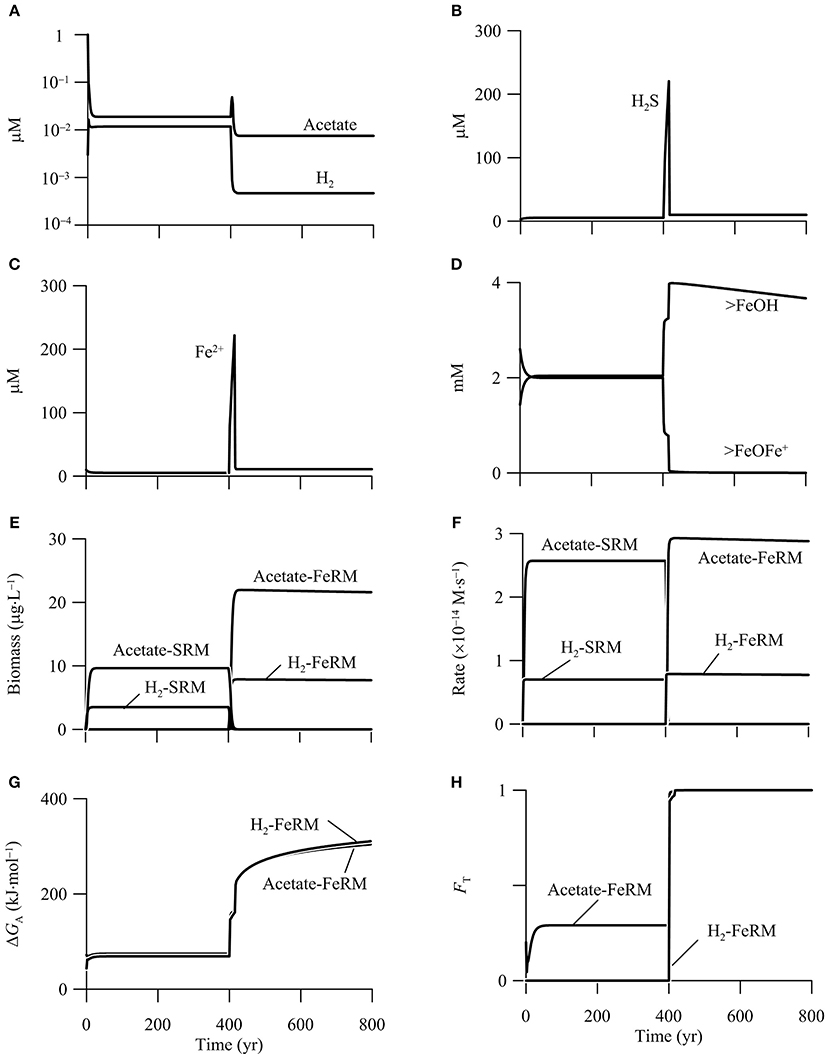
Figure 9. Variations with time in the concentrations of H2, acetate, (A), sulfide (B), ferrous iron (C), the bioavailable surface sites >FeOH, and sorbed ferrous iron >FeOFe+ (D), the biomass concentrations of iron reducing (FeRM) and sulfate reducing microbes (SRM) (E), the rates of iron reduction and sulfate reduction (F), the energy available to iron reducers (G), and the thermodynamic factor FT of iron reducers (H) in a hypothetical calcite-rich aquifer.
Between year 400 and 800, the CO2 addition promotes the metabolism of acetotrophic and hydrogenotrophic iron reducers, and excludes the two sulfate reducers from the aquifer. In other words, the CO2 addition changes the aquifer from a sulfate-reduction zone to a zone of iron reduction. At steady state, hydrogenotrophic and acetotrophic iron reducers reach a concentration of 7.8 and 21.9 μg · L−1, respectively. Hydrogenotrophic and acetotrophic iron reduction proceeds at a rate of 0.2 and 0.9 μmol · L−1 · yr−1, respectively (Figures 9E,F).
The CO2 addition promotes iron reduction by raising the energy available from the reduction of goethite. As shown in Figure 9G, the CO2 addition raises significantly the energy available to iron reducers. At year 400, the available energy is only 69.0 kJ · mol−1 for hydrogenotrophic iron reduction, less than the saved energy of 90.0 kJ · mol−1 (Equation 11 and Table 3). The available energy is 74.3 kJ · mol−1 for acetotrophic iron reduction, slightly larger than the saved energy of 67.5 kJ · mol−1. Within 90 years, because of the sharp decrease in pH, the available energy of both hydrogenotrophic and acetotrophic iron reduction increases to about 270 kJ · mol−1. As a result, the thermodynamic factors of the two iron reducers increase to near unity at year 490, and stay close to unity afterwards (Figure 9H).
CO2 addition also promotes microbial iron reduction by increasing the concentration of bioavailable surface sites (Figure 9D). According to the rate law (Equation 12), the rate of microbial iron reduction depends on the concentration of bioavailable surface sites of ferric minerals, which in turn depends on the sorption of ferrous iron. Ferrous iron sorption is controlled by pH; more ferrous iron sorbs onto the surface sites of goethite at high pH, and vice versa (Dixit and Hering, 2006). As shown in Figure 9D, the decrease in pH removes the sorbed ferrous iron from the surface sites, and thus makes available nearly all of the surface sites to bioreduction.
The increases in the available energy and the concentration of bioavailable surface sites raise the rates of iron reduction, which enable both hydrogenotrophic and acetotrophic iron reducers to compete successfully against sulfate reducers. Specifically, acetate and H2 oxidation by the iron reducers decrease acetate and H2 concentrations below 7.5 and 0.5 nM, respectively (Figure 9A). The small acetate and H2 concentrations decreases the specific growth rates of sulfate reducers below specific maintenance rates, which leads to the death of the sulfate reducers (Bethke et al., 2008).
Hydrogenotrophic and acetoclastic methanogens do not survive in the hypothetical aquifer, either before or after the addition of CO2. The absence of methanogens is accounted for by the limited availability of electron donors, and by the relatively small yields Y of biomass synthesis. For example, because of the small acetate concentration, the kinetic factor FD of acetate for acetoclastic methanogen is very small, only 8.2 × 10⁻⁴. Neglecting the thermodynamic control, and substituting the kinetic factor and the growth yield to the rate law (Equations 7 and 13, Table 3), the methanogen has a specific growth rate of 2.1 × 10⁻⁹ s−1, smaller than the assumed specific maintenance rate of 10−8 s−1.
Note that in the above two examples of kinetic simulation, we may have underestimated microbial responses to CO2 addition. Specifically, because microbial parameters are assumed constant, the predicted microbial responses arise mostly from the thermodynamic impact of CO2 addition. However, microbial parameters may not be constant, but depend on the physicochemical conditions, including the pH, temperature, pressure, and salinity of the environment (Ingraham, 1987; Jin et al., 2013). In the second phase of the simulations, CO2 partial pressure is assumed to increase linearly with time, giving rise to a continuous decrease in groundwater pH (Figure 7). We speculate that, because of the impact of CO2 and pH on microbial physiology, actual microbial responses would be more complex than what we have demonstrated here.
Discussion
The above modeling exercises analyzed how the thermodynamics and kinetics of microbial reactions respond to the addition of CO2 into aquifers. The simulation is based on a simple mixing model that adds CO2 gas into two different hypothetical aquifers—a carbonate-free aquifer of limited pH buffering capacity and a calcite-rich aquifer that effectively buffers the change of pH (Figure 1). The addition of CO2 gas would occur where CO2 from deep reservoirs migrates into the aquifers in the phase of gas.
The simulation focused on syntrophic oxidation, iron reduction, sulfate reduction, and methanogenesis (Tables 1, 2). According to the simulation results, high CO2 raises the reduction potentials of electron donors and acceptors in the two hypothetical aquifers. The increases are different for different electron donors and acceptors and ultimately determine how, and to what extent, energy available to different microbes changes.
Considering the control of available energy on microbial kinetics (Jin et al., 2013), rates of different microbial reactions may respond to the addition of CO2 in different ways and to different degrees. These predictions are supported by the results of two kinetic simulations of microbial reactions in the hypothetical calcite-rich aquifer. The different responses of individual microbial reactions not only control the outcome of microbial interaction, but also bear on the effort of geological carbon sequestration.
Syntrophic Oxidation
The simulation results show that in the two hypothetical aquifers, the increases in CO2 partial pressure lower the available energy of syntrophic oxidation (Figures 6A,E). Based on the relationship between thermodynamics and kinetics (Equation 7), we predict that increases in CO2 partial pressure may impede the progress of syntrophic oxidation of organic compounds.
Previous experimental studies investigated the impact of CO2 on acetate consumption by both model syntrophs and natural consortia. For example, Kato et al. (2014) analyzed acetate consumption by Thermacetogenium phaeum, a representative microbe capable of syntrophic oxidation of acetate to bicarbonate and dihydrogen (reaction 1 in Table 2). They also included in their experiments Methanothermobacter thermautotrophicus. M. thermautotrophicus makes methane by scavenging H2, maintaining H2 partial pressure at low levels, <3.0 × 10⁻⁴ atm (reaction 21) (Kato et al., 2014, their Figure 1C). Kato et al. (2014) grew the two microbes in batch reactors at 55°C, and monitored the accumulation of methane under different CO2 partial pressures. We calculated acetate consumption rates from the reported temporal variations of methane concentrations (Kato et al., 2014, their Figure 4B). These rates show that the increases in CO2 partial pressure slowed down the consumption of acetate. Specifically, the rate was about 3.3 mM·d−1 at the partial pressure near 0 atm, 1.8 mM·d−1 at the partial pressure of 0.2 atm, and only 0.3 mM·d−1 at the partial pressure of 1.0 atm.
Mayumi et al. (2013) analyzed acetate consumption by natural consortia from an oil reservoir. They grew the consortia at 55°C and different CO2 partial pressures, and analyzed the occurrence of syntrophic acetate oxidation. According to their results, at the CO2 partial pressure of 0.04 atm, syntrophic oxidation dominated the consumption of acetate. But at the partial pressure of 2.0 atm, syntrophic oxidation became thermodynamically unfavorable. The results of these experimental studies agree with the inhibitory effect of CO2 on syntrophic oxidations.
Microbial Iron and Sulfate Reduction
According to the simulation results, the thermodynamics of microbial iron reduction and sulfate reduction respond differently to the changes in CO2 partial pressure. The increases in CO2 raise significantly the energy available to iron reducers, but change, to a limited extent, the energy available to sulfate reducers (Figures 6B,F). These results compare well with the observations of previous aquifer experiments.
Kharaka et al. (2006) injected about 1600 t of CO2 into a regional aquifer of 1500 m depth in the US Gulf Coast. Kharaka et al. (2010) also injected 9 t of CO2 into a shallow gravel aquifer in Montana, USA. Kirk (2011) computed the variations in the energy available to iron reducers during the two experiments. In the regional aquifer, the CO2 injection increased the energy available to acetotrophic and hydrogenotrophic iron reducers by about 47 and 62 kJ·mol−1, respectively. In the shallow aquifer, the energy available to acetotrophic and hydrogenotrophic iron reducers increased by 77 kJ· and 88 kJ·mol−1, respectively.
It is appropriate to compare the observations of the two field experiments to the simulation results of the calcite-rich aquifer. First, calcite is present in the test layer of the regional aquifer, a quartz and feldspar sandstone (Kharaka et al., 2006). Limestone occurs at notable fractions in the shallow aquifer (Kharaka et al., 2010). Second, during both aquifer experiments, in addition to the pH decreases, the CO2 injections increased significantly the concentrations of bicarbonate and calcium (Kharaka et al., 2006, 2009, 2010). These chemical variations support the occurrence of carbonate mineral buffering during the CO2 injections.
In both field experiments, the thermodynamic responses of microbial iron reduction are consistent with our simulation results—the increases in CO2 levels raised the energy available to iron reducers, and the increase was larger for hydrogenotrophs than for acetotrophs. But the sizes of the increases were only about half of our modeling results. In the hypothetical calcite-rich aquifer, the increases in CO2 partial pressure raise the energy available to acetotrophic and hydrogenotrophic iron reducers by 124 and 166 kJ·mol−1, respectively (Figure 6F).
These differences arise from the difference in the magnitude of pH decrease between our simulations and the field experiments. Specifically, in our model, the pH of the groundwater is assumed at 8.0, and it drops to 5.0 in response to CO2 leakage. In comparison, the pH decreased from 7.2 before the injection to 5.7 after the injection in the regional aquifer of the US Gulf Coast, and from 7.0 to 5.6 in the shallow aquifer in Montana, USA (Kharaka et al., 2009, 2010).
If we apply the pH variations of the field experiments to the hypothetical calcite-rich aquifer model, we would arrive at thermodynamic responses similar to those in the field experiments. Taking an initial pH of 7.0 for the groundwater, and by raising CO2 partial pressure to 5.5 atm, the pH would drop to 5.5, and the energy available to acetotrophic and hydrogenotrophic iron reducers would increase by 71.4 and 91.3 kJ·mol−1, respectively, close to the changes in the field experiments (Kirk, 2011).
According to Kirk (2011), during the field experiments, energy available to microbial sulfate reduction varied little. Specifically, for acetotrophic sulfate reduction (reaction 15 in Table 2), the CO2 injection decreased the available energy by 3 kJ·mol−1 in the regional aquifer, and increased by 5 kJ·mol−1 in the shallow aquifer. For hydrogenotrophic sulfate reduction (reaction 14), the CO2 injection increased the available energy by about 12 kJ·mol−1 in both aquifers. These variations are similar in magnitude as the results of our simulation (Figure 6G).
Methanogenesis
The simulation results show that increases in CO2 partial pressure raise the energy available to hydrogenotrophic methanogenesis, but lower the available energy of acetoclastic methanogens. These results suggest that high CO2 may promote hydrogenotrophic methanogensis, but inhibit the metabolism of acetoclastic methanogens.
The predicted benefit to hydrogenotrophic methanogenesis is supported by the field experiments of O'mullan et al. (2015). O'mullan et al. (2015) carried out two push-pull tests in a shallow aquifer in the Newark Basin, USA. During the tests, they first injected CO2-enriched solution into the aquifer through a test well, and then extracted the groundwater from the same well. They performed geochemical and microbiological characterizations of groundwater before and after the CO2 injections. According to their results, the CO2 injection triggered significant changes in microbial community composition, including an increase in the relative abundance of 16S rRNA gene sequences that belong to Methanomicrobia and Methanobacteria.
Members of Methanobacteria can make methane using H2, but not acetate (Whitman et al., 2006). Thus, the increase in their gene sequences confirms the modeling prediction that high CO2 stimualtes the metabolism of hydrogenotrophic methanogens. On the other hand, Methanomicrobia includes members capable of both hydrogenotrophic and acetoclastic methanogenesis. It is unclear whether or not the increases in the sequences of Methanomicrobia also arose from the response of hydrogenotrophic methanogenesis.
The predicted inhibition of acetotrphic methanogenesis is supported by the laboratory experiments of Kato et al. (2014). They examined the metabolism of Methanosarcina thermophila in batch reactors under different CO2 partial pressures. In their experiments, M. thermophila grew by converting acetate to methane, and its growth rate decreased with increases in CO2 partial pressure. Specifically, the rate at 1.0 atm CO2 was about 89% of the rate at partial pressure near 0 atm (Kato et al., 2014, their Figures 4A,C).
Microbial Interaction
Microbial reactions rarely occur in isolation in aquifers, but mingled with each other, forming complex networks of metabolic interactions. By acting on individual microbial reactions, CO2 plays a role in the outcome of microbial interactions.
We illustrated the role of CO2 in microbial interactions by carrying out two kinetic simulations of microbial metabolisms in the hypothetical calcite-rich aquifer. The first simulation focused on the responses of H2- and acetate-oxidizing sulfate reducers, and the second explored the competition between sulfate reducers and iron reducers. The results showed that CO2 controls the outcome of microbial interaction, and that high CO2 favors microbial iron reduction over sulfate reduction. These results are supported by the observations of previous laboratory and field experiments.
Kirk et al. (2013) studied how CO2 abundance affected the competition between natural communities of iron and sulfate reducers. They grew microbial consortia from a freshwater aquifer in fed-batch reactors using acetate-based media under different CO2 partial pressures. According to their observations, at CO2 partial pressure of 0.02 atm, the reactors had a pH of 7.2, and both iron and sulfate reduction took place. But sulfate reduction overwhelmed iron reduction; sulfate reducers consumed 85% of acetate, and iron reducers used the remaining 15%. In contrast, in reactors with 1.0 atm CO2 partial pressure, the pH dropped to 5.7, and iron reducers won the competition against sulfate reducers. Iron reduction consumed at least 90% of acetate while sulfate reduction consumed a negligible portion (<1%).
The control of CO2 partial pressure is further supported by the difference in microbial community composition (Kirk et al., 2013). 16S rRNA gene analysis shows that sequences grouped within Geobacteraceae and Myxococcaceae were more than twice as abundant in the reactors with 1.0 atm CO2 as in those with 0.02 atm CO2. Members of Geobacteraceae and Myxococcaceae, such as Geobacter and Anaeromyxobacter, are capble of iron reduction (Lonergan et al., 1996; Treude et al., 2003).
The aforementioned field experiments of O'mullan et al. (2015) also support the role of CO2 in microbial competition. Specifically, in their two push-pull tests, the CO2 injection increased the relative abundance of 16S rRNA genes associated with iron reducers, including Geothrix and Geobacter. The increase in these genes overlapped in time with the increase in the concentration of groundwater ferrous iron (O'mullan et al., 2015, their Figures 1, 7). These observations suggest that the CO2 injection may have stimulated microbial reduction of ferric minerals.
O'mullan et al. (2015) also detected an increase of genes associated with Desulfosporosinus in the second push-pull test. Members of Desulfosporosinus can use sulfate as an electron acceptor, but some members are also capable of reducing ferric minerals under acidic conditions (Senko et al., 2009; Bertel et al., 2012). We note that during the test, the increase in the genes of Desulfosporosinus occurred after the decrease of groundwater pH, and coincided with the increase in the genes of Geothrix and Geobacter, and with the increase in the concentrations of ferrous iron and sulfate (O'mullan et al., 2015, their Figures 1, 7). We suspect that the increase of Desulfosporosinus-associated genes likely reflects an increase in microbial iron reduction, not sulfate reduction.
Microbial Community
The two kinetic simulations underscore the importance of microbial community membership in applying the results of biogeochemical modeling. Specifically, the impact of CO2 addition on sulfate reducers depends on the presence of iron reducers. The first kinetic simulation represents a case in which aquifers house only sulfate reducers, but not iron reducers. The results show that CO2 addition promotes, to a limited extent, hydrogenotrophic reduction of sulfate, and limits significantly the progress of acetotrophic sulfate reduction (Figure 8).
The second kinetic simulation represents a case where both iron reducers and sulfate reducers are present. According to the simulation results (Figure 9), the presence of iron reducers dramatically changes the fate of sulfate reducers during the addition of CO2. Before CO2 is added into the aquifer, acetotrophic and hydrogenotrophic sulfate reducers win the competition against iron reducers and thrive in the aquifer. But the CO2 addition wipes the sulfate reducers out, and allows iron reducers to flourish in the aquifer.
The importance of community membership resonates with previous investigations on the response of acetocalstic methanogens to CO2. As discussed above, our modeling results predict that high CO2 inhibits acetoclastic methanogenesis. This prediction is supported by the experiments of Kato et al. (2014) on the pure culture of M. thermophila. But the inhibitory effect can be reversed where methanogens live together with syntrophs.
For example, in the same study, Kato et al. (2014) also analyzed acetate consumption by M. thermophila in the presence of T. phaeum and M. thermautotrophicus. In these experiments, T. phaeum and M. thermautotrophicus carried out acetate syntrophic oxidation and hydrogenotrophic methanogenesis to make methane, competing against M. thermophila for acetate. According to the experimental observations (Kato et al., 2014, their Figures 1, 2), high CO2 did not inhibit, but promoted, the significance of acetoclastic methanogenesis by M. thermophila.
The above-mentioned experiments of Mayumi et al. (2013) also contradict the inhibitory effect of high CO2 on acetoclastic methanogenesis. In their microcosm experiments, both syntrophs and methanogens were capable of using acetate. At 0.04 atm of CO2, syntrophic oxidation dominated the consumption of acetate, but acetoclastic methanogenesis took over at 2.0 atm CO2.
The contradiction between the model predictions and the experimental observations arises from the competition between syntrophs and methanogens. In these experiments, syntrophs won the competition against acetoclastic methanogens at low CO2. Increases in CO2 lowered the energy available to syntrophs, limiting the progress of syntrophic oxidation. High CO2 also decreased the energy available to acetoclastic methanogens, but compared to that of syntrophic oxidation, the decrease was modest (Figures 6A,D,E,H; Mayumi et al., 2013, their Figure 4; Kato et al., 2014, their Figure 6). As a result, high CO2 helped acetocalstic methanogens win the competion against syntrophs, which led to the apparent promotion of acetoclastic methanogenesis. In applying the modeling results of methanogenesis to natural environments, we should consider how methanogens interact with other microbial reactions.
CO2 Trapping
Many microbial reactions consume protons, and thus have the potential of trapping CO2 (Table 2). By consuming protons, these reactions drive forward CO2 hydrolysis (Equation 1), converting CO2 into bicarbonate. In this way, carbon can be more securely stored within the aqueous phase and potentially precipitate as carbonate minerals, such as calcite, magnesite (MgCO3), and siderite (FeCO3). Mineral trapping is considered to be the most secure form of subsurface carbon trapping (Gunter et al., 1997).
The predicted changes in microbial activity by CO2 addition are favorable for CO2 trapping. Because iron reduction consumes many more protons than sulfate reduction or methanogenesis (Table 2), it has a much greater potential to generate bicarbonate. Per mole of acetate consumed, for example, iron reduction can generate 17 moles of bicarbonate whereas sulfate reduction only generates 3 moles of bicarbonate. As CO2 is added into aquifers, a shift toward iron reduction would increase conversion of CO2 into bicarbonate. Thus, an increase in the rate of iron reduction relative to the other reactions would act as a positive feedback mechanism on CO2 trapping (Kirk et al., 2013).
Although it is well established that microbial reactions help neutralize acid mine water (e.g., Tuttle et al., 1969; Dean et al., 2013; Lindsay et al., 2015), the possibility that they could provide the same ecosystem service in geological carbon storage settings has received relatively little attention. In carbonate aquifers, reaction between carbonic acid and carbonate minerals is likely the dominant source of bicarbonate production. However, in silicic aquifers, we hypothesize that the bicarbonate contribution of microbial reactions can be dominant, depending on the rate at which electron donors are supplied. Where the flux of electron donors into the system is relatively high, microbial reactions have the potential to generate bicarbonate more rapidly than mineral reactions, and may become a major force of CO2 trapping. Predicting the fate of CO2 within such systems should account for microbial reactions (Kirk et al., 2013).
Closing Comments
We carried out biogeochemical modeling to analyze how CO2 addition impacts the thermodynamics and kinetics of microbial reactions in aquifers. Our simulation is limited in the description of CO2 addition and microbial reactions. First, the simulation is based on a simple model of groundwater and CO2 mixing. As a result, the application of our modeling results is limited to the addition of CO2 gas into aquifers.
However, CO2 leakage may be accompanied by reservoir fluids, which are briny and rich in hydrocarbons and gases. The leakage of reservoir fluids into aquifers changes the pH, ionic strength, electron donor and acceptor concentrations, and other chemical properties of groundwater, which in turn influence the thermodynamics of microbial reactions. The reservoir fluids also affect the viability and metabolism of aquifer microbes, which determine how microbes respond to the addition of CO2. In these cases, the simulation needs to account for the chemical compositions of reservoir fluids, and a reactive transport modeling can be applied to consider how the rates of reservoir leakage and groundwater flow determine the thermodynamics and kinetics of microbial reactions (Carroll et al., 2009).
Second, the simulation focused on the overall reactions of microbial respiration, and described microbial kinetics using the Monod-type rate laws (Equations 7–14). This approach has been applied successfully to aquifers and other natural environments (Bethke et al., 2008; Jin and Roden, 2011). But the kinetic model only accounts for the concentrations of electron donors and acceptors and the available energy in the environment, without the consideration of microbial physiology or how microbial physiology responds to the changes in the pH of the environment. For example, in response to acidification, cells may decrease their cytoplasmic pH and adjust their pathways, which in turn affect not only biological energy conservation but also microbial growth and maintenance (van Bodegom, 2007; Slonczewski et al., 2009).
Despite the limitations in our model, the simulation results are still illuminating. The results illustrate the complexity in microbiological response to high CO2, and are consistent with the observations of previous laboratory and field investigations. Specifically, CO2 addition lowers the energy available to syntrophs and to acetoclastic methanogens, but raises the energy available to iron reducers and hydrogenotrophic methanogens. As a result, high CO2 may inhibit the metabolisms of syntrophs and acetoclastic methanogens, but promote the metabolisms of iron reducers and hydrogenotrophic methanogens. The simulation results also demonstrate the importance of microbial community membership in applying the simulation results, and show that CO2 levels influence the outcome of microbial interactions. Based on these results, we suggest that evaluating the environment impact of geological carbon sequestration should consider the responses of microbial communities.
Our modeling exercises also illustrate the power of coupled thermodynamic and kinetic analysis of microbial reactions. Thermodynamic and kinetic analyses are routine tasks in today's biogeochemical studies. The thermodynamic analysis is on the basis of chemical thermodynamic properties, and tells whether or not, under given geochemical conditions, a microbial reaction is favored by thermodynamics. The kinetic modeling combines thermodynamic properties of chemical substances with kinetic parameters of microbial metabolisms, and predicts how fast microbes catalyze chemical reactions and reproduce themselves.
So far the thermodynamic and kinetic analyses have often been carried out separately. This study combined the two analyses to predict microbial responses to CO2 addition. The results of both methods support the conclusion that different microbial reactions respond differently to high CO2. Importantly, the kinetic analysis places a quantitative constraint on the thermodynamic predictions. For example, the thermodynamic analysis suggested that CO2 addition promotes hydrogenotrophic sulfate reduction. But the kinetic analysis showed that high CO2 does not raise significantly the rates of hydrogenotrophic sulfate reduction. The simulation demonstrates a trade-off between the increasing available energy and the decreasing H2 availability in the environment where H2 production rate remains constant. These simulation results represent example hypotheses generated by the coupled thermodynamic and kinetic modeling that can be further tested using laboratory and field experiments.
Author Contributions
QJ and MK designed the project, and wrote the manuscript; QJ carried out the modeling, and QJ and MK analyzed the results.
Funding
This research was funded by the National Science Foundation under Award EAR-1636815 and EPS-0903806, and by National Aeronautics and Space Administration under Grant NNX16AJ59G. Publication of this article was funded in part by the Kansas State University Open Access Publishing Fund.
Conflict of Interest Statement
The authors declare that the research was conducted in the absence of any commercial or financial relationships that could be construed as a potential conflict of interest.
References
Appelo, C. A., Van Der Weiden, M. J. J., Tournassat, C., and Charlet, L. (2002). Surface complexation of ferrous iron and carbonate on ferrihydrite and the mobilization of arsenic. Environ. Sci. Technol. 36, 3096–3103. doi: 10.1021/es010130n
Benson, S. M., and Cole, D. R. (2008). CO2 sequestration in deep sedimentary formations. Elements 4, 325–331. doi: 10.2113/gselements.4.5.325
Bertel, D., Peck, J., Quick, T. J., and Senko, J. M. (2012). Iron transformations induced by an acid-tolerant Desulfosporosinus species. Appl. Environ. Microbiol. 78, 81–88. doi: 10.1128/AEM.06337-11
Bertoloni, G., Bertucco, A., De Cian, V., and Parton, T. (2006). A study on the inactivation of micro-organisms and enzymes by high pressure CO2. Biotechnol. Bioeng. 95, 155–160. doi: 10.1002/bit.21006
Bethke, C. M. (2008). Geochemical and Biogeochemical Reaction Modeling. Cambridge: Cambridge University Press.
Bethke, C. M., Ding, D., Jin, Q., and Sanford, R. A. (2008). Origin of microbiological zoning in groundwater flows. Geology 36, 739–742. doi: 10.1130/G24859A.1
Bethke, C. M., Sanford, R. A., Kirk, M. F., Jin, Q., and Flynn, T. M. (2011). The thermodynamic ladder in geomicrobiology. Am. J. Sci. 311, 183–210. doi: 10.2475/03.2011.01
Bigham, J. M., Schwertmann, U., Traina, S. J., Winland, R. L., and Wolf, M. (1996). Schwertmannite and the chemical modeling of iron in acid sulfate waters. Geochim. Cosmochim. Acta 60, 2111–2121. doi: 10.1016/0016-7037(96)00091-9
Cahill, A. G., Jakobsen, R., Mathiesen, T. B., and Jensen, C. K. (2013). Risks attributable to water quality changes in shallow potable aquifers from geological carbon sequestration leakage into sediments of variable carbonate content. Int. J. Greenhouse Gas Control 19, 117–125. doi: 10.1016/j.ijggc.2013.08.018
Carroll, S., Hao, Y., and Aines, R. (2009). Geochemical detection of carbon dioxide in dilute aquifers. Geochem. Trans. 10, 1–18. doi: 10.1186/1467-4866-10-4
Chapelle, F. H. (2001). Ground-Water Microbiology and Geochemistry. New York, NY: John Wiley & Sons, Inc.
Cornell, R. M., and Schwertmann, U. (2003). The Iron Oxides: Structure, Properties, Reactions, Occurrences and Uses. Weinheim: Wiley-VCH.
Davis, J. A., and Kent, D. B. (1990). “Surface complexation modeling in aqueous geochemistry,” in Reviews in Mineralogy. Mineralogical Society of America, eds M. F. Hochella and A. F. White (Washington, DC: Mineralogical Society of America), 177–260.
Dean, A. P., Lynch, S., Rowland, P., Toft, B. D., Pittman, J. K., and White, K. N. (2013). Natural wetlands are efficient at providing long-term metal remediation of freshwater systems polluted by acid mine drainage. Environ. Sci. Technol. 47, 12029–12036. doi: 10.1021/es4025904
Delany, J. M., and Lundeen, S. R. (1990). The LLNL Thermodynamical Database. Lawrence Livermore National Laboratory Report UCRL-21658. Livermore, CA.
Dixit, S., and Hering, J. G. (2006). Sorption of Fe(II) and As(III) on goethite in single- and dual-sorbate systems. Chem. Geol. 228, 6–15. doi: 10.1016/j.chemgeo.2005.11.015
Dockins, W. S., Olson, G. J., McFeters, G. A., and Turbak, S. C. (1980). Dissimilatory bacterial sulfate reduction in Montana groundwaters. Geomicrobiol. J. 2, 83–98. doi: 10.1080/01490458009377752
Emerson, J. B., Thomas, B. C., Alvarez, W., and Banfield, J. F. (2016). Metagenomic analysis of a high carbon dioxide subsurface microbial community populated by chemolithoautotrophs and bacteria and archaea from candidate phyla. Environ. Microbiol. 18, 1686–1703. doi: 10.1111/1462-2920.12817
Flynn, T. M., Sanford, R. A., Ryu, H., Bethke, C. M., Levine, A. D., Ashbolt, N. J., et al. (2013). Functional microbial diversity explains groundwater chemistry in a pristine aquifer. BMC Microbiol. 13:146. doi: 10.1186/1471-2180-13-146
Gerlach, R., and Cunningham, A. B. (2010). “Influence of biofilms on porous media hydrodynamics,” in Porous Media: Applications in Biological Systems and Biotechnology, ed K. Vafai (New York, NY: CFC Press), 173–230.
Gunter, W. D., Wiwchar, B., and Perkins, E. H. (1997). Aquifer disposal of CO2-rich greenhouse gases: extension of the time scale of experiment for CO2-sequestering reactions by geochemical modelling. Mineral. Petrol. 59, 121–140. doi: 10.1007/BF01163065
Harvey, O. R., Qafoku, N. P., Cantrell, K. J., Lee, G., Amonette, J. E., and Brown, C. F. (2013). Geochemical implications of gas leakage associated with geological CO2 storage - a qualitative review. Environ. Sci. Technol. 47, 23–36. doi: 10.1021/es3029457
Helgeson, H. C. (1969). Thermodynamics of hydrothermal systems at elevated temperatures and pressures. Am. J. Sci. 267, 729–804. doi: 10.2475/ajs.267.7.729
Humez, P., Negrel, P., Lagneau, V., Lions, J., Kloppmann, W., Gal, F., et al. (2014). CO2-water-mineral reactions during CO2 leakage: geochemical and isotopic monitoring of a CO2 injection field test. Chem. Geol. 368, 11–30. doi: 10.1016/j.chemgeo.2014.01.001
Inagaki, F., Kuypers, M. M. M., Tsunogai, U., Ishibashi, J., Nakamura, K., Treude, T., et al. (2006). Microbial community in a sediment-hosted CO2 lake of the southern Okinawa Trough hydrothermal system. Proc. Natl. Acad. Sci. U.S.A. 103, 14164–14169. doi: 10.1073/pnas.0606083103
Ingraham, J. L. (1987). “Effect of temperature, pH, water activity, and pressure on growth,” in Escherichia coli and Salmonella typhimurium: Cellular and Molecular Biology, eds F. C. Neidhardt, J. L. Ingraham, K. B. Low, B. Magasanik, M. Schaechter, and H. E. Umbarger. (Washington, DC: American Society for Microbiology), 1543–1554.
IPCC (2005). “IPCC special report on carbon dioxide capture and storage,” in Prepared by Working Group III of the Intergovernmental Panel on Climate Change, eds B. Metz, O. Davidson, H.C. De Coninck, M. Loos, and L. A. Meyer (Cambridge, UK; New York, NY: Cambridge University Press), 442.
Jin, Q. (2012). Energy conservation of anaerobic respiration. Am. J. Sci. 312, 573–628. doi: 10.2475/06.2012.01
Jin, Q., and Bethke, C. M. (2003). A new rate law describing microbial respiration. Appl. Environ. Microbiol. 69, 2340–2348. doi: 10.1128/AEM.69.4.2340-2348.2003
Jin, Q., and Bethke, C. M. (2005). Predicting the rate of microbial respiration in geochemical environments. Geochim. Cosmochim. Acta 69, 1133–1143. doi: 10.1016/j.gca.2004.08.010
Jin, Q., and Bethke, C. M. (2007). The thermodynamics and kinetics of microbial metabolism. Am. J. Sci. 307, 643–677. doi: 10.2475/04.2007.01
Jin, Q., and Roden, E. E. (2011). Microbial physiology-based model of ethanol metabolism in subsurface sediments. J. Contam. Hydrol. 125, 1–12. doi: 10.1016/j.jconhyd.2011.04.002
Jin, Q., Roden, E. E., and Giska, J. R. (2013). Geomicrobial kinetics: extrapolating laboratory studies to natural environments. Geomicrobiol. J. 30, 173–185. doi: 10.1080/01490451.2011.653084
Jones, D. G., Beaubien, S. E., Blackford, J. C., Foekema, E. M., Lions, J., De Vittor, C., et al. (2015). Developments since 2005 in understanding potential environmental impacts of CO2 leakage from geological storage. Int. J. Greenhouse Gas Control 40, 350–377. doi: 10.1016/j.ijggc.2015.05.032
Kampman, N., Bickle, M., Becker, J., Assayag, N., and Chapman, H. (2009). Feldspar dissolution kinetics and Gibbs free energy dependence in a CO2-enriched groundwater system, Green River, Utah. Earth Planet. Sci. Lett. 284, 473–488. doi: 10.1016/j.epsl.2009.05.013
Kato, S., Yoshida, R., Yamaguchi, T., Sato, T., Yumoto, I., and Kamagata, Y. (2014). The effects of elevated CO2 concentration on competitive interaction between aceticlastic and syntrophic methanogenesis in a model microbial consortium. Front. Microbiol. 5:575. doi: 10.3389/fmicb.2014.00575
Keating, E. H., Newell, D. L., Viswanathan, H., Carey, J. W., Zyvoloski, G., and Pawar, R. (2013). CO2/Brine transport into shallow aquifers along fault zones. Environ. Sci. Technol. 47, 290–297. doi: 10.1021/es301495x
Keating, E., Newell, D., Dempsey, D., and Pawar, R. (2014). Insights into interconnections between the shallow and deep systems from a natural CO2 reservoir near Springerville, Arizona. Int. J. Greenhouse Gas Control 25, 162–172. doi: 10.1016/j.ijggc.2014.03.009
Kharaka, Y. K., Cole, D. R., Hovorka, S. D., Gunter, W. D., Knauss, K. G., and Freifeld, B. M. (2006). Gas-water-rock interactions in Frio Formation following CO2 injection: implications for the storage of greenhouse gases in sedimentary basins. Geology 34, 577–580. doi: 10.1130/G22357.1
Kharaka, Y. K., Thordsen, J. J., Hovorka, S. D., Seay Nance, H., Cole, D. R., Phelps, T. J., et al. (2009). Potential environmental issues of CO2 storage in deep saline aquifers: geochemical results from the Frio-I Brine Pilot test, Texas, USA. Appl. Geochem. 24, 1106–1112. doi: 10.1016/j.apgeochem.2009.02.010
Kharaka, Y. K., Thordsen, J. J., Kakouros, E., Ambats, G., Herkelrath, W. N., Beers, S. R., et al. (2010). Changes in the chemistry of shallow groundwater related to the 2008 injection of CO2 at the ZERT field site, Bozeman, Montana. Environ. Earth Sci. 60, 273–284. doi: 10.1007/s12665-009-0401-1
Kirk, M. F. (2011). Variation in energy available to populations of subsurface anaerobes in response to geological carbon storage. Environ. Sci. Technol. 45, 6676–6682. doi: 10.1021/es201279e
Kirk, M. F., Altman, S. J., Santillan, E. F. U., and Bennett, P. C. (2016a). Interplay between microorganisms and geochemistry in geological carbon storage. Int. J. Greenhouse Gas Control 47, 386–395. doi: 10.1016/j.ijggc.2016.01.041
Kirk, M. F., Jin, Q., and Haller, B. R. (2016b). Broad-scale evidence that pH influences the balance between microbial iron and sulfate reduction. Groundwater 54, 406–413. doi: 10.1111/gwat.12364
Kirk, M. F., Santillan, E. F. U., Sanford, R. A., and Altman, S. J. (2013). CO2-induced shift in microbial activity affects carbon trapping and water quality in anoxic bioreactors. Geochim. Cosmochim. Acta 122, 198–208. doi: 10.1016/j.gca.2013.08.018
Langmuir, D. (1997). Aqueous Environmental Geochemistry. Upper Saddle River, NJ: Prentice-Hall, Inc.
Lindsay, M. B. J., Moncur, M. C., Bain, J. G., Jambor, J. L., Ptacek, C. J., and Blowes, D. W. (2015). Geochemical and mineralogical aspects of sulfide mine tailings. Appl. Geochem. 57, 157–177. doi: 10.1016/j.apgeochem.2015.01.009
Lions, J., Devau, N., De Lary, L., Dupraz, S., Parmentier, M., Gombert, P., et al. (2014). Potential impacts of leakage from CO2 geological storage on geochemical processes controlling fresh groundwater quality: a review. Int. J. Greenhouse Gas Control 22, 165–175. doi: 10.1016/j.ijggc.2013.12.019
Lonergan, D. J., Jenter, H. L., Coates, J. D., Phillips, E. J., Schmidt, T. M., and Lovley, D. R. (1996). Phylogenetic analysis of dissimilatory Fe(III)-reducing bacteria. J. Bacteriol. 178, 2402–2408.
Lovley, D. R., and Chapelle, F. H. (1995). Deep subsurface microbial processes. Rev. Geophys. 33, 365–382. doi: 10.1029/95RG01305
Lovley, D. R., Chapelle, F. H., and Woodward, J. C. (1994). Use of dissolved H2 concentrations to determine distribution of microbially catalyzed redox reactions in anoxic groundwater. Environ. Sci. Technol. 28, 1205–1210. doi: 10.1021/es00056a005
Maamar, S. B., Aquilina, L., Quaiser, A., Pauwels, H., Michon-Coudouel, S., Vergnaud-Ayraud, V., et al. (2015). Groundwater isolation governs chemistry and microbial community structure along hydrologic flowpaths. Front. Microbiol. 6:1457. doi: 10.3389/fmicb.2015.01457
Mayumi, D., Dolfing, J., Sakata, S., Maeda, H., Miyagawa, Y., Ikarashi, M., et al. (2013). Carbon dioxide concentration dictates alternative methanogenic pathways in oil reservoirs. Nat. Commun. 4, 1–6. doi: 10.1038/ncomms2998
McMahon, P. B., and Chapelle, F. H. (1991). Microbial production of organic acids in aquitard sediments and its role in aquifer geochemistry. Nature 349, 233–235. doi: 10.1038/349233a0
Mitchell, A. C., Phillips, A. J., Hamilton, M. A., Gerlach, R., Hollis, W. K., Kaszuba, J. P., et al. (2008). Resilience of planktonic and biofilm cultures to supercritical CO2. J. Supercrit. Fluids 47, 318–325. doi: 10.1016/j.supflu.2008.07.005
Murphy, E. M., and Schramke, J. A. (1998). Estimation of microbial respiration rates in groundwater by geochemical modeling constrained with stable isotopes. Geochim. Cosmochim. Acta 62, 3395–3406. doi: 10.1016/S0016-7037(98)00254-3
O'mullan, G., Dueker, M. E., Clauson, K., Yang, Q., Umemoto, K., Zakharova, N., et al. (2015). Microbial stimulation and succession following a test well injection simulating CO2, leakage into a shallow newark basin aquifer. PLoS ONE 10:e0117812. doi: 10.1371/journal.pone.0117812
Oppermann, B. I., Michaelis, W., Blumenberg, M., Frerichs, J., Schulz, H. M., Schippers, A., et al. (2010). Soil microbial community changes as a result of long-term exposure to a natural CO2 vent. Geochim. Cosmochim. Acta 74, 2697–2716. doi: 10.1016/j.gca.2010.02.006
Oulé, M. K., Tano, K., Bernier, A. M., and Arul, J. (2006). Escherichia coli inactivation mechanism by pressurized CO2. Can. J. Microbiol. 52, 1208–1217. doi: 10.1139/w06-078
Park, J., Sanford, R. A., and Bethke, C. M. (2006). Geochemical and microbiological zonation of the Middendorf aquifer, South Carolina. Chem. Geol. 230, 88–104. doi: 10.1016/j.chemgeo.2005.12.001
Peet, K. C., Freedman, A. J. E., Hernandez, H. H., Britto, V., Boreham, C., Ajo-Franklin, J. B., et al. (2015). Microbial growth under supercritical CO2. Appl. Environ. Microbiol. 81, 2881–2892. doi: 10.1128/AEM.03162-14
Phelps, T. J., Murphy, E. M., Pfiffner, S. M., and White, D. C. (1994). Comparison between geochemical and biological estimates of subsurface microbial activities. Microb. Ecol. 28, 335–349. doi: 10.1007/BF00662027
Price, P. B., and Sowers, T. (2004). Temperature dependence of metabolic rates for microbial growth, maintenance, and survival. Proc. Natl. Acad. Sci. U.S.A. 101, 4631–4636. doi: 10.1073/pnas.0400522101
Roden, E. E. (2004). Analysis of long-term bacterial vs. chemical Fe(III) oxide reduction kinetics. Geochim. Cosmochim. Acta 68, 3205–3216. doi: 10.1016/j.gca.2004.03.028
Roden, E. E. (2006). Geochemical and microbiological controls on dissimilatory iron reduction. Comptes Rendus Geosci. 338, 456–467. doi: 10.1016/j.crte.2006.04.009
Santillan, E. U., Kirk, M. F., Altman, S. J., and Bennett, P. C. (2013). Mineral influence on microbial survival during carbon sequestration. Geomicrobiol. J. 30, 578–592. doi: 10.1080/01490451.2013.767396
Senko, J. M., Zhang, G., McDonough, J. T., Bruns, M. A., and Burgos, W. D. (2009). Metal reduction at low pH by a Desulfosporosinus species: implications for the biological treatment of acidic mine drainage. Geomicrobiol. J. 26, 71–82. doi: 10.1080/01490450802660193
Shao, H. B., Qafoku, N. P., Lawter, A. R., Bowden, M. E., and Brown, C. F. (2015). Coupled geochemical impacts of leaking CO2 and contaminants from subsurface storage reservoirs on groundwater quality. Environ. Sci. Technol. 49, 8202–8209. doi: 10.1021/acs.est.5b01004
Slonczewski, J. L., Fujisawa, M., Dopson, M., and Krulwich, T. A. (2009). Cytoplasmic pH measurement and homeostasis in bacteria and archaea. Adv. Microb. Physiol. 55, 1–317. doi: 10.1016/S0065-2911(09)05501-5
Stumm, W., and Morgan, J. J. (1996). Aquatic Chemistry. Chemical Equilibria and Rates in Natural Waters. New York, NY: John Wiley & Sons, Inc.
Tempest, D. W. (1970). “The continuous cultivation of micro-organisms: I. Theory of the chemostat,” in Methods in Microbiology, eds J. R. Norris and D. W. Ribbons (New York, NY: Academic Press), 159–276.
Thorstenson, D. C., Fisher, D. W., and Croft, M. G. (1979). The geochemistry of the Fox Hills-Basal Hell Creek Aquifer in southwestern North Dakota and northwestern South Dakota. Water Resour. Res. 15, 1479–1498. doi: 10.1029/WR015i006p01479
Trautz, R. C., Pugh, J. D., Varadharajan, C., Zheng, L., Bianchi, M., Nico, P. S., et al. (2013). Effect of dissolved CO2 on a shallow groundwater system: a controlled release field experiment. Environ. Sci. Technol. 47, 298–305. doi: 10.1021/es301280t
Treude, N., Rosencrantz, D., Liesack, W., and Schnell, S. (2003). Strain FAc12, a dissimilatory iron-reducing member of the Anaeromyxobacter subgroup of Myxococcales. FEMS Microbiol. Ecol. 44, 261–269. doi: 10.1016/S0168-6496(03)00048-5
Tuttle, J. H., Dugan, P. R., and Randles, C. I. (1969). Microbial sulfate reduction and its potential utility as an acid mine water pollution abatement procedure. Appl. Microbiol. 17, 297–302.
van Bodegom, P. (2007). Microbial maintenance: a critical review on its quantification. Microb. Ecol. 53, 513–523. doi: 10.1007/s00248-006-9049-5
Vester, F., and Ingvorsen, K. (1998). Improved most-probable-number method to detect sulfate-reducing bacteria with natural media and a radiotracer. Appl. Environ. Microbiol. 64, 1700–1707.
Videmsek, U., Hagn, A., Suhadolc, M., Radl, V., Knicker, H., Schloter, M., et al. (2009). Abundance and diversity of CO2-fixing bacteria in grassland soils close to natural carbon dioxide springs. Microb. Ecol. 58, 1–9. doi: 10.1007/s00248-008-9442-3
Watanabe, T., Furukawa, S., Hirata, J., Koyama, T., Ogihara, H., and Yamasaki, M. (2003). Inactivation of Geobacillus stearothermophilus spores by high-pressure carbon dioxide treatment. Appl. Environ. Microbiol. 69, 7124–7129. doi: 10.1128/AEM.69.12.7124-7129.2003
Whitman, W., Bowen, T., and Boone, D. (2006). “The methanogenic bacteria,” in The Prokaryotes, eds M. Dworkin, S. Falkow, K.-H. Schleifer, E. Rosenberg, and E. Stackebrandt. (Singapore: Springer), 165–207.
Wilkin, R. T., and Digiulio, D. C. (2010). Geochemical impacts to groundwater from geologic carbon sequestration: controls on pH and inorganic carbon concentrations from reaction path and kinetic modeling. Environ. Sci. Technol. 44, 4821–4827. doi: 10.1021/es100559j
Wimmer, Z., and Zarevúcka, M. (2010). A review on the effects of supercritical carbon dioxide on enzyme activity. Int. J. Mol. Sci. 11, 233–253. doi: 10.3390/ijms11010233
Wu, B., Shao, H., Wang, Z., Hu, Y., Tang, Y. J., and Jun, Y. -S. (2010). Viability and metal reduction of Shewanella oneidensis MR-1 under CO2 stress: implications for ecological effects of CO2 leakage from geologic CO2 sequestration. Environ. Sci. Technol. 44, 9213–9218. doi: 10.1021/es102299j
Yakimov, M. M., Giuliano, L., Crisafi, E., Chernikova, T. N., Timmis, K. N., and Golyshin, P. N. (2002). Microbial community of a saline mud volcano at San Biagio-Belpasso, Mt. Etna (Italy). Environ. Microbiol. 4, 249–256. doi: 10.1046/j.1462-2920.2002.00293.x
Keywords: biogeochemical modeling, available energy, microbial kinetics, carbon sequestration, iron reduction, sulfate reduction
Citation: Jin Q and Kirk MF (2016) Thermodynamic and Kinetic Response of Microbial Reactions to High CO2. Front. Microbiol. 7:1696. doi: 10.3389/fmicb.2016.01696
Received: 11 June 2016; Accepted: 12 October 2016;
Published: 17 November 2016.
Edited by:
Jan Amend, Washington University in St. Louis, USAReviewed by:
Karyn L. Rogers, Rensselaer Polytechnic Institute, USAMarshall Wayne Bowles, University of Bremen, Germany
Copyright © 2016 Jin and Kirk. This is an open-access article distributed under the terms of the Creative Commons Attribution License (CC BY). The use, distribution or reproduction in other forums is permitted, provided the original author(s) or licensor are credited and that the original publication in this journal is cited, in accordance with accepted academic practice. No use, distribution or reproduction is permitted which does not comply with these terms.
*Correspondence: Qusheng Jin, qjin@uoregon.edu