 Olga L. Mayorga1†
 Alison H. Kingston-Smith1Eun J. Kim2
 Gordon G. Allison1
 Toby J. Wilkinson1
 Matthew J. Hegarty1Michael K. Theodorou3
 Charles J. Newbold1
 Sharon A. Huws1*
- 1Institute of Biological, Environmental and Rural Sciences, Aberystwyth University, Aberystwyth, UK
- 2Department of Animal Science, Kyungpook National University, Sangju, Korea
- 3Department of Animal Production, Welfare and Veterinary Sciences, Harper Adams University, Newport, UK
Understanding the relationship between ingested plant material and the attached microbiome is essential for developing methodologies to improve ruminant nutrient use efficiency. We have previously shown that perennial ryegrass (PRG) rumen bacterial colonization events follow a primary (up to 4 h) and secondary (after 4 h) pattern based on the differences in diversity of the attached bacteria. In this study, we investigated temporal niche specialization of primary and secondary populations of attached rumen microbiota using metagenomic shotgun sequencing as well as monitoring changes in the plant chemistry using mid-infrared spectroscopy (FT-IR). Metagenomic Rapid Annotation using Subsystem Technology (MG-RAST) taxonomical analysis of shotgun metagenomic sequences showed that the genera Butyrivibrio, Clostridium, Eubacterium, Prevotella, and Selenomonas dominated the attached microbiome irrespective of time. MG-RAST also showed that Acidaminococcus, Bacillus, Butyrivibrio, and Prevotella rDNA increased in read abundance during secondary colonization, whilst Blautia decreased in read abundance. MG-RAST Clusters of Orthologous Groups (COG) functional analysis also showed that the primary function of the attached microbiome was categorized broadly within “metabolism;” predominantly amino acid, carbohydrate, and lipid metabolism and transport. Most sequence read abundances (51.6, 43.8, and 50.0% of COG families pertaining to amino acid, carbohydrate and lipid metabolism, respectively) within these categories were higher in abundance during secondary colonization. Kyoto encyclopedia of genes and genomes (KEGG) pathways analysis confirmed that the PRG-attached microbiota present at 1 and 4 h of rumen incubation possess a similar functional capacity, with only a few pathways being uniquely found in only one incubation time point only. FT-IR data for the plant residues also showed that the main changes in plant chemistry between primary and secondary colonization was due to increased carbohydrate, amino acid, and lipid metabolism. This study confirmed primary and secondary colonization events and supported the hypothesis that functional changes occurred as a consequence of taxonomical changes. Sequences within the carbohydrate metabolism COG families contained only 3.2% of cellulose activities, on average across both incubation times (1 and 4 h), suggesting that degradation of the plant cell walls may be a key rate-limiting factor in ensuring the bioavailability of intra-plant nutrients in a timely manner to the microbes and ultimately the animal. This suggests that a future focus for improving ruminant nutrient use efficiency should be altering the recalcitrant plant cell wall components and/or improving the cellulolytic capacity of the rumen microbiota.
Introduction
Due to a growing population and increased demand for livestock products by developing countries, current projections estimate that global demand for meat and milk will have doubled by 2050 compared to the start of the twenty-first century (Foresight, 2011). Ruminants supply much of our red meat and nearly all our milk supplies globally. Therefore, there is a real challenge to ensure sustainability and efficiency of ruminant production given that land is also at a premium due to increasing bioenergy crop production. A major hurdle in increasing ruminant productivity is that the conversion of plant to microbial protein is inefficient. As little as 30% of the ingested nitrogen is utilized by ruminants for milk or meat production, and the non-incorporated nitrogen is excreted to the environment as urea or ammonia (MacRae and Ulyatt, 1974; Dewhurst et al., 1996; Kingston-Smith et al., 2008, 2010).
The rumen, via it's complex microbiome is responsible for the breakdown of plant material and the functional capacity of the microbiome defines the amount, quality, and composition of meat and milk produced, whilst also defining the release of nitrogen and greenhouse gases to the environment (Edwards et al., 2008a; Kim et al., 2009; Kingston-Smith et al., 2010; Brown Kav et al., 2012; Huws et al., 2014a). The process of colonizing ingested plant material by the rumen microbiome is rapid (Cheng et al., 1980; Miron et al., 2001; Russell and Rychlik, 2001; Koike et al., 2003a; Edwards et al., 2007, 2008b; Huws et al., 2013, 2014b, 2016), and eventually these populations form mature biofilms encompassed in self-produced polymeric substances (EPS) (Akin, 1976; Cheng et al., 1980, 1981; McAllister et al., 1994; Huws et al., 2013; Leng, 2014). We have previously shown that bacterial diversity attached to fresh perennial ryegrass (PRG) incubated within the rumen is different prior to 4 h and post 4 h of incubation, thus demonstrating that colonization undergoes primary (up to 4 h) and secondary (after 4 h) events, respectively (Huws et al., 2013, 2014b, 2016). Nonetheless, the functionality of the primary and secondary colonizers in terms of plant degradation and availability of nutrients to the host remains unclear.
In this study, we investigated the diversity and function of the attached microbiota using metagenomic based shotgun Illumina sequencing to gain insight into their function and importance in terms of plant degradation and subsequent nutrient availability to the microbes and ultimately the ruminant. Temporal changes in plant chemistry were also monitored using Fourier transform infrared spectroscopy (FT-IR) to confirm that microbial gene abundances were related to substrate changes within the plant itself. Understanding temporal bacterial-driven plant degradation and factors controlling these events will promote the development of novel strategies to increase ruminant production in order to meet the increasing demand for meat and milk.
Materials and Methods
Growth and Preparation of Plant Material
PRG (Lolium perenne cv. AberDart) was grown from seed in plastic seed trays (length 38 cm × width 24 cm × depth 5 cm) filled with compost (Levingtons general purpose). The trays were housed in a greenhouse under natural irradiance with additional illumination provided during the winter months (minimun 8 h photoperiod). A temperature of 22/19°C day/night was maintained and plants were watered twice a week. Plants were harvested after 6 weeks and cut 3 cm above soil level, before washing in cold distilled water and cutting with scissors into 1 cm sections. Sub-samples of plant material were freeze-dried and stored at −20°C for metagenomic sequencing, plant dry matter (DM) and Fourier transform mid-infrared spectroscopy (FT-IR) analysis (0 h samples).
In vitro Incubations
Cut PRG (7.5 g) was added to Duran bottles (250 mL) together with anaerobic incubation buffer (135 mL pre-warmed to 39°C; Van Soest, 1967) and rumen fluid inoculum (15 mL, strained through two layers of muslin and held under CO2 at 39°C; rumen fluid was taken from three cannulated cows grazed mainly on fresh forage and pooled before inoculation). Rumen fluid was obtained from cannulated cows under the authority of Licenses under the UK Animal Scientific Procedures Act, 1986. Bottles were incubated in a horizontally rotating rack at 100 rpm and 39°C (Incubator-shaker, LA Engineering, UK). Bottle contents were harvested at 0.25, 0.5, 1, 2, 4, 8, and 24 h. At each time interval bottle contents were harvested by vacuum filtration through filter paper (11 μm2 pore size; ®QL100, Fisher Scientific, Leicestershire, UK). Retained plant material was washed with phosphate buffered saline (PBS; 50 mL) to remove loosely attached bacteria, before attached bacteria were removed by incubation overnight in gluteraldehyde (3 % v/v in PBS) at 4°C (Azeredo et al., 1999). The remaining plant material from which colonizing bacteria had been removed was retrieved by squeezing contents of overnight gluteraldehyde incubations through one layer of muslin. Plant residues within the muslin were then freeze-dried and weighed to allow calculation of percentage plant degradation. Absence of remaining attached bacteria was also checked using Quantitative PCR (QPCR), as described below, to validate the method of detachment of attached microbes. The plant material was subsequently finely ground with the aid of a reciprocal shaking system in the presence of liquid nitrogen (particle size <0.5 mm) for Fourier transform infrared spectroscopy (FT-IR) analyses. The suspension of previously attached bacteria (supernatant retrieved post squeezing of overnight gluteraldehyde incubations) was centrifuged (10,000 x g, 10 min), before the pellet was freeze-dried for subsequent QPCR and metagenomic sequencing. The experiment was repeated on three separate occasions (n = 3) within the same week.
DNA Extraction, QPCR and Metagenomic Sequencing
DNA extraction and total bacterial 16S rDNA QPCR were completed as described by Huws et al. (2013) and Huws et al. (2016) using the primers 5′-GTG STG CAY GGY TGT CGT CA-3′ (Forward) and 5′-GAG GAA GGTGKG GAY GAC GT-3′ (Reverse) (Maeda et al., 2003). The presence of primary and secondary bacterial colonizing events were initially corroborated using denaturing gradient gel electrophoresis (DGGE) as described by Huws et al. (2013) before taxonomy and function of the primary and secondary attached microbiome was further investigated by sequencing. Essentially, 1 (primary colonizers) and 4 h (secondary colonizers) DNA samples from the attached microbiome were sequenced using Illumina HiSeq DNA was normalized to 0.2 ng/μL and 1 ng used to create metagenomic libraries using the Nextera® XT DNA kit (Invitrogen, San Diego, USA) following manufacturer guidelines. Sample libraries were sequenced at 2 × 151 bp using an Illumina HiSeq 2500 rapid run, following standard manufacturer's instructions at the IBERS Aberystwyth Translational Genomics Facility. Reads of 126 bases were merged and first trimmed to remove the Nextera library adapters then trimmed at the 3′-end when a sliding window over four bases fell below an average Phred Q score of 30. Sequences are deposited and publically available within Metagenomic Rapid Annotation using Subsystem Technology (MG-RAST) [Identification numbers 4653312.3 (1 h), 4653313.3 (1 h), 4653314.3 (1 h), 4653315.3 (4 h), 4653316.3 (4 h), and 4653317.3 (4 h)].
Metagenomic Sequence Analysis
Sequencing files containing the merged, quality trimmed reads, were uploaded to MG-RAST (Meyer et al., 2008) as FASTQ files. The MG-RAST best hit organism abundance function was employed against the RDP comparison pipeline, using constraints of 97% sequence similarity and a maximum e-value of 1 × 10⁻⁵ and minimum sequence alignment of 15, to assign taxonomy to sequences. The MG-RAST functional abundance hierarchical abundance function was employed against the COG database to assign function, based on a maximum e-value of 1 × 10⁻⁵, minimum identity cut-off of 60% and minimum sequence alignment of 15. Normalized taxonomic and functional abundance data were exported as excel files for statistical analysis. Heatmap and bar chart visualization of gene function data was completed within MG-RAST. Eukaryotic rRNA sequences were removed from the analysis (these made up on average 51.6% of the reads obtained and were mainly 18S rDNA from PRG); the COG database does not annotate eukaryote sequences allowing an analysis of taxonomy and function of the rumen prokaryotic microbiota only (Li et al., 2016).
Fourier Transform Infrared Spectroscopy (FT-IR)
Mid infrared spectra reflecting plant chemical composition were obtained at each time point by attenuated total reflectance (ATR) FT-IR analysis using a Bruker Equinox 55 spectrometer (Bruker Optics Ltd., Coventry, UK) equipped with a deuterated tryglycine sulfate detector and a Golden Gate ATR accessory (Specac Ltd., Orpington, UK). Spectra were acquired over the range 4000 to 500 cm−1 as a mean of 32 scans and at a spectral resolution of 4 cm−1 using OPUS software (version 4.2, Bruker Optics Ltd., Coventry, UK).
Statistical Analysis
For plant degradation, QPCR data, taxonomy, and COG gene abundance data, significant differences between groups was determined using one-way analysis of variance (ANOVA) followed by Duncan's multiple range tests to detect significant differences between groups where appropriate (Duncan, 1955) using the GenStat program (Tenth Edition, VSN International Ltd., Hemel Hemstead, UK; Payne et al., 2007). Taxonomy and function based PCoA plots, function based-bar charts, heatmaps, and KEGG pathways were generated in MG-RAST. T-test were conducted within MG-RAST using level 2 COG based bar chart data in order to compare differences in gene abundances for the broad classifications within primary and secondary colonization events. FT-IR spectra were converted to text files using OPUS and imported to Matlab for statistical and chemometricanalysis using Matlab (version 6.5.1) and the Matlab Statistics Toolbox (version 4, The Mathworks, Cambridge, UK). Spectra were analyzed for underlying structure correlating with incubation time by principal component analysis (PCA) (Martens and Naes, 1989; Mariey et al., 2001; Sheng et al., 2006) and significant differences between spectra from different time points were detected using multivariate one-way analysis of variance model (MANOVA). In all instances the threshold of statistical significance was set at P < 0.05.
Results
Plant Dry Matter Disappearance and Attached Bacterial 16S rDNA Abundance
Residual plant digestibility data (with microbes removed) showed that by 4 h 13.6% of the plant material had been degraded with this increasing to 76.2% by 24 h (Table 1). Post incubation of PRG under rumen-like in vitro conditions, rumen bacteria attached quickly to the plant material, and bacterial 16S rDNA abundance increased rapidly and continued to rise for the duration of the experiment; by 4 h attached bacterial 16S rDNA concentration had increased by 1.9X, and by 24 h by 2.6X compared with 0 h concentrations (Table 1).
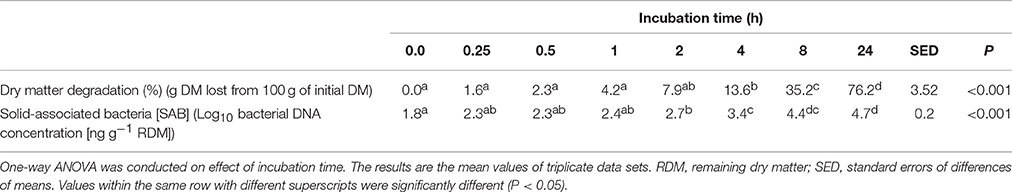
Table 1. Plant dry matter degradation and concentration of attached bacterial 16S rDNA following incubation of fresh perennial ryegrass in the presence of rumen fluid.
Sequencing Data
Post quality control of sequences we obtained on average 0.9 GB/sample, with a mean sequence length of 163 bp (Supplementary Table 1). Rarefaction curves showed that all samples approached a plateau, suggesting reasonable sequence coverage (Supplementary Figure 2).
Taxonomy of the Primary and Secondary Attached Microbiota
Principal coordinate axis (PCoA) plots showed that bacterial diversity differed between 1 and 4 h of colonization (Figure 1). DGGE was also undertaken on samples for all time points and confirmed the presence of primary (up to 4 h) and secondary (post 4 h) bacterial colonization events (Supplementary Figure 1). Phyla level taxonomy showed that the most abundant attached phyla were Firmicutes (66–72% of total read abundances) and Bacteroidetes (15–20% of total read abundances) (Table 2). No significant changes (P > 0.05) in read abundances were evident at a phyla level between primary (1 h) and secondary (4 h) colonization events (Table 2). On an order level, Clostridiales (46–51% of total read abundances), Selemonadales (18% of total read abundances), and Bacteroidales (14–15% of total read abundances) were the most abundant, with the remaining orders representing <3% on average of the total read abundances (Table 3). No significant changes (P > 0.05) in read abundances were evident at an order level between primary (1 h) and secondary (4 h) colonization events (Table 3). Family level taxonomy showed that the most abundant classified families were Lachnospiraceae (25–33% of total read abundances), Veillonellaceae (18% of total read abundances), Prevotellaceae (11–12% of total read abundances), Eubacteriaceae (5–10% of total read abundances), Clostridiaceae (5–7% of total read abundances), and Ruminococcaceae (3–4% of total read abundances), with the remaining families representing <3% on average of total read abundances (Table 4). Significant (P < 0.05) increases in Bacillaceae, Lachnospiraceae, Porphyromonadaceae, and Prevotellaceae were seen during secondary colonization events compared with their rDNA gene abundances present during primary colonization (Table 4). On a genera level, Butyrivibrio (20–23% of total read abundances), Selenomonas (17–18%), Prevotella (10–13%), Eubacterium (5–10%), Pseudobutyrivibrio (4–6%), and Ruminococcus (3%) were the most abundant, with the remaining genera representing <3% on average of total read abundances (Table 5). Significant (P < 0.05) increases in Acidaminococcus, Bacillus, Blautia, Butyrivibrio, and Prevotella, were also seen during secondary colonization events compared with their rDNA gene abundances present during primary colonization (Table 5).
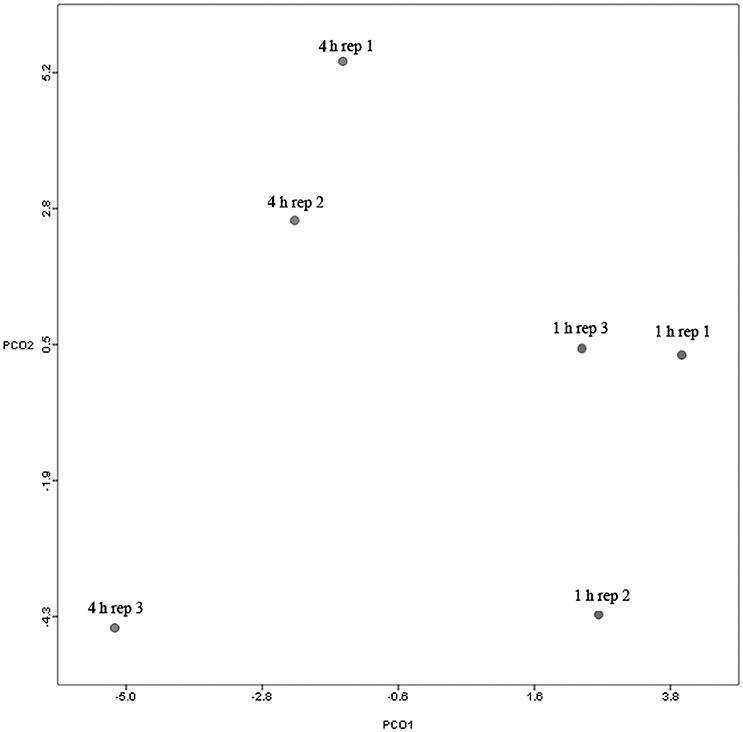
Figure 1. Principal coordinates analysis (PCoA) analysis of taxonomical classifications of attached bacteria present after 1 and 4 h of rumen incubation. Rep: Replicate.
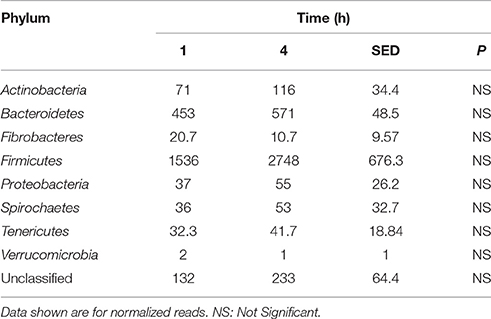
Table 2. Comparison of the primary (1 h) and secondary (4 h) colonizing bacterial phyla attached to perennial ryegrass.
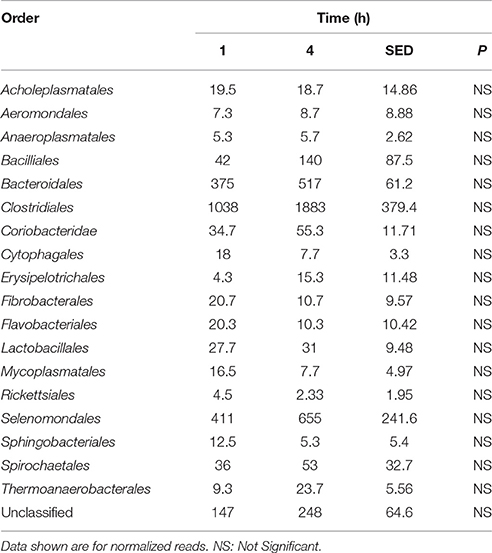
Table 3. Comparison of the primary (1 h) and secondary (4 h) colonizing bacterial orders attached to perennial ryegrass.
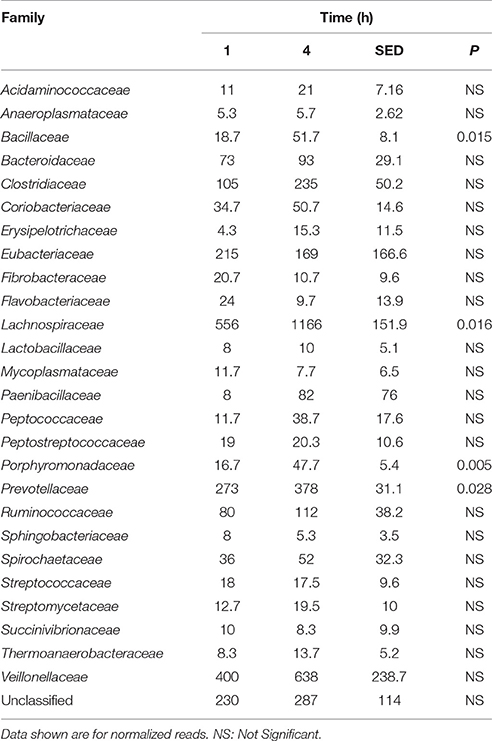
Table 4. Comparison of the primary (1 h) and secondary (4 h) colonizing bacterial families attached to perennial ryegrass.
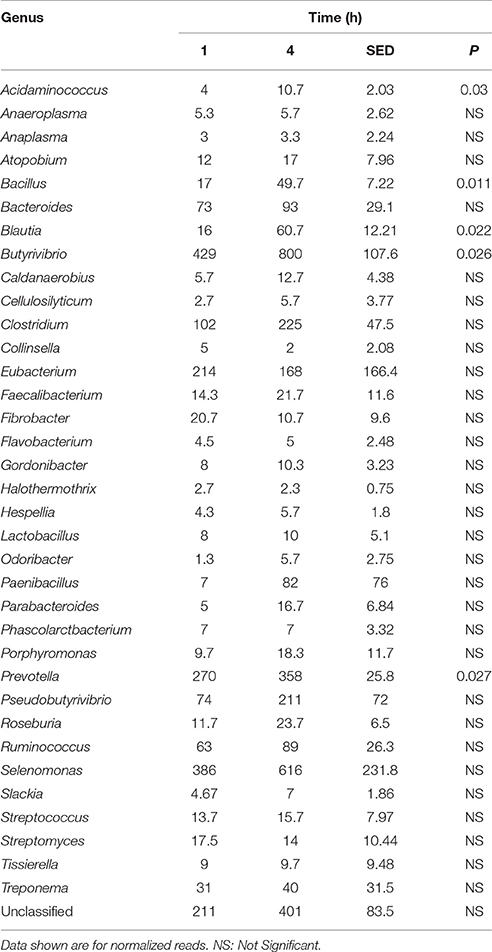
Table 5. Comparison of the primary (1 h) and secondary (4 h) colonizing bacterial genera attached to perennial ryegrass.
Functionality of the Primary and Secondary Attached Microbiota
When assessing bacterial functional gene abundance at 1 and 4 h post rumen incubation, PCoA plots showed that bacterial function differed between 1 and 4 h of colonization (Figure 2). Bar charts generated within MG-RAST based on hierarchical functional categories showed that genes attributed broadly within metabolism, information, storage, and processing and cellular processes and signaling were significantly (P > 0.05) more abundant within secondary colonizing bacteria than they were within the population of primary colonizers (Figure 3A). The COG level 2 heatmap corroborated the difference in functionality seen within the primary and secondary colonizing bacteria (Figure 3B). The heatmap also illustrated that the primary functions of the attached microbiota were amino acid transport and metabolism, carbohydrate transport and metabolism, general function, lipid transport, and metabolism (Figure 3B). Further prospecting of amino acid transport and metabolism COG families showed that 51.6% of the COG families showed significant (P < 0.05) increases in abundance from primary (1 h) to secondary (4 h) colonization events (Table 6). No COG families decreased in significantly in their abundance from primary (1 h) to secondary (4 h) colonization events (Table 6). Further prospecting of carbohydrate transport and metabolism COG families showed that 43.8% of the COG families showed significant (P < 0.05) increases in abundance, whilst only 0.01% significant (P < 0.05) decreased in abundance between primary (1 h) to secondary (4 h) colonization events (Table 7). Only 3.2% of total reads pertained to cellulases (Table 7). Further prospecting of lipid transport and metabolism COG families showed that 50.0% of the COG families showed significant (P > 0.05) increases from primary (1 h) to secondary (4 h) colonization events (Table 8). No COG families decreased significantly in abundance from primary (1 h) to secondary (4 h) colonization events (Table 8). COG families with a low abundance (<1) were omitted from Tables 6–8. KEGG pathway analysis (Figure 4) corroborated that most functional pathways were present within PRG attached bacteria at both 1 and 4 h post rumen incubation with only a few being uniquely found in the attached bacteria at 1 or 4 h of incubation only (Table 9).
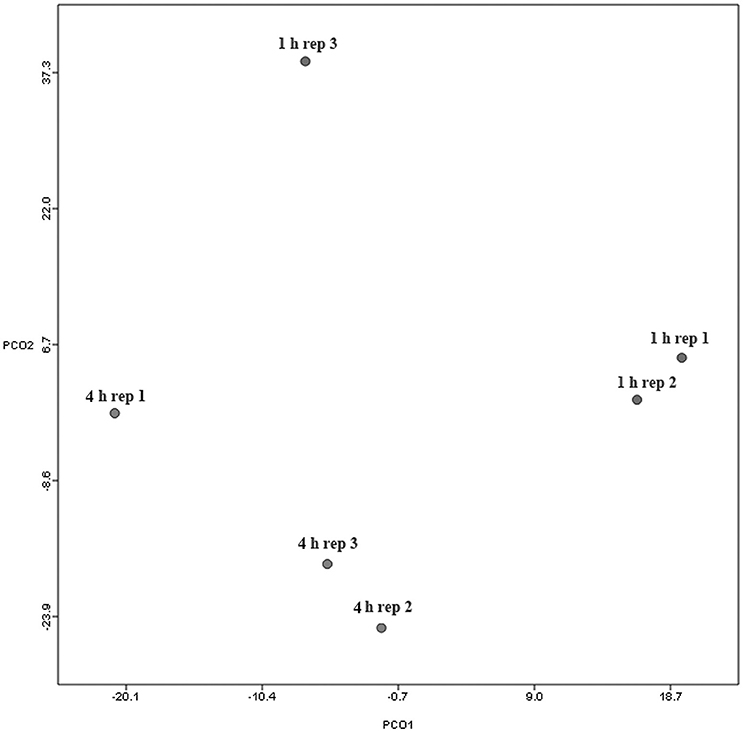
Figure 2. Principal coordinates analysis (PCoA) analysis of functional classifications of attached bacteria present after 1 and 4 h of rumen incubation. Rep: Replicate.
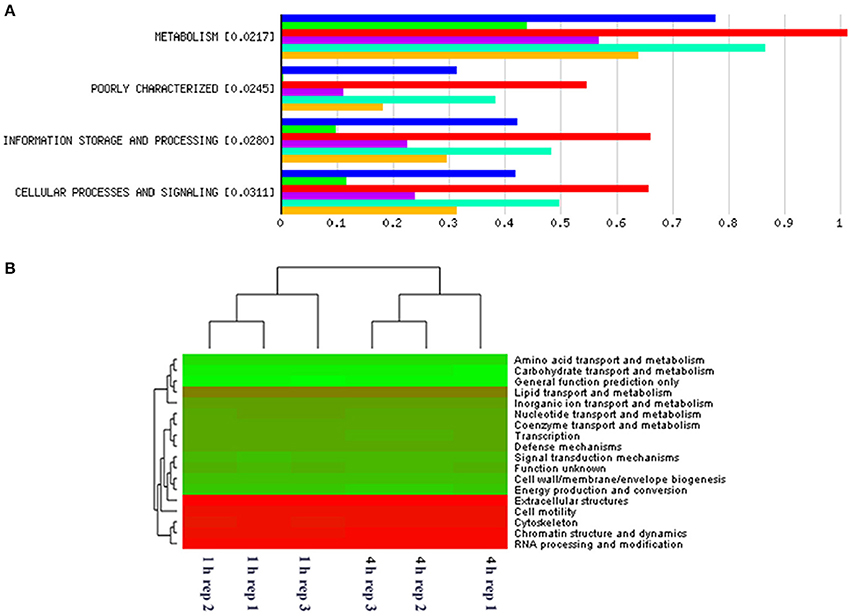
Figure 3. MG-RAST generated bar chart showing differences in gene abundances within primary and secondary perennial ryegrass bacterial attachment events following rumen like incubation [Blue, red, and turquoise bars (triplicate data) show gene abundances for bacteria attached to perennial ryegrass following 4 h of rumen like incubation (secondary colonization) and green, purple, and yellow bars (triplicate data) show gene abundances for bacteria attached to perennial ryegrass following 1 h of rumen like incubation (primary colonization)] with the numbers in brackets denoting significance level when primary and secondary colonizing bacteria gene abundances were compared using t-tests (A). MG-RAST generated heatmap of COG level 2 absolute gene abundances within primary (1 h) and secondary (4 h) perennial ryegrass attached bacteria following rumen like incubation (the more intense the green color, the more abundant those COG families are with red denoting low abundance COG families) (B).
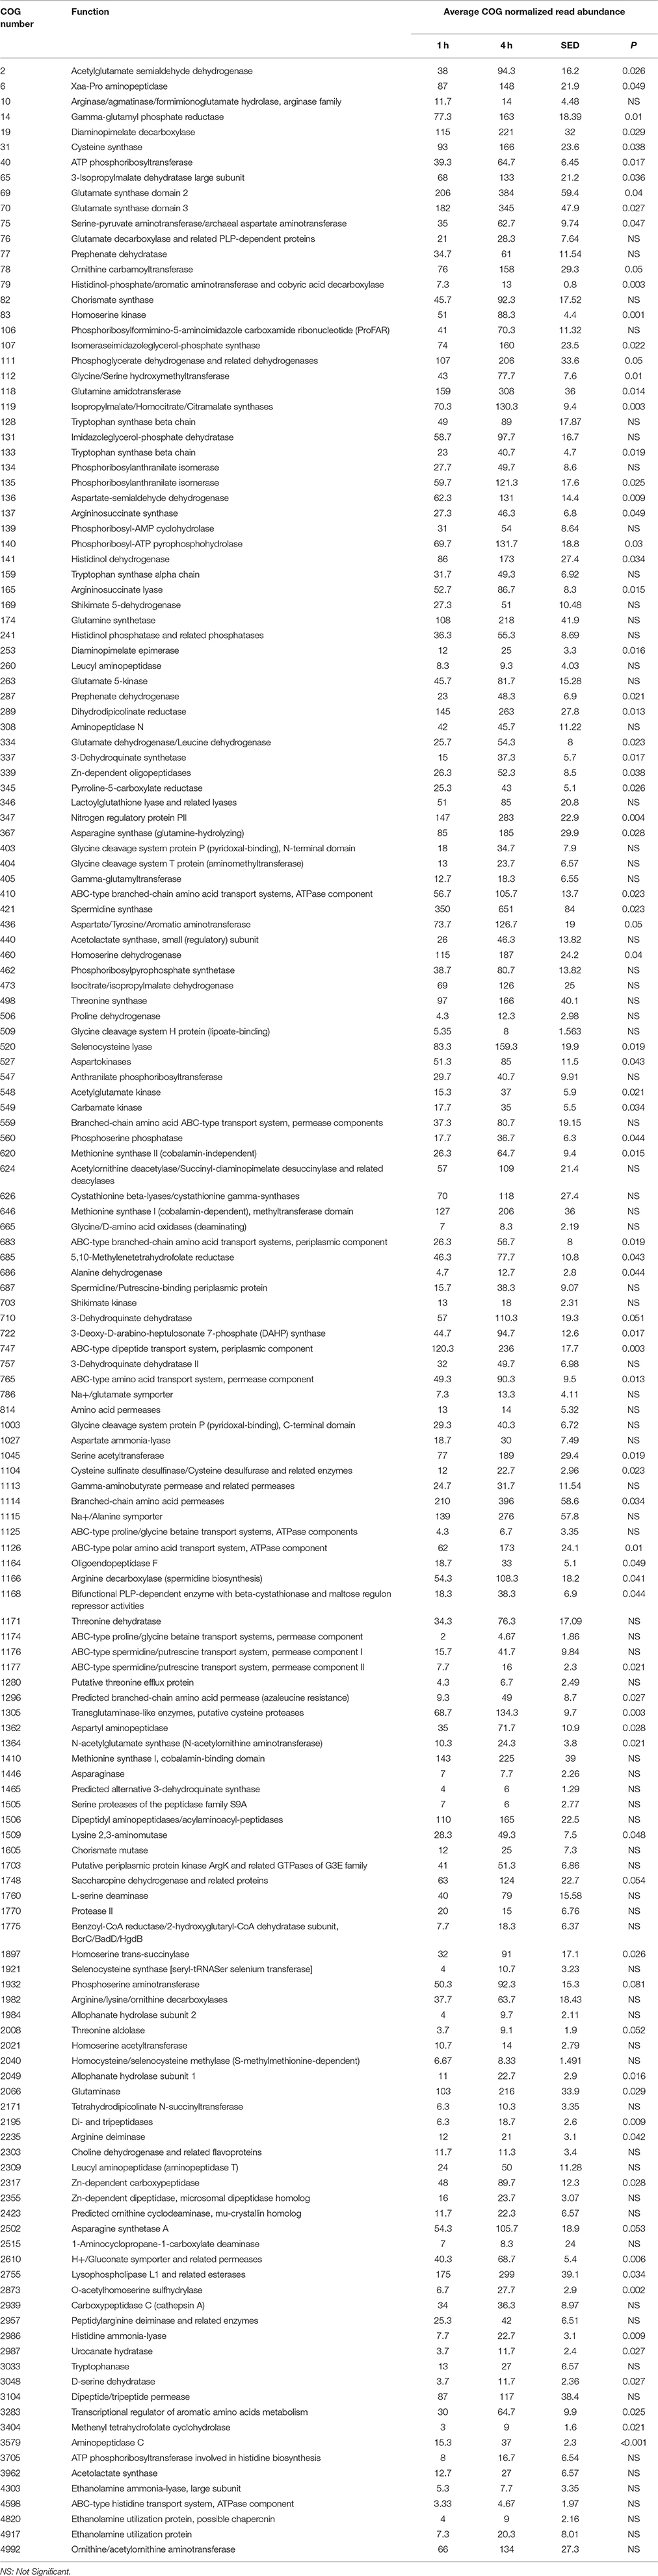
Table 6. Amino acid transport and metabolism clusters of orthologous genes (COG) categories showing significant read abundance differences within the primary (1 h) and secondary (4 h) bacteria attached to perennial ryegrass.
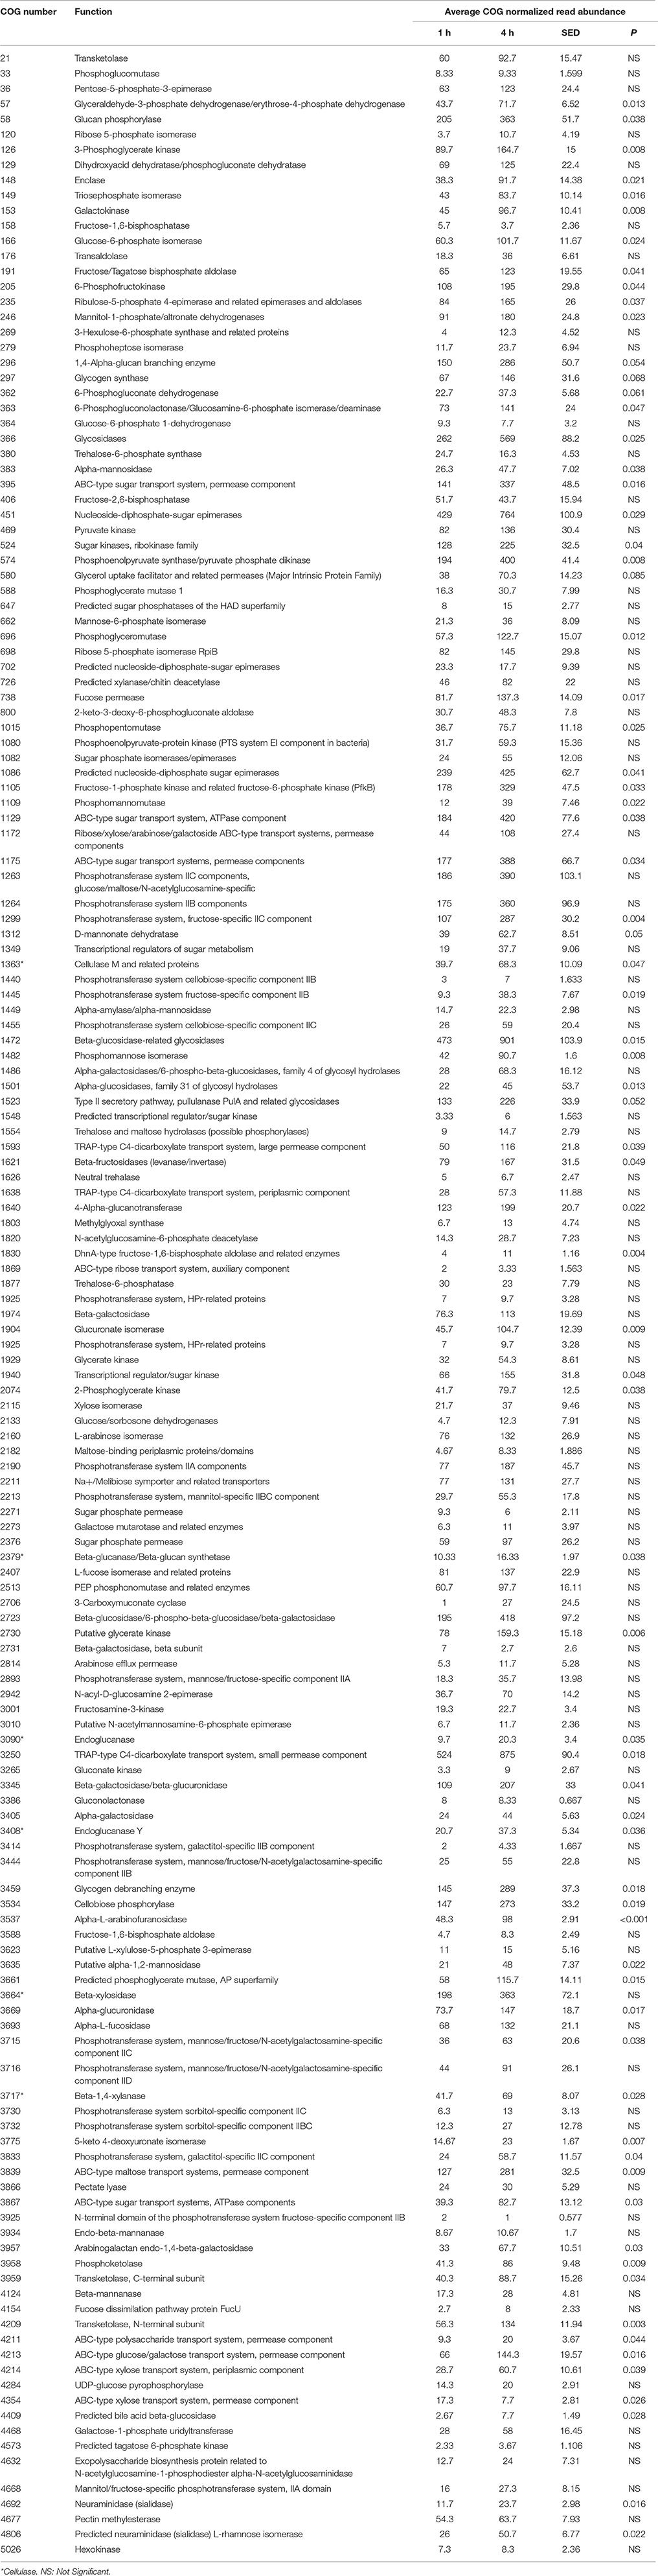
Table 7. Carbohydrate metabolism clusters of orthologous genes (COG) categories showing significant read abundance differences within the primary (1 h) and secondary (4 h) bacteria attached to perennial ryegrass.
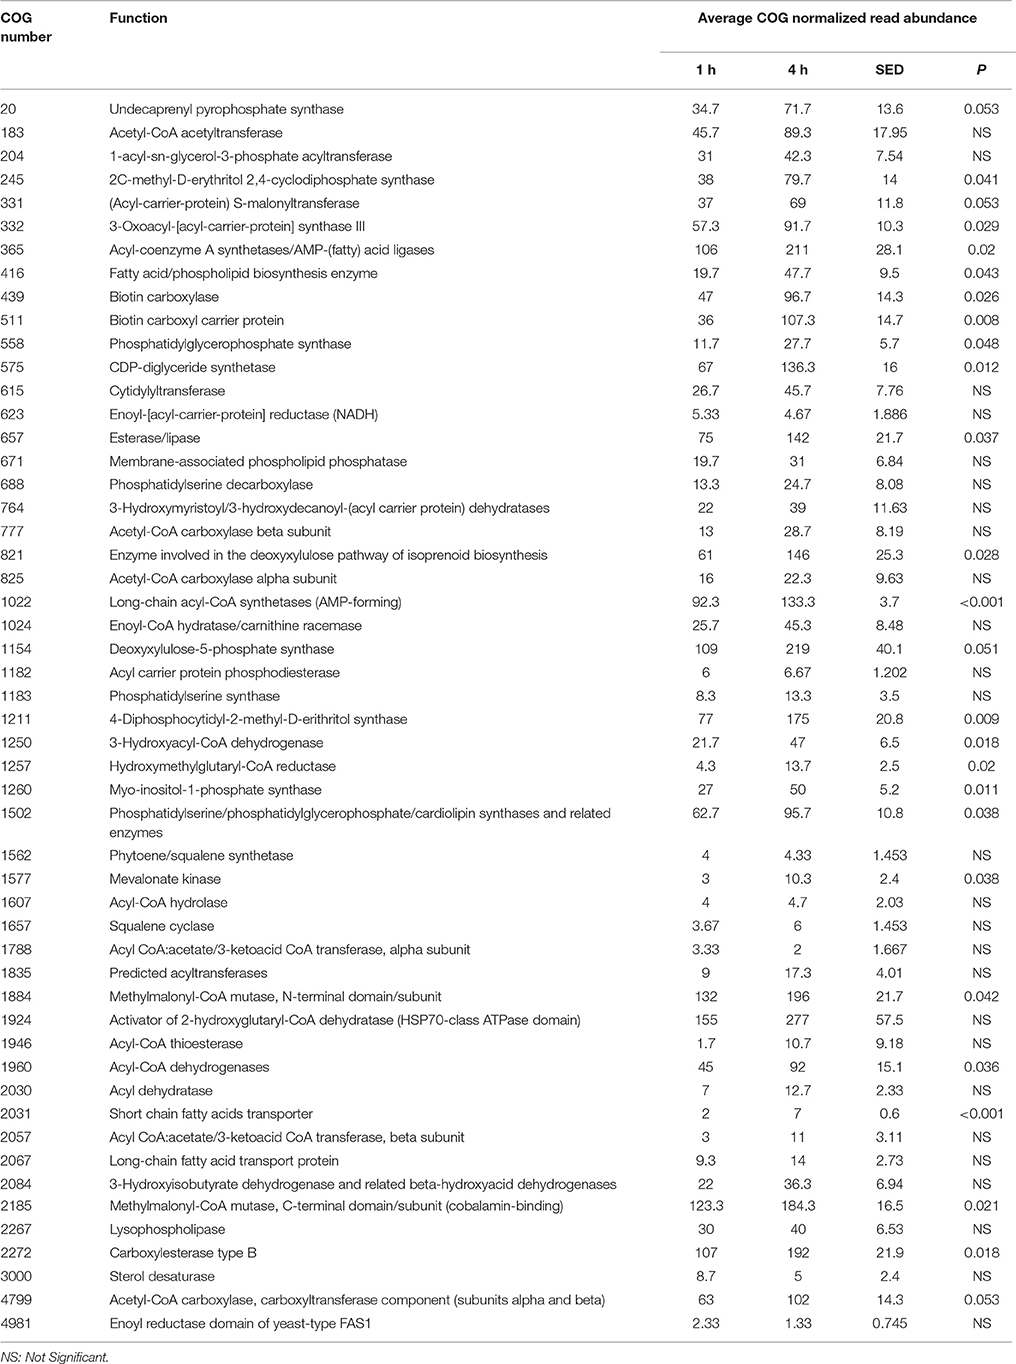
Table 8. Lipid metabolism and transport clusters of orthologous genes (COG) categories showing significant read abundance differences within the primary (1 h) and secondary (4 h) bacteria attached to perennial ryegrass.
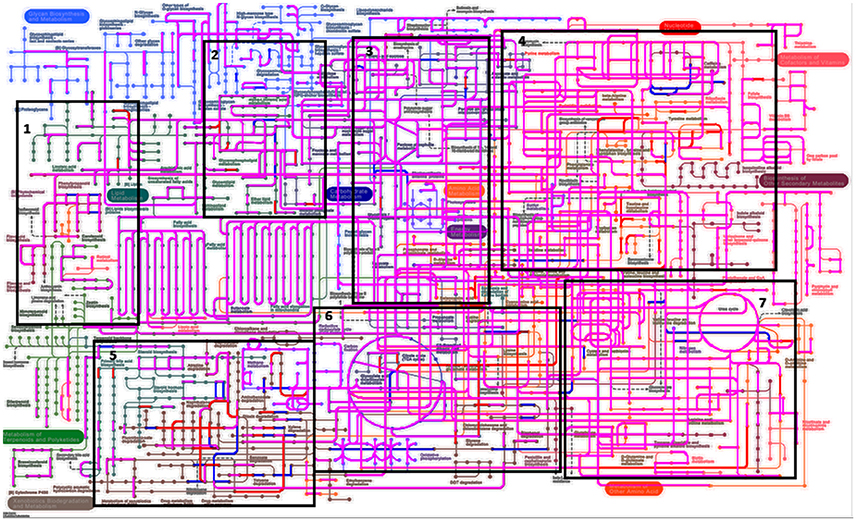
Figure 4. Kyto encyclopedia of genes and genomes (KEGG) pathways exhibited by perennial ryegrass attached rumen bacteria following 1 and 4 h of rumen incubation. Blue lines show pathways present by plant attached bacteria following 1 h of rumen incubation. Red lines show pathways present by plant attached bacteria following 4 h of rumen incubation. Pink/Purple lines show pathways present by plant attached bacteria at both 1 and 4 h of rumen incubation. Boxes 1–7 have been denoted in order to formulate Table 9 listing pathways in blue and red in order to note unique pathways present at one incubation time only.
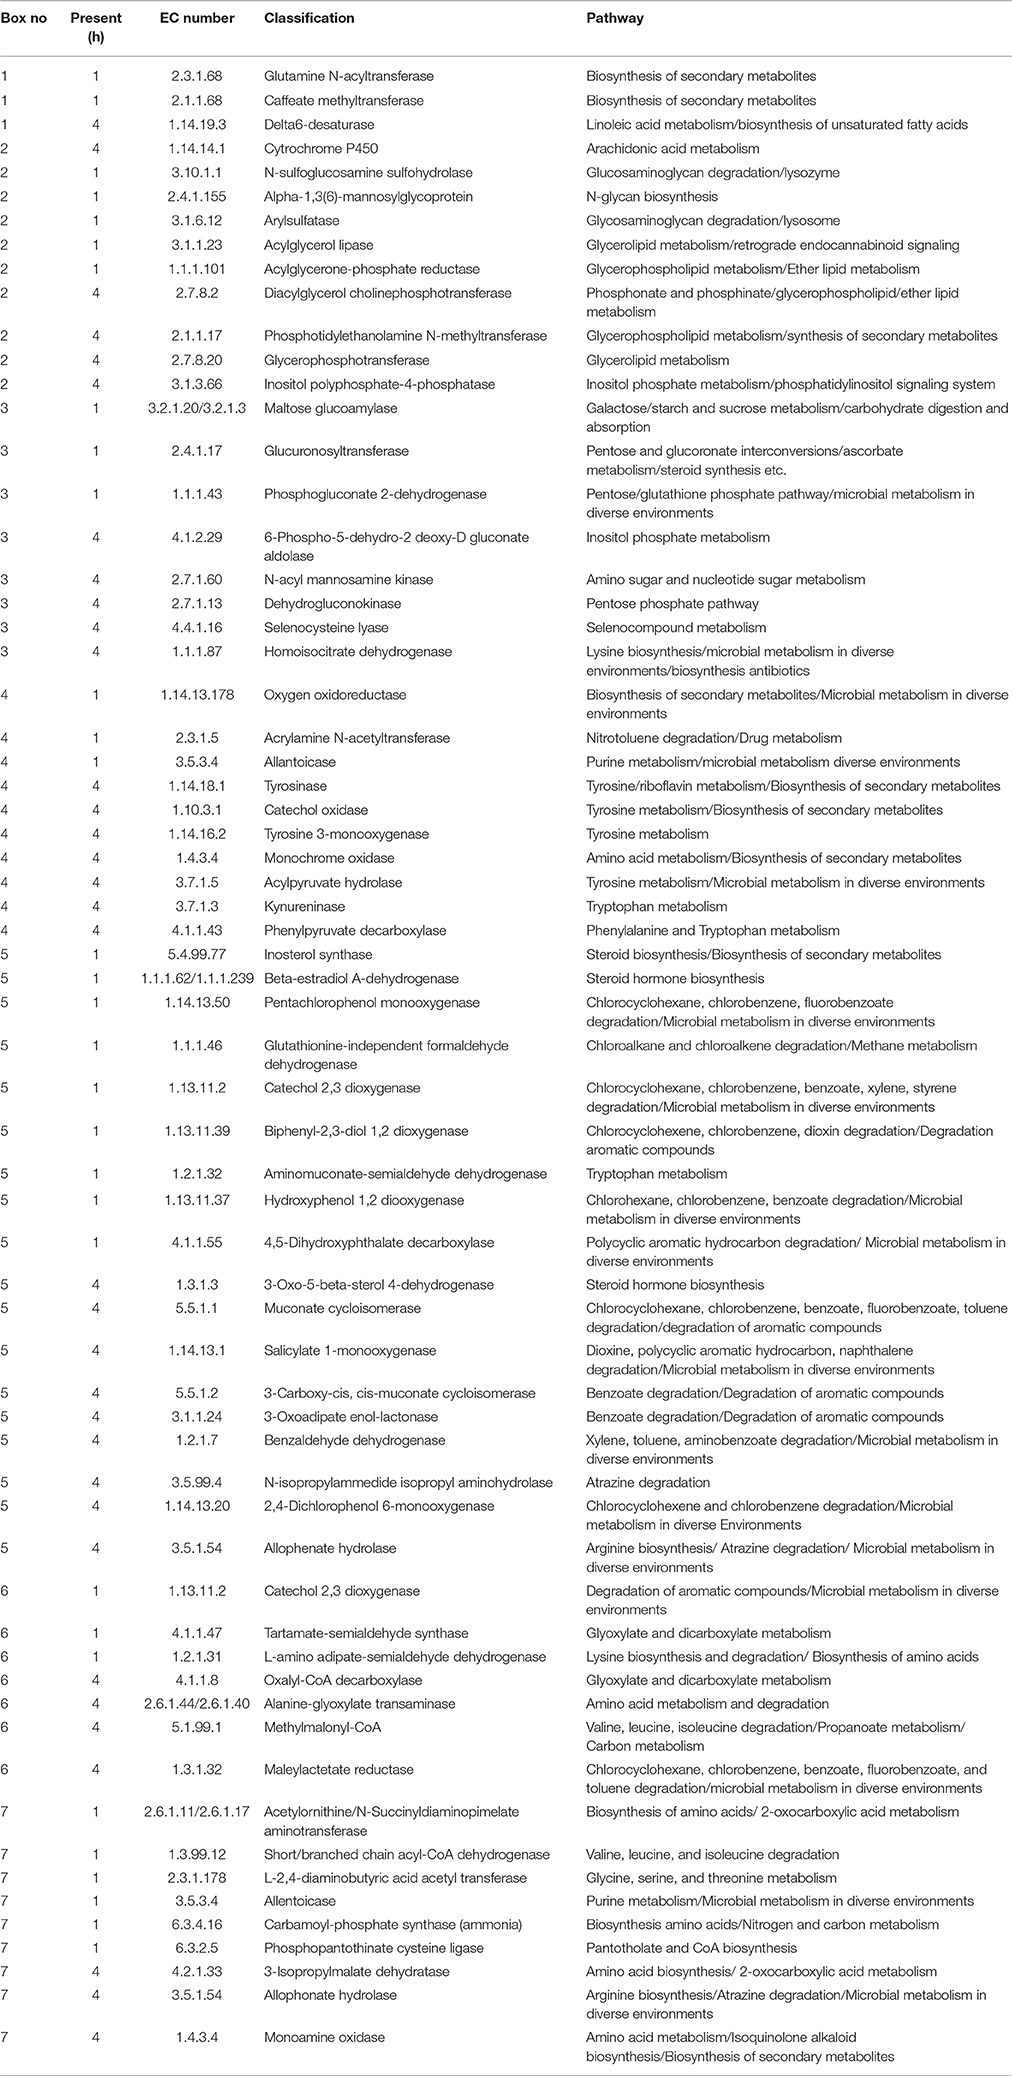
Table 9. Perennial ryegrass attached rumen bacterial functional Kyto encyclopedia of genes and genomes (KEGG) pathways present following either 1 or 4 h of rumen incubation only, and in relation to boxed areas shown in Figure 5.
Plant Chemical Changes
Analysis of FT-IR spectra of residual plant material taken over time, showed that the scores for the first 20 principal components (together accounting for 95% of variance) were significantly different between spectra from different time points (P < 0.001), with plots of the scores for PC1 vs. PC2 (Figure 5) and PC2 vs. PC3 (Figure 6) showing clear clustering between spectra from samples incubated for up to 2 h compared with those incubated for longer periods. It should be noted that the circles drawn to denote clustering have been constructed by eye for ease of interpretation, and not using any statistical methodology. PC 1 accounted for 34.7% of total variance, PC2 accounted for 15.7%, and PC3 10.2%. The spectra for all samples at various time points were similar (Supplementary Figure 3). Analysis of the loadings for PC 1 showed positive contributions (i.e., a decrease in chemical content) from variables at 950 and 1035 cm−1; the first one of which has been reported to be associated with cellulose or possibly galactan (Kacurakova et al., 2000; Alonso-Simon et al., 2004; Supplementary Figure 3), and the second to pectin or xyloglucan (Kacurakova et al., 2000; Alonso-Simon et al., 2004; Supplementary Figure 3). Negative contributions (i.e., and increase in chemical content) to PC1 were present at 1393 and 1598 cm−1, possibly being attributable to the amino amide I absorption of proteins (Schmitt and Flemming, 1998; Supplementary Figure 3). The loadings of PC2 showed similarities with PC1 but additional positive contributions were detected at 1029 cm−1, a region that has also been associated with cellulose content (Kacurakova et al., 2000; Alonso-Simon et al., 2004; Supplementary Figure 3) and 1664 cm−1, which is in the amide I absorption region of amino groups. PC2 was negatively correlated with absorptions at 1394 and 1591 cm−1 (Supplementary Figure 3), PC 2 was positively correlated with absorbances at 2908 and 2850 cm−1, which have been associated with the asymmetric and symmetric stretching on CH2 moieties in fatty acids (Schmitt and Flemming, 1998; Supplementary Figure 3). The loadings for PC3 show positive contributions at 1359 cm−1, corresponding to a CH2 stretch of cellulose (Kacurakova et al., 2000), and several peaks relating to hemicellulose components and pectin at 979, 995, 1045, and 1080 cm−1 (Supplementary Figure 3). PC3 was also negatively correlated with peaks at 161 and 1529 cm−1, corresponding to amide 1 and amide 11 in proteins (Schmitt and Flemming, 1998; Supplementary Figure 3).
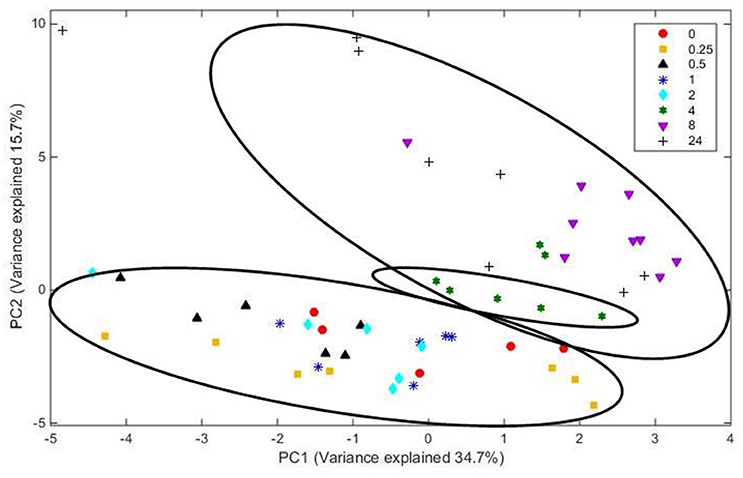
Figure 5. Score plot of principal components PC 1 vs. PC 2 for plant material from which the attached microbes had been removed. Score data sets are of 60 spectra from three analytical replicates and at least two spectral analyses. Circles indicate clusters.
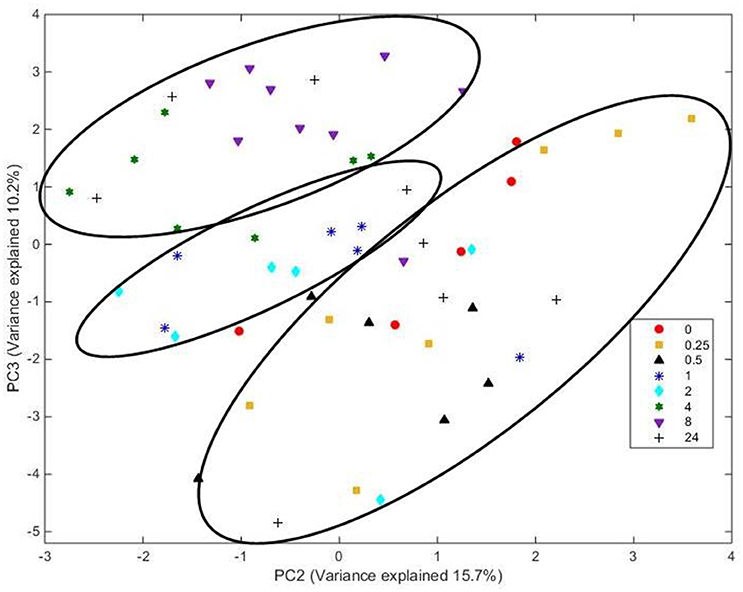
Figure 6. Score plot of principal components PC 2 vs. PC 3 for plant material from which the attached microbes had been removed. Score data sets are of 60 spectra from three analytical replicates and at least two spectral analyses. Circles indicate clusters.
Discussion
In this study, we demonstrate that colonization of PRG by rumen bacteria is biphasic with primary (up to 4 h) and secondary (post 4 h) events observed based on changes seen in attached bacterial diversity. We also demonstrate that these changes in diversity correlate with changes in functional capacity and changes in the metabolome of PRG itself. Thus, despite the resilience and redundancy observed within the rumen microbiome it is apparent, on a DNA level, that diversity and function are linked.
In terms of temporal diversity of the bacteria attached to PRG, the phyla Firmicutes and Bacteroidetes dominated and changes in phyla level diversity were not evident over time. In our previous study investigating changes in diversity of bacteria attached to PRG (16S rRNA based) over time within the rumen, we also noted that Firmicutes and Bacteroidetes dominated, but Fibrobacteres sequence abundances were higher than noted in this study (4% compared with an average of 0.6% in this study; Huws et al., 2016). Piao et al. (2014) when investigating diversity (16S rDNA sequencing) of rumen bacteria attached to switchgrass also noted dominance of Firmicutes and Bacteroidetes irrespective of time. On an order level we found that the Clostridiales, Selemonadales, and Bacteroidales were the most abundant, and changes in order level diversity were not evident over time. Previously we also noted that Clostridiales, Selemonadales, and Bacteroidales were dominant, but also reported that 16S rRNA read abundances of Fibrobacterales, Coriobacterales, and Spirochaetales were also reasonably abundant, representing 4, 3, and 2% of the total sequences reads, respectively (Huws et al., 2016). In this study, read abundances for Fibrobacterales, Coriobacterales, and Spirochaetales were represented 0.6, 1.5, and 1.5% of total reads, respectively. The study conducted by Piao et al. (2014) on the bacteria attached to switchgrass over time also showed similar results to those in our study. On a family level we found that the most abundant classified families were Lachnospiraceae, Veillonellaceae, Prevotellaceae, Eubacteriaceae, Clostridiaceae, and significant (P > 0.05) increases in Bacillaceae, Lachnospiraceae, Porphyromonadaceae, and Prevotellaceae were seen during secondary colonization events compared with abundances present during primary colonization. Previously we also noted that Lachnospiraceae, Veillonellaceae, Prevotellaceae, and Ruminococcaceae were dominant, but we also reported that 16S rRNA read abundances of Fibrobacteraceae and Coriobacteriaceae were reasonably abundant, representing 5 and 2% of the total sequence reads, respectively (Huws et al., 2016). In this study read abundances for Fibrobacteraceae, and Coriobacteriaceae represented 0.6 and 1.5% of total reads, respectively. Thus, Coriobacteriaceae read abundances were reasonably similar between both studies but Fibrobacteraceae were lower in this study. We also found that read abundance for Eubacteriaceae and Clostridiaceae were higher in this study than our previous study (Huws et al., 2016). Again, the study conducted by Piao et al. (2014) on bacteria attached to switchgrass showed similar results to this study in terms of the most abundant families. In this study, we saw increases in Bacillaceae, Lachnospiraceae, Porphyromonadaceae, and Prevotellaceae during secondary colonization compared with abundances present during primary colonization. We noted increases in Lachnospiraceae only between primary and secondary colonization events in our previous study (Huws et al., 2016). On a genus level we found that the most abundant classified genera were Butyrivibrio, Selenomonas, Prevotella, Eubacterium, Pseudobutyrivibrio, and Ruminococcus, with significant (P > 0.05) increases in Acidaminococcus, Bacillus, Blautia, Butyrivibrio, and Prevotella seen during secondary colonization compared with abundances present during primary colonization. In our previous study we also noted that Butyrivibrio, Selenomonas, Prevotella, Pseudobutyrivibrio, dominated the attached microbiota irrespective of time (Huws et al., 2016). We also found that Olsenella and Fibrobacter were reasonably dominant previously, which was not apparent in this study. The previous study also indicated that Pseudobutyrivibrio increased in abundance during the secondary phase of colonization. Again, the study conducted by Piao et al. (2014) showed similar results to those in this study in terms of the most abundant bacterial genera attached to switchgrass over time. The similarities between our in vitro study and these in sacco studies (Piao et al., 2014; Huws et al., 2016) demonstrate that in vitro rumen incubations are reasonably representative of attachment events that occur within the rumen itself. Also, the use of shotgun metagenomic sequencing in these studies, as compared with results from other studies using 16S rRNA (RNA and DNA) based sequencing illustrates that non-amplification based techniques are beneficial for taxonomical identification as well as allowing insight into the functionality of the rumen microbiota.
In terms of the temporal functional capacity of the attached bacteria, there was a clear difference between the function of the primary attached bacteria and that of the secondary attached bacteria. The main functions seen were broadly within the COG categories metabolism, information, storage and processing, and cellular processes and signaling with gene abundances in all three of these categories being higher at 4 h of colonization compared with abundances at 1 h of colonization. Specifically, amino acid, carbohydrate, and lipid storage and transport were the main functionalities demonstrated by the attached bacteria (all residing within the function metabolism). Most of the genes within amino acid, carbohydrate and lipid storage and transport functional categories were increased in abundance during secondary colonization. KEGG pathway analysis showed that most pathways were present within PRG attached bacteria following both 1 and 4 h of rumen incubation, thus this coupled with the COG abundance data suggests that secondary colonization events is associated largely with increases in abundance of genes present during primary colonization. These increases correlate with increases in the genera Acidaminococcus, Bacillus, Butyrivibrio, and Prevotella suggesting that these are the bacteria responsible for the increase in amino acid, carbohydrate and lipid metabolism seen during secondary colonization. Acidaminococcus are asaccharolytic but have the capacity of producing ammonia (Eschenlauer et al., 2002). Butyrivibrio spp. are also known for their proteolytic, biohydrogenating, and carbohydrate degradation within the rumen context (Hobson and Stewart, 1997; Krause et al., 2003). Rumen Prevotella spp. are often referred to as amylolytic and proteolytic, but they also have carbohydrate metabolic capacity (Gardener et al., 1995; Krause et al., 2003; Accetto and Avguštin, 2015; Kishi et al., 2015). Interestingly, the number of COG carbohydrate families classifying as cellulases was on average only 3.2% of the total normalized reads within those sequences classified as COG families involved in carbohydrate metabolism. Conversely in the study by Hess et al. (2011), 23% of the glycosyl hydrolases identified in the switchgrass attached bacteria post 24 h of rumen incubation were putative cellulases. The sequencing depth in the study by Hess et al. (2011) was 268 GB whereas we obtained on average 0.9 GB which may explain the differential in identifiable cellulases, coupled with the use of different forages substrates. Nonetheless, it is more likely a consequence of the fact that Hess et al. (2011) harvested bacteria from 24 h incubations when fermentation will be at a very advanced state compared to our study. Indeed, DM degradation in this study show that by 24 h 76% of the plant material was degraded as compared to 35% at 8 h of incubation. Irrespective, our data is suggestive that changing the cell wall characteristics of the plant material to focus on decreasing recalcitrance of structural carbohydrates may allow more efficient breakdown of the cell wall and increase speed of bioavailability of intra-plant nutrients to the microbes and the ruminant. Conversely, developing novel strategies to increase the cellulases, particularly endocellulase, capacity of the microbiota may result in more efficient breakdown of the cell wall and increases speed of bioavailability of intra-plant nutrients to the microbes and the ruminant.
Multivariate analysis of the FT-IR spectra corroborated the metagenomic data by showing increases in carbohydrates, amino acids, and lipid metabolism from primary to secondary colonization. The plant protein and lipid changes may have occurred within the plant itself irrespective of having an attached microbial community as we know that fresh forage is capable of degrading its own protein and lipids within the first 2 h of ruminal incubation (Kingston-Smith et al., 2003, 2008; Lee et al., 2004). A recent publication by Kingston-Smith et al. (2013) used FT-IR to investigate the metabolite fingerprint of the interactome generated during colonization of fresh PRG. In that work, richness of the spectra derived from a combination of metabolic activities of plant and bacterial chemistries (forage plus attached bacteria) meant that analysis of the resultant metabolite profiles did not demonstrate clear differences between 2 and 4 h although a slight change from 8 h onwards was noted. Hence, the results reported here further our understanding of forage degradation by illustrating the changes in plant chemistry that are specifically associated with sequential microbial colonization events when fresh forage is incubated under rumen-like conditions.
In conclusion, the data obtained in this study illustrate that temporal changes in the diversity of bacteria attached to PRG, between primary (up to 4 h) and secondary (post 4 h) colonization events, correlate with increases in amino acid, carbohydrate and lipid storage and transport functional capacity. This data suggests that these changes in gene abundance result in increased metabolism of plant amino acids, carbohydrates and lipids during secondary colonization events. The data suggests that the capacity of the rumen microbes to degrade the more recalcitrant components of the plant cell wall may be the rate limiting factor in increasing bioavailability of nutrients to the microbes and ultimately the ruminant during the first 4 h post-ingestion. Future strategies to increase ruminant nutrient use efficient should investigate the benefits of reducing the recalcitrant nature of the plant cell wall and/or increasing the cellulolytic capacity of the rumen microbiome within early colonization events in particular.
Author Contributions
SH, EK, AK, MT, and CN conceived the project. OM completed the laboratory work under supervision of SH and EK. TW, MH and SH completed the sequencing and downstream analysis of the sequences. SH wrote the paper with input from all co-authors. GA helped OM with FT-IR analysis.
Funding
We acknowledge funding from COLCIENCIAS, CORPOICA (Colombia) and the Biological Sciences Research Council, UK via grant number BB/J0013/1; BBS/E/W/10964A-01. SH is also funded 75% by the Coleg Cymraeg Cenedlaethol.
Conflict of Interest Statement
The authors declare that the research was conducted in the absence of any commercial or financial relationships that could be construed as a potential conflict of interest.
Acknowledgments
We are also grateful to Mark Scott for his technical assistance in setting up the experiments.
Supplementary Material
The Supplementary Material for this article can be found online at: http://journal.frontiersin.org/article/10.3389/fmicb.2016.01854/full#supplementary-material
Supplementary Table 1. Average sequence summary information obtained from attached primary bacterial biofilm communities over all time points.
Supplementary Figure 1. Representative PCR-DGGE derived un-weight pair group method with arithmetic mean (UPGMA) dendograms showing temporal attached bacterial diversity in the presence of fresh perennial ryegrass for experimental replicate 1 (Replicate 2 and 3 showed very similar results). The numbers represent the different incubation times and scale relates to percent similarity.
Supplementary Figure 2. Rarefaction curve showing metagenomic sequencing depth obtained for each sample.
Supplementary Figure 3. FT-IR normalized spectra showing the change in signal intensity (absorbance) for decolonized plant material (plant material with the attached microbes removed) as function of incubation time. Spectral data are from 60 spectra from three analytical replicates and at least two spectral analyses.
References
Accetto, T., and Avguštin, G. (2015). Polysaccharide utilization locus and CAZYme genome repertoires reveal diverse ecological adaptation of Prevotella species. Syst. Appl. Microbiol. 38, 453–461. doi: 10.1016/j.syapm.2015.07.007
Akin, D. E. (1976). Ultrastructure of rumen bacterial attachment to forage cell walls. Appl. Environ. Microbiol. 31, 562–568.
Alonso-Simon, A., Encina, A. E., Garcia-Angulo, P., Alvarez, J. M., and Acebes, J. L. (2004). FTIR spectroscopy monitoring of cell wall modifications during the habituation of bean (Phaseolus vulgaris L.) callus cultures to dichlobenil. Plant Sci. 167, 1273–1281. doi: 10.1016/j.plantsci.2004.06.025
Azeredo, J., Lazarova, V., and Oliveira, R. (1999). Methods to extract the exopolymeric matrix from biofilms: a comparative study. Water Sci. Technol. 39, 243–250. doi: 10.1016/S0273-1223(99)00174-2
Brown Kav, A., Sasson, G., Jami, E., Doron-Faigenboim, A., Benhar, I., and Mizrahi, I. (2012). Insights into the bovine plasmidome. Proc. Natl. Acad. Sci. U.S.A. 109, 5452–5457. doi: 10.1073/pnas.1116410109
Cheng, K. J., Fay, J. P., Coleman, R. N., Milligan, L. P., and Costerton, J. W. (1981). Formation of bacterial microcolonies on feed particles in the rumen. Appl. Environ. Microbiol. 41, 298–305.
Cheng, K. J., Fay, J. P., Howarth, R. E., and Costerton, J. W. (1980). Sequence of events in the digestion of fresh legume leaves by rumen bacteria. Appl. Environ. Microbiol. 40, 613–625.
Dewhurst, R. J., Mitton, A. M., Offer, N. W., and Thomas, C. (1996). Effect of the composition of grass silages on milk production and nitrogen utilisation by dairy cows. Animal Sci. 62, 25–34. doi: 10.1017/S1357729800014272
Edwards, J. E., Huws, S. A., Kim, E. J., and Kingston-Smith, A. H. (2007). Characterisation of the dynamics of initial bacterial colonization of nonconserved forage in the bovine rumen. FEMS Microbiol. Ecol. 62, 323–335. doi: 10.1111/j.1574-6941.2007.00392.x
Edwards, J. E., Huws, S. A., Kim, E. J., Lee, M. R. F., Kingston-Smith, A. H., and Scollan, N. D. (2008a). Advances in microbial ecosystem concepts and their consequences for ruminant agriculture. Animal 2, 653–660. doi: 10.1017/S1751731108002164
Edwards, J. E., Kingston-Smith, A. H., Jiminez, H. R., Huws, S. A., Skot, K., Griffith, G. W., et al. (2008b). Dynamics of initial colonization of non-conserved perennial ryegrass by anaerobic fungi in the bovine rumen. FEMS Microbiol. Ecol. 66, 537–545. doi: 10.1111/j.1574-6941.2008.00563.x
Eschenlauer, S. C., Mckain, N., Walker, N. D., McEwan, N. R., Newbold, C. J., and Wallace, R.J. (2002). Ammonia production by ruminal microorganisms and enumeration, isolation and chracterization of bacteria capable of growth on peptides and amino acids from the sheep rumen. Appl. Environ. Microbiol. 68, 4925–4931.
Foresight (2011). The Future of Food and Farming: Challenges and Choices for Global Sustainability. FAOStat, UK Government Report.
Gardener, R. G., Wells, J. E., Russell, J. B., and Wilson, D. B. (1995). The cellular location of Prevotella ruminocola beta-1, 4-D-endoglucanase and its occurrence in other strains of ruminal bacteria. Appl. Environ. Microbiol. 61, 3288–3292.
Hess, M., Sczyrba, A., Egan, R., Kim, T. W., Chokhawala, H., Schroth, G., et al. (2011). Metagenomic discovery of biomass-degrading genes and genomes from cow rumen. Science 331, 463–467. doi: 10.1126/science.1200387
Hobson, P. N., and Stewart, C. S. (eds.). (1997). The Rumen Microbial Ecosystem. Dordrecht: Springer Netherlands.
Huws, S. A., Edwards, J. E., Creevey, C. J., Rees Stevens, P., Lin, W., Girdwood, S. E., et al. (2016). Temporal dynamics of the metabolically active rumen bacteria colonising fresh perennial ryegrass. FEMS Microbiol. Ecol. 92:e0149095. doi: 10.1093/femsec/fiv137
Huws, S. A., Kim, E. J., Cameron, S. J., Girdwood, S. E., Davies, L., Tweed, J., et al. (2014a). Characterization of the rumen lipidome and microbiome of steers fed a diet supplemented with flax and echium oil. Microb. Biotech. 8, 331–341. doi: 10.1111/1751-7915.12164
Huws, S. A., Mayorga, O. L., Theodorou, M. K., Kim, E. J., Cookson, A. H., Newbold, C. J., et al. (2014b). Differential colonization of plant parts by the rumen microbiota is likely to be due to different forage chemistries. J. Microbiol. Biochem. 6, 80–86. doi: 10.4172/1948-5948.1000126
Huws, S. A., Mayorga, O. L., Theodorou, M. K., Kim, E. J., Newbold, C. J., and Kingston-Smith, A. H. (2013). Successional colonization of perennial ryegrass by rumen bacteria. Lett. Appl. Microbiol. 56, 186–196. doi: 10.1111/lam.12033
Kacurakova, M., Capek, P., Sasinkova, V., Wellner, N., and Ebringerova, A. (2000). FT-IR study of plant cell wall model compounds: pectic polysaccharides and hemicelluloses. Carbohydr. Polym. 43, 195–203. doi: 10.1016/S0144-8617(00)00151-X
Kim, E. J., Huws, S. A., Lee, M. R. F., and Scollan, N. D. (2009). Dietary transformation of lipid in the rumen microbial ecosystem. Asian-Aust. J. Anim. Sci. 9, 1341–1350. doi: 10.5713/ajas.2009.r.11
Kingston-Smith, A. H., Bollard, A. L., Armstead, I. P., Thomas, B. J., and Theodorou, M. K. (2003). Proteolysis and cell death in clover leaves is induced by grazing. Protoplasma 220, 119–129. doi: 10.1007/s00709-002-0044-5
Kingston-Smith, A. H., Davies, T. E., Edwards, J. E., and Theodorou, M. K. (2008). From plants to animals; the role of plant cell death in ruminant herbivores. J. Exp. Bot. 59, 521–532. doi: 10.1093/jxb/erm326
Kingston-Smith, A. H., Davies, T. E., Rees Stevens, P., and Mur, L. A. (2013). Comparative metabolite fingerprinting of the rumen system during colonisation of three forage grass (Lolium perenne L.) varieties. PLoS ONE 27, 8:e82801. doi: 10.1371/journal.pone.0082801
Kingston-Smith, A. H., Edwards, J. E., Huws, S. A., Kim, E. J., and Abberton, M. (2010). Plant-based strategies towards minimising livestock's shadow. Proc. Nut. Soc. 4, 1–8. doi: 10.1017/s0029665110001953
Kishi, L. T., de Jesus, R. B., Pavani, C. D., Lemos, E. G., and de Souza, J. A. (2015). Metagenomic Assembly and Draft Genome Sequence of an Uncharacterized Prevotella sp. from Nelore Rumen. Genome Announc. 9, e00723–15. doi: 10.1128/genomeA.00723-15
Koike, S., Pan, J., Kobayashi, Y., and Tanaka, K. (2003a). Kinetics of in sacco fibre-attachment of representative ruminal cellulolytic bacteria monitored by competitive PCR. J. Dairy Sci. 86, 1429–1435. doi: 10.3168/jds.S0022-0302(03)73726-6
Krause, D. O., Denman, S. E., Mackie, R. I., Morrison, M., Rae, A. L., Attwood, G. T., et al. (2003). Opportunities to improve fiber degradation in the rumen: microbiology, ecology, and genomics. FEMS Microbiol. Rev. 27, 663–693. doi: 10.1016/S0168-6445(03)00072-X
Lee, M. R. F., Winters, A. L., Scollan, N. D., Dewhurst, R. J., Theodorou, M. K., and Minchin, F. (2004). Plant-mediated lipolysis and proteolysis in red clover with different polyphenol oxidase activities. J. Sci. Food Agri. 84, 1639–1645. doi: 10.1002/jsfa.1854
Leng, R. A. (2014). Interactions between microbial consortia in biogilms: a paradigm shift in rumen microbial ecology and enteric methane mitigation. Animal Prod. Sci. 54, 519–543. doi: 10.1071/AN13381
Li, L., Stockert, C. J. Jr, and Roos, D. S. (2016). OrthoMCL: identification of ortholog groups for eukaryotic genomes. Gen. Res. 13, 2178–2189. doi: 10.1101/gr.1224503
MacRae, J. C., and Ulyatt, M. J. (1974). Quantitative digestion of fresh herbage by sheep. 2. Sites of some nitrogenous constituents. J. Agric. Sci. 82, 309–319. doi: 10.1017/S0021859600059207
Maeda, H., Fujimoto, C., Haruki, Y., Maeda, T., Kokeguchi, S., Petelin, M., et al. (2003). Quantitative real-time PCR using TaqMan and SYBR Green for Actinobacillus actinomycetemcomitans, Porphyromonas gingivalis, Prevotella intermedia, tetQ gene and total bacteria. FEMS Immunol. Med. Mic. 39, 81–86. doi: 10.1016/S0928-8244(03)00224-4
Mariey, L., Signolle, J. P., Amiel, C., and Travert, J. (2001). Discrimination, classification, identification of microorganisms using FTIR spectroscopy and chemometrics. Vib. Spectroscopy 26, 151–159. doi: 10.1016/S0924-2031(01)00113-8
McAllister, T. A., Bae, H. D., Jones, G. A., and Cheng, K. J. (1994). Microbial attachment and feed digestion in the rumen. J. Anim. Sci. 72, 3004–3018.
Meyer, F., Paarmann, D., D'souza, M., Olson, R., Glass, E. M., Kubal, M., et al. (2008). The Metagenomics RAST Server: A Public Resource for the Automatic Phylogenetic and Functional Analysis of Metagenomes. BMC Bioinformatics 9:386. doi: 10.1186/1471-2105-9-386
Miron, J., Ben-Ghedalia, D., and Morrison, M. (2001). Invited review: adhesion mechanisms of rumen cellulolytic bacteria. J. Dairy Sci. 84, 1294–1309. doi: 10.3168/jds.S0022-0302(01)70159-2
Payne, R. W., Murray, D. A., Harding, S. A., Baird, D. B., and Soutar, D. M. (2007). GenStat® for Windows™ 9th Edition, Introduction. Hemel Hempstead, UK: VSN International.
Piao, H., Lachman, M., Malfatti, S., Sczyrba, A., Knierim, B., Auer, M., et al. (2014). Temporal dynamics of fibrolytic and methanogenic rumen microorganisms during in situ incubation of switchgrass determined by 16S rRNA gene profiling. Front Microbiol. 5:307. doi: 10.3389/fmicb
Russell, J. B., and Rychlik, J. L. (2001). Factors that alter rumen microbial ecology. Science 292, 1119–1122. doi: 10.1126/science.1058830
Schmitt, J., and Flemming, H.-C. (1998). FTIR-spectroscopy in microbial and material analysis. Int. Biodeterio Biodegrad. 41, 1–11. doi: 10.1016/S0964-8305(98)80002-4
Sheng, G.-P., Yu, H. Q., and Wang, C.-M. (2006). FTIR-spectral analysis of two photosynthetic H2-producing strains and their extracellular polymeric substances. Appl. Microbiol. Biotechnol. 73, 204–210. doi: 10.1007/s00253-006-0442-2
Keywords: metagenomics, microbiome, rumen, bacteria, colonization, perennial ryegrass, plant degradation
Citation: Mayorga OL, Kingston-Smith AH, Kim EJ, Allison GG, Wilkinson TJ, Hegarty MJ, Theodorou MK, Newbold CJ and Huws SA (2016) Temporal Metagenomic and Metabolomic Characterization of Fresh Perennial Ryegrass Degradation by Rumen Bacteria. Front. Microbiol. 7:1854. doi: 10.3389/fmicb.2016.01854
Received: 01 July 2016; Accepted: 03 November 2016;
Published: 18 November 2016.
Edited by:
Zhongtang Yu, Ohio State University, USAReviewed by:
Suzanne Lynn Ishaq, Montana State University, USASeungha Kang, Commonwealth Scientific and Industrial Research Organisation (CSIRO), Australia
Copyright © 2016 Mayorga, Kingston-Smith, Kim, Allison, Wilkinson, Hegarty, Theodorou, Newbold and Huws. This is an open-access article distributed under the terms of the Creative Commons Attribution License (CC BY). The use, distribution or reproduction in other forums is permitted, provided the original author(s) or licensor are credited and that the original publication in this journal is cited, in accordance with accepted academic practice. No use, distribution or reproduction is permitted which does not comply with these terms.
*Correspondence: Sharon A. Huws, hnh@aber.ac.uk
†Present Address: Olga L. Mayorga, Centro de Investigación Tibaitatá, CORPOICA, Colombia, Sudamérica