 C. Ryan Penton1,2*
 Caiyun Yang3,4
 Liyou Wu3
 Qiong Wang5
 Jin Zhang3Feifei Liu3Yujia Qin3
 Ye Deng3
 Christopher L. Hemme3
 Tianling Zheng4Edward A. G. Schuur6
 James Tiedje5
 Jizhong Zhou3,7,8
- 1College of Integrative Sciences and Arts, Arizona State University, Mesa, AZ, USA
- 2Arizona State University, Center for Fundamental and Applied Microbiomics, Biodesign Institute, Tempe, AZ, USA
- 3Department of Microbiology and Plant Biology, Institute for Environmental Genomics, University of Oklahoma, Norman, OK, USA
- 4Key Lab of the Ministry of Education for Coastal and Wetland Ecosystems, School of Environmental Sciences, Xiamen University, Xiamen, China
- 5Center for Microbial Ecology, Michigan State University, East Lansing, MI, USA
- 6Department of Biological Sciences, Northern Arizona University, Flagstaff, AZ, USA
- 7Earth Sciences Division, Lawrence Berkeley National Laboratory, Berkeley, CA, USA
- 8State Key Joint Laboratory of Environment Simulation and Pollution Control, School of Environment, Tsinghua University, Beijing, China
Since nitrogen (N) is often limiting in permafrost soils, we investigated the N2-fixing genetic potential and the inferred taxa harboring those genes by sequencing nifH gene fragments in samples taken along a permafrost thaw gradient in an Alaskan boreal soil. Samples from minimally, moderately and extensively thawed sites were taken to a depth of 79 cm to encompass zones above and below the depth of the water table. NifH reads were translated with frameshift correction and 112,476 sequences were clustered at 5% amino acid dissimilarity resulting in 1,631 OTUs. Sample depth in relation to water table depth was correlated to differences in the NifH sequence classes with those most closely related to group I nifH-harboring Alpha- and Beta-Proteobacteria in higher abundance above water table depth while those related to group III nifH-harboring Delta Proteobacteria more abundant below. The most dominant below water table depth NifH sequences, comprising 1/3 of the total, were distantly related to Verrucomicrobia-Opitutaceae. Overall, these results suggest that permafrost thaw alters the class-level composition of N2-fixing communities in the thawed soil layers and that this distinction corresponds to the depth of the water table. These nifH data were also compared to nifH sequences obtained from a study at an Alaskan taiga site, and to those of other geographically distant, non-permafrost sites. The two Alaska sites were differentiated largely by changes in relative abundances of the same OTUs, whereas the non-Alaska sites were differentiated by the lack of many Alaskan OTUs, and the presence of unique halophilic, sulfate- and iron-reducing taxa in the Alaska sites.
Introduction
Permafrost underlies 24% of the northern hemisphere land surface and contains approximately 1672 Pg C (Schuur et al., 2008; Tarnocai et al., 2009). Thawing of permafrost from increasing temperatures results in more carbon becoming available to microbial decomposition and hence elevates ecosystem respiration of CO2 (Hobbie et al., 2000; Mack et al., 2004; Dutta et al., 2006). Nitrogen is a common limiting nutrient such that N-availability may play an important role in regulating plant productivity as well as microbial decomposition and hence the release of greenhouse gasses CO2 and N2O. In permafrost, the assimilation of organic N by boreal and Arctic plant species indicates the overall scarcity of inorganic N (Kielland, 1994; Persson et al., 2003). In Alaskan permafrost, long-term N-addition has also been shown to increase decomposition rates, thereby reducing ecosystem C storage (Keller et al., 2010).
The majority of microbial metabolic activity in permafrost is relegated to the active layer that thaws seasonally. Extended thawing periods result in an increase in the depth of this layer, with water flowing through the deeper soil (Keller et al., 2010) which may introduce N from the mineral soils into the upper thawed soil layers (Keuper et al., 2012). Experimental warming of boreal (taiga) and tundra soils supports this, with an observed increased soil inorganic N (Schimel et al., 2004; Natali et al., 2011). Deeper thawing below the rooting zone contributes to the export of inorganic N from the soil to groundwater and/or surface water, especially in discontinuous permafrost zones (Harms and Jones, 2012), thereby bypassing the shallow organic soil where N removal through denitrification and N-retention by assimilation occurs.
Biological N-fixation is an important source of N to Arctic terrestrial systems (Barsdate and Alexander, 1975; Chapin and Bledsoe, 1992; Hobara et al., 2006) since atmospheric deposition of N alone cannot account for excess net organic N uptake rates (Harms and Jones, 2012). Among the soil properties, moisture plays a large role in the variation of N-fixation among Arctic vegetative communities (Chapin, 1996; Stewart et al., 2011) with higher rates occurring under elevated temperatures and moisture (Liengen and Olsen, 1997; Zielke et al., 2005; Stewart et al., 2012). Higher N-availability from enhanced N-fixation in Arctic ecosystems may further increase N-mineralization rates (Giblin et al., 1991; Chu and Grogan, 2010) and hence nitrification rates (Robertson and Vitousek, 1981; Norton and Stark, 2011), resulting in additional NO3- available for denitrification and thus the potential for increased N2O emissions (Chapin, 1996; Kool et al., 2011). However, net ecosystem gain of N may be reduced as a result of the balance between N-fixation and denitrification (Chapin, 1996; Sorensen et al., 2006), the later being favored by the wet soils, although low denitrification rates have been observed in some Arctic environments (Buckeridge et al., 2009). Ultimately, increased N-availability may also inhibit N-fixation through negative feedback once N-availability surpasses a threshold concentration. Overall, the relationship of N-fixation to soil respiration is unclear as correlations between N-fixation and CO2 production vary across ecosystem types (Stewart et al., 2012).
The diversity of the N-fixing genes and their host microbial populations can be assessed by sequencing of the nifH gene, which encodes a subunit of the nitrogenase complex whose diversity (Hsu and Buckley, 2009) and abundances (Reed et al., 2010) have been associated with N-fixation rates. Five primary groups of genes homologous to nifH have been identified (Young, 1992, 2005; Raymond et al., 2004). Group I consists of aerobic N2-fixing bacteria composed of a mix of Alpha-, Beta-, and Gamma-Proteobacteria, among others. Group II are very similar in function and structure to group I and contain mostly obligate anaerobes such as methanogens, sulfate-reducers and clostridia. Group III consists of anaerobic N2-fixers from Bacteria and Archaea and contains primarily Delta Proteobacteria while groups IV and V contain nifH paralogs that do not fix nitrogen (Raymond et al., 2004). Conceptually, changes in microbial N-fixation rates can reflect: (i) an alteration in cell-specific activities that may reflect the environment, (ii) changes in abundance of N-fixing organisms, or (iii) a shift in the community composition of N fixers. The aim of this study was to assess differences in the composition of the N2-fixing genes and the inferred microbes harboring those genes along a long-term permafrost thaw gradient and in soil above and below the water table In addition, we compared the composition of the nifH-harboring bacterial community between two Alaska sites to other sites from diverse ecosystems to determine the shared and habitat unique OTUs.
Materials and Methods
Site Description
Soils cores were collected from three sites representing a thaw gradient of minimally, moderately and extensively thawed conditions within the discontinuous permafrost zone from the Eight Mile Lake (EML) watershed, west of Healy, Alaska, USA (63°52′42.1′′N, 149°15′12′′W, 700 m.a.s.l) (Schuur et al., 2007, 2009; Vogel et al., 2009; Lee et al., 2010; Trucco et al., 2012). Permafrost degradation has been ongoing at this region over the past 50 years as a result of regional climate change in Alaska (Schuur et al., 2009; Osterkamp et al., 2009). Spatially random processes that occur at a local level as a series of positive feedbacks between temperature change, ground subsidence, hydrologic redistribution, and further thawing from thermal erosion due to moving water have created the observed gradient from minimal to extensive permafrost thaw at the plot level where samples are collected.
Six cores were taken from each site to a maximum depth of 116 cm and sliced in five to eight sections, depending on the depth of the organic and mineral layers. The minimally thawed site is characterized by the least permafrost degradation and has moist acidic tundra vegetation comprised of graminoid sedges, dwarf evergreen and deciduous shrubs, and forbs with an understory of non-vascular mosses and lichens (Schuur et al., 2007). The moderately thawed site exhibits some subsidence and a deeper active (seasonally thawed) layer, with the initiation of thawing observed in 1990. Plant community composition remained similar to the minimal thaw site, but overall the plants were more productive (Schuur et al., 2007). The extensively thawed site has the deepest active layer with thaw initiation thought to have occurred several decades prior to that at the moderately thawed site (Lee et al., 2010). Vegetation at the extensive site had shifted away from graminoids toward a dominance by shrubs and forbs. In addition, hydrophilic moss species were more prevalent where the water table was at the soil surface as a result of ground subsidence. Re-distribution of surface water caused by this subsidence was observed at the moderately thawed site and was widespread at the extensively thawed site. Volumetric water content at 10 cm ranged from 0.1 to 0.3 ml cm-3 while at 30 cm it was near 1.0 ml cm-3 at all sites. Depth of the thawed layer at the time of sampling in May was 15.6 ± 0.4 cm, 16.6 ± 0.25 cm, and 26.0 ± 2.3 cm for the minimally, moderately and extensively thawed sites, respectively (Lee et al., 2010). Depth to the water table from six adjacent sites from June to September ranged from 9.9 to 28.9 cm below the soil surface, averaging -17.4 ± 4.1 cm. (Supplementary Figure S1). Soils from below the water table were characterized by redox mottling, though this was not directly quantified. A total of 25 samples composed of ∼10 cm core slices were denoted as above water table (AWT) depth with a maximum penetration of -22 cm into the soil (average -15.4 ± 5.7 cm) while a total of 53 samples comprised the below water table (BWT) samples and averaged -45.4 ± 14.0 cm in depth (Supplementary Figure S1). Organic C pools to 1 m depth averaged 59.8 ± 2.8 kg C m-2 at all sites (Schuur et al., 2009). Total aboveground plant biomass has been reported to be 361, 488, and 486 g m-2 with mean summer soil temperatures at 10 cm at 8.7, 10.2, and 11.3°C in the minimally, moderately and extensively thawed sites, respectively (Schuur et al., 2007). Soil pH values from sites located ∼2 km from this study site are approximately 4.7, 4.8, and 5.1 for the 0–15 cm, 15–25 cm, and 45–55 cm depths. Total soil C and N reported in this study were measured on core subsamples using a Costech ECS 4010 Elemental Analyzer (Valencia, CA, USA).
Amplification and Sequence Processing
Primers PolF/PolR tagged with multiplex identifier (MID) sequences were used for the amplification of nifH sequences (Poly et al., 2001b) with the Roche Titanium adapter A on PolF and adapter B on PolR. Triplicate 20 μl PCR reactions and a control were performed and reactions purified using the protocol described by Wang et al. (2013). Sequencing was performed using the Roche 454 (GS-FLX Titanium) platform by Macrogen (Geumcheon-gu, Korea).
Nucleotide sequences were processed through the Ribosomal Database Project (RDP) pyrosequencing pipeline1. Chimeric sequences were identified and removed using UCHIME6.0 running in de novo mode. Sequences were translated to protein and frameshift-corrected using the RDP’s protein-coding gene tool (FrameBot; Wang et al., 2013) and nifH database. Protein reads were re-sampled to 1,000 sequences per sample using R (R Core Team, 2013) followed by alignment and complete linkage clustering at 5% amino acid dissimilarity. Sequences pertaining to representative sequences as the minimum sum of the square of the distances within each cluster were generated. A hand-curated nifH database (augmented Zehr-set; Wang et al., 2013) with the extracted protein region corresponding to that amplified by the primers was used as the reference set for BLASTp analyses. Sequences were deposited in the European Nucleotide Archive under study accession PRJEB7072, secondary accession ERP006756, and sample accessions ERS533154–ERS533209.
Raw reads were Hellinger-transformed (square root of relative abundance) and Bray–Curtis (+1) dissimilarity matrices constructed for community statistical analyses using the PRIMER-6 software package (Clarke and Warwick, 2001). Treatment differences were tested by analysis of similarity (ANOSIM) (Clarke, 1993), permutational analysis of variance (PERMANOVA) (Anderson, 2001), Non-metric dimensional scaling (NMDS) and similarity percentages (SIMPER) (Warwick et al., 1990), and permutational dispersion (PERMDISP) (Anderson et al., 2006). The Chao estimate of community richness was used for nifH diversity estimates. Aligned amino acid sequences were trimmed and neighbor joining trees were constructed using MEGA6 (Tamura et al., 2013) and visualized in iTOL (Letunic and Bork, 2011). Samples were grouped according to site (minimally–moderately–maximally thawed), depth below surface and depth relative to the water table depth. Amino acid sequences were obtained from Wang et al. (2013) for comparison of the nifH-harboring microbial communities among sites. ANOVA statistics were carried out using Minitab®16. Samples within 5-cm below the average annual water table depth were included, since some 10-cm core slices included up to 5-cm below this value but were also within the range of water table variation (Supplementary Figure S1).
Results
NifH Diversity Analyses
A total of 124,703 raw sequences were recovered from 78 samples, from which 112,476 sequences remained with an average length of 344 bases after quality filtering and removal of 29 samples that contained less than 1,000 reads. After removal of chimeric sequences, all remaining samples were randomly re-sampled to 1,000 sequences for further analyses. A total of 1,631 OTUs (549 singletons) were generated after clustering at 5% amino acid identity.
Average protein-protein identity to the curated database was 89.4 ± 4.8% at an average alignment length of 106 amino acids. Percent identity to the reference database was highest for the Alpha- and Beta-Proteobacteria (Figure 1). Protein sequences corresponded to those of 123 unique closest match species/strains comprising 79 genera and 11 phyla in the reference database. The top 15 closest match genera accounted for 86.0% of all sequences and 73.1% of all OTUs.
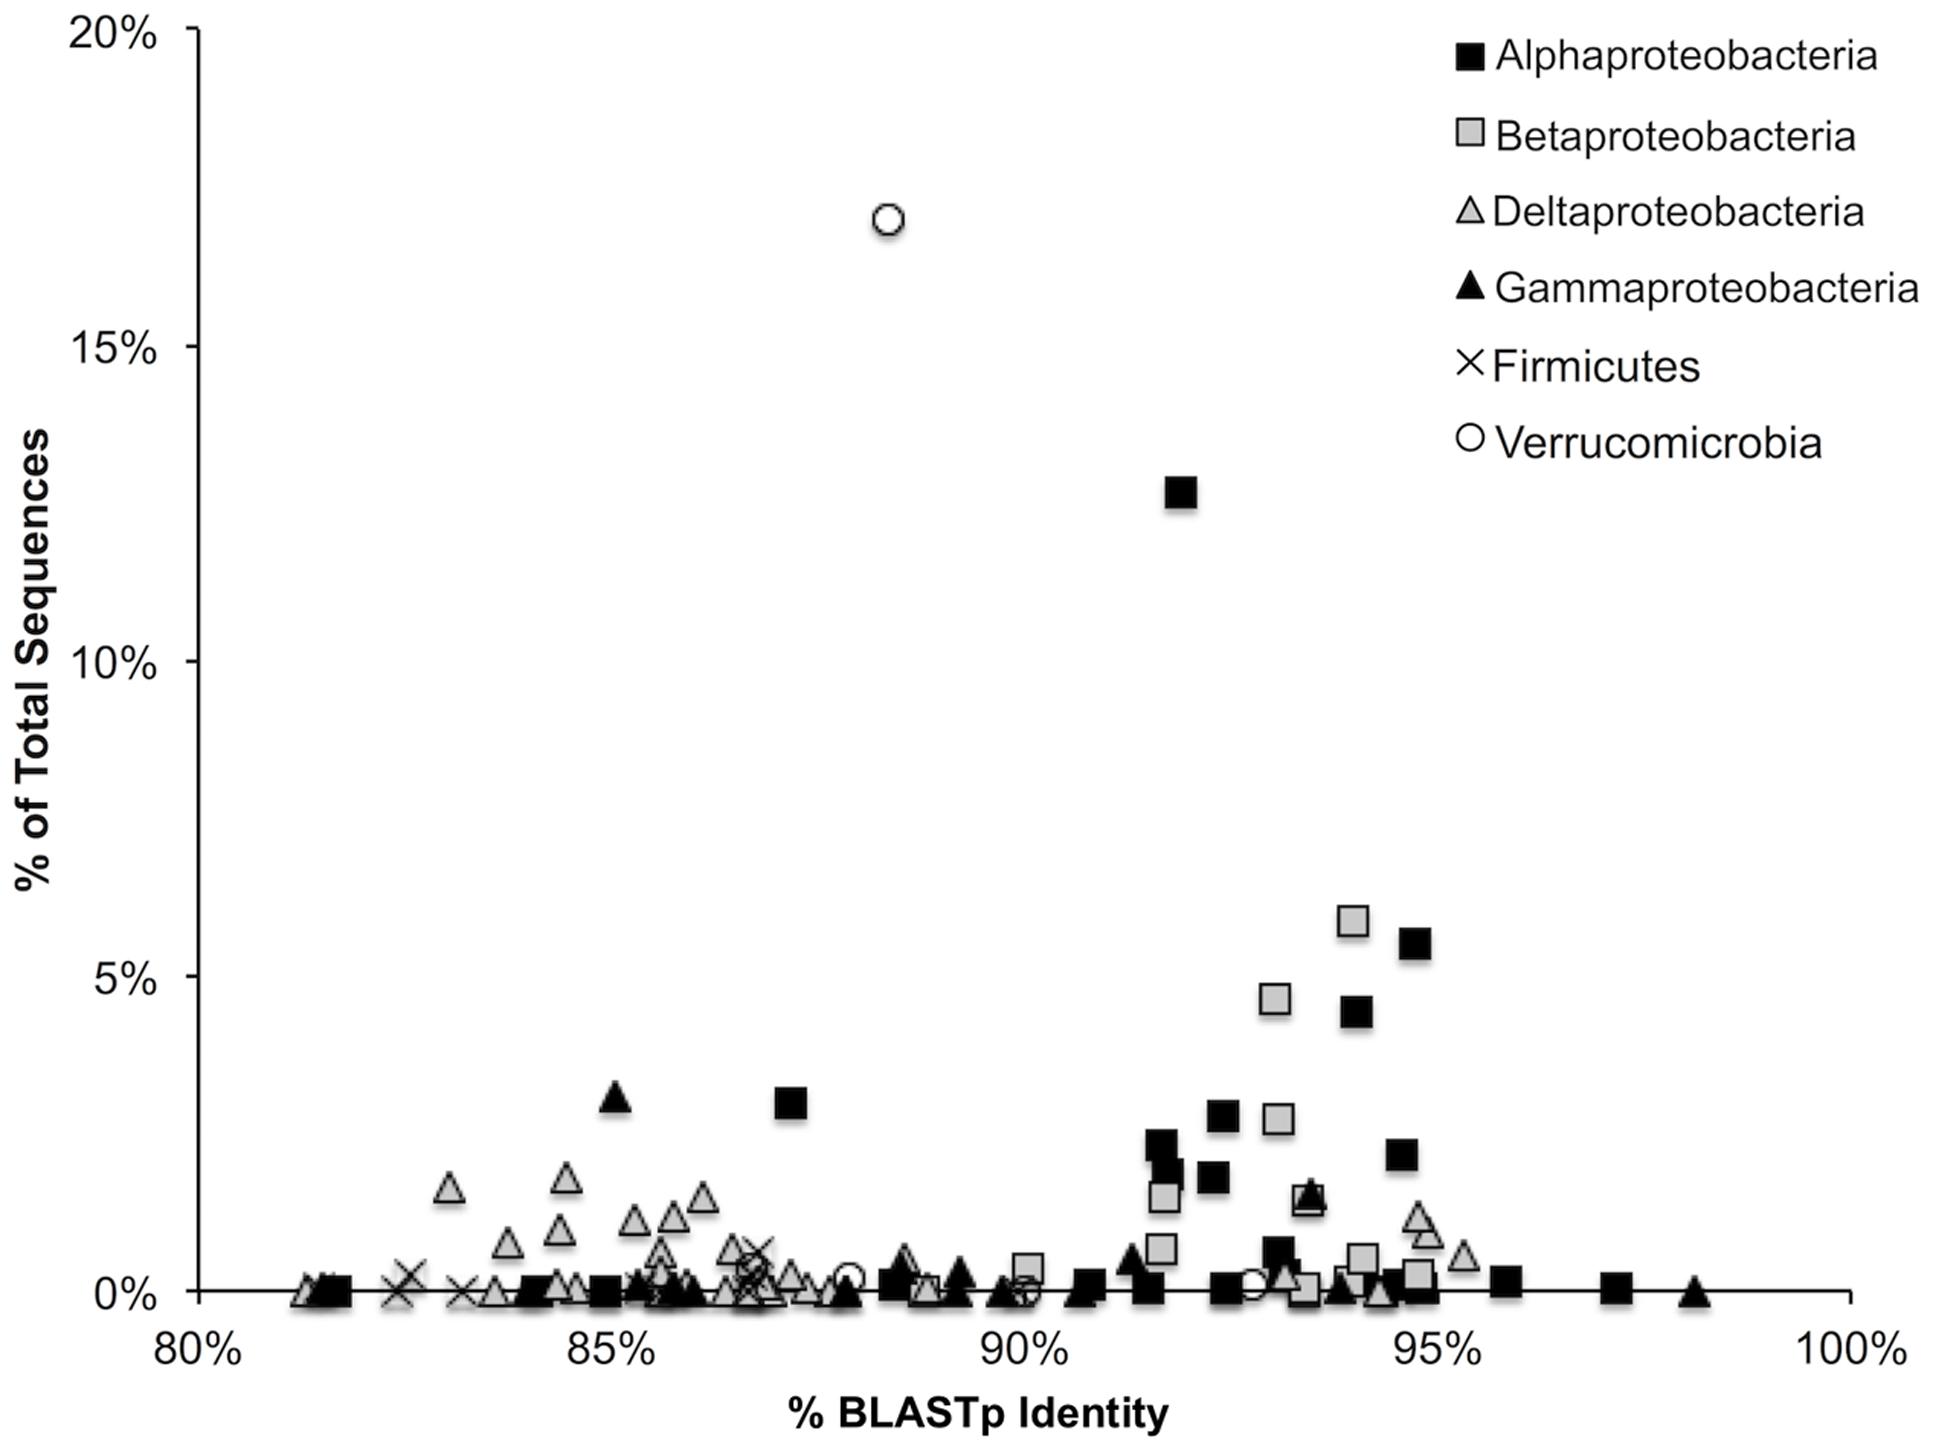
FIGURE 1. Percent BLASTp identity of representative sequences within each of the represented bacterial groups against a hand-curated nifH database. A total of 95.7% of all sequences are represented.
A total of 74.1% of sequences were most closely matched to the Proteobacteria and the majority of high abundance OTUs were closest to the order Rhizobiales such as Methylobacterium nodulans (12.7% of all sequences), Rhizobium sp. (6.7%), M. silvestris (5.5%), and Bradyrhizobium sp. (7.9%). Outside of the Proteobacteria, closest matches were to the Verrucomicrobia, specifically hits to Opitutaceae sp. TAV2 (16.4%) were the most abundant. Desulfovibrio-related sequences were the most diverse, with 5.2% of all sequences in 8.9% of all OTUs. In contrast, Methylobacterium-related sequences were the least diverse, with 12.7% of all sequences in 2.7% of all OTUs. Percent nitrogen and carbon were obtained for a portion of the BWT samples only and were not found to be significantly different along the thaw gradient (ANOVA) (Supplementary Table S1).
Changes in Diazotrophic Communities with Depth
Significant changes in the composition of the diazotroph community were found based on position above (AWT) and below (BWT) the water table (PERMANOVA; F = 2.19 P < 0.001, ANOSIM; P < 0.001), roughly corresponding to the thaw depth at time of sampling. Chao richness estimators were significantly higher in the BWT samples versus AWT (ANOVA; F = 4.78, P = 0.03) (Supplementary Figure S2). A neighbor-joining tree was constructed to visualize the differences in relative abundances between the AWT and BWT layers (Figure 2). Two distinct clades of the group III and one clade of group 1A nifH-harboring taxa consisting of Delta Proteobacteria were most associated with the deeper layers while group I (especially 1 K) containing Alpha Proteobacteria were higher in abundance in the samples above the water table. NifH sequences associated with the Delta Proteobacteria were clearly separated from the other groups. Tree branch length differences were smaller between the Alpha-, Beta-, and Gamma-Proteobacteria that may affect the confidence in assigning finer taxonomic resolution.
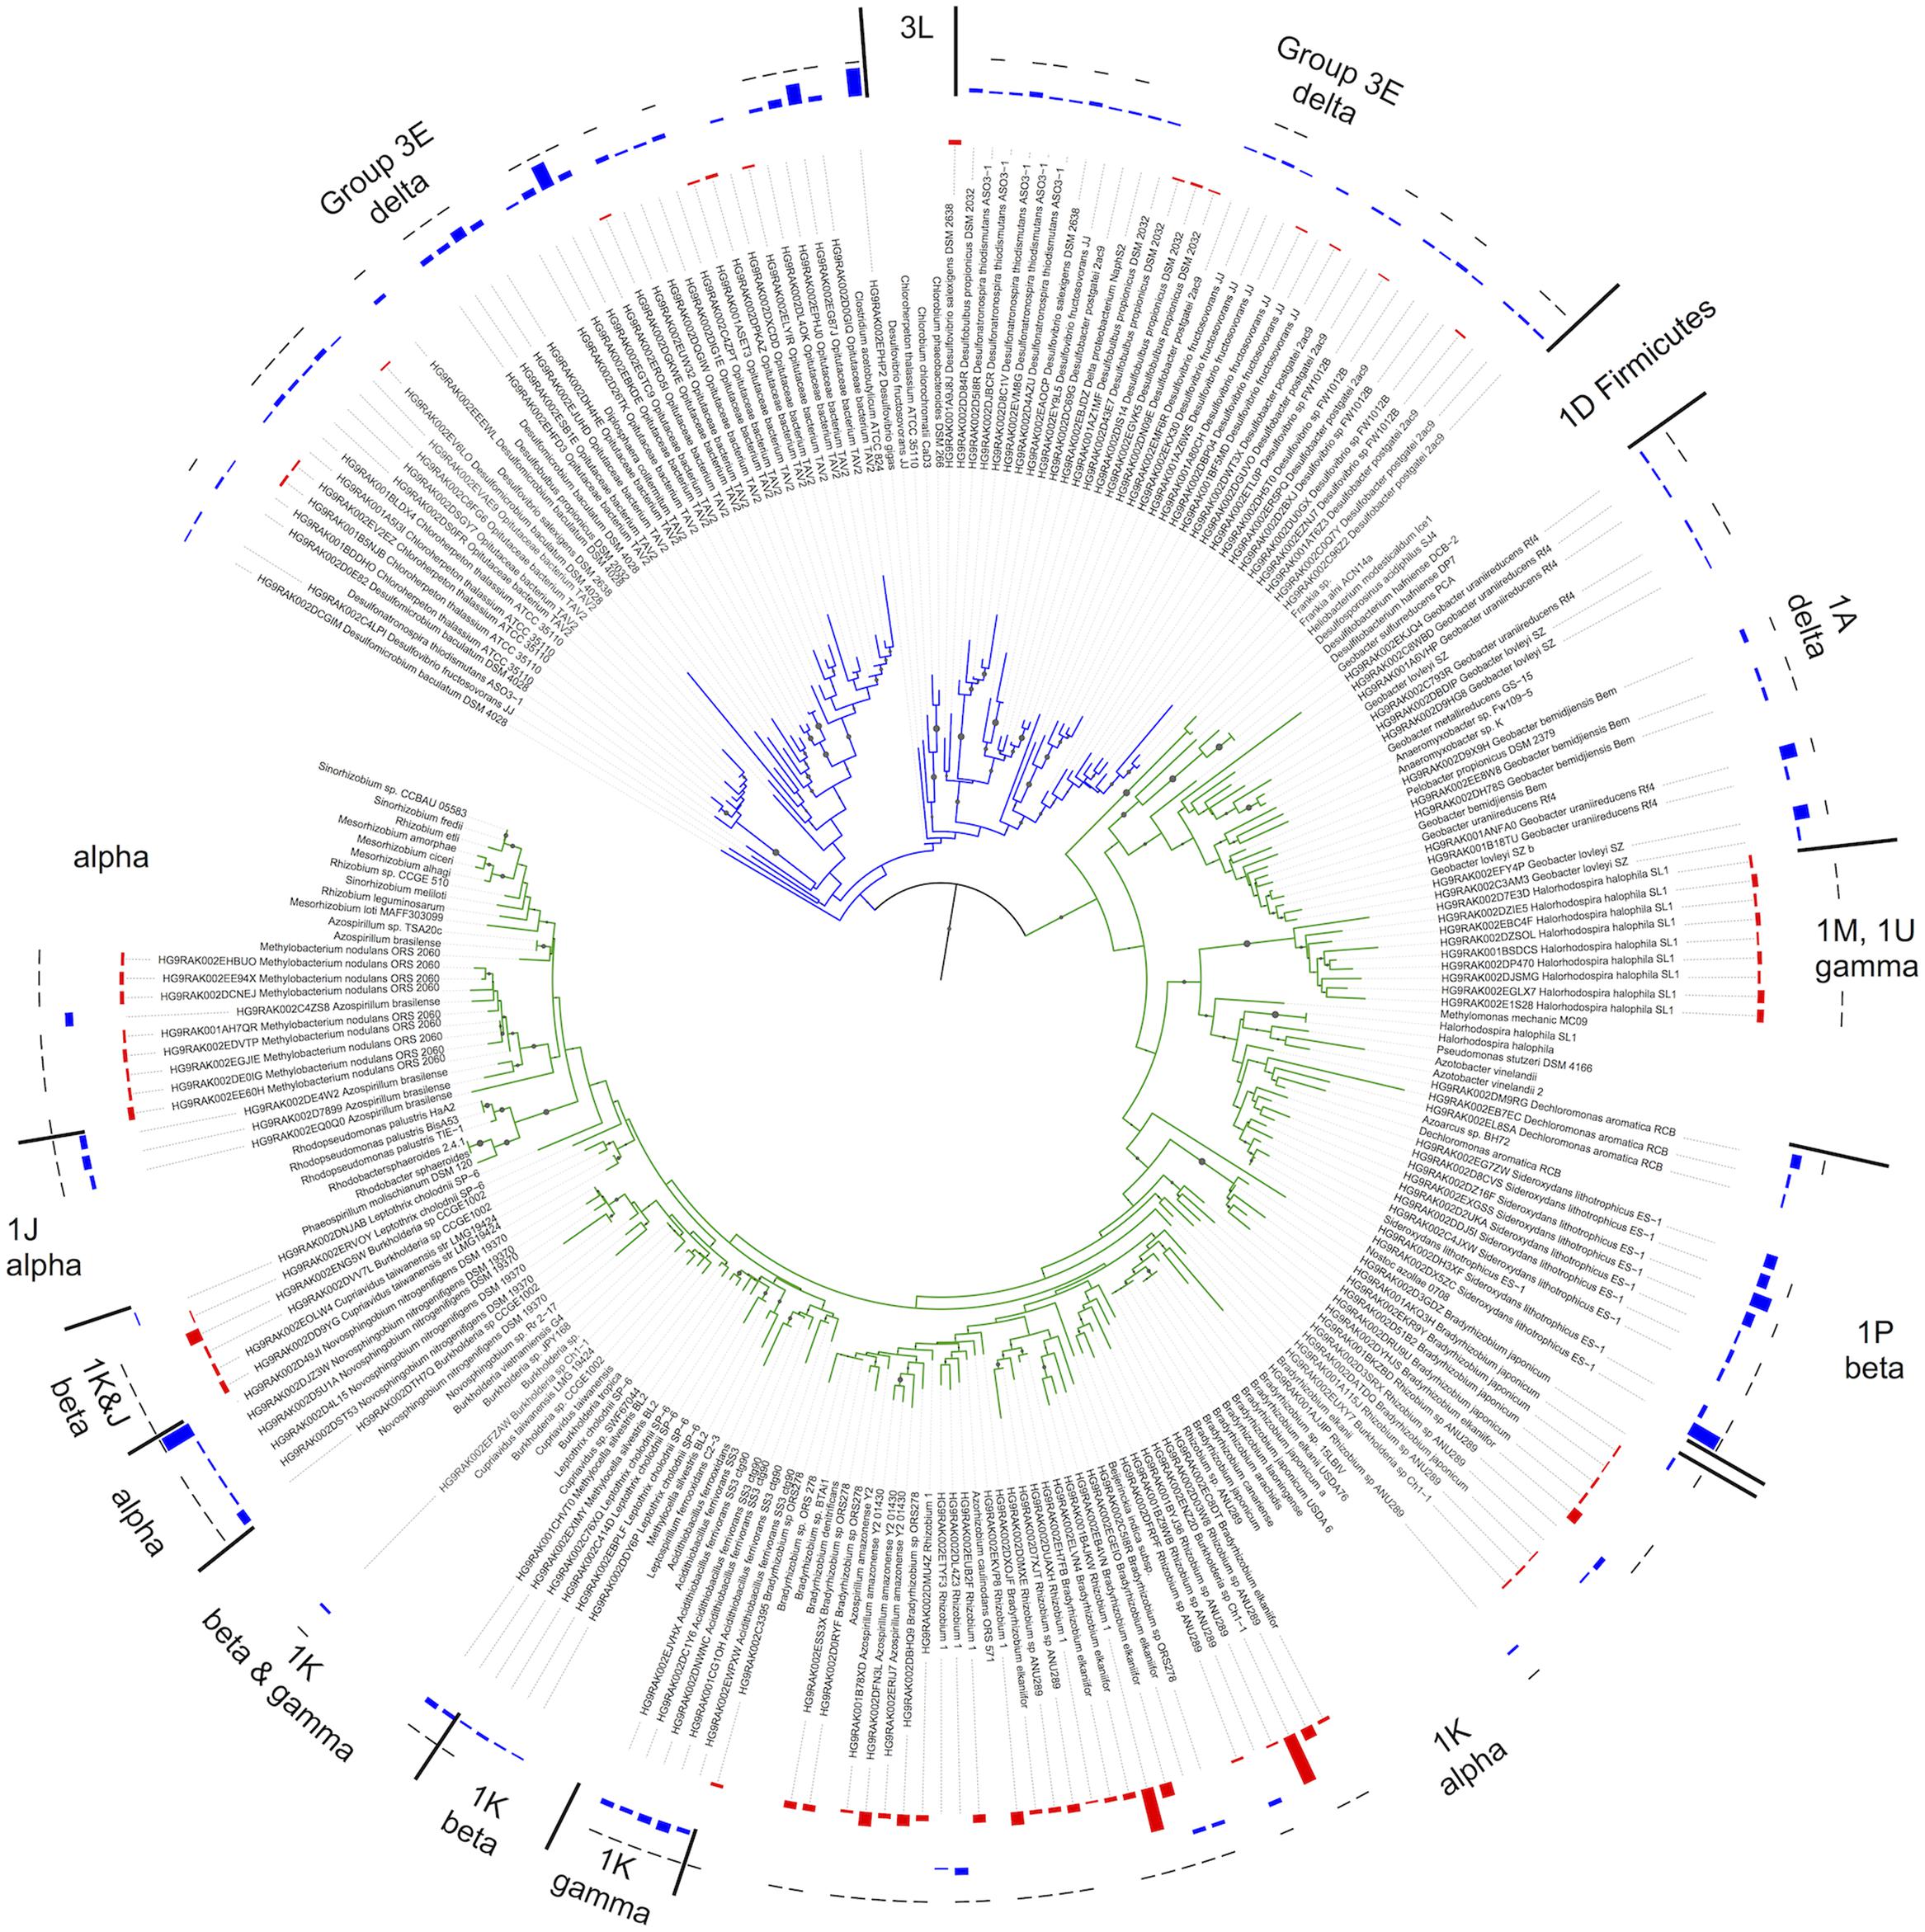
FIGURE 2. Neighbor joining tree based on 116 comparable NifH amino acid positions using reference sequences obtained from the hand-curated NifH database used for BLASTp assignment. Cluster representative sequences representing those clusters that constituted the SIMPER results were chosen. Bootstrap values >50% are indicated by branch symbols. Group names (e.g., 3E) indicated are based upon the ARB database. The innermost two data fields indicate the relative abundances for each OTU in the above water table (AWT-red) and below water table (BWT-blue). The outermost field indicates significant differences (t-test, p < 0.05) between the BWT and AWT relative abundances (black bar = significant, no bar = not significant).
The contribution of individual closest-match genera to the overall Bray–Curtis distances (SIMPER analysis) showed that differences in the abundances of 32 OTUs accounted for 79.1% of the discrimination between the AWT and BWT soil layers (Figure 3). These 32 OTUs are derived from a subset of those OTUs shown in Figure 2. The sequences most related to Alpha Proteobacteria (within group I) were more associated with the AWT layers with those most closely matching Delta Proteobacteria (group III) having larger populations in the BWT layers. This is most pronounced with the abundance of sequences in BWT most closely related to the Verrucomicrobia Opitutaceae sp. TAV2 (Diplosphaera colitermitum TAV2). Delta Proteobacterial sequences from the BWT layer had lower BLASTp percent identities than the majority of sequences associated with the AWT layer. The BWT layer contained 19 OTUs unique to that layer (15.4% of all OTUs, 0.04% of all sequences) while the AWT layer only contained four unique OTUs containing <0.01% of all sequences. The overall diazotrophic community structure was largely shaped by position above or below the average water table, with higher variation between samples observed in the deeper soil samples (Figure 4).
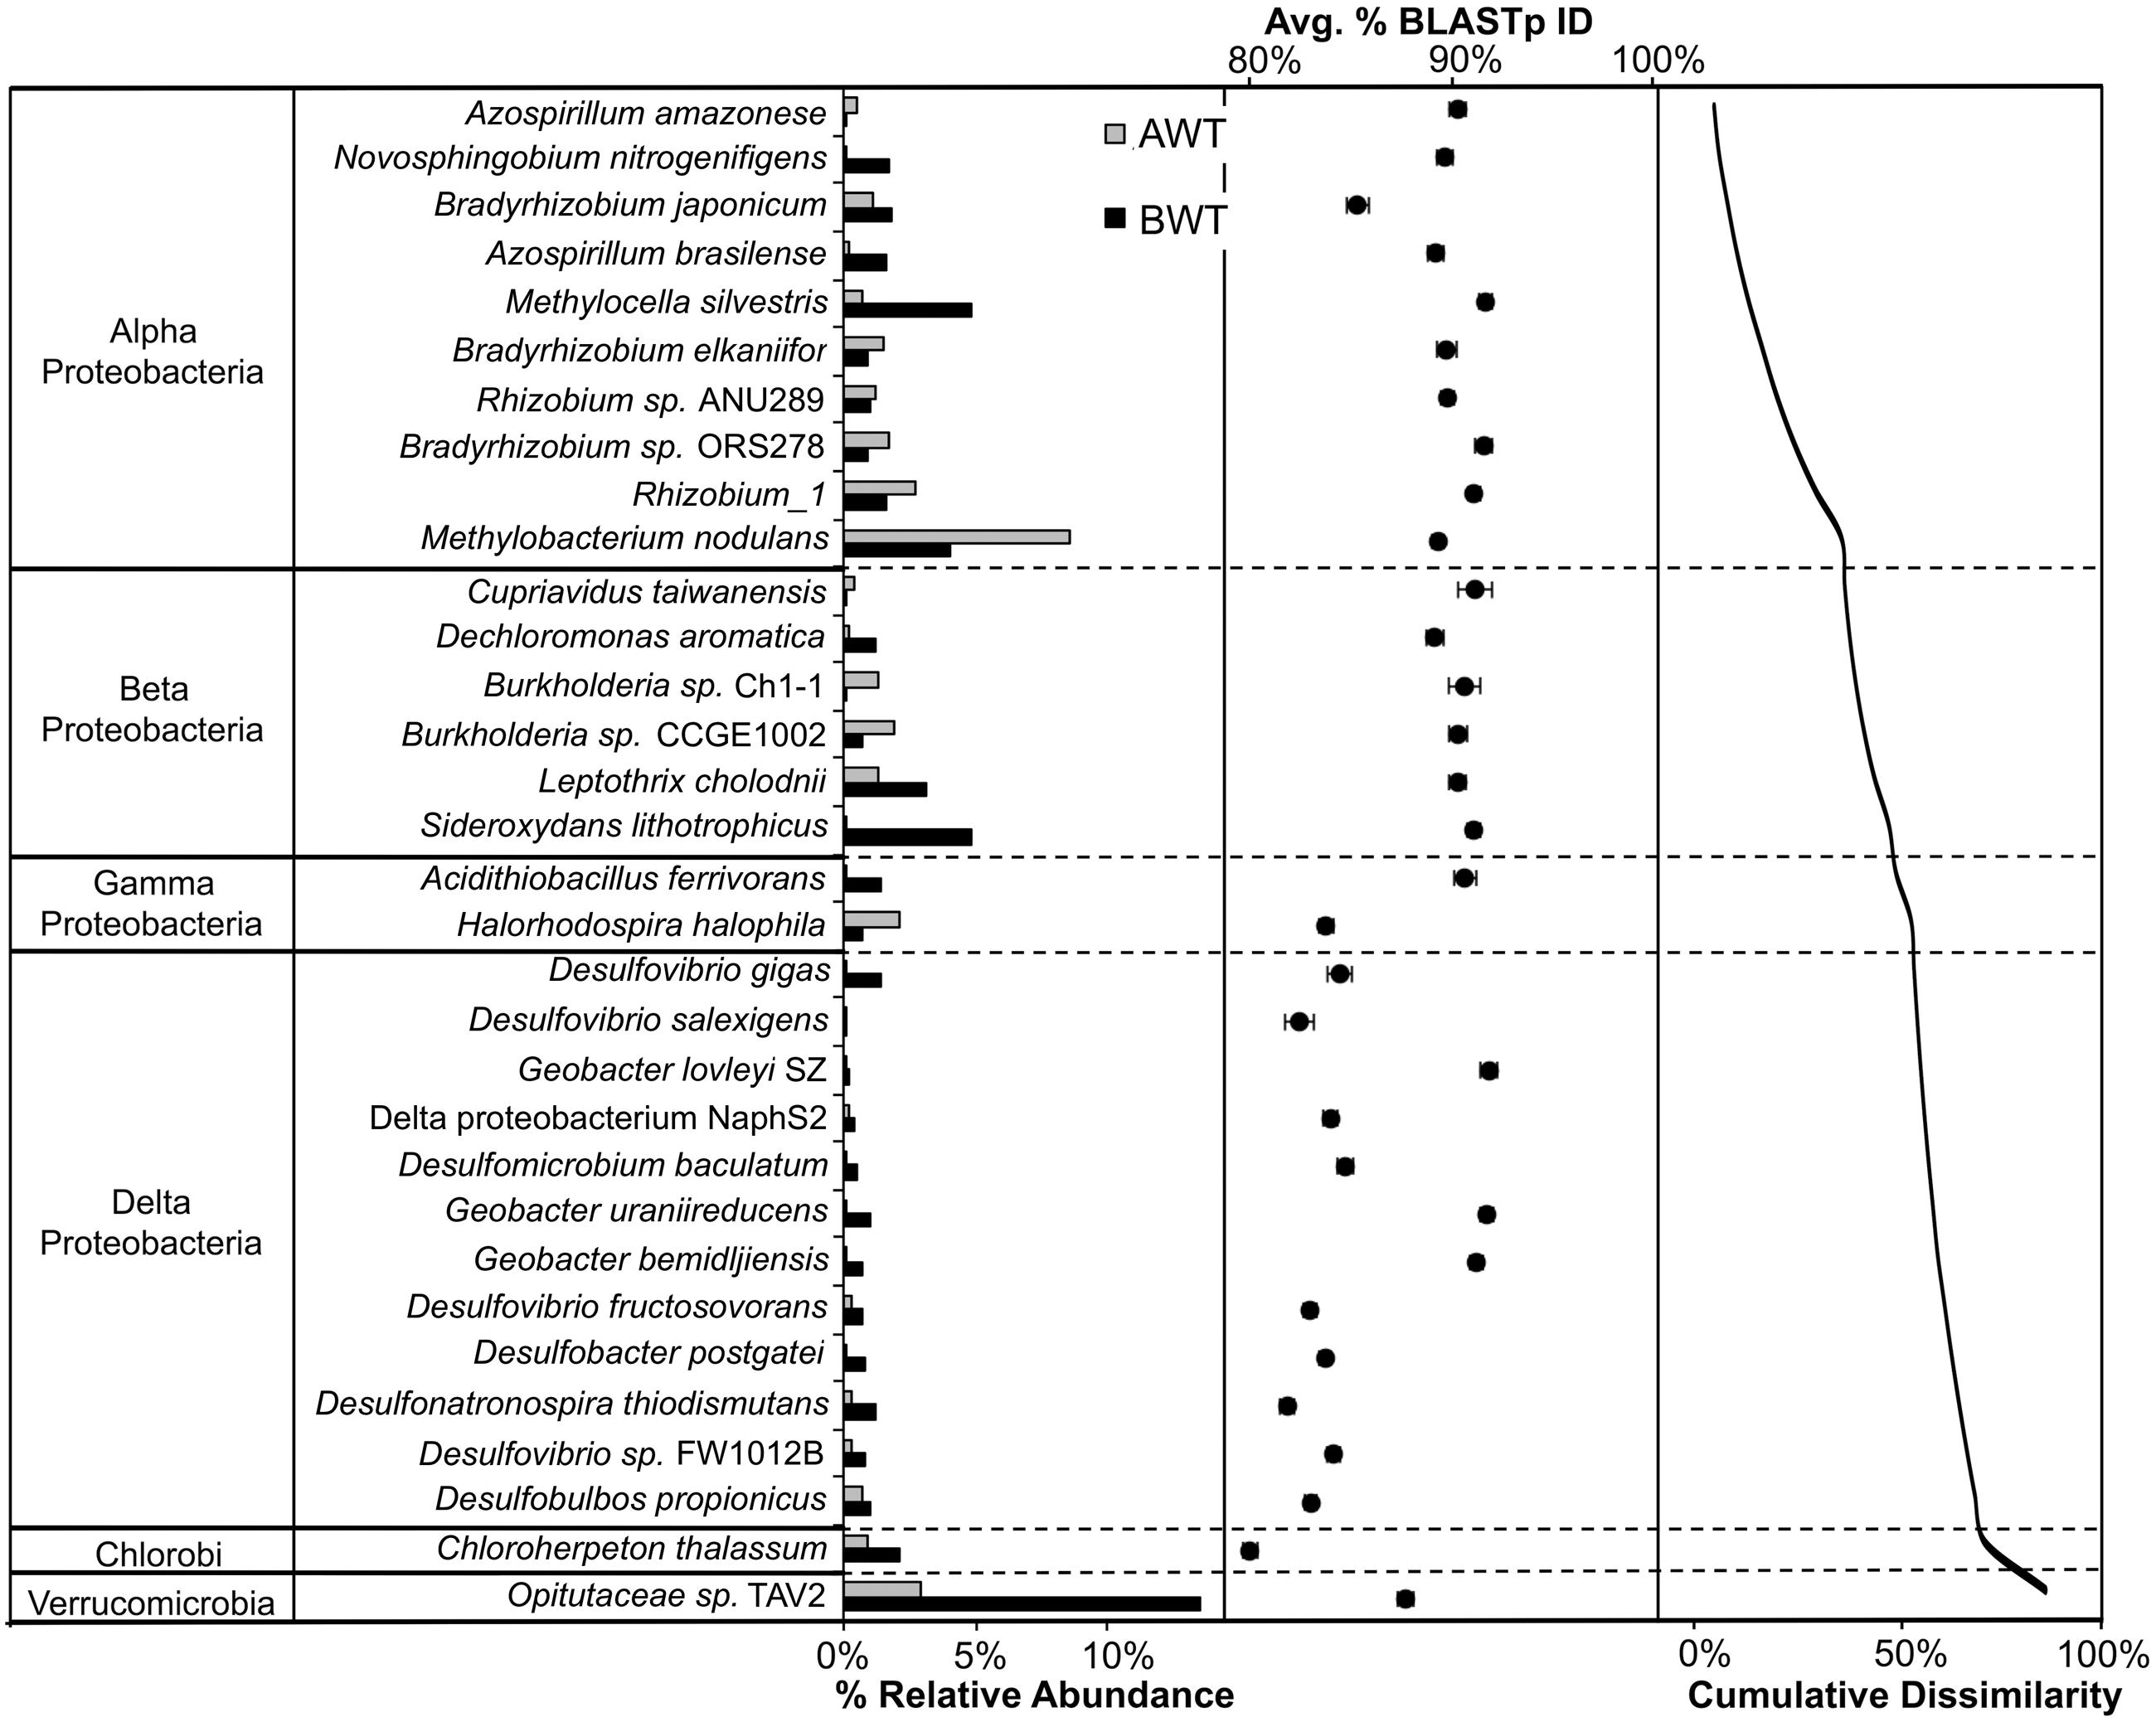
FIGURE 3. Similarity Percentage (SIMPER) analysis showing the representative sequence BLASTp closest match identity of the OTUs that contribute significantly to the discrimination between above water table (AWT) and BWT nifH-harboring bacterial communities. The OTUs shown contribute 79.1% of the cumulative dissimilarity, shown in the second pane. Average percent BLASTp identity with standard errors are shown in the third pane. These taxa account for 25.8% of all closest match reference taxa.
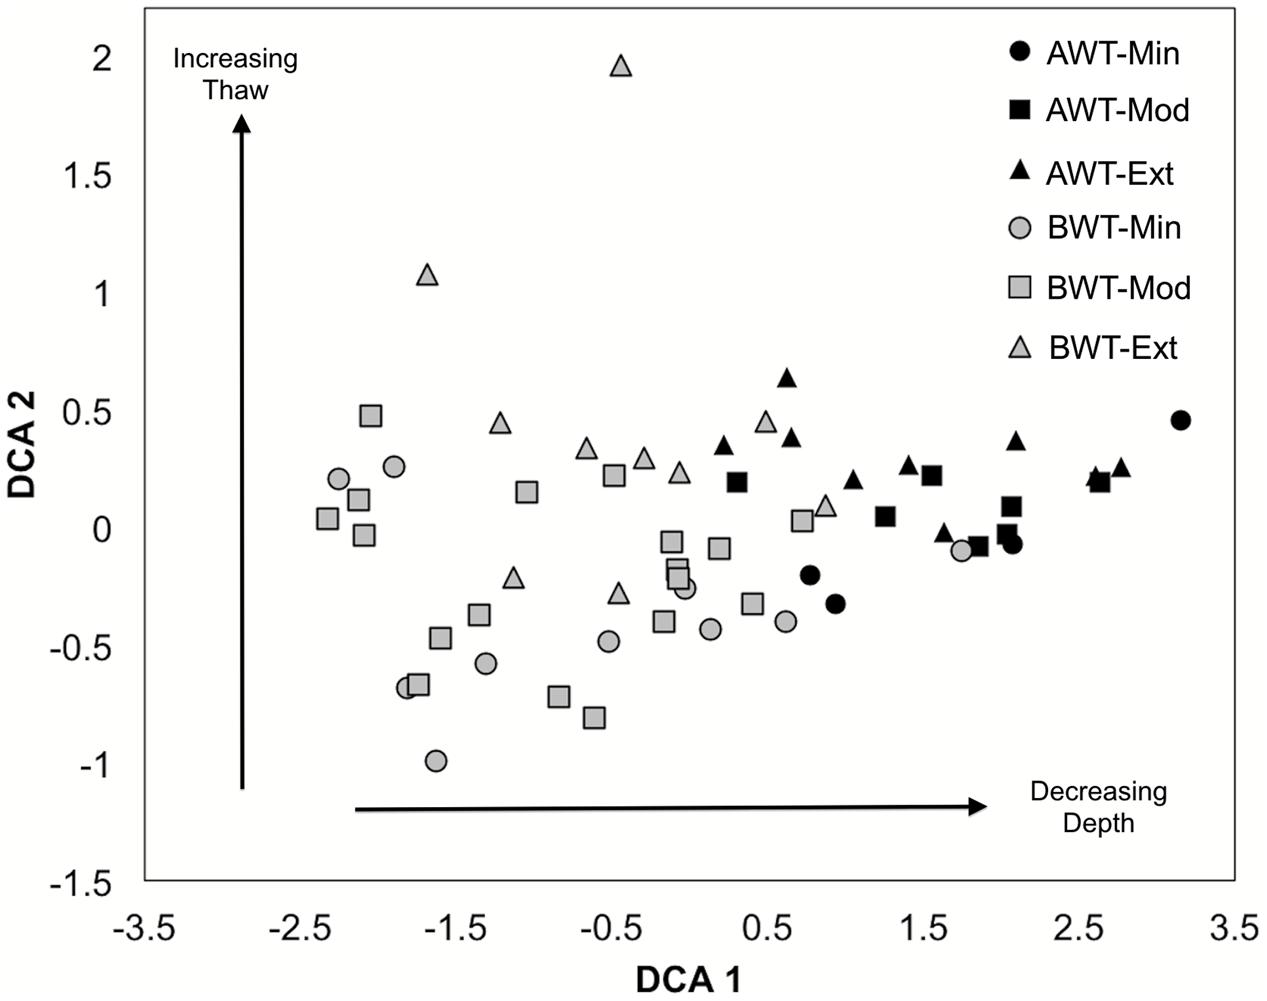
FIGURE 4. De-trended correspondence analysis ordination of nifH-harboring bacterial communities in all cores related to thaw depth. AWT = above water table, BWT = below water table, Min = minimally thawed site, Mod = moderately thawed site, Ext = extensively thawed site. Arrows indicate trends with depth (AWT versus BWT: PERMANOVA, F = 2.19 P < 0.001) and with increasing/decreasing thaw status (Min, Mod, Ext: PERMANOVA, F = 0.89 P = 0.53). Differences between minimal versus extensively thawed sites were the most highly contrasted (PERMANOVA pairwise comparison, P = 0.06). Multivariate dispersion indices (MVDISP) were 0.88 for BWT and 1.44 for AWT and tested with permutational dispersion (PERMDISP; F = 10.40 P < 0.01).
Changes in nifH Communities Along the Thaw Gradient
Overall there was no significant change in nifH-harboring bacterial community structure with thaw extent (PERMANOVA; F = 0.89 P = 0.53, ANOSIM; P = 0.12) according to the position of the soil core along the gradient (minimally–moderately–and extensively thawed sites). A total of five closest match taxa (3756 sequences) significantly (t-test, p < 0.05) changed between the minimally and extensively thawed sites when all depths were considered. These changes were the result of relative abundance increases in the extensively thawed site with closest BLASTp matches related to Desulfovibrio that increased 8-fold, Bradyrhizobium (2x), Methylocella (6x), Zymomonas (5x), and Desulfobulbos (4x). NifH derived Chao richness did not significantly change across the thaw gradient.
Comparison of Two Alaskan Sites
To investigate whether there is a “core” Alaskan nifH-harboring bacterial community, we combined our results with a study that used identical sequencing and processing methodologies with soils located in an Alaskan forested taiga (Wang et al., 2013), also above permafrost, located 1390 km from the thaw gradient, and three very different ecosystems. NMDS ordination (Figure 5) illustrates the significant (PERMANOVA, F = 36.24, p < 0.001; PERMDISP, p = 0.49) differences between all sites. The average PERMANOVA-derived similarities of replicates within the sites were similar (65.3 ± 1.8%) while the Alaska AWT samples were most similar to the BWT samples (54.3%) followed closely by the Alaskan taiga soils (51.9%), Hawaii (44.2%), Florida (41.9%), and Utah (41.5%). However, overall the taiga samples were more similar to the Hawaii, Florida, and Utah samples than to our AWT or BWT samples.
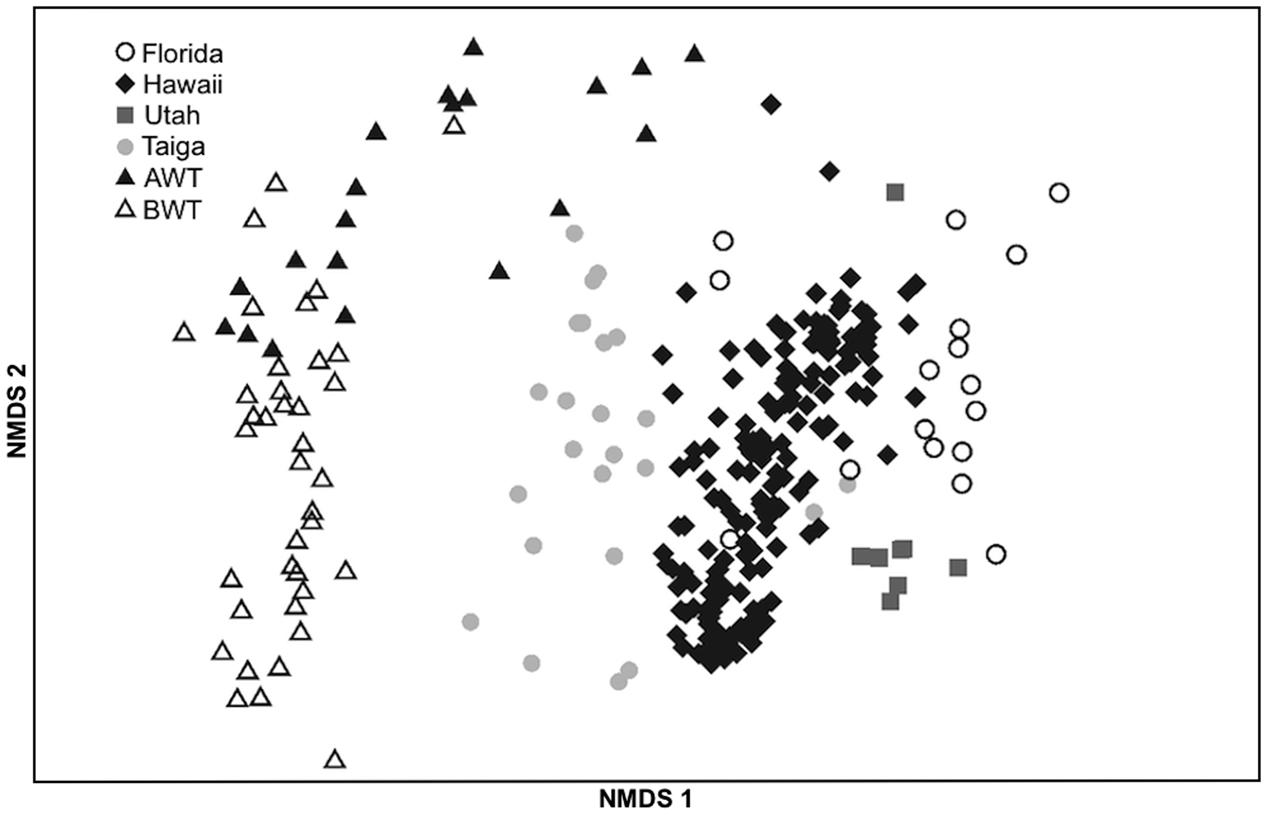
FIGURE 5. NMDS ordination of nifH harboring bacterial communities from this study (AWT = above water table, BWT = below water table) and those obtained from the NEON study (Wang et al., 2013) corresponding to samples taken in Florida, Hawaii, Utah and a Taiga forest. 2D stress = 0.12.
Since position above or below the average water table depth was shown to contribute largely to community differences, we then compared the AWT data to the AK taiga for further analyses. A total of 72 of 83 closest match taxa at >0.1% abundance were shared and relative abundances for OTUs present in both datasets were highly correlated (Spearman rank correlation, ρ = 0.995). Among these, the closest match M. nodulans ORS2060, a nodulating symbiont, was abundant at both sites (17.9%-AWT, 8.2%-forested taiga) as were those most similar to the genera Rhizobium (18.3% vs. 9.3%), Bradyrhizobium (5.6% vs. 13.0%), Halorhodospira (9.8% vs. 5.7%), and Leptothrix (2.9% vs. 3.9%) (Supplementary Figure S3). A total of 26 of the 83 taxa at >0.1% abundance significantly (t-test, p < 0.05) changed between AK sites. The more abundant significantly changing taxa included closest matches to Azospirillum (1.0%-AWT, 6.8%-taiga), Burkholderia (4.8% vs. 2.3%), Sideroxydans (0.1% vs. 5.2%), Rubrivax (3.0% vs. 0.1%), and Anaeromyxobacter (0.0% vs. 2.6%), among others.
Discussion
We examined nifH gene diversity along a natural thaw gradient and established that water table depth was a significant contributor to shaping the nifH-harboring bacterial community structure. The recovered alpha diversity was based on 1,631 OTUs from our 95% amino-acid dissimilarity clustering. However, due to inherent biases, directly comparing studies on nifH diversity as well as all other amplified functional genes can be problematic due to varying bioinformatic methods (Penton et al., 2013). These biases have been documented among the most widely adopted nifH primers (Gaby and Buckley, 2012), including PolF/PolR, used here, which preferentially target the Proteobacteria (Penton et al., 2013; Wang et al., 2013). Regardless, Mao et al. (2011) analyzed nifH diversity using 697 sequences per sample, also using PolF/PolR primers. They identified 229 OTUs at 90% amino acid dissimilarity in 21 samples, lower than our 1,631 OTUs from 60 samples at 95% dissimilarity. In another study, 31 of the 45 nifH–inferred cultivable genera that were shared among four sites in South and North America (Roesch et al., 2010) were identified in our samples. Our NifH richness estimates, which were error-corrected by FrameBot, indicate high nifH-harboring bacterial diversity in our samples. In comparison, Duc et al. (2009) estimated a species richness of 20 near a receding alpine glacier while others (Poly et al., 2001a; Rösch and Bothe, 2005; Deslippe and Egger, 2006) identified lower richness but with the more limited sampling due to use of cloning methodology.
A hand-curated reference protein database was utilized containing 675 NifH protein sequences in order to assign OTU representative sequences to a nearest match. These nearest-neighbor assignments are made without regard to the percent identity between the query and target sequence and without a specific cutoff threshold. A study utilizing nifH-harboring taxa that included 16S rRNA gene sequences determined that NifH amino acid distances varied widely within phylogenetic clusters; 41.7% among methanogens, 12.8% among Alpha, and 12.9% among Gamma Proteobacteria (Zehr et al., 2003). Other comparisons of nucleotide identities revealed that 80% of strains that shared 97% 16S rRNA identity had <95% nifH identity, 43% of those had less than 85% nifH nucleotide identity and a set of strains with 99% 16S rRNA gene identity corresponded to ∼77% nifH identity (Gaby and Buckley, 2012). Therefore the use of a universal identity cutoff threshold when assigning to a nearest neighbor is not directly supported. This also complicates the choice of an appropriate clustering dissimilarity value, as diversity will likely be over- or underestimated in some bacterial groups.
Horizontal gene transfer (HGT) must also be considered when assigning taxonomy to functional gene sequences. Recent transfer events have not been identified though there is evidence of ancient HGT between groups I and III (Gaby and Buckley, 2012). While based on a smaller subset of taxa, Zehr et al. (2003) also found a lack of evidence supporting recent HGT. Our analyses show that the group III sequences are more deeply diverging than group I, indicative of the lower group I substitution rates found by Gaby and Buckley (2012). As such, the differentiation of group I versus group III based on nifH sequences appears possible. In addition, taxonomic assignment of group III nifH-harboring taxa is supported due to higher sequence divergence. However, taxonomic differentiation of sequences within group I may be problematic due to the comparatively small divergences and incongruent phylogenetic relationships.
The majority of differences between the AK and Florida, Utah, and Hawaii sites were not due to changes in relative abundances, but rather to absence in the AK sites of specific OTUs (Figure 6). Taxa most associated with AK included several halophiles, aquatic species and those associated with respiration of alternate electron acceptors, reflecting ecosystem pressures on the proliferation or the exclusion of certain lineages. Halophiles have been found to be a feature of permafrost samples (Steven et al., 2007), due to the distribution of brine channel habitats. Comparisons between our AK AWT samples and the AK taiga site revealed that presence-absence drove differences between these more similar habitats within the rarer (<0.1%) members while the more abundant OTUs varied in relative abundances.
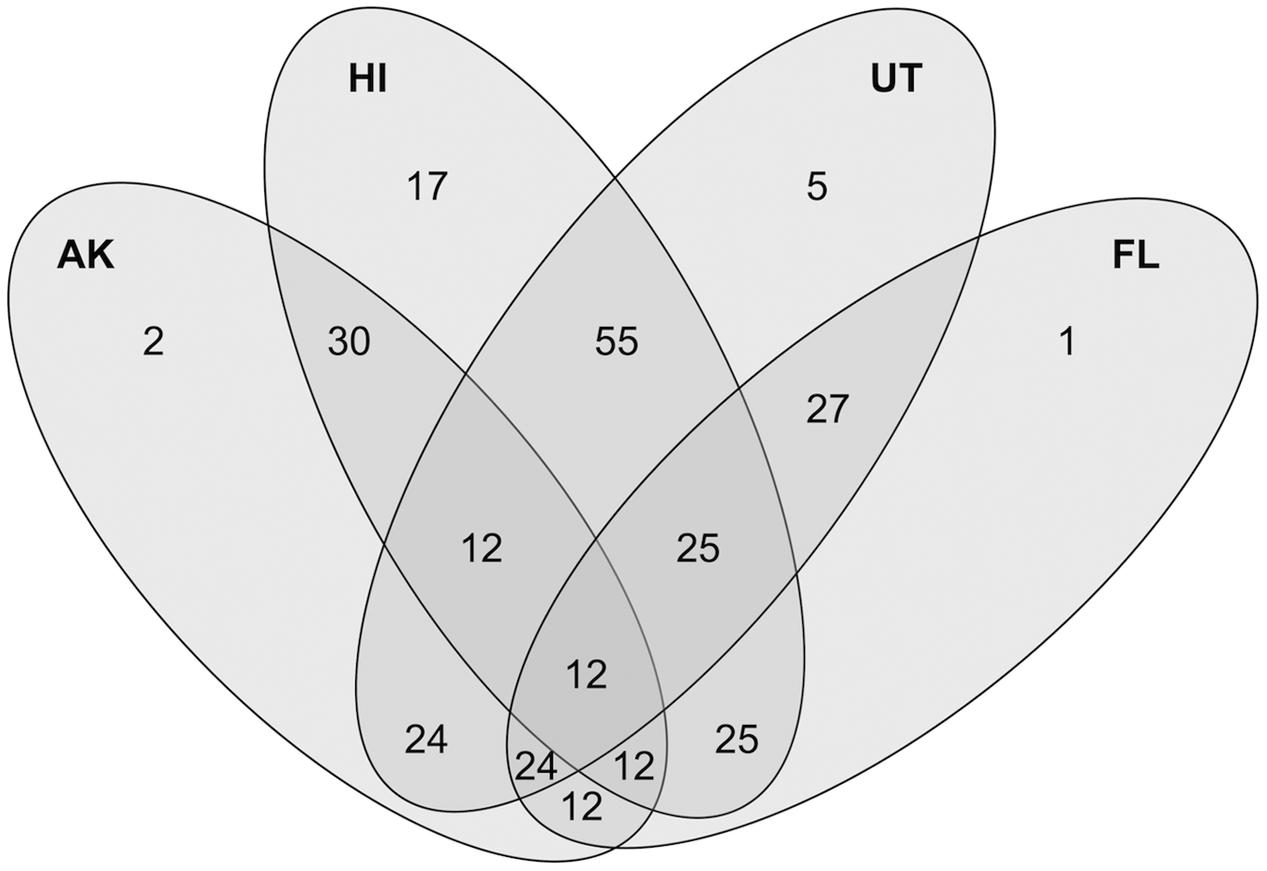
FIGURE 6. Venn Diagram showing the shared and unique closest match taxa of 286 total OTUs between the combined above water table (AWT) and taiga samples (combined as AK), Hawaii (HI), Utah (UT), and Florida (FL) with the criteria that a certain closest-match taxa is present in at least 50% of all samples in a site.
Water Table Influences
Whether the core originated in the minimally, moderately or extensively thawed site had relatively little impact on the overall composition of the diazotrophic community. Instead, the largest influence was the position of the sample above or below the water table. Significantly higher Chao richness in the BWT layers and differences in nifH-harboring bacterial community structure is likely a reflection of the influence of anaerobiosis due to water-saturated conditions and/or the composition of the bacterial community before or during permafrost formation in the Pleistocene epoch. Once thawed and above the standing water table, as reflected in the AWT layers, the bacterial community shifts to populations selected by higher redox conditions that appear influenced to a greater extent by vegetation. Long-term increases in thaw depth will result in deeper penetration of the aerobic layer as additional water produced during permafrost thaw is transported, transpired or evaporated. While depth was a significant correlate to community change, it appears that temperature increases at a 10 cm depth along the gradient (8.7°C -minimally thawed to 11.3°C -extensively thawed) (Schuur et al., 2007) did not further impact bacterial community structure, with no significant change in the nifH-harboring bacterial community in the AWT layers.
Differences between the AWT and BWT diazotrophic communities were not attributed to presence/absence but were rather due to changes in relative abundances. The deep, separate branching of the group III Delta Proteobacteria sequences from the group I nifH-containing Alpha- and Beta-Proteobacteria supports the contrasts made between the AWT and BWT layers. However, genus-level closest match taxonomic assignments reported in this study, particularly in the Alpha- and Beta-Proteobacteria, may not be robust. With a few exceptions, the OTUs most closely matching the group I Alpha- and Beta-Proteobacteria were mostly associated with the AWT layer, where plant roots are more likely to reside and enrich the diazotrophic community such as the group 1 k clade that includes Bradyrhizobium, Rhizobium, and the Burkholderia, The consistently larger abundances of OTUs related to group III nifH-harboring Delta Proteobacteria in the BWT layer are likely linked to the lower redox state in the deeper sediments supporting these sulfate (e.g., Desulfovibrio) and Fe(III)-reducing (e.g., Geobacter) nifH-harboring taxa. However, with the exception of the Geobacter species, the remaining dominant closest-similarity taxa of the BWT nifH community, compared to the AWT, exhibited lower % similarity to the closest reference match. This is especially true with the group III Desulfovibrio, whose average amino acid similarity of 85.5 ± 0.2% was lower than the average within-genus reference set variability of 94.5 ± 1.5%, but close to the nearest-neighbor protein similarity of D. gigas (85.9%), suggesting that they may be uncultured Desulfovibrio species. In addition, M. nodulans 2060 is the only known N-fixing Methylobacterium. This organism was identified as the closest reference for 12.7% of all protein sequences and present in higher abundance in the AWT layers. However, their uncertain phylogenetic placement in the tree (Figure 2) and lack of a known plant host (leguminous plants of the genus Crotalaria) suggests that these reads are likely uncultured soil bacteria, as previously suggested in other AK samples (Wang et al., 2013). Overall, these low amino acid identities are likely due to the retrieval of potentially novel organisms from a combination of sampling the less well-understood permafrost ecosystem and the maximum soil sampling depth of 90 cm.
The depth at which a phylogenetic shift of the diazotrophic community occurs was at the water table interface that corresponded to thaw depth at the time of sampling. The largest specific difference between depths was attributed to OTUs assigned to the group III Opitutaceae sp. TAV2 (D. colitermitum). The TAV2 isolate is a Verrucomicrobia and originally isolated from the hindgut of a termite, Reticulitermes flavipes (Stevenson et al., 2004). It is microaerophilic, possesses the nifHDK genes as well as a functional nitrogenase (Wertz et al., 2012). The closest database relative to Opitutaceae sp. TAV2 is another Verrucomicrobia bacterium DG1235 at 93.5% a.a. identity, suggesting that a currently uncultured Verrucomicrobia may exert a significant impact on N-availability, as proposed for Verrucomicrobia previously in acidic and oligotrophic ecosystems (Wertz et al., 2012). In addition, this OTU may be related to the large population bin of Verrucomicrobia–Opitutus sp. identified in soil metagenomes from a closely related site (Johnston et al., 2016). The larger heterogeneity observed in the deeper sample replicates (Figure 4) likely illustrates the spatially constrained evolution of divergent communities due to the frozen state, and thus, low mixing in the deeper layers of the permafrost.
Community shifts have also been observed at the active layer/permafrost boundary where permafrost metagenomes were found to functionally (but not phylogenetically) converge toward active layer metagenomes during a short-term thaw experiment (Mackelprang et al., 2011). Q-PCR based nifH abundances decreased with thaw in that study while nifH, total bacteria and fungi were found to increase in abundance in another study (Yergeau et al., 2010). At an International Tundra Experiment (ITEX) site, nifH gene diversity decreased with experimental warming (Walker et al., 2008) in concert with significantly higher N-fixation rates in the surface samples (Henry and Svoboda, 1986). While taxonomic information or quantitation alone cannot be used to predict N-fixation rates, the phylogenetic shift toward more putative plant-associated taxa in the thawed layers suggests a functional linkage with the aboveground biomass.
Of the multiple edaphic factors that play a role in plant community composition, N-availability has a particularly strong influence in tundra systems, changing species composition and enhancing growth (Shaver et al., 2001; Mack et al., 2004; Walker et al., 2006). As a proxy for increasing active layer depth, a significant change in plant composition has also been identified between our minimally and extensively thawed sites with a shift from graminoid to shrub dominance with significantly higher total green tissue N. This was interpreted to be a result in an increase in the N supply rate from the soil (Schuur et al., 2007) from either enhanced decomposition or N2-fixation. Indeed, N-fertilization resulted in a similar graminoid to shrub conversion with a corresponding increase in productivity and decomposition but without a change in active layer depth in another study (Mack et al., 2004). The combination of these findings in concert with our data suggests that increases in thaw depth that correspond to a shallower water table depth may initiate changes in aboveground plant community composition through a combination of edaphic factors that subsequently influence the diazotroph community. The question remains as to whether these community changes can be explicitly linked to higher N-fixation rates that potentially drive enhanced decomposition, higher soil N supply and plant green tissue N. Conversely, higher N-fixation may increase denitrification rates as the water table rises with a concomitant increase in N2O emissions. However, the establishment of a direct linkage between changes in diazotrophic community composition and potential outcomes in this permafrost system hinges on the magnitude of changes in N-fixation rates. Furthermore, this is dependent on whether changes in cell (or taxa) specific N-fixation rates accompany the observed community turnover, if other environmental properties ultimately control these rates and the balance between denitrification and N-fixation. In order to establish these explicit linkages in-situ measurements of N-fixation, nitrification and denitrification are needed to establish a N-mass balance of the system. In addition, a greater understanding of taxa-specific N-fixation rates is required to link diazotroph population dynamics to changes in ecosystem level N-availability.
Author Contributions
CP performed data analysis and wrote the manuscript. CY conceived this aspect of the project and performed laboratory work. YD, FL, CH, JZ, and YQ performed laboratory work and processed sequencing data. LW processed and cataloged samples and oversaw laboratory operations. QW performed bioinformatic analysis and provided tools for sequence processing. ES collected the samples and maintained the Alaskan study site. JT, JZ, TZ, and ES were involved in the organization, planning and management of the overall project. JT, ES, and JZ were involved in peer-editing of the manuscript.
Funding
This research was supported by the Office of Science (BER), U.S. Department of Energy, Grant Nos. DE-SC0004601 and DE-FG02-99ER62848.
Conflict of Interest Statement
The authors declare that the research was conducted in the absence of any commercial or financial relationships that could be construed as a potential conflict of interest.
Acknowledgments
Samples were provided from field site activities supported in part by the following programs: U.S. Department of Energy Office of Science, Office of Biological and Environmental Sciences Division Terrestrial Ecosystem Sciences program, Award #DE-SC0006982; National Science Foundation CAREER program, Award #0747195; National Parks Inventory and Monitoring Program; National Science Foundation Bonanza Creek LTER program, Award #1026415 and National Science Foundation Office of Polar Programs, Award #1203777.
Supplementary Material
The Supplementary Material for this article can be found online at: http://journal.frontiersin.org/article/10.3389/fmicb.2016.01894/full#supplementary-material
Footnotes
References
Anderson, M. J. (2001). A new method for non-parametric multivariate analysis of variance. Aust. Ecol. 26, 32–46. doi: 10.1111/j.1442-9993.2001.01070.pp.x
Anderson, M. J., Ellingsen, K. E., and McArdle, B. H. (2006). Multivariate dispersion as a measure of beta diversity. Ecol. Lett. 9, 683–693. doi: 10.1111/j.1461-0248.2006.00926.x
Barsdate, R. J., and Alexander, V. (1975). The nitrogen balance of arctic tundra: pathways, rates, and environmental implications. J. Environ. Qual. 4, 111–117. doi: 10.2134/jeq1975.00472425000400010025x
Buckeridge, K. M., Cen, Y.-P., Layzell, D. B., and Grogan, P. (2009). Soil biogeochemistry during the early spring in low arctic mesic tundra and impacts of deepened snow and enhanced nitrogen availability. Biogochemistry 99, 127–141. doi: 10.1007/s10533-009-9396-7
Chapin, D. M. (1996). Nitrogen mineralization, nitrification and denitrification in a high Arctic lowland ecosystem, Devon Island, N.W.T., Canada. Arct. Antarct. Alp. Res. 28, 85–92. doi: 10.2307/1552089
Chapin, D. M., and Bledsoe, C. (1992). “Nitrogen fixation in arctic plant communities,” in Arctic Ecosystems in a Changing Climate: An Ecophysiological Perspective, eds F. S. Chapin III, R. L. Jefferies, J. F. Reynolds, G. R. Shaver, and J. Svoboda (San Diego, CA: Academic Press), 301–319.
Chu, H., and Grogan, P. (2010). Soil microbial biomass, nutrient availability and nitrogen mineralization potential among vegetation-types in a low arctic tundra landscape. Plant Soil 329, 411–420. doi: 10.1007/s11104-009-0167-y
Clarke, K. R. (1993). Nonparametric multivariate analyses of changes in community structure. Aust. J. Ecol. 18, 117–143. doi: 10.1111/j.1442-9993.1993.tb00438.x
Clarke, K. R., and Warwick, R. M. (2001). Change in Marine Communities: An Approach to Statistical Analysis and Interpretation, 2nd Edn. Plymouth, MA: PRIMER-E.
Deslippe, J. R., and Egger, K. N. (2006). Molecular diversity of nifH genes from bacteria associated with high arctic dwarf shrubs. Microb. Ecol. 51, 516–525. doi: 10.1007/s00248-006-9070-8
Duc, L., Noll, M., Meier, B. E., Burgmann, H., and Zeyer, J. (2009). High diversity of diazotrophs in the forefield of a receding alpine glacier. Microb. Ecol. 57, 179–190. doi: 10.1007/s00248-008-9408-5
Dutta, K., Schuur, E. A. G., Neff, J. C., and Zimov, S. A. (2006). Potential carbon release from permafrost soils of northeastern Siberia. Glob. Change Biol. 12, 2336–2351. doi: 10.1111/j.1365-2486.2006.01259.x
Gaby, J. C., and Buckley, D. H. (2012). A comprehensive evaluation of PCR primers to amplify the nifH gene of nitrogenase. PLoS ONE 7:e42149. doi: 10.1371/journal.pone.0042149
Giblin, A. E., Nadelhoffer, K. J., Shaver, G. R., Laundre, J. A., and McKerrow, A. J. (1991). Biogeochemical diversity along a riverside toposequence in arctic Alaska. Ecol. Monogr. 61, 415–435. doi: 10.2307/2937049
Harms, T. K., and Jones, J. B. (2012). Thaw depth determines reaction and transport of inorganic nitrogen in valley bottom permafrost soils. Glob. Change Biol. 18, 2958–2968. doi: 10.1111/j.1365-2486.2012.02731.x
Henry, G. H. R., and Svoboda, J. (1986). Dinitrogen fixation (acetylene reduction) in high arctic sedge meadow communities. Arc. Alp. Res. 18, 181–187. doi: 10.2307/1551127
Hobara, S., McCalley, C., Koba, K., Giblin, A. E., Weiss, M. S., Gettel, G. M., et al. (2006). Nitrogen fixation in surface soils and vegetation in an Arctic tundra watershed: a key source of atmospheric nitrogen. Arct. Antarct. Alp. Res. 38, 363–372. doi: 10.1657/1523-0430 (2006)38[363:NFISSA]2.0.CO;2
Hobbie, S. E., Schimel, J. P., Trumbore, S. E., and Randerson, J. R. (2000). A mechanistic understanding of carbon storage and turnover in high-latitude soils. Glob. Change Biol. 6, 196–210. doi: 10.1046/j.1365-2486.2000.06021.x
Hsu, S. F., and Buckley, D. H. (2009). Evidence for the functional significance of diazotroph community structure in soil. ISME J. 3, 124–136. doi: 10.1038/ismej.2008.82
Johnston, E. R., Rodriguez-R, L. M., Luo, C., Yuan, M. M., Wu, L., He, Z., et al. (2016). Metagenomics reveals pervasive bacterial populations and reduced community diversity across the Alaska tundra ecosystem. Front. Microbiol. 7:579. doi: 10.3389/fmicb.2016.00579
Keller, K., Blum, J. D., and Kling, G. W. (2010). Stream geochemistry as an indicator of increasing permafrost thaw depth in an Arctic watershed. Chem. Geol. 273, 76–81. doi: 10.1016/j.chemgeo.2010.02.013
Keuper, F., van Bodegom, P. M., Dorrepaal, E., Weedon, J. T., van Hal, J., van Logtestijin, R. S. P., et al. (2012). A frozen feast: thawing permafrost increases plant-available nitrogen in subarctic peatlands. Glob. Change Biol. 18, 1998–2007. doi: 10.1111/j.1365-2486.2012.02663.x
Kielland, K. (1994). Amino acid absorption by Arctic plants-implications for plant nutrition and nitrogen cycling. Ecology 75, 2372–2382. doi: 10.2307/1940891
Kool, D. M., Dolfing, J., Wrage, N., and Van Groenigen, J. W. (2011). Nitrifier denitrification as a distinct and significant source of nitrous oxide from soil. Soil Biol. Biochem. 43, 174–178. doi: 10.1016/j.soilbio.2010.09.030
Lee, H., Schuur, E. A. G., and Vogel, J. G. (2010). Soil CO2 production in upland tundra where permafrost is thawing. J. Geophys. Res. 115:G01009. doi: 10.1029/2008JG000906
Letunic, I., and Bork, P. (2011). Interactive tree of life v2: online annotation and display of phylogenetic trees made easy. Nuc. Acids Res. 39, W475–W478. doi: 10.1093/nar/gkr201
Liengen, T., and Olsen, R. A. (1997). Seasonal and site-specific variations in nitrogen fixation in a high Arctic area, Nyalesund, Spitsbergen. Can. J. Microbiol. 43, 759–769. doi: 10.1139/m97-109
Mack, M. C., Schuur, E. A. G., Bret-Harte, M. S., Shaver, G. R., and Chapin, F. S. I. I. I. (2004). Ecosystem carbon storage in arctic tundra reduced by long-term nutrient fertilization. Nature 431, 440–443. doi: 10.1038/nature02887
Mackelprang, R., Waldrop, M. P., DeAngelis, K. M., David, M. M., Chavarria, K. L., Blazewicz, S. J., et al. (2011). Metagenomic analysis of a permafrost microbial community reveals a rapid response to thaw. Nature 480, 368–371. doi: 10.1038/nature10576
Mao, Y., Yannarell, A. C., and Mackie, R. I. (2011). Changes in N-transforming Archaea and Bacteria in soil during the establishment of bioenergy crops. PLoS ONE 6:e24750. doi: 10.1371/journal.pone.0024750
Natali, S. M., Schuur, E. A. G., Trucco, C., Hicks Pries, C. E., Crummer, K. G., and Baron Lopez, A. F. (2011). Effects of experimental warming of air, soil and permafrost on carbon balance in Alaskan tundra. Glob. Change Biol. 17, 1394–1407. doi: 10.1111/j.1365-2486.2010.02303.x
Norton, J. M., and Stark, J. M. (2011). “Regulation and measurement of nitrification in terrestrial systems,” in Methods in Enzymology, eds M. G. Klotz and L. Y. Stein (Burlington, VT: Academic Press), 343–368.
Osterkamp, T. E., Jorgenson, M. T., Schuur, E. A. G., Shur, Y. L., Kanevskiy, M. Z., Vogel, J. G., et al. (2009). Physical and ecological changes associated with warming permafrost and thermokarst in interior Alaska. Permafrost Perigl. Process. 20, 235–256. doi: 10.1002/ppp.656
Penton, C. R., Johnson, T. A., Quensen, J. F. III, Iwai, S., Cole, J. R., and Tiedje, J. M. (2013). Functional genes to assess nitrogen cycling and aromatic hydrocarbon degradation: primers and processing matter. Front. Microbiol. 4:279. doi: 10.3389/fmicb.2013.00279
Persson, J., Hogberg, P., Ekblad, A., Högberg, M. N., Nordgren, A., and Nasholm, T. (2003). Nitrogen acquisition from inorganic and organic sources by boreal forest plants in the field. Oecologia 137, 252–257. doi: 10.1007/s00442-003-1334-0
Poly, F., Ranjard, L., Nazaret, S., Gourbière, F., and Jocteur Monrozier, L. (2001a). Comparison of nifH gene pools in soils and soil micro-environments with contrasting properties. Appl. Environ. Microb. 67, 2255–2262. doi: 10.1128/AEM.67.5.2255-2262.2001
Poly, F., Monrozier, L. J., and Bally, R. (2001b). Improvement in the RFLP procedure for studying the diversity of nifH genes in communities of nitrogen fixers in soil. Res. Microbiol. 152, 95–103. doi: 10.1016/S0923-2508(00)01172-4
R Core Team (2013). R: A Language and Environment for Statistical Computing. Vienna: R Core Team. Available at: http://www.R-project.org/
Raymond, J., Siefert, J. L., Staples, C. R., and Blankenship, R. E. (2004). The natural history of nitrogen fixation. Mol. Biol. Evol. 21, 541–554. doi: 10.1093/molbev/msh047
Reed, S. C., Townsend, A. R., Cleveland, C. C., and Nemergut, D. R. (2010). Microbial community shifts influence patterns in tropical forest nitrogen fixation. Oecologia 164, 521–531. doi: 10.1007/s00442-010-1649-6
Robertson, G. P., and Vitousek, P. M. (1981). Nitrification potentials in primary and secondary succession. Ecology 62, 376–386. doi: 10.2307/1936712
Roesch, L., Fulthorpe, R., Jaccques, R., Bento, F., and Oliveira Camargo, F. (2010). Biogeography of diazotrophic bacteria in soils. World J. Microbiol. Biot. 26, 1503–1508. doi: 10.1007/s11274-010-0326-6
Rösch, C., and Bothe, H. (2005). Improved assessment of denitrifying, N2-fixing, and total-community bacteria by terminal restriction fragment length polymorphism analysis using multiple restriction enzymes. Appl. Environ. Microb. 71, 2026–2035. doi: 10.1128/AEM.71.4.2026-2035.2005
Schimel, J. P., Bilbrough, C., and Welker, J. A. (2004). Increased snow depth affects microbial activity and nitrogen mineralization in two Arctic tundra communities. Soil Biol. Biochem. 36, 217–227. doi: 10.1016/j.soilbio.2003.09.008
Schuur, E. A. G., Bockheim, J., Canadell, J. G., Euskirchen, E., Field, C. B., Goryachkin, S. V., et al. (2008). Vulnerability of permafrost carbon to climate change: implications for the global carbon cycle. Bioscience 58, 701–714. doi: 10.1641/B580807
Schuur, E. A. G., Crummer, K. G., Vogel, J. G., and Mack, M. C. (2007). Plant species composition and productivity following permafrost thaw and thermokarst in Alaskan tundra. Ecosystems 10, 280–292. doi: 10.1007/s10021-007-9024-0
Schuur, E. A. G., Vogel, J. G., Crummer, K. G., Lee, H., Sickman, J. O., and Osterkamp, T. E. (2009). The effect of permafrost thaw on old carbon release and net carbon exchange from tundra. Nature 459, 556–559. doi: 10.1038/nature08031
Shaver, G. R., Bret-Harte, S. M., Jones, M. H., Johnstone, J., Gough, L., Laundre, J., et al. (2001). Species composition interacts with fertilizer to control long-term change in tundra productivity. Ecology 82, 3163–3181. doi: 10.1890/0012-9658 (2001)082[3163:SCIWFT]2.0.CO;2
Sorensen, P. L., Jonasson, S., and Michelsen, A. (2006). Nitrogen fixation, denitrification, and ecosystem nitrogen pools in relation to vegetation development in the subarctic. Arct. Antarct. Alp. Res. 38, 263–272. doi: 10.1657/1523-0430 (2006)38[263:NFDAEN]2.0.CO;2
Steven, B., Briggs, G., McKay, C. P., Pollard, W. H., Greer, C. W., and Whyte, L. G. (2007). Characterization of the microbial diversity in a permafrost sample from the Canadian high Arctic using culture-dependent and culture-independent methods. FEMS Microb. Ecol. 59, 513–523. doi: 10.1111/j.1574-6941.2006.00247.x
Stevenson, B. S., Eichorst, S. A., Wertz, J. T., Schmidt, T. M., and Breznak, J. A. (2004). New strategies for cultivation and detection of previously uncultured microbes. Appl. Environ. Microbiol. 70, 4748–4755. doi: 10.1128/AEM.70.8.4748-4755.2004
Stewart, K. J., Brummell, M. E., Coxson, D. S., and Siciliano, S. D. (2012). How is nitrogen fixation in the high arctic linked to greenhouse gas emissions? Plant Soil. 362, 215–229. doi: 10.1007/s11104-012-1282-8
Stewart, K. J., Lamb, E. G., Coxon, D. S., and Siciliano, S. D. (2011). Bryophyte-cyanobacterial associations as a key factor in N2-fixation across the Canadian Arctic. Plant Soil. 344, 335–356. doi: 10.1007/s11104-011-0750-x
Tamura, K., Stecher, G., Peterson, D., Filipski, A., and Kumar, S. (2013). MEGA6: molecular evolutionary genetics analysis version 6.0. Mol. Biol. Evol. 30, 2725–2729. doi: 10.1093/molbev/mst197
Tarnocai, C., Canadell, J. G., Schuur, E. A. G., Kuhry, P., Mazhitova, G., and Zimov, S. (2009). Soil organic carbon pools in the northern circumpolar permafrost. Glob. Biogeochem. Cycles 23:GB2023. doi: 10.1029/2008GB003327
Trucco, C., Schuur, E. A. G., Natali, S. M., Belshe, E. F., Bracho, R., and Vogel, J. (2012). Seven-year trends of CO2 exchange in a tundra ecosystem affected by long-term permafrost thaw. J. Geophys. Res. 117:G02031. doi: 10.1029/2011JG001907
Vogel, J., Schuur, E. A. G., Trucco, C., and Lee, H. (2009). Response of CO2 exchange in a tussock tundra ecosystem to permafrost thaw and thermokarst development. J. Geophys. Res. 114, G04018. doi: 10.1029/2008JG000901
Walker, J. K. M., Egger, K. N., and Henry, G. H. R. (2008). Long-term experimental warming alters nitrogen-cycling communities but site factors remain the primary drivers of community structure in high arctic soils. ISME J. 2, 982–995. doi: 10.1038/ismej.2008.52
Walker, M. D., Wahren, C. H., Hollister, R. D., Henry, G. H. R., Ahlquist, L. E., Alatalo, J. M., et al. (2006). Plant community responses to experimental warming across the tundra biome. Proc. Natl. Acad. Sci. U.S.A. 103, 1342–1346. doi: 10.1073/pnas.0503198103
Wang, Q., Quensen, J. F., Fish, J. A., Lee, T. K., Sun, Y., Tiedje, J. M., et al. (2013). Ecological patterns of nifH genes in four terrestrial climatic zones explored with targeted metagenomics using FrameBot, a new informatics tool. mBio 4, e00592-13. doi: 10.1128/mBio.00592-13
Warwick, R. M., Platt, H. M., Clarke, K. R., Agard, J., and Gobin, J. (1990). Analysis of macrobenthic and meiobenthic community structure in relationship to pollution and disturbance in Hamilton Harbour, Bermuda. J. Exp. Mar. Biol. Ecol. 138, 119–142. doi: 10.1016/0022-0981(90)90180-K
Wertz, J. T., Kim, E., Breznak, J. A., Schmidt, T. M., and Rodrigues, J. L. (2012). Genomic and physiological characterization of the verrucomicrobia isolate Diplosphaera colitermitum gen. nov., sp. nov., reveals microaerophily and nitrogen fixation genes. Appl. Environ. Microbiol. 78, 1544–1555. doi: 10.1128/AEM.06466-11
Yergeau, E., Hogues, H., Whyte, L. G., and Greer, C. W. (2010). The functional potential of high Arctic permafrost revealed by metagenomic sequencing, qPCR and microarray analyses. ISME J. 4, 1206–1214. doi: 10.1038/ismej.2010.41
Young, J. P. W. (1992). “Phylogenetic classification of nitrogen-fixing organisms,” in Biological Nitrogen Fixation, eds G. Stacey, R. H. Burris, and H. J. Evans (London: Chapman and Hall), 43–86.
Young, J. P. W. (2005). “The phylogeny and evolution of nitrogenases,” in Genomes and Genomics of Nitrogen-Fixing Organisms, eds R. Palacios and W. E. Newton (Berlin: Springer), 221–241.
Zehr, J. P., Jenkins, B. D., Short, S. M., and Steward, G. F. (2003). Nitrogenase gene diversity and microbial community structure: a cross-system comparison. Environ. Microbiol. 5, 539–554. doi: 10.1046/j.1462-2920.2003.00451.x
Keywords: nifH, nitrogen-fixing, permafrost, diazotroph, nitrogen, microbial
Citation: Penton CR, Yang C, Wu L, Wang Q, Zhang J, Liu F, Qin Y, Deng Y, Hemme CL, Zheng T, Schuur EAG, Tiedje J and Zhou J (2016) NifH-Harboring Bacterial Community Composition across an Alaskan Permafrost Thaw Gradient. Front. Microbiol. 7:1894. doi: 10.3389/fmicb.2016.01894
Received: 08 September 2016; Accepted: 11 November 2016;
Published: 24 November 2016.
Edited by:
Jeanette M. Norton, Utah State University, USAReviewed by:
Richard S. Winder, Natural Resources Canada, CanadaWei Shi, North Carolina State University, USA
Copyright © 2016 Penton, Yang, Wu, Wang, Zhang, Liu, Qin, Deng, Hemme, Zheng, Schuur, Tiedje and Zhou. This is an open-access article distributed under the terms of the Creative Commons Attribution License (CC BY). The use, distribution or reproduction in other forums is permitted, provided the original author(s) or licensor are credited and that the original publication in this journal is cited, in accordance with accepted academic practice. No use, distribution or reproduction is permitted which does not comply with these terms.
*Correspondence: C. Ryan Penton, crpenton@asu.edu