 Bojan Papić1
 Mateja Pate1
 Urška Henigman2
 Urška Zajc1Igor Gruntar1Majda Biasizzo2Matjaž Ocepek1
 Darja Kušar1*
- 1Veterinary Faculty, Institute of Microbiology and Parasitology, University of Ljubljana, Ljubljana, Slovenia
- 2Veterinary Faculty, Institute of Food Safety, Feed and Environment, University of Ljubljana, Ljubljana, Slovenia
Campylobacteriosis is the most frequently reported bacterial food-borne illness in the European Union and contaminated broiler meat is considered the most important source of infection in humans. The aim of the present study was to evaluate real-time PCR (qPCR) and digital PCR (dPCR) for quantification of Campylobacter jejuni in 75 broiler neck-skin samples collected from a poultry slaughterhouse, and to compare them with the ISO 10272-2 standard plate count method. For qPCR standard curve, C. jejuni-negative neck-skin samples were spiked with C. jejuni suspension with a known number of bacterial cells. The observed CFU/g values by qPCR correlated greatly with the expected values and qPCR showed good performance with the reliable limit of detection (rLOD) and limit of quantification (LOQ) of three and 31 target copies per reaction, respectively. However, both rLOD (1219 CFU/g) and LOQ (12,523 CFU/g) were beyond the EFSA-proposed critical limit of 500–1,000 CFU/g of neck skin. Although C. jejuni cell counts were ≤1,000 CFU/g in only 7/75 samples by plate counting, they were ≤LOQ in 60/75 and ≤rLOD in 26/75 (≤1,000 CFU/g in 24/75) samples by qPCR. A strong and statistically significant correlation was observed between qPCR and dPCR. Both PCR-based methods correlated significantly with the plate count method; however, the correlation was moderate. Using the Bland–Altman analysis, an average agreement was noted between all three methods, although with a large standard deviation. A significant bias toward overestimation in dPCR was observed, probably due to the relatively high number of false positive calls. The linear dynamic range was comparable in both PCR-based methods; however, qPCR proved to be more suitable for routine use. In the future, the establishment of a reliable molecular quantification of C. jejuni in poultry samples showing a wide range of contamination levels down to the proposed critical limit is needed to enable time- and cost-effective surveillance throughout all stages in the food production chain. As both rLOD and LOQ were beyond this limit, a modification of the procedure is suggested to include less sample dilution prior to DNA extraction to enable PCR-based quantification of C. jejuni at the proposed microbiological criteria.
Introduction
Campylobacter spp. has been the most commonly reported bacterial gastrointestinal pathogen in humans in the European Union (EU) since 2005. The EU notification rate increased by 10% in 2014, compared with the previous year, and a statistically significant increasing trend was observed in the 7-year period from 2008 to 2014 (EFSA, 2015). The main causative agent of intestinal campylobacteriosis is Campylobacter jejuni, which is naturally present in the intestines of birds, especially in industrial poultry production. Contaminated broiler meat is considered the most important source of infection in humans (EFSA, 2015). Contamination of poultry meat occurs during the slaughterhouse processing (Berrang et al., 2001); as campylobacters persist throughout the food chain, they represent a public health risk. According to EFSA estimates, the latter could be considerably reduced if all slaughtered poultry batches would comply with microbiological criteria with a critical limit of 1,000 or 500 CFU/g of neck and breast skin (Debretsion et al., 2007). To reliably quantify the extent of C. jejuni contamination in such samples, appropriate (rapid, accurate, reliable, and reasonably priced) enumeration methods should be used.
Rapid and reliable detection and quantification of the organism directly in samples remain challenging. Traditional plate counting method is a time consuming procedure, requiring several working days to be completed (ISO 10272-2:2006; ISO, 2006a). Its advantage, but possibly also one of its biggest drawbacks, is that it only recovers cells which can be readily cultivated in vitro. Along with the dead or damaged bacteria, the presence of viable but non-culturable (VBNC) cells, which can occur as an adaptation to environmental stress, may lead to underestimation of Campylobacter numbers in investigated samples (Thomas et al., 2002). Nevertheless, the ISO 10272-2:2006 plate counting method is currently the only acceptably validated and standardized Campylobacter quantification method, thus allowing the comparison of results between different laboratories and matrices.
Molecular methods such as real-time PCR (also called quantitative PCR; qPCR) provide certain advantages in C. jejuni quantification, especially in terms of turnaround time, specificity and sensitivity, and have already been used for different applications related to poultry industry, e.g., for quantification in poultry carcass rinses (Debretsion et al., 2007; Botteldoorn et al., 2008), fecal and cecal samples (Rudi et al., 2004; Garcia et al., 2013), carcasses (Melero et al., 2011; Ivanova et al., 2014), neck-skin samples (Schnider et al., 2010), and samples from the slaughtering environment (Melero et al., 2011; Ivanova et al., 2014). The third generation of PCR technology—digital PCR (dPCR)—is reported to offer further advantages in precise quantification of nucleic acids in terms of higher sensitivity and reproducibility compared to qPCR (Strain et al., 2013; Taylor et al., 2015). One of major advantages of dPCR is the absolute quantification with no calibration curve required (Huggett et al., 2015). Chip-based dPCR is supported by the endpoint PCR assay in which a sample is diluted and partitioned into thousands of separate reaction chambers to each contain one or no copies of the target sequence. Calculation of the absolute quantities is based upon counting the number of positive vs. negative partitions at an appropriate dilution level to comply with Poisson statistics that sustains the algorithms behind dPCR quantification (Baker, 2012). Nevertheless, one of the major drawbacks of DNA-based techniques used for quantification is their inability to distinguish between DNA from viable and dead cells (Nocker and Camper, 2006), which is probably the most important obstacle in implementation of these methods in routine applications.
The aim of the present study was to evaluate two molecular methods, qPCR and dPCR, for C. jejuni quantification in the naturally contaminated broiler neck-skin samples collected at the slaughterhouse, and to compare them with the ISO 10272-2:2006 standard-based plate counting method. To the best of our knowledge, this is the first report on the use of dPCR for C. jejuni quantification in poultry samples.
Materials and Methods
Samples
Standard Curve Samples
For validation of qPCR and dPCR, C. jejuni ATCC 33,560 was cultivated in the brain heart infusion (BHI) broth (Oxoid, UK) at 37°C to obtain an overnight culture containing 1.1 × 10⁸ CFU/g as determined by the plate count method. A 10-fold dilution series was prepared in BHI. Poultry neck-skin samples (1 g) that tested negative for the presence of C. jejuni by the plate count method and qPCR were spiked with 100 μl of dilution series. Dilutions ranging from 1.1 × 10⁷ CFU/ml (dilution 100) to 1.1 CFU/ml (dilution 10−7) were obtained and samples processed as later employed for the naturally contaminated poultry neck skin. All dilutions were spiked in triplicates (biological replicates) and subjected to DNA extraction prior to qPCR (in three technical replicates) and dPCR (in one technical replicate).
Broiler Neck-Skin Samples
Sixty individual and 15 pooled (a pool consisted of neck-skin samples from 10 broilers) neck-skin samples were collected in the scope of two research projects aiming to reduce Campylobacter contamination levels at slaughterhouses. Approximately 1 g of neck skin from each individual carcass was taken to analyze the contamination level of C. jejuni according to ISO 10272-2:2006 method (ISO, 2006a). Briefly, pooled (10 × 1 g) and non-pooled skin samples (10 g each) were supplemented with 90 ml of buffered peptone water and homogenized (10-fold dilutions). One milliliter of suspension was used for DNA extraction and 1 ml for enumeration by the plate count method.
Enumeration
Enumeration I: Plate Count Method
Enumeration and determination of C. jejuni in 1 ml of initial suspension (skin homogenate or culture) were performed according to ISO 10272:2006 methods (ISO, 2006a,b). For enumeration of C. jejuni culture, 1 ml of initial culture suspension was applied onto three mCCDA (modified charcoal cefoperazone desoxycholate agar; Oxoid, UK) plates and 0.1 ml of further decimal dilutions up to 10−8 on single mCCDA plates. For enumeration of skin-homogenate samples, 1 ml of sample and decimal dilutions to 10−3 were spread plated. After 40–48 h incubation at 41.5°C in the microaerophilic atmosphere created by the GENbox generators (BioMerieux, France), plates from two successive dilutions with <150 Campylobacter-suspected colonies per plate were counted to obtain the final colony forming units (CFU) per unit of measure (g or ml). To determine the isolates to the species level, the hippurate and indoxyl acetate hydrolysis, catalase and susceptibility to cephalotine and nalidixic acid tests were performed. Two suspected Campylobacter colonies from each sample were randomly selected for identification.
DNA Extraction
Total DNA was extracted from 1 ml of the prepared samples (24 standard curve samples, 60 individual, and 15 pooled skin homogenates) using Isolation from Complex Samples Kit (Institute of Metagenomics and Microbial Technologies, Slovenia) according to the manufacturer's instructions with minimal adjustments described by Logar et al. (2012). All DNA samples were stored at −20°C until use.
Enumeration II: qPCR
For quantification of C. jejuni by qPCR, a standard curve analysis was performed to validate the procedure. The negative matrix was spiked in three biological replicates with an overnight C. jejuni culture diluted in 10-fold series as described above. After DNA extraction, all biological replicates were tested with qPCR in three technical replicates to calibrate the qPCR assay adopted from Toplak et al. (2012) prior to the in-house use. Amplification efficiency of the reaction was calculated according to the equation E = 10−1/slope − 1. For the calculation of standard curve equation, only data belonging to the linear dynamic range was considered (coefficient of variation <33%; Žel et al., 2012). Results were reported in Cq values. Limit of quantification (LOQ) and Cq cut-off value were determined as described by Kušar et al. (2013). Reliable limit of detection (rLOD) was determined where at least 95% of positive replicates were detected, and limit of detection (LOD) as the lowest concentration of C. jejuni with at least one positive replicate. In brief, the assay variability expressed by the coefficient of variation (CV) for each standard dilution was determined as the standard deviation of the calculated concentrations (from Cq values of nine replicates according to the equation of fitted regression line) in proportion to the average calculated concentration. According to the obtained CV values, LOQ was determined as CVs are markedly larger below the PCR quantification limit (Vaerman et al., 2004). Reliable LOD was set accordingly lower, i.e., 5- to 10-fold lower than LOQ in complex samples (Berdal and Holst-Jensen, 2001). For determination of the Cq cut-off value, the highest Cq was considered belonging to the first standard dilution of the dilution series where no amplification was observed in some of the replicates; this Cq was rounded up to the next half value and 0.5 was added to obtain the Cq cut-off value (Mehle et al., 2012).
The 25-μl qPCR reactions contained 2.5 μl DNA, 1 × TaqMan Universal PCR Master Mix (Applied Biosystems by Thermo Fisher Scientific, USA) and ccoN primers and probe concentrations at previously described concentrations (Toplak et al., 2012). Besides the previously tested specificity on two phylogenetically related and ten unrelated species (Toplak et al., 2012), the specificity of the assay was additionally tested on Campylobacter species that serve as controls for routine PCR assays (Campylobacter coli, C. lari, C. upsaliensis, C. fetus subsp. fetus, C. fetus subsp. venerealis). Thermal amplification was performed in AB 7500 Fast Real-Time PCR System (Applied Biosystems by Thermo Fisher Scientific, USA).
Enumeration III: dPCR
Prior to implementation, dPCR was validated using the same standard curve samples as for qPCR validation. Quality threshold (QT) and fluorescence threshold (FT) were determined based on the comparison of 14 negative template controls (i.e., negative matrix controls as determined by the plate count method and qPCR; NTC), 10 water no template controls (PCR grade water, WNTC), and 10 positive controls for increased stringency. The observed copy number/μl in dPCR was converted to CFU/ml taking into account all dilution factors.
Absolute quantification of C. jejuni with dPCR was performed in 15-μl reactions consisting of 7.5 μl QuantStudio 3D Digital PCR Master Mix v2 (Applied Biosystems by Thermo Fisher Scientific, USA), 3 μl DNA, 3.75 μl of PCR grade water, and ccoN primers and probes at previously described concentrations (Toplak et al., 2012). A 14.5 μl aliquot of each reaction mix was loaded onto dPCR chips from QuantStudio 3D Digital PCR 20K Chip Kit v2 using QuantStudio 3D Digital PCR Chip Loader. Amplification was performed in the PCR cycler ProFlex 2 × flat PCR System (Applied Biosystems by Thermo Fisher Scientific, USA) according to manufacturer's instructions. NTC and a positive control were included in each run. After amplification, all chips were analyzed using QuantStudio 3D AnalysisSuite 3.0.3.
Statistics
All numbers were log10 transformed to ensure the data was normally distributed. Regression analysis and Bland–Altman plots were performed using MedCalc v17.1 (MedCalc Software, Belgium). P ≤ 0.05 was considered statistically significant.
Results
Validation of qPCR
The in-house standard curve of 10-fold dilutions of standard DNA extracted from C. jejuni-spiked negative poultry neck skin is shown in Figure 1 with regression-curve equation and regression coefficient R2. The amplification efficiency was 89.80%. The Cq cut-off value was set to 40.5 according to the first standard dilution with no amplification in at least one replicate (dilution 10−5 in Table 1). In this study, 2/3 replicates were negative for the particular limiting dilution 10−5 (CV = 151.46%) and LOD was calculated from the obtained Cq values (<3 CFU/reaction, 70 CFU/g).
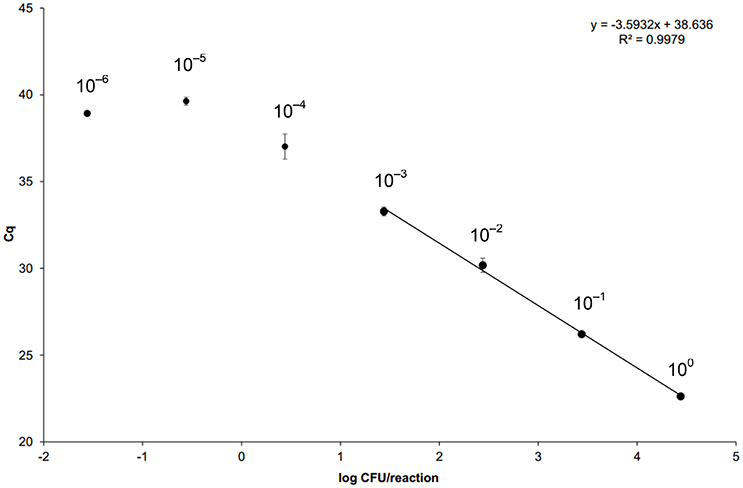
Figure 1. Standard curve for qPCR based on average cycle of quantification (Cq) values plotted against the estimated number of target copy number per reaction. Negative poultry neck-skin samples were spiked with 100 μl of 10-fold dilution series, prepared from the overnight Campylobacter jejuni culture (1.1 × 10⁸ CFU/ml) and ranging from 1.1 × 10⁷ CFU/ml (dilution 100) to 1.1 CFU/ml (dilution 10−7). All dilutions were spiked in triplicates (biological replicates) and samples processed as employed for the naturally contaminated poultry neck skin. After DNA extraction, all biological replicates were tested with qPCR in three technical replicates. Amplification efficiency (E = 10−1/slope − 1) of the reaction was 89.80%. For the calculation of standard curve equation, only data belonging to the linear dynamic range was considered (coefficient of variation <33%). Dilutions 10−7 gave negative results. Error bars represent standard deviations of averaged Cqs. For raw data, see Table 1.
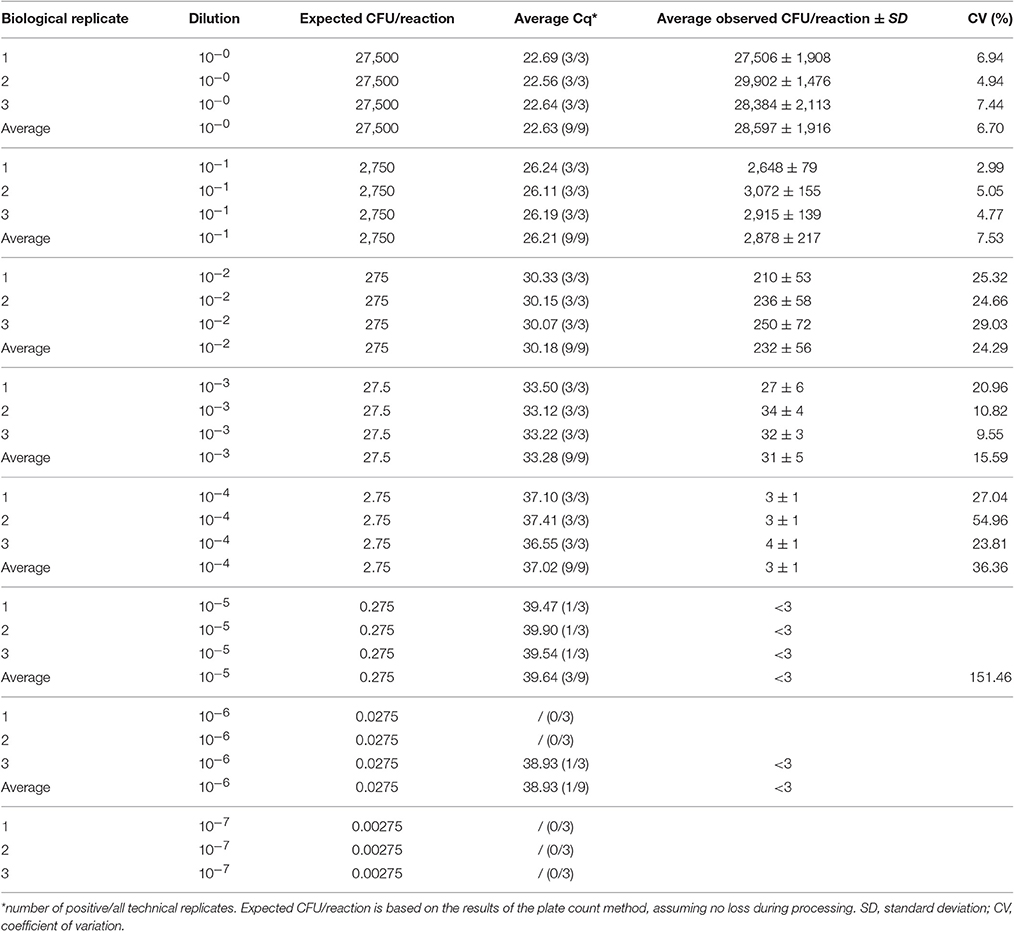
Table 1. In-house calibration of qPCR for Campylobacter jejuni (qPCR assay adopted from Toplak et al., 2012).
According to CVs, LOQ was set to ~31 CFU/reaction (dilution 10−3 in Table 1). Assuming no losses in DNA extraction and taking into account the volume of the elution buffer, this corresponded to 1,252 CFU/ml of poultry skin homogenate. According to the obtained Cq values for dilution series and calculated concentrations, rLOD was set to ~3 CFU/reaction (dilution 10−4 in Table 1), which is the most sensitive reliable LOD theoretically possible (Bustin et al., 2009) and was in congruence with the theoretical 5- to 10-fold difference between LOQ and rLOD (Berdal and Holst-Jensen, 2001). The obtained rLOD translated to 122 CFU/ml. Due to the sample preparation procedure that included supplementation of skin samples with 10-times the volume of buffered peptone water and homogenization, the obtained LOQ and rLOD in CFU/g should be multiplied by 10 to obtain contamination levels for chicken skin samples: 12,523 CFU/g (LOQ) and 1,219 CFU/g (rLOD).
Validation of dPCR
Prior to analyses, QT and FT values were user-defined at 0.5 and 4,500–6,500, respectively. To evaluate the performance and capability of dPCR for C. jejuni quantification, the same standard curve samples were used as for qPCR and values for CFU/ml (or CFU/g after multiplying) were calculated from the obtained results (Table 2). In-house validation of dPCR showed that precision markedly decreased between dilutions 10−3 and 10−4, showing the same linear dynamic range as in qPCR (Table 1). As the recommended precision for reliable quantification in dPCR is 10%, only dilutions from 100 to 10−3 were used for the calculation of trend line (Figure 2). The observed CFU/reaction was plotted against the expected CFU/reaction for both methods—dPCR and qPCR (Figure 2). A trend of overestimation of the observed concentration using dPCR was revealed, whereas the observed qPCR concentrations plotted against the expected values were concordant; the expected values were obtained from the plate count enumeration of C. jejuni culture that was used for the preparation of standard DNA dilutions. In dPCR, NTC, and WNTC samples were analyzed for the assessment of analytical specificity (Table 3). Results showed that dPCR generated false positive calls in the negative controls; the average copy number/μl was 4.83 ± 3.65 for WNTC and 3.04 ± 0.48 for NTC. The false positives were in congruence with the overestimation observed over the entire range of tested standard dilutions (Figure 2). Whereas, LOQ and rLOD in qPCR were set to 31 (dilution 10−3) and 3 (dilution 10−4) observed CFU/reaction, respectively, C. jejuni was reliably detected and quantified by dPCR at observed 107 CFU/reaction (dilution 10−3, precision 12.98%); at the observed 16 CFU/reaction (dilution 10−4), the precision worsened to 36.33%, indicating a wider confidence interval CI (the lower the precision, the tighter the CI). Inferior performance of dPCR could be explained by a high signal-to-noise ratio observed in negative controls.
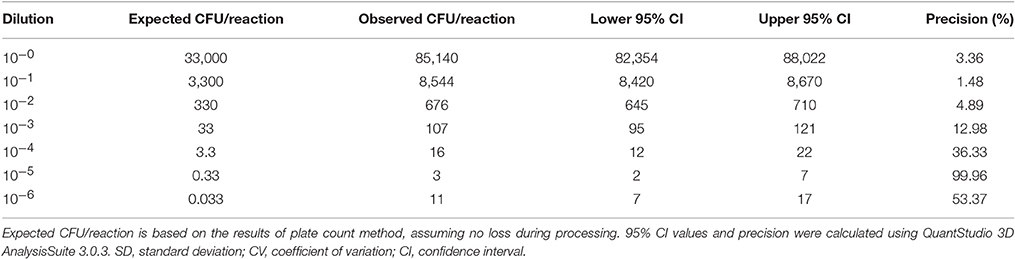
Table 2. In-house validation of dPCR for Campylobacter jejuni absolute quantification.
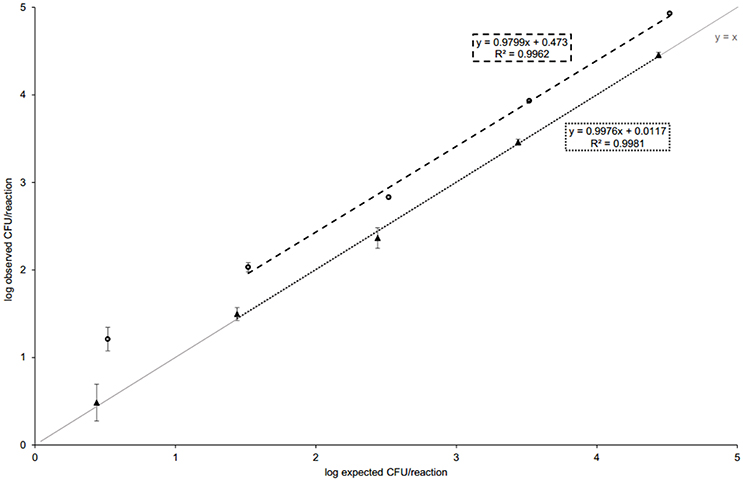
Figure 2. The performance of qPCR and dPCR. Standards were prepared and qPCR performed as described in Figure 1. For dPCR, each biological replicate was run on a single chip. The expected values were obtained from plate counting and the solid line represents CFU observed equaled to CFU expected (y = x). In dPCR, the absolute copy numbers were obtained (absolute quantification), whereas in qPCR, the observed value was calculated from the standard curve (relative quantification). Five 10-fold dilutions from 100 to 10−4 are shown. For the calculation of standard curve equation in qPCR, only data belonging to the linear dynamic range was considered (coefficient of variation <33%). In dPCR, same dilutions were used as they all generated precision up to ~10%. For raw data, see Tables 1, 3. Error bars represent standard deviations in qPCR and confidence intervals in dPCR, respectively.
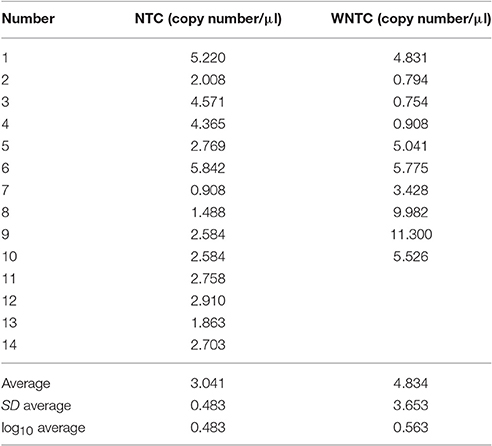
Table 3. Copy number of negative template controls (NTC) and water no template controls (WNTC) per μl of extracted DNA in dPCR.
Comparison of Plate Count, qPCR, and dPCR
C. jejuni was quantified in 75 (60 individual and 15 pooled) broiler neck-skin samples. All samples tested were positive for campylobacters by the plate count method, but 8/75 samples were outside the measuring range as being too numerous to count by the selected sample dilutions (Table 4). All selected Campylobacter-suspected colonies were identified as C. jejuni. Plate count enumeration showed that Campylobacter (C. jejuni) contamination ranged from 60 to >15,000 CFU/g of neck skin.
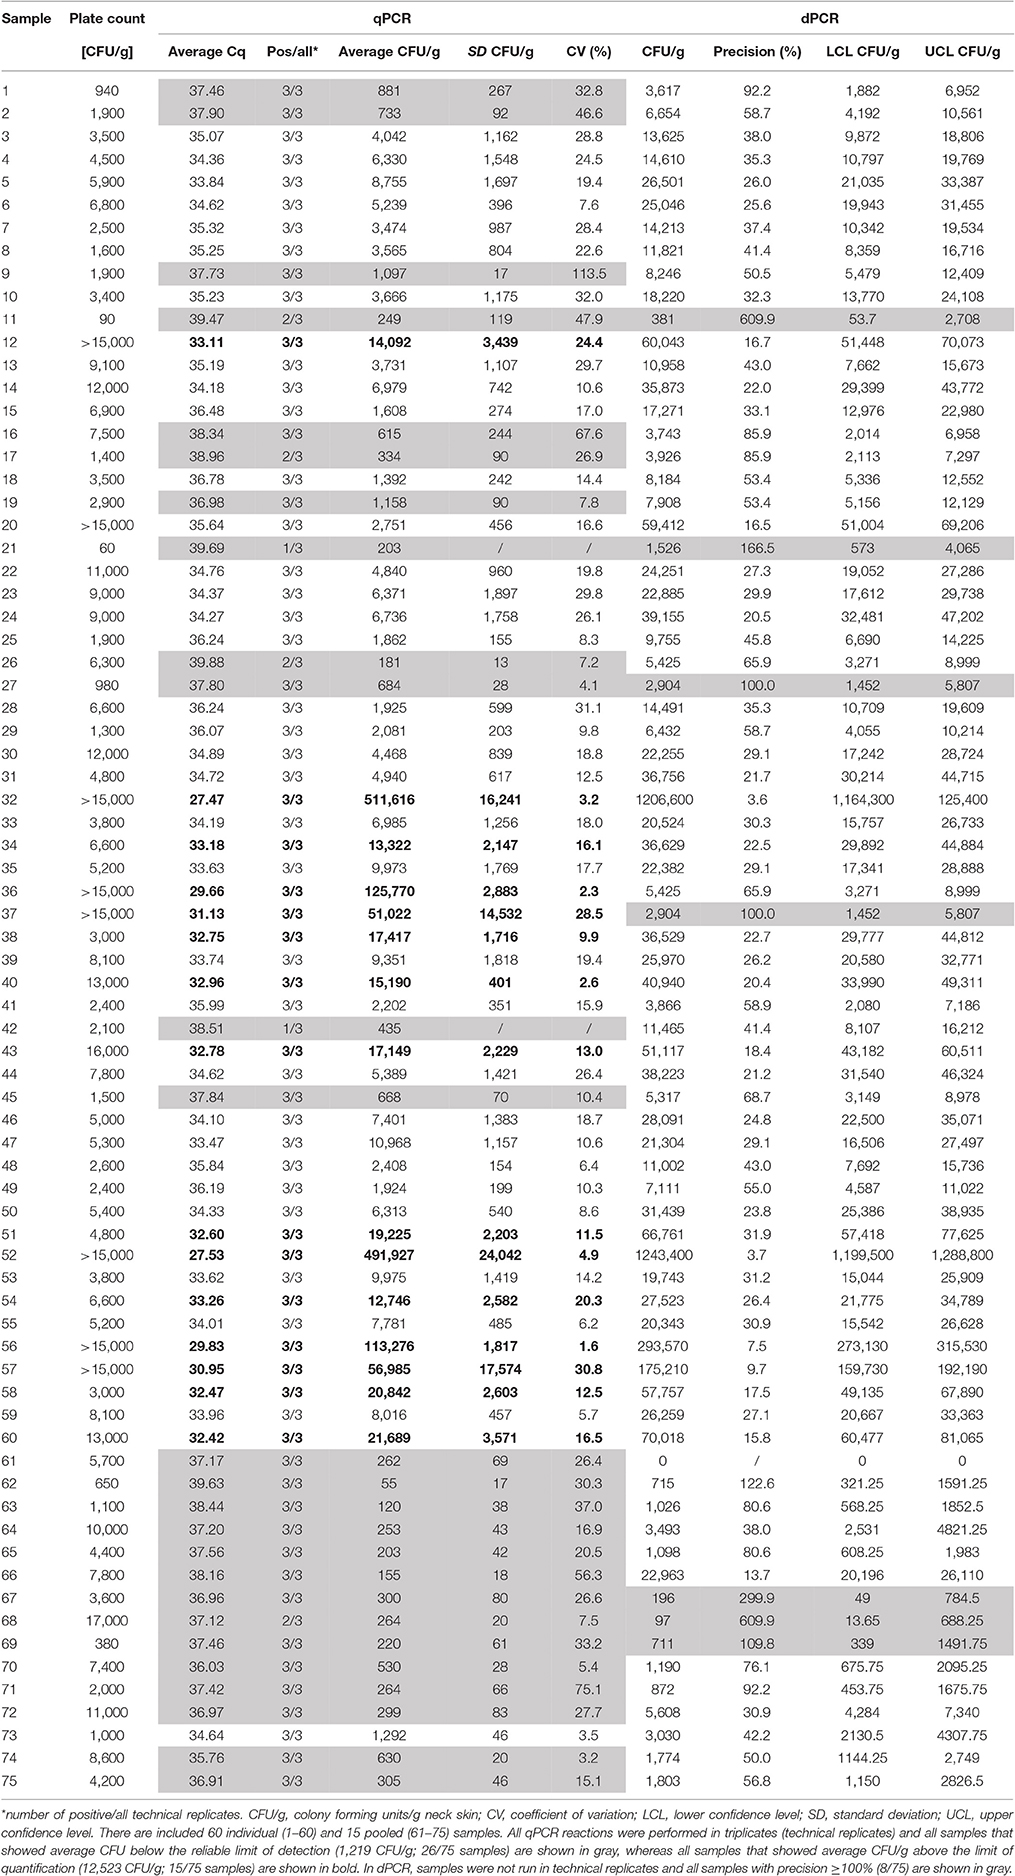
Table 4. Quantification of Campylobacter jejuni on 75 naturally contaminated broiler neck-skin samples using the plate count method, qPCR and dPCR.
For qPCR quantification, C. jejuni concentration or contamination in the neck-skin samples was calculated from the obtained Cq values with the regression-curve equation. All samples were positive by qPCR; however, the majority (60/75) showed values below LOQ (12,523 CFU/g) and 26/75 also below rLOD (1,219 CFU/g). For the latter, the observed cell counts obtained by qPCR ranged from 55 to 1,158 CFU/g (Table 4). In dPCR, 74/75 samples were positive; the negative result was attributed to the sample that was positive by plate count (5,700 CFU/g) and qPCR (262 CFU/g). As the qPCR result showed a value below rLOD, the negative dPCR result could be explained by stochastic variation or sampling error.
For each comparison, samples that were not quantifiable by both methods were discarded from the analysis. Since LOQ selected for only 15/75 quantifiable samples in qPCR and rLOD selected for 49/75, rLOD was taken as a threshold for comparison as all samples above rLOD showed CV <33% (Table 4). In dPCR, precision threshold of 100% was selected to obtain enough data for comparison as precision <10% was rarely observed (Table 4).
Linear regression analysis demonstrated a moderate and statistically significant linear correlation between qPCR and plate count (r = 0.513; p = 0.0006) and dPCR and plate count (r = 0.458; p = 0.0003; Figure 3). Correlation between dPCR and qPCR was strong and statistically significant (r = 0.805; p < 0.0001; Figure 3). Furthermore, Bland–Altman plots were constructed to assess the agreement between method pairs (Figure 4). In general, the majority of samples were inside the 95% confidence interval limits (±1.96 SD); however, 1.96 SD values were relatively high in all comparisons ranging from 0.61 (qPCR vs. plate count) to 0.86 (dPCR vs. plate count). Regarding the mean of differences (log10 values), no bias was observed when comparing qPCR and plate count as the average mean of differences was close to the line of equality (difference = 0; Figure 4A). However, when dPCR was involved in the comparison, a significant bias toward overestimation of dPCR was noted in both cases which was probably due to the relatively high number of false positive calls (Figures 4B,C).
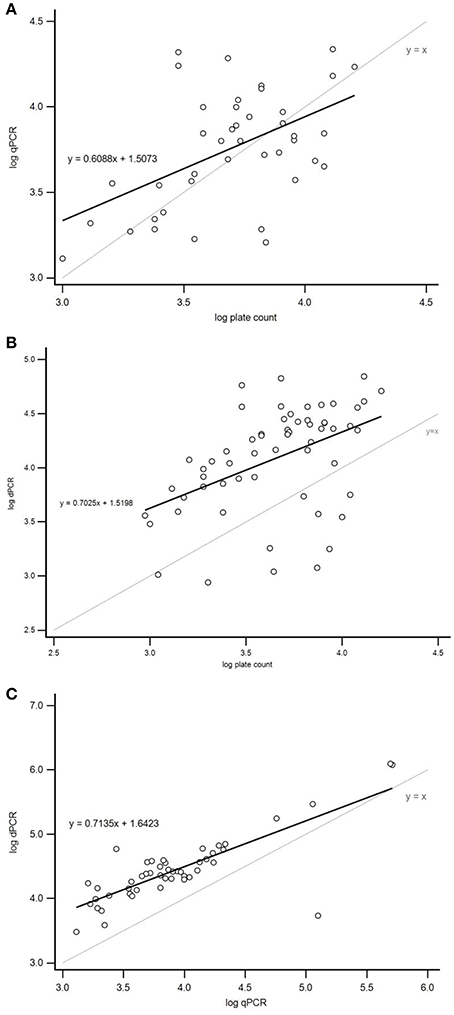
Figure 3. Linear regression analysis of the log CFU/g numbers observed by the plate count method, qPCR and dPCR for quantification of Campylobacter jejuni in 75 naturally contaminated broiler neck-skin samples (15 pooled and 60 individual). (A) Correlation between qPCR and plate count method: linear trend line equation (thick continuous line). Correlation between variables was moderate and statistically significant (r = 0.513; p = 0.0006, N = 41). (B) Correlation between dPCR and plate count method was moderate and statistically significant (r = 0.458; p = 0.0003, N = 59). (C) Correlation between dPCR and qPCR was strong and statistically significant (r = 0.805, p < 0.0001, N = 48). Thin continuous lines in all three graphs represent line of equality (y = x). r, Pearson correlation coefficient.
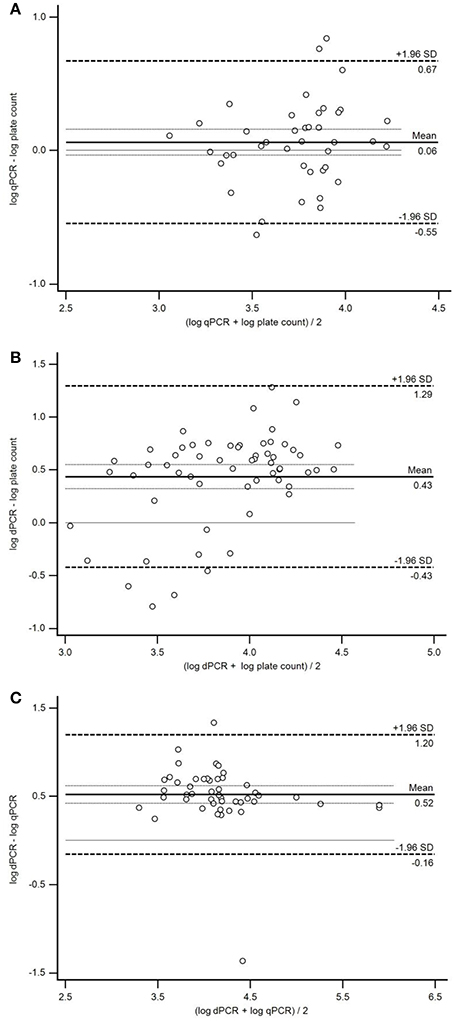
Figure 4. Evaluation of the agreement between the plate count method, qPCR and dPCR for quantification of Campylobacter jejuni in broiler neck-skin samples using Bland–Altman analysis. (A) Agreement between qPCR and the plate count method. Mean bias 0.06 ± 0.10 log10 (95% confidence intervals from −0.55 to 0.67 log10, N = 41). (B) Agreement between dPCR and the plate count method. Mean bias 0.43 ± 0.11 log10 (95% confidence intervals from −0.43 to −1.29 log10, N = 59). (C) Agreement between dPCR and qPCR. Mean bias 0.52 ± 0.10 log10 (95% confidence intervals from −0.16 to 1.20 log10, N = 48). Line representing zero log difference is shown as a thin solid line, whereas standard deviations of mean log difference as thin dotted lines. SD, standard deviation.
Discussion
Campylobacter is one of the most common causes of gastroenteritis worldwide which can also lead to severe post-infection complications such as Guillain-Barré syndrome (Allos, 2001). Fecal contamination during slaughtering, especially at evisceration and plucking phases, is considered to be the major cause of the presence of Campylobacter bacteria on broiler carcasses (Corry and Atabay, 2001; Normand et al., 2008). Quick and reliable methods for Campylobacter enumeration are of primary interest as they could facilitate food surveillance and enable the assessment of control measures taken to reduce Campylobacter contamination in the food-producing environment.
Currently, the ISO 10272-2:2006 plate counting method is the only accepted and standardized quantification method for campylobacters in various matrices. However, molecular-based approaches could provide laboratories with more rapid procedures for quantification, if proven satisfactory regarding the reproducibility and repeatability for the selected types of samples, in addition to adequate limits of quantification and detection. However, discrimination of viable and damaged or dead Campylobacter cells with molecular methods remains challenging.
Results of the present study suggest that PCR-based methods require a relatively high Campylobacter contamination of the neck skin for reliable detection and quantification when using the sample preparation described. The employed qPCR assay performed to the best of theoretical limits with rLOD of three target copies per reaction (Bustin et al., 2009); however, the preceding sample dilutions markedly impaired C. jejuni detection and quantification at the proposed contamination levels 500–1,000 CFU/g (EFSA, 2011). This renders qPCR and dPCR unable to reliably quantify C. jejuni in the range of the proposed microbiological criteria for Campylobacter in foodstuffs, but with a modification of the protocol for sample preparation (e.g., elimination of the initial 10-fold dilution during sample homogenization), a more concentrated input material could be obtained for DNA extraction. In addition, by using smaller volumes for elution of DNA or inhibitor-resistant DNA polymerase, qPCR could further be optimized for reliable detection at the proposed contamination levels. Namely, higher concentrations of inhibitors and lower DNA yield due to the incomplete recovery of the cells may occur in environmental samples and PCR inhibitors were also observed in broiler neck skin (Josefsen et al., 2010; Schnider et al., 2010). However, as in the present study inhibition was not observed in qPCR standards prepared with spiking the negative matrix, it is not expected in the naturally contaminated samples. Moreover, the employed DNA extraction kit is regularly used at our laboratory for bacterial DNA extraction from complex samples and was extensively tested and optimized to enable maximal removal of inhibitors. In addition, its performance was compared to one of the commercially favored extraction kits which are specially designed for demanding extractions and purifications of bacterial DNA from food samples, including special matrices with a high proportion of PCR inhibitors. Comparison showed that the kit which was employed in the present study led to significantly (p = 0.0153) higher C. jejuni counts observed in qPCR (Papić et al., 2016). The detection rate could be increased by adding the enrichment step; however, this impedes the enumeration of the pathogen. Although the inhibitors present in the sample are diluted in the enrichment step, the enrichment media itself may include PCR inhibitors (Josefsen et al., 2004).
Previously, Campylobacter spp. has been quantified in the poultry slaughterhouse water samples by the plate count method, droplet dPCR (ddPCR), and qPCR; both molecular-based methods outperformed the culture-based method commonly used in the testing of poultry processing water samples (Rothrock et al., 2013). Cremonesi et al. (2016) quantified the common foodborne pathogens including Campylobacter spp. in the soft cheese using ddPCR and qPCR, discovering higher sensitivity of ddPCR. In our study, inferior performance of dPCR could be explained by the high signal-to-noise ratio detected in negative controls. Similar results have also been observed previously (Bosman et al., 2015; Luedtke and Bosilevac, 2015). Other authors, however, reported that dPCR surpasses qPCR both in terms of precision and sensitivity (Strain et al., 2013; Taylor et al., 2015). Another advantage of dPCR is that it is generally less prone to PCR inhibition (Rački et al., 2014). In the present study, the quantification of low target samples was challenging due to false positive wells. Discrimination between false positive and true positive samples with dPCR proved difficult as WNTC and NTC negative controls all regularly showed up to 11 target copies/μl despite using a stringent and run-adapted fluorescence threshold. Therefore, samples may be classified as false positive; such samples might also explain the overestimation of observed concentration by dPCR in comparison to the plate count method and qPCR.
When the observed log10 CFU/reaction were plotted against the expected log10 CFU/reaction, an overestimation of observed cell counts was noted in dPCR. As the average log10 value for both NTC and WTNC was similar (0.48 and 0.56, respectively) to the y-intercept value of dPCR trend line (0.47) in Figure 2, this could explain the overestimation of dPCR observed vs. expected log10 CFU/reaction. The overestimation was observed over the entire 10-fold dilution range, which is not surprising as the obtained copy number/μl is multiplied by total DNA elution volume and sample dilution to get the final result, multiplying the false positive effect. The same phenomenon of dPCR overestimation was observed in the naturally contaminated samples as both Bland–Altman comparisons involving dPCR showed bias (Figures 4B,C). On the other hand, qPCR was generally concordant with the plate count method for the C. jejuni culture dilutions as the observed cell counts correlated with the expected cell counts. False positive samples can be observed both in chip-based dPCR and ddPCR, and might not always be identified based on the fluorescence data as they are often well-separated from the true negative events (Strain et al., 2013; Bosman et al., 2015). Signal-to-noise ratio could be further assessed analyzing a larger number of negative control samples. Also, low-target samples could be more reliably analyzed by running more parallels, increasing the DNA template volume or optimizing the dPCR assay (e.g., designing new primers and/or probes). However, due to the time requirement and relatively high reagent cost of chip-based dPCR, this would not be suitable for routine detection and quantification of C. jejuni in the food industry. When comparing costs of the three methods employed, the plate count method was found to be approx. twice as expensive as PCR-based methods, whereas dPCR and qPCR were comparable when regarding cost per sample. However, qPCR enables marked decrease of costs with higher throughput and quicker turnaround time, in addition to the possibility of decreasing the reaction volume.
The observed inter-method differences in the present study could be explained by different methodology and limitations of each method. All three quantification methods were generally interchangeable as shown by Blant–Altman analysis; however, they displayed a relatively high mean bias. This increase in variation was probably due to stochastic effects and sampling errors which occur in samples with low target concentration (i.e., naturally contaminated neck skin; Irwin et al., 2010). As mentioned above, in qPCR, we alleviated this effect by processing more replicates of one sample and excluding from the analysis all samples that were negative in at least one replicate or below rLOD. Such approach of analyzing more replicates could also be expanded to dPCR and plate count method; however, this would render the methods unsuitable for routine use due to significant time and financial investment.
Albeit time consuming, the plate count method is the gold standard for enumeration of Campylobacter spp. on broiler skin. However, not all cells can be recovered by conventional cultivation techniques due to special growth requirements and VBNC state. Another important limitation of the plate count method is the inability to distinguish between different species without additional identification steps. Even though C. jejuni is globally responsible for more than 85% of human infections and is the most frequently isolated species in poultry samples, other (non-jejuni) pathogenic campylobacters such as C. coli and C. lari should not be neglected (Shane, 2000; Jørgensen et al., 2002; Mason et al., 2013). Prevalence of C. coli was found to be as high as 40% of Campylobacter-positive neck-skin samples when quantifying C. jejuni and C. coli in broiler neck-skin samples using qPCR (Schnider et al., 2010) and co-infection with different C. jejuni strains or even with different Campylobacter species was also observed in human patients (Linton et al., 1997; Godschalk et al., 2006). Although, in our case, all isolates were identified as C. jejuni, a possibility of a mixed contamination cannot be ruled out. Generally, PCR-based quantification methods are more specific than plate counting.
Molecular methods for pathogen detection and quantification are quick, selective and precise; however, the inability to differentiate between viable and dead cells hampers their use in food industry. Another important limitation of pathogen quantification in naturally contaminated samples, such as broiler neck skin, is low concentration of target organisms which can impede reliable detection and quantification. When comparing two or more methods, this stochastic effect, leading to increased variation between replicates, impedes the assessment of inter-method agreement (Irwin et al., 2010). Furthermore, reproducible quantification of low abundance targets (<1,000 target copies/PCR) in complex samples by qPCR is difficult due to the inherent differences in the amplification efficiency between individual templates in the amplifying DNA population, known as the Monte Carlo effect (Karrer et al., 1995). This may also contribute to the occurrence of wells and droplets with intermediate fluorescence in dPCR and ddPCR, respectively (Dreo et al., 2014).
CFUs can be deceptive for quantification of the infection risk especially in the case of fastidious microorganisms such as campylobacters, since the stressed and VBNC cells probably also pose a health risk to consumers (Josefsen et al., 2010). New PCR-based strategies, collectively known as molecular viability analyses, promise to overcome this obstacle as they are able to differentiate nucleic acids associated with viable cells from those associated with inactivated cells (reviewed in Cangelosi and Meschke, 2014). Treatment of samples with ethidium monoazide (EMA) in combination with (q)PCR reportedly enables differentiation between live and dead campylobacters (Rudi et al., 2004, 2005). Josefsen et al. (2010) developed a qPCR assay in combination with prior propidium monoazide (PMA) sample treatment to differentiate between live and dead cells on chicken skin. However, efficiency of such viability PCR techniques depends on a complex set of parameters including experimental, target and sample features (Fittipaldi et al., 2012). This was confirmed by Pacholewicz et al. (2013), who reported that PMA treatment of the samples prior to qPCR did not fully reduce the signal from dead cells, possibly due to a high bacterial load in samples. Krüger et al. (2014) proposed the use of reliable quantification of intact and potentially infectious units (IPIU) of Campylobacter spp. for the assessment of infection risk using qPCR. For this purpose, the authors suggest implementation of a robust viability PCR that includes carefully chosen samples process control for each quantification setup (Krüger et al., 2014).
In conclusion, qPCR outperformed dPCR in quantification of C. jejuni in the poultry neck-skin samples and exhibited the LOQ of 31 CFU/reaction (12,523 CFU/g). However, none of the molecular-based methods enabled its reliable quantification at the proposed microbiological criteria of 500–1,000 CFU/g. This, at least according to results of the present study, renders the available molecular-based methods unsuitable for quantification of such samples and calls for the improvement of sample preparation steps and/or development of improved or novel analytical methods for direct Campylobacter enumeration in poultry samples. Optimization of molecular-based methods to the level at which they would enable reliable Campylobacter quantification in poultry samples with low contamination would substantially reduce both the time and cost requirements as well as facilitate Campylobacter surveillance throughout all stages in the food production chain.
Author Contributions
Design of the study: BP, UH, MP, IG, MB, MO, and DK; Sample collection: IG, UZ, and MO; Classical bacteriology: IG, UH, and MB; Molecular methods: BP, MP, UH, UZ, and DK; Data analysis: BP and DK; Manuscript preparation: BP, MP, IG, and DK. All authors read and approved the final manuscript.
Funding
This study was funded by the Slovenian Research Agency and the Ministry of Agriculture and Environment of the Republic of Slovenia (Grants V4-1110 and J4-7608).
Conflict of Interest Statement
The authors declare that the research was conducted in the absence of any commercial or financial relationships that could be construed as a potential conflict of interest.
Acknowledgments
The authors would like to thank the cooperating poultry processing plant for access to sample collection. Nataša Toplak PhD and Tibor Füle PhD are kindly acknowledged for their help and advice regarding dPCR.
References
Allos, B. M. (2001). Campylobacter jejuni infections: update on emerging issues and trends. Clin. Infect. Dis. 32, 1201–1206. doi: 10.1086/319760
Berdal, K. G., and Holst-Jensen, A. (2001). Roundup Ready® soybean event-specific real-time quantitative PCR assay and estimation of the practical detection and quantification limits in GMO analyses. Eur. Food Res. Technol. 213, 432–438. doi: 10.1007/s002170100403
Berrang, M. E., Buhr, R. J., Cason, J. A., and Dickens, J. A. (2001). Broiler carcass contamination with Campylobacter from feces during defeathering. J. Food Protoc. 64, 2063–2066. doi: 10.4315/0362-028X-64.12.2063
Bosman, K. J., Nijhuis, M., van Ham, P. M., Wensing, A. M. J., Vervisch, K., Vandekerckhove, L., et al. (2015). Comparison of digital PCR platforms and semi-nested qPCR as a tool to determine the size of the HIV reservoir. Sci. Rep. 5:13811. doi: 10.1038/srep13811
Botteldoorn, N., Van Coillie, E., Piessens, V., Rasschaert, G., Debruyne, L., Heyndrickx, M., et al. (2008). Quantification of Campylobacter spp. in chicken carcass rinse by real-time PCR. J. Appl. Microbiol. 105, 1909–1918. doi: 10.1111/j.1365-2672.2008.03943.x
Bustin, S. A., Benes, V., Garson, J. A., Hellemans, J., Huggett, J., Kubista, M., et al. (2009). The MIQE guidelines: minimum information for publication of quantitative real-time PCR experiments. Clin. Chem. 55, 611–622. doi: 10.1373/clinchem.2008.112797
Cangelosi, G. A., and Meschke, J. S. (2014). Dead or alive: molecular assessment of microbial viability. Appl. Environ. Microbiol. 80, 5884–5891. doi: 10.1128/AEM.01763-14
Corry, J. E. L., and Atabay, H. I. (2001). Poultry as a source of Campylobacter and related organisms. J. Appl. Microbiol. 90, 96S–114S. doi: 10.1046/j.1365-2672.2001.01358.x
Cremonesi, P., Cortimiglia, C., Picozzi, C., Minozzi, G., Malvisi, M., Luini, M., et al. (2016). Development of a droplet digital polymerase chain reaction for rapid and simultaneous identification of common foodborne pathogens in soft cheese. Front. Microbiol. 7:1725. doi: 10.3389/fmicb.2016.01725
Debretsion, A., Habtemariam, T., Wilson, S., Nganwa, D., and Yehualaeshet, T. (2007). Real-time PCR assay for rapid detection and quantification of Campylobacter jejuni on chicken rinses from poultry processing plant. Mol. Cell. Probes 21, 177–181. doi: 10.1016/j.mcp.2006.10.006
Dreo, T., Pirc, M., Ramšak, Ž., Pavšič, J., Milavec, M., Žel, J., et al. (2014). Optimising droplet digital PCR analysis approaches for detection and quantification of bacteria: a case study of fire blight and potato brown rot. Anal. Bioanal. Chem. 406, 6513–6528. doi: 10.1007/s00216-014-8084-1
European Food Safety Authority (EFSA) (2011). Panel on Biological Hazards (BIOHAZ). Scientific opinion on Campylobacter in broiler meat production: control options and performance objectives and/or targets at different stages of the food chain. EFSA J. 9:2105. doi: 10.2903/j.efsa.2011.2105
European Food Safety Authority (EFSA) (2015). The European Union summary report on trends and sources of zoonoses, zoonotic agents and food-borne outbreaks in 2014. EFSA J. 13:4329. doi: 10.2903/j.efsa.2015.4329
Fittipaldi, M., Nocker, A., and Codony, F. (2012). Progress in understanding preferential detection of live cells using viability dyes in combination with DNA amplification. J. Microbiol. Methods 91, 276–289. doi: 10.1016/j.mimet.2012.08.007
Garcia, A. B., Kamara, J. N., Vigre, H., Hoorfar, J., and Josefsen, M. H. (2013). Direct quantification of Campylobacter jejuni in chicken fecal samples using real-time PCR: evaluation of six rapid DNA extraction methods. Food Anal. Methods 6, 1728–1738. doi: 10.1007/s12161-013-9685-6
Godschalk, P. C., Gilbert, M., Jacobs, B. C., Kramers, T., Tio-Gillen, A. P., Ang, C. W., et al. (2006). Co-infection with two different Campylobacter jejuni strains in a patient with the Guillain–Barré syndrome. Microb. Infect. 8, 248–253. doi: 10.1016/j.micinf.2005.06.022
Huggett, J. F., Cowen, S., and Foy, C. A. (2015). Considerations for digital PCR as an accurate molecular diagnostic tool. Clin. Chem. 61, 79–88. doi: 10.1373/clinchem.2014.221366
International Organisation for Standardization (ISO) (2006a). ISO 10272-2:2006 – Microbiology of Food and Animal Feeding Stuffs – Horizontal Method for Detection and Enumeration of Campylobacter – Part 2: Colony-Count Technique. Geneva: ISO.
International Organisation for Standardization (ISO) (2006b). ISO 10272-1:2006 – Microbiology of Food and Animal Feeding Stuffs – Horizontal Method for Detection and Enumeration of Campylobacter – Part 1: Detection Method. Geneva: ISO.
Irwin, P. L., Nguyen, L. H. T., and Chen, C. Y. (2010). The relationship between purely stochastic sampling error and the number of technical replicates used to estimate concentration at an extreme dilution. Anal. Bioanal. Chem. 398, 895–903. doi: 10.1007/s00216-010-3967-2
Ivanova, M., Singh, R., Dharmasena, M., Gong, C., Krastanov, A., and Jiang, X. (2014). Rapid identification of Campylobacter jejuni from poultry carcasses and slaughtering environment samples by real-time PCR. Poultry Sci. 93, 1587–1597. doi: 10.3382/ps.2013-03736
Jørgensen, F., Bailey, R., Williams, S., Henderson, P., Wareing, D. R. A., Bolton, F. J., et al. (2002). Prevalence and numbers of Salmonella and Campylobacter spp. on raw, whole chickens in relation to sampling methods. Int. J. Food Microbiol. 76, 151–164. doi: 10.1016/S0168-1605(02)00027-2
Josefsen, M. H., Löfström, C., Hansen, T. B., Christensen, L. S., Olsen, J. E., and Hoorfar, J. (2010). Rapid quantification of viable Campylobacter bacteria on chicken carcasses, using real-time PCR and propidium monoazide treatment, as a tool for quantitative risk assessment. Appl. Environ. Microbiol. 76, 5097–5104. doi: 10.1128/AEM.00411-10
Josefsen, M. H., Lübeck, P. S., Hansen, F., and Hoorfar, J. (2004). Towards an international standard for PCR-based detection of foodborne thermotolerant campylobacters: interaction of enrichment media and pre-PCR treatment on carcass rinse samples. J. Microbiol. Methods 58, 39–48. doi: 10.1016/j.mimet.2004.03.001
Karrer, E. E., Lincoln, J. E., Hogenhout, S., Bennett, A. B., Bostock, R. M., Martineau, B., et al. (1995). In situ isolation of mRNA from individual plant cells: creation of cell-specific cDNA libraries. Proc. Natl. Acad. Sci. U.S.A. 92, 3814–3818. doi: 10.1073/pnas.92.9.3814
Krüger, N. J., Buhler, C., Iwobi, A. N., Huber, I., Ellerbroek, L., Appel, B., et al. (2014). Limits of control – crucial parameters for a reliable quantification of viable Campylobacter by real-time PCR. PLOS ONE 9:2:e88108. doi: 10.1371/journal.pone.0088108
Kušar, D., Vrezec, A., Ocepek, M., and Jenčič, V. (2013). Aphanomyces astaci in wild crayfish populations in Slovenia: first report of persistent infection in a stone crayfish Austropotamobius torrentium population. Dis. Aquat. Organ. 103, 157–169. doi: 10.3354/dao02567
Linton, D., Lawson, A. J., Owen, R. J., and Stanley, J. (1997). PCR detection, identification to species level, and fingerprinting of Campylobacter jejuni and Campylobacter coli direct from diarrheic samples. J. Clin. Microbiol. 35, 2568–2572.
Logar, K., Kopinč, R., Bandelj, P., Starič, J., Lapanje, A., and Ocepek, M. (2012). Evaluation of combined high-efficiency DNA extraction and real-time PCR for detection of Mycobacterium avium subsp. paratuberculosis in subclinically infected dairy cattle: comparison with faecal culture, milk real-time PCR and milk ELISA. BMC Vet. Res. 8:49. doi: 10.1186/1746-6148-8-49
Luedtke, B. E., and Bosilevac, J. M. (2015). Comparison of methods for the enumeration of enterohemorrhagic Escherichia coli from veal hides and carcasses. Front. Microbiol. 6:1062. doi: 10.3389/fmicb.2015.01062
Mason, J., Iturriza-Gomara, M., O'Brien, S. J., Ngwira, B. M., Dove, W., Maiden, M. C., et al. (2013). Campylobacter infection in children in Malawi is common and is frequently associated with enteric virus co-infections. PLOS ONE 8:e59663. doi: 10.1371/journal.pone.0059663
Mehle, N., Nikoli, P., Gruden, K., Ravnikar, M., and Dermastia, M. (2012). “Real-time PCR for specific detection of three phytoplasmas from the apple proliferation group,” in Phytoplasma: Methods and Protocols. Methods in Molecular Biology, Vol. 938, eds M. Dickinson and J. Hodgetts (New York, NY: Humana Press), 269–281.
Melero, B., Cocolin, L., Rantsiou, K., Jaime, I., and Rovira, J. (2011). Comparison between conventional and qPCR methods for enumerating Campylobacter jejuni in a poultry processing plant. Food Microbiol. 28, 1353–1358. doi: 10.1016/j.fm.2011.06.006
Nocker, A., and Camper, A. K. (2006). Selective removal of DNA from dead cells of mixed bacterial communities by use of ethidium monoazide. Appl. Environ. Microbiol. 72, 1997–2004. doi: 10.1128/AEM.72.3.1997-2004.2006
Normand, V., Boulianne, M., and Quessy, S. (2008). Evidence of cross-contamination by Campylobacter spp. of broiler carcasses using genetic characterization of isolates. Can. J. Vet. Res. 72, 396–402. Available online at: https://www.ncbi.nlm.nih.gov/pmc/articles/PMC2568043/pdf/cjvr-05-396.pdf
Pacholewicz, E., Swart, A., Lipman, L. J. A., Wagenaar, J. A., Havelaar, A. H., and Duim, B. (2013). Propidium monoazide does not fully inhibit the detection of dead Campylobacter on broiler chicken carcasses by qPCR. J. Microbiol. Methods 95, 32–38. doi: 10.1016/j.mimet.2013.06.003
Papić, B., Pate, M., Henigman, U., Zajc, U., Gruntar, I., Biasizzo, M., et al. (2016). “Enumeration of Campylobacter jejuni in poultry and slaughterhouse samples using plate count method, dPCR and qPCR,” in The 4th Digital PCR & qPCR Congress: 20–21 October 2016. London: Global Engage.
Rački, N., Morisset, D., Gutierrez-Aguirre, I., and Ravnikar, M. (2014). One-step RT-droplet digital PCR: a breakthrough in the quantification of waterborne RNA viruses. Anal. Bioanal. Chem. 406, 661–667. doi: 10.1007/s00216-013-7476-y
Rothrock, M. J. Jr., Hiett, K. L., Kiepper, B. H., Ingram, K., and Hinton, A. (2013). Quantification of zoonotic bacterial pathogens within commercial poultry processing water samples using droplet digital PCR. Adv. Microbiol. 3, 403–411. doi: 10.4236/aim.2013.35055
Rudi, K., Høidal, H. K., Katla, T., Johansen, B. K., Nordal, J., and Jakobsen, K. S. (2004). Direct real-time PCR quantification of Campylobacter jejuni in chicken fecal and cecal samples by integrated cell concentration and DNA purification. Appl. Environ. Microbiol. 70, 790–797. doi: 10.1128/AEM.70.2.790-797.2004
Rudi, K., Moen, B., Drømtorp, S. M., and Holck, A. L. (2005). Use of ethidium monoazide and PCR in combination for quantification of viable and dead cells in complex samples. Appl. Environ. Microbiol. 71, 1018–1024. doi: 10.1128/AEM.71.2.1018-1024.2005
Schnider, A., Overesch, G., Korczak, B. M., and Kuhnert, P. (2010). Comparison of real-time PCR assays for detection, quantification, and differentiation of Campylobacter jejuni and Campylobacter coli in broiler neck skin samples. J. Food Protoc. 73, 1057–1063. doi: 10.4315/0362-028X-73.6.1057
Shane, S. M. (2000). Campylobacter infection of commercial poultry. Rev. Sci. Tech. Off. Int. Epiz. 19, 376–395. doi: 10.20506/rst.19.2.1224
Strain, M. C., Lada, S. M., Luong, T., Rought, S. E., Gianella, S., Terry, V. H., et al. (2013). Highly precise measurement of HIV DNA by droplet digital PCR. PLOS ONE 8:e55943. doi: 10.1371/journal.pone.0055943
Taylor, S. C., Carbonneau, J., Shelton, D. N., and Boivin, G. (2015). Optimization of droplet digital PCR from RNA and DNA extracts with direct comparison to RT-qPCR: clinical implications for quantification of oseltamivir-resistant subpopulations. J. Virol. Methods 224:58–66. doi: 10.1016/j.jviromet.2015.08.014
Thomas, C., Hill, D., and Mabey, M. (2002). Culturability, injury and morphological dynamics of thermophilic Campylobacter spp. within a laboratory-based aquatic model system. J. Appl. Microbiol. 92, 433–442. doi: 10.1046/j.1365-2672.2002.01550.x
Toplak, N., Kovač, M., Piskernik, S., Možina, S. S., and Jeršek, B. (2012). Detection and quantification of Campylobacter jejuni and Campylobacter coli using real-time multiplex PCR. J. Appl. Microbiol. 112, 752–764. doi: 10.1111/j.1365-2672.2012.05235.x
Vaerman, J. L., Saussoy, P., and Ingargiola, I. (2004). Evaluation of real-time PCR data. J. Biol. Regul. Homeost. Agents 18, 212–214. Available online at: http://www.qpcrupdate.org/vaerman-qpcr-data-analysis-2006.pdf
Keywords: Campylobacter jejuni, poultry, quantification, plate counting, qPCR, dPCR
Citation: Papić B, Pate M, Henigman U, Zajc U, Gruntar I, Biasizzo M, Ocepek M and Kušar D (2017) New Approaches on Quantification of Campylobacter jejuni in Poultry Samples: The Use of Digital PCR and Real-time PCR against the ISO Standard Plate Count Method. Front. Microbiol. 8:331. doi: 10.3389/fmicb.2017.00331
Received: 07 October 2016; Accepted: 17 February 2017;
Published: 02 March 2017.
Edited by:
Petr Kralik, Veterinary Research Institute, IndiaReviewed by:
Braulio Esteve-Zarzoso, Universidad Rovira i Virgili, SpainMehrdad Mark Tajkarimi, University of North Carolina at Greensboro, USA
Copyright © 2017 Papić, Pate, Henigman, Zajc, Gruntar, Biasizzo, Ocepek and Kušar. This is an open-access article distributed under the terms of the Creative Commons Attribution License (CC BY). The use, distribution or reproduction in other forums is permitted, provided the original author(s) or licensor are credited and that the original publication in this journal is cited, in accordance with accepted academic practice. No use, distribution or reproduction is permitted which does not comply with these terms.
*Correspondence: Darja Kušar, darja.kusar@vf.uni-lj.si