 Illiassou Hamidou Soumana1Bernadette Tchicaya1Stéphanie Rialle2,3,4,5
 Hugues Parrinello2,3,4,5
 Anne Geiger1*
- 1UMR 177, Institut de Recherche pour le Développement-CIRAD, CIRAD TA A-17/G, Montpellier, France
- 2Centre National de la Recherche Scientifique Unité Mixte de Recherche 5203, Institut de Génomique Fonctionnelle, Montpellier, France
- 3Institut National de la Santé Et de la Recherche Médicale U661, Montpellier, France
- 4Universités de Montpellier 1 and 2, UMR 5203, Montpellier, France
- 5Montpellier GenomiX, c/o Institut de Génomique Fonctionnelle, Montpellier, France
Blood-feeding Glossina palpalis gambiense (Gpg) fly transmits the single-celled eukaryotic parasite Trypanosoma brucei gambiense (Tbg), the second Glossina fly African trypanosome pair being Glossina morsitans/T.brucei rhodesiense. Whatever the T. brucei subspecies, whereas the onset of their developmental program in the zoo-anthropophilic blood feeding flies does unfold in the fly midgut, its completion is taking place in the fly salivary gland where does emerge a low size metacyclic trypomastigote population displaying features that account for its establishment in mammals-human individuals included. Considering that the two Glossina—T. brucei pairs introduced above share similarity with respect to the developmental program of this African parasite, we were curious to map on the Glossina morsitans morsitans (Gmm), the Differentially Expressed Genes (DEGs) we listed in a previous study. Briefly, using the gut samples collected at days 3, 10, and 20 from Gpg that were fed or not at day 0 on Tbg—hosting mice, these DGE lists were obtained from RNA seq—based approaches. Here, post the mapping on the quality controlled DEGs on the Gmm genome, the identified ortholog genes were further annotated, the resulting datasets being compared. Around 50% of the Gpg DEGs were shown to have orthologs in the Gmm genome. Under one of the three Glossina midgut sampling conditions, the number of DEGs was even higher when mapping on the Gmm genome than initially recorded. Many Gmm genes annotated as “Hypothetical” were mapped and annotated on many distinct databases allowing some of them to be properly identified. We identify Glossina fly candidate genes encoding (a) a broad panel of proteases as well as (b) chitin—binding proteins, (c) antimicrobial peptide production—Pro3 protein, transferrin, mucin, atttacin, cecropin, etc—to further select in functional studies, the objectives being to probe and validated fly genome manipulation that prevents the onset of the developmental program of one or the other T. brucei spp. stumpy form sampled by one of the other bloodfeeding Glossina subspecies.
Introduction
Trypanosomes causing either Human African Trypanosomiasis (HAT, i.e., sleeping sickness) or Animal African Trypanosomiasis (AAT, i.e., Nagana) are transmitted by Glossina spp. (tsetse flies). These hematophagous flies acquire their parasite during a blood meal on an infected host, and transmit the mature form of the parasite to another host during a subsequent blood meal. Two forms of HAT have been reported: a chronic and an acute form (Hoare, 1972; Aksoy et al., 2014; Beschin et al., 2014). The chronic form, spread throughout 24 sub-Saharan countries of West Africa, is caused by Trypanosoma brucei gambiense (Tbg) and is transmitted by Glossina palpalis; this form represents over 90% of all sleeping sickness cases (Welburn et al., 2009). The acute form, endemic to 12 East African countries, is caused by Trypanosoma brucei rhodesiense (Tbr), and is transmitted by Glossina morsitans morsitans (Gmm). Currently the disease persists in sub-Saharan countries (Louis et al., 2002), where more than 60 million people are exposed to the trypanosomiasis risk. Progress in deciphering the mechanisms of host-parasite interactions involves identifying the genes encoding the factors that govern tsetse fly vector competence (Vickerman et al., 1988; Maudlin and Welburn, 1994; Van den Abbeele et al., 1999), which may promote the development of anti-vector strategies that are alternative or complementary to current strategies.
Using a microarray approach, we recently investigated the effect of trypanosome ingestion by G. palpalis gambiensis (Gpg) flies on the transcriptome signatures of Sodalis glossinidius (Farikou et al., 2010; Hamidou Soumana et al., 2014a) and Wigglesworthia glossinidia (Hamidou Soumana et al., 2014b), two symbionts of tsetse flies (Aksoy et al., 2014). The aim of this previous work was to identify the genes that are differentially expressed in trypanosome infected vs. non-infected or self-cured (refractory) flies and that, consequently, can be suspected to positively or negatively control fly infection. Similarly, using the RNA-seq de novo assembly approach, we investigated the differential expression of G. p. gambiensis genes in flies challenged or not with trypanosomes (Hamidou Soumana et al., 2015). Furthermore, transcriptome profiling of T. b. brucei development in Gmm has recently been reported (Savage et al., 2016).
Since the acute form of HAT is caused by the Gmm/Tbr vector/parasite “couple,” the identification of molecular targets common to both Gpg and Gmm (i.e., orthologous genes) deserves further consideration. Indeed, identification of these targets would allow the development of common approaches to fight both forms of HAT. As Gpg and Gmm are two separate Glossina species, their genomes should display some differences between each other. Furthermore, the Gmm genome and the sequences of the Gpg RNA-seq de novo assembled genes have been annotated with reference to two distinct database sets: the first set comprises Drosophila melanogaster, Aedes aegypti, Anopheles gambiae, Culex quinquefasciatus, and Phlebotomus papatasi (International Glossina Genome Initiative, 2014), whereas the second set comprises Ceratitis capitata, Drosophila melanogaster, D. willistoni, D. virilis, D. mojavensis, Acyrthosiphon pisum, Hydra magnipapillata, Anopheles sp., Bombyx sp., Aedes sp., and Glossina morsitans (data that were available before the publication of the whole genome sequence; Hamidou Soumana et al., 2015). This indicates that only the D. melanogaster database was common to the two database sets used to annotate the differentially expressed Gpg genes and the Gmm genome, respectively. Thus, for the present study, it was necessary to map the sequences of the Gpg RNA-seq de novo assembled genes on the Gmm genome and annotate them on the corresponding database. This has been achieved, and the Gpg genes that were previously shown to be differentially expressed (i.e., stimulated vs. non-stimulated flies, and infected vs. non-infected flies; Hamidou Soumana et al., 2015) were annotated on the Gmm database. Finally, the data resulting from the best hits annotation, which provide a translation product for each gene (and thus its potential biological function and physiological role), were compared with data resulting from the previous annotation of the same genes on the set of above-mentioned databases. The overall results provide a data platform that can be applied for further identification of candidate genes involved in the vector competence of both fly species. Importantly, these data could represent promising targets in the development of new anti-vector strategies in the fight against the chronic or acute forms of sleeping sickness.
Materials and Methods
Ethical Statement
All animal experiments in this report were conducted according to internationally recognized guidelines. The experimental protocols were approved by the Ethics Committee on Animal Experiments and the Veterinary Department of the Centre International de Recherche Agronomique pour le Développement (CIRAD; Montpellier, France).
Sample Processing, RNA-Seq Library Preparation, and Sequencing
Samples for this study were previously used to identify the differentially expressed genes (DEGs) in Gpg. The different steps are described in the corresponding report (Hamidou Soumana et al., 2015), as well as pro parte in reports related to the differential expression of S. glossinidius and W. glossinidia genes (Hamidou Soumana et al., 2014a,b). Sample processing is summarized in Figure 1.
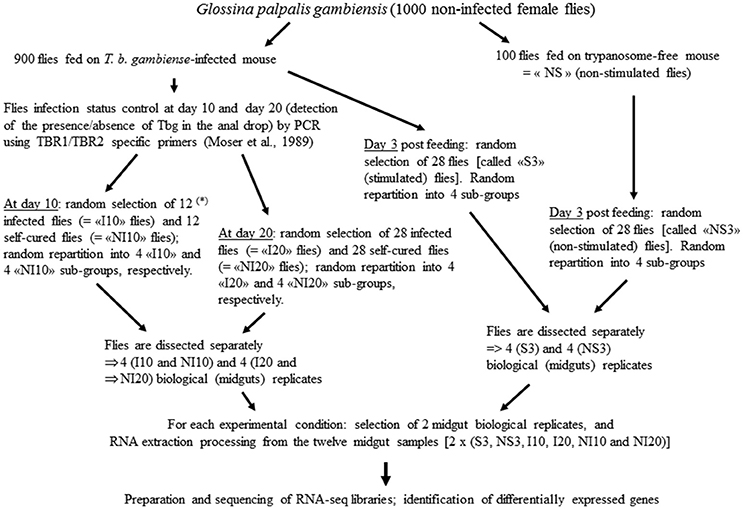
Figure 1. Samples processing. (*) at day 10 the rate of infected flies was law, thus only 12 infected flies (“I10”) could be sampled (instead of 28 at day 20). Self-cured flies are flies that have ingested trypanosomes (while they have taken a blood meal on an infected mouse), but the anal drops of which were trypanosome negative.
Preparation and Sequencing of the RNA-Seq Libraries
The sequential steps consisted of: RNA extraction from the pooled midguts of each biological replicate, resuspension of RNA pellets in nuclease-free water, concentration, RNA quantification, and quality control (to confirm the absence of any DNA contamination).
Generation of RNA-Seq Libraries
RNA-seq libraries were generated using the Illumina TruSeq™ RNA Sample Preparation Kit (Illumina; San Diego, USA). The sequential steps consisted of: mRNA purification from 4 μg total RNA using poly-T oligo-linked magnetic beads; fragmentation of RNA using divalent cations under elevated temperature (Illumina fragmentation buffer); first-strand cDNA synthesis using random oligonucleotides and SuperScript II; second-strand cDNA synthesis using DNA Polymerase I and RNase H; conversion of remaining overhangs into blunt ends via exonuclease/polymerase activities and enzyme removal; and adenylation of 3′ ends of cDNA fragments, with ligation of Illumina PE adapter oligonucleotides for further hybridization. Finally, cDNA fragments were selected (preferably 200 bp in length) in which fragments with ligated adaptor molecules on both ends were selectively enriched using Illumina PCR Primer Cocktail, and the products were purified and quantified using the Agilent DNA assay on the Agilent Bioanalyzer 2100 system.
Brief Summary of the Pipeline for Generating Quality-Controlled Reads
A total of 12 RNA-seq libraries were prepared, sequenced, and compared, including two biological replicates for each of the NS3, S3, I10, NI10, I20, and I20 samples. Clustering of the index-coded samples was performed on a cBot Cluster Generation System using TruSeq PE Cluster Kit-cBot-HS (Illumina). After cluster generation, the library preparations were sequenced on an Illumina Hiseq 2000 platform, and 100-bp paired-end reads were generated. Image analyses and base calling were performed using the Illumina HiSeq Control Software and Real-Time Analysis component. Demultiplexing was performed using CASAVA 1.8.2. The quality of the raw data was assessed using FastQC (Babraham Institute) and the Illumina software SAV (Sequencing Analysis Viewer). Raw sequencing reads from this study were exported in the FASTQ format and were deposited at the NCBI Short Read Archive (SRA) with the accession number SRP046074; aligned BAM files are available on request.
Identification of DEGs Once the Reads Generated from the 12 Gpg Fly Gut RNA Seq Libraries Were Mapped and Annotated on a Panel of Non-insect and Insect Genome Databases, One of Them Being Gmm
The RNA-seq reads that satisfied the quality control (i.e., removal of ambiguous nucleotides, low-quality sequences with quality scores <20, and sequences <15 bp in length) were mapped on the G. m. morsitans genome (13,807 scaffolds; International Glossina Genome Initiative, 2014) from VectorBase (www.vectorbase.org) and GenBank (accession no. CCAG010000000). This was achieved via the splice junction mapper TopHat 2.0.13 (Kim et al., 2013) using Bowtie 2.1.0 (Langmead and Salzberg, 2012), to align RNA-seq reads to the Glossina morsitans genome (GmorY1 assembly, release date: January 2014). Final read alignments with more than 12 mismatches were discarded.
Gene counting (number of reads aligned on each gene) was performed before statistical analysis, using HTSeq count 0.5.3p9 (union mode; Anders et al., 2014). Genes with <10 reads (cumulating all analyzed samples) were filtered and removed. We used the Bioconductor (Gentleman et al., 2004) software package EdgeR (Robinson et al., 2010) 3.6.7. to identify genes displaying a modified expression profile as a result of fly infection by trypanosomes. Data were normalized using the upper quartile normalization factors, using the quartiles method (Bullard et al., 2010). Genes with an adjusted p < 5% according to the False Discovery Rate (FDR) method from Benjamini and Hochberg (1995) were declared differentially expressed.
Bio Informatics-Based Approaches Aimed to Identify Molecular DEGs in Both Gmm and Gpg Once the Latter are Subverted as T. brucei spp Hosts Per se
Tsetse fly gene orthologs were tentatively identified using BLAST searches (Mount, 2007) with annotation against the NCBI non-redundant (Nr) sequence database, using an E-value cut-off of 10−5 (E < 0.00001), according to the best hits against known sequences. This was performed to retrieve orthologous genes with the highest sequence similarity to the given unigenes along with putative functional annotations. The official gene symbols of tsetse fly gene orthologs were used for functional annotation. Along with Nr annotations, the “Database for Annotation, Visualization and Integrated Discovery” (DAVID; Dennis et al., 2003) was used to obtain GO annotations of unigenes. The KEGG pathway annotations of tsetse fly gene orthologs were performed using the BLASTX software against the KEGG database (Wixon and Kell, 2000).
Analyzing the two annotation processes of the Gpg DEGs consisted in comparing the list of the “best hits” resulting from the Gpg DEG annotation on the Gmm database with the list resulting from the Gpg DEG annotation previously performed on a set of other databases (Ceratitis capitata, Drosophila melanogaster, D. willistoni, D. virilis, D. mojavensis, Acyrthosiphon pisum, Hydra magnipapillata, Anopheles sp., Bombyx sp., Aedes sp., and Glossina morsitans; Hamidou Soumana et al., 2015). The first step consisted in mixing the DEGs identified at the three experimental times (3, 10, and 20 days) and removing the duplicates, so as to take into account all recorded DEGs except for one of each. The second step consisted in removing the DEGs in which the annotation (best hit) resulted in “hypothetical” or “uncharacterized” proteins, as well as those identified with a numerical identifier, in order to only consider identified and named proteins. Finally, the names of the proteins (best hits) were standardized and alphabetically classified. This process was performed separately for the DEGs annotated with reference to the Gmm database, as well as those previously annotated on the above-characterized set of other databases. The two final listings were then combined (Microsoft Excel software), and their content was arranged according to the alphabetical order of protein names. This procedure facilitated the detection of the best hits that are common to both annotation processes and their corresponding genes.
Results
Mapping of PolyA+ mRNA
A total of 459,555,846 clusters were generated from the 12 RNA-seq libraries. Quality controls were performed to ensure the reliability of the libraries after removal of ambiguous nucleotides, low-quality sequences (quality scores < 20), and sequences <15 bp in length. Finally, 436,979,101 clean clusters were obtained (Table 1). Clean reads had Phred-like quality scores at the Q20 level (i.e., a sequencing error probability of 0.01). These clean sequenced reads with no strand-specificity were mapped to the Gmm reference genome using TopHat (with Bowtie 2) software in order to identify exon-exon splice junctions and to ensure enough sensitivity in mapping reads with polymorphisms.
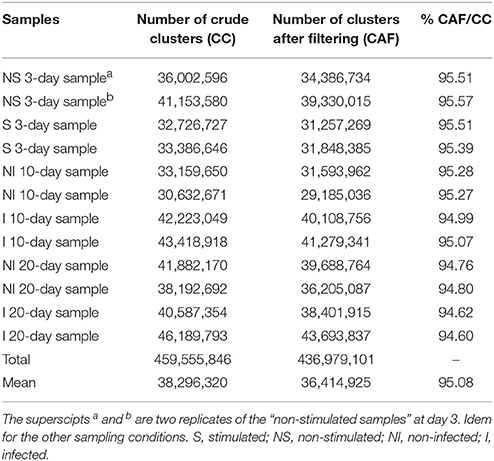
Table 1. Assembly quality of Gpg libraries at the three different sampling times.
Filtering and removing any genes with <10 mapped reads allowed mapping 8,286 (stimulated vs. non-stimulated flies; 3 days), 8,032 (infected vs. refractory flies; 10 days) and 8,101 Gpg genes (infected vs. refractory flies; 20 days) on the Gmm reference genome (International Glossina Genome Initiative, 2014). Further, analyses to reveal differential expression (DE) were performed using the bioinformatics tools HTseq and EdgeR from Bioconductor (http://www.bioconductor.org/), which use the R statistical programming language and are widely accepted for modeling the inherent variation between biological replicates. Figure 2 presents the log2 fold-change (stimulated vs. non-stimulated flies at day-3 post-infected blood meal) against the log2 of the reads concentration (log-counts-per-million) for each gene after normalization. The generated cloud shows a log fold-change centered on 0 (ordinate axis), signifying that the libraries are properly normalized. Genes that are differentially expressed between the S and NS samples (p < 0.05) are represented in red. Similar results were obtained for the other experimental conditions.
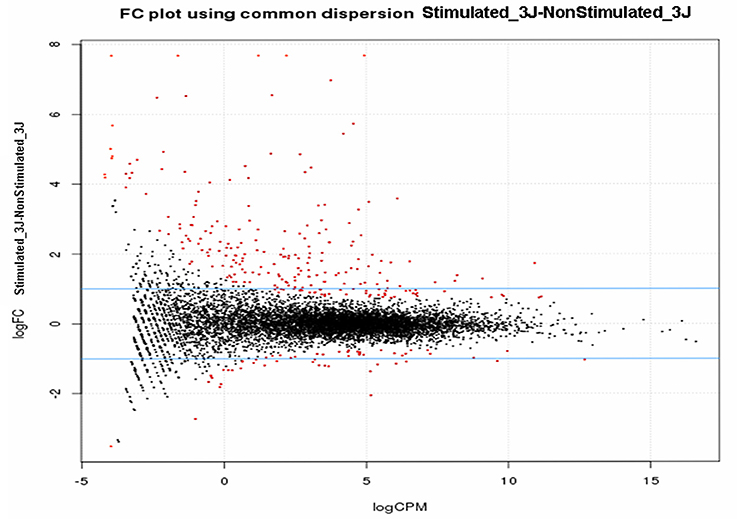
Figure 2. Smear plot of libraries. Samples are from trypanosome stimulated-/-non-stimulated tsetse fly midguts sampled 3 days post-infected blood meal, after normalization using the upper quartile method.
Identification of DEGs and Functional Annotation
The EdgeR method identified a total of 284, 139, and 59 Gmm genes corresponding respectively to the Gpg DEG samples S3 vs. NS3 (Supplementary Table S1), I10 vs. NI10 (Supplementary Table S2), and I20 vs. NI20 (Supplementary Table S3), at a p < 0.05. Most of these genes were overexpressed regardless of the experimental condition. Specifically, there were 229 out of 284 genes (80.6%) in the day-3 samples (S3 vs. NS3), 119 out of 139 genes (85.6%) in I-10 vs. NI-10 samples, and 37 out of 59 genes (62.7%) in I20 vs. NI20. Furthermore, the number of DEGs were highly differentially overexpressed (log2 FC > 2) or underexpressed (log2 FC < –2). Specifically, there were 97 out of 284 DEGs (34%; S3 vs. NS3), 60 out of 139 DEGs (43%; I10 vs. NI10), and 19 out of 59 DEGs (32%; I20 vs. NI20). These data are summarized in Table 2. Genes exhibiting a highly differential overexpression or underexpression under the different experimental conditions (i.e., S vs. NS, I10 vs. NI10, and I20 vs. NI20) are grouped together in Table 3. Most DEGs encode a wide range of proteases, although 91 DEGs presented in Supplementary Tables S1–S3 could not be properly annotated (i.e., best hit description = “hypothetical”), signifying that the panel of databases used for the annotation process should be enlarged or that the genes may be specific to the Gmm genome. In addition, several of the DEGs were very highly overexpressed. For example the log2 FC of GMOY009756, which encodes a trypsin, had a fold-change of 7.14 in S3 vs. NS3 samples, and GMOY002278, which encodes the proteinase inhibitor I2, had a fold-change of 9.47 in I10 vs. NI10. In contrast, some DEGs were underexpressed: the log2 FC of GMOY005345, which encodes an aspartic peptidase, had a fold-change of –6.51 in I20 vs. NI20 samples. Table 3 is presented so as to facilitate comparison of differential expression levels for a given gene along the three sampling times. For instance, the levels (in log2 FC) of GMOY005345, which encodes an aspartic peptidase, are 3.39 (S3 vs. NS3), 2.70 (I10 vs. NI10), and –6.51 (I20 vs. NI20).
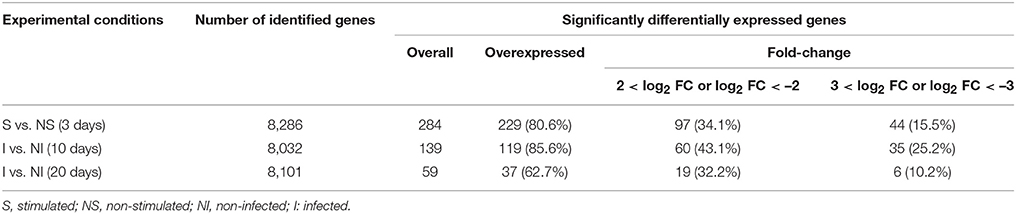
Table 2. Number of differentially expressed genes in Gpg.
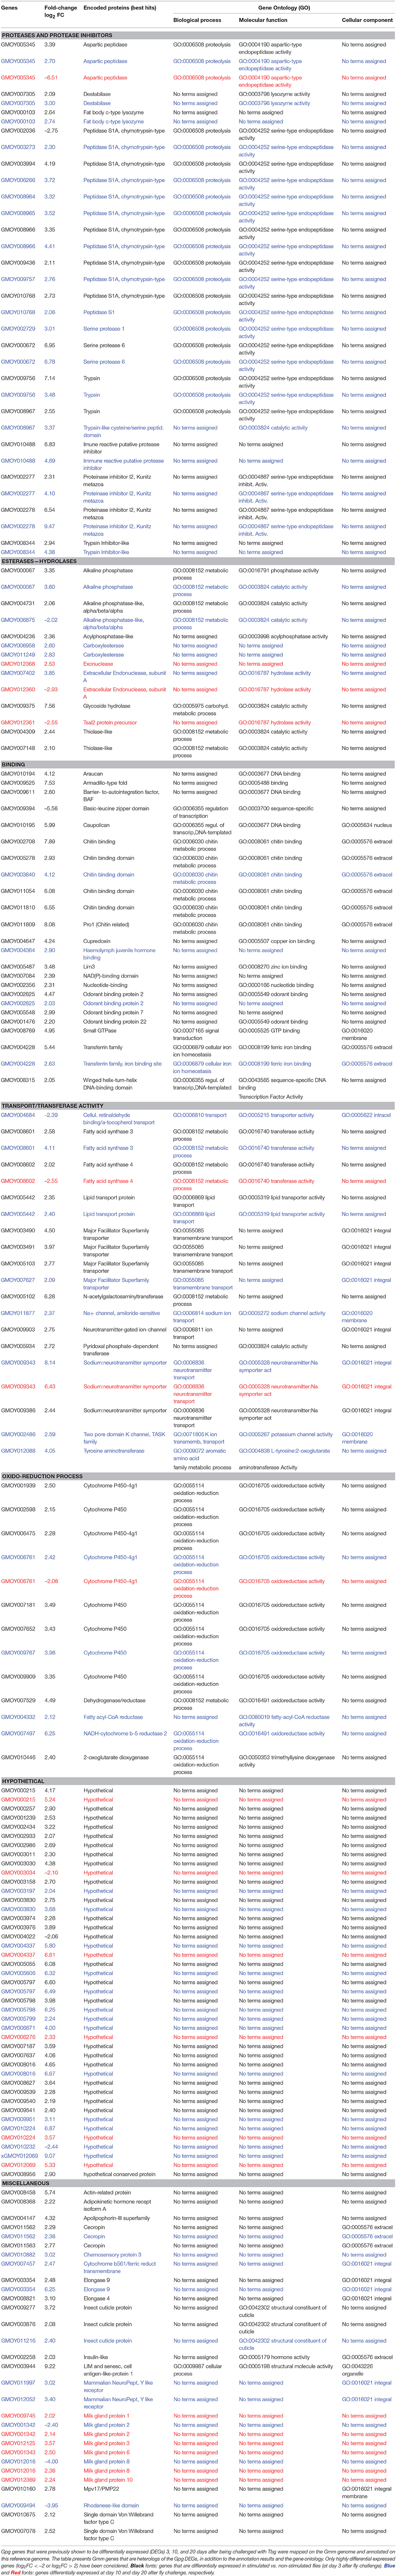
Table 3. Annotation on the Glossina morsitans morsitans genome of Gpg genes differentially expressed in response to Tbg infection.
Table 3 also provides the functional annotation data for each gene at each sampling time. To obtain an overview of the functional groups and categories, we used the GO assignment to classify the functions of the unigenes. According to this process the genes expressed at high levels were classified into three GO groups (Figure 3) and further subdivided into categories: biological process (14 categories), molecular functions (22 categories), and cellular component (6 categories). The category “No terms assigned” was predominant across all GO groups at any investigated time.
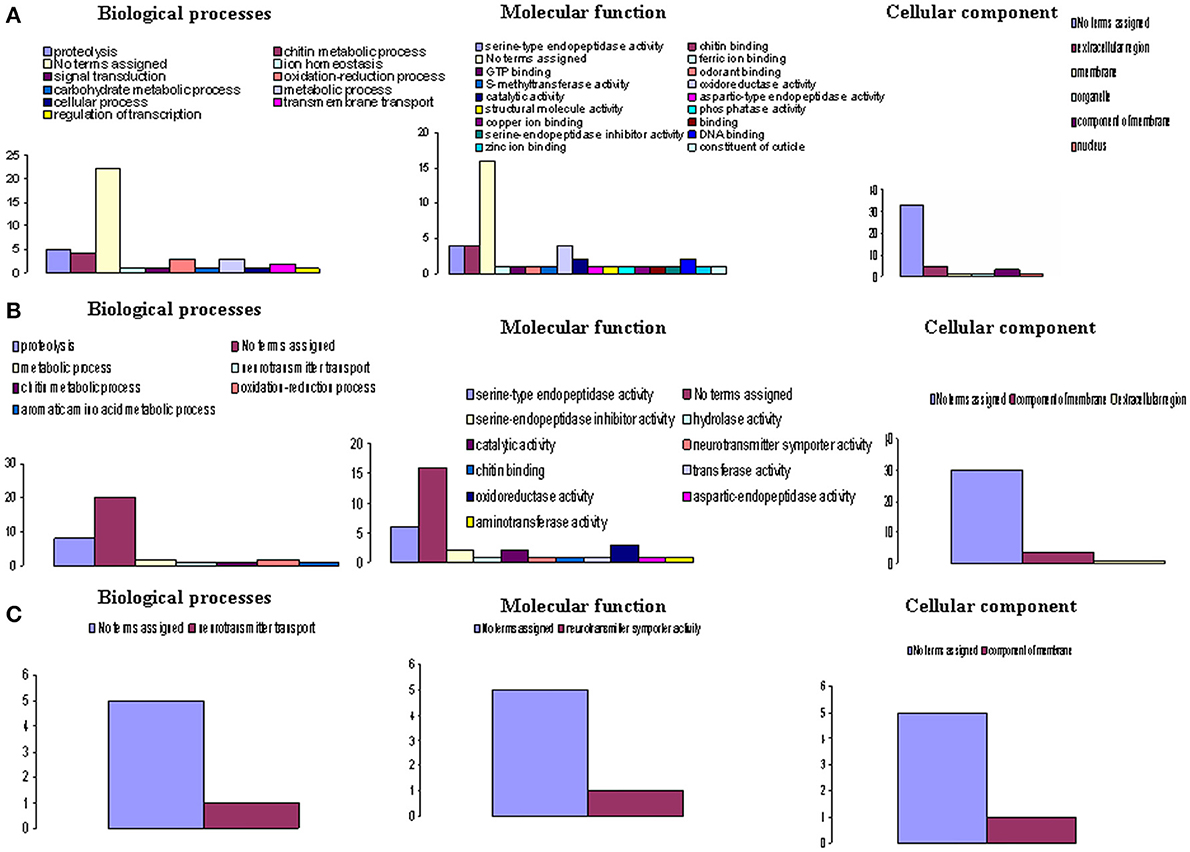
Figure 3. Functional classes of Gmm genes heterologous to highly differentially expressed Gpg genes. Highly differentially expressed genes (log2 FC > +3 or log2 FC < –3) were observed in (A). Tbg stimulated vs. non-stimulated Gpg flies (day-3 sampling); (B) Tbg infected vs. non-infected Gpg flies (day-10 sampling); and (C) Tbg infected vs. non-infected Gpg flies (day-20 sampling). The X-axis designates the Gene Ontology (GO) category, while the Y-axis provides the number of genes in each GO category.
Comparing Gpg Gene Annotation on the Gmm Genome and on a Previously Used Panel of Genomes
The global and detailed results of this comparative approach are presented in Supplementary Table S4. Table 4, which is a refined list of Supplementary Table S4, focuses on the expression of Gmm genes that are similar to Gpg genes previously identified as differentially expressed in response to Tbg infection. The results indicate that a high number of Gpg DEGs have orthologs in the Gmm genome. Furthermore, a large number of Gpg (22) and Gmm genes (23) encoding serine proteases were idenetified. Similarly, nine Gpg and nine Gmm genes were identified as encoding chitin binding proteins. Finally, whereas 14 Gmm genes encoding a “Major Facilitator Superfamily transporter” were identified, only one such gene was characterized in Gpg.
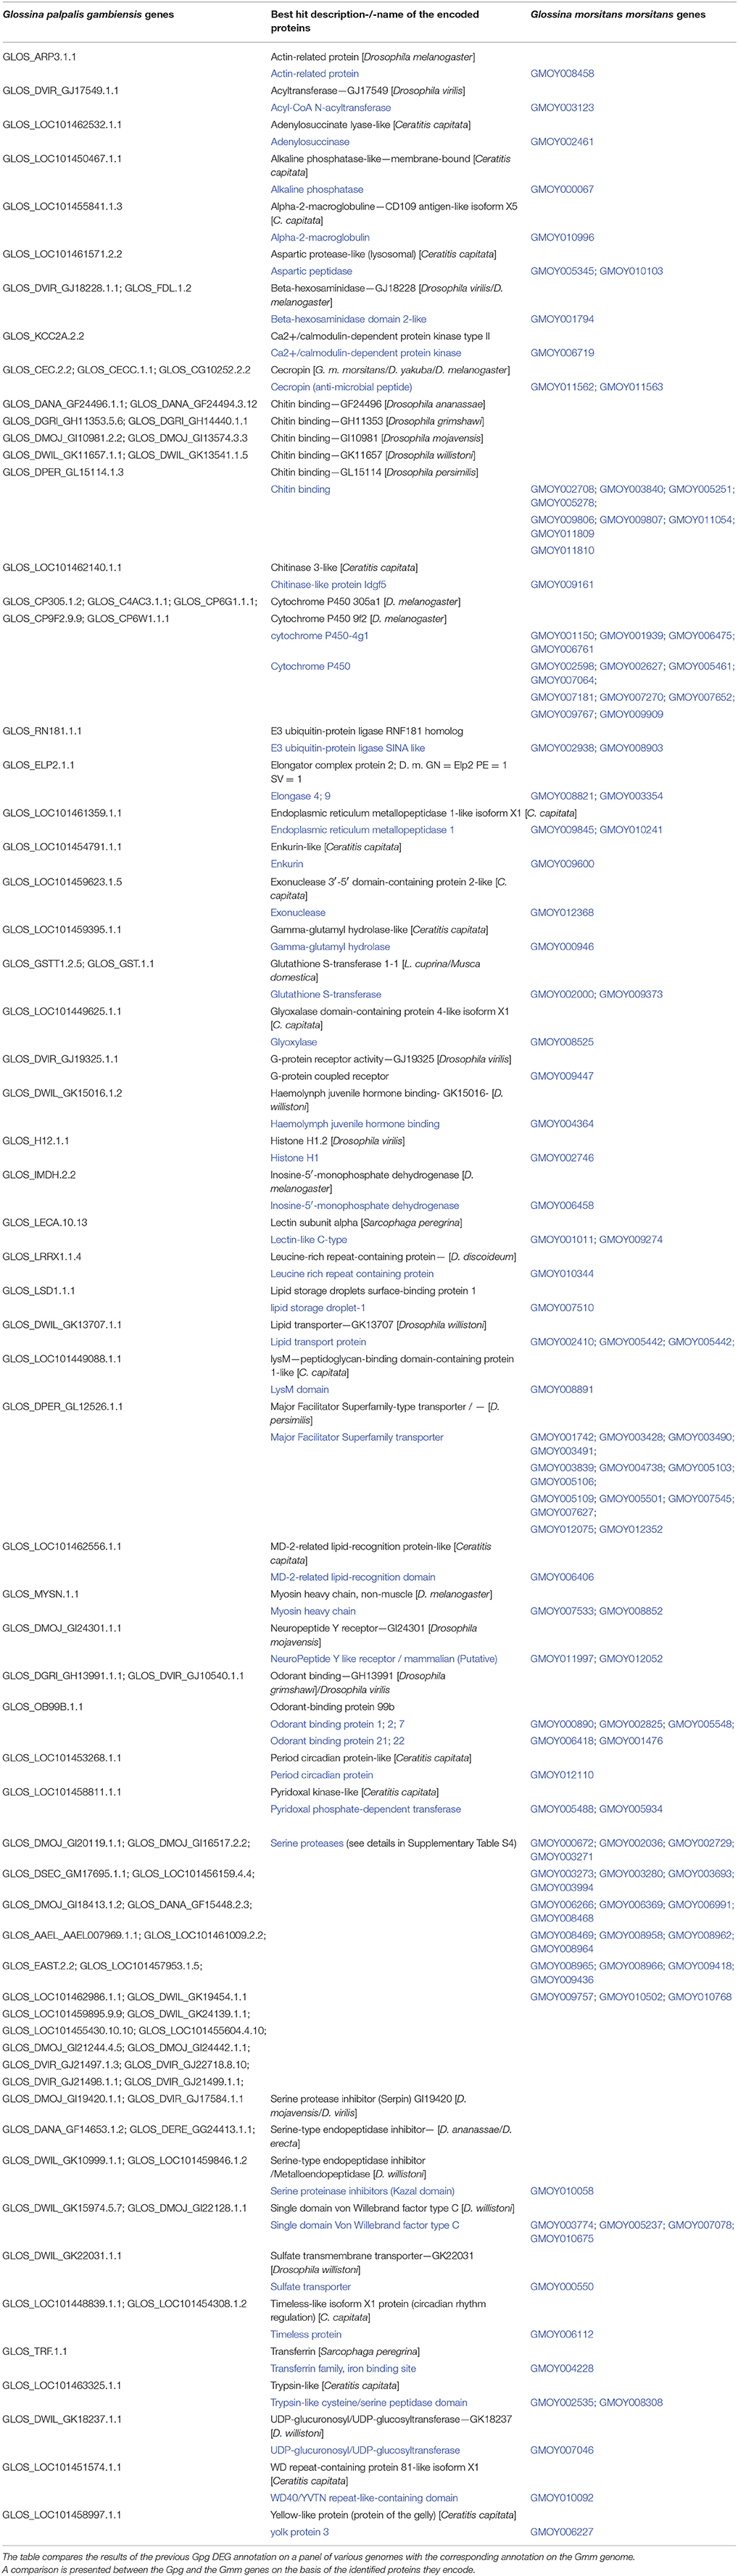
Table 4. Identification of Gmm gene orthologs of Gpg genes on the basis of their expression products.
Homologies between Identified Gmm Genes That Are Heterologous to Gpg DEGs with Genes from Other Organisms
In order to identify genes previously annotated as “uncharacterized” or “hypothetical,” we used the BLASTx program to identify heterologous genes among various organisms listed in the NCBI databases. Homologies with a cut-off E < 10−5 and-/-or displaying the highest hits score were selected; the minimum accepted homology level was 60%. Table 5 presents the results of the recorded annotation, and Figure 4 presents the species from which genomes the genes to be annotated displayed the best match.
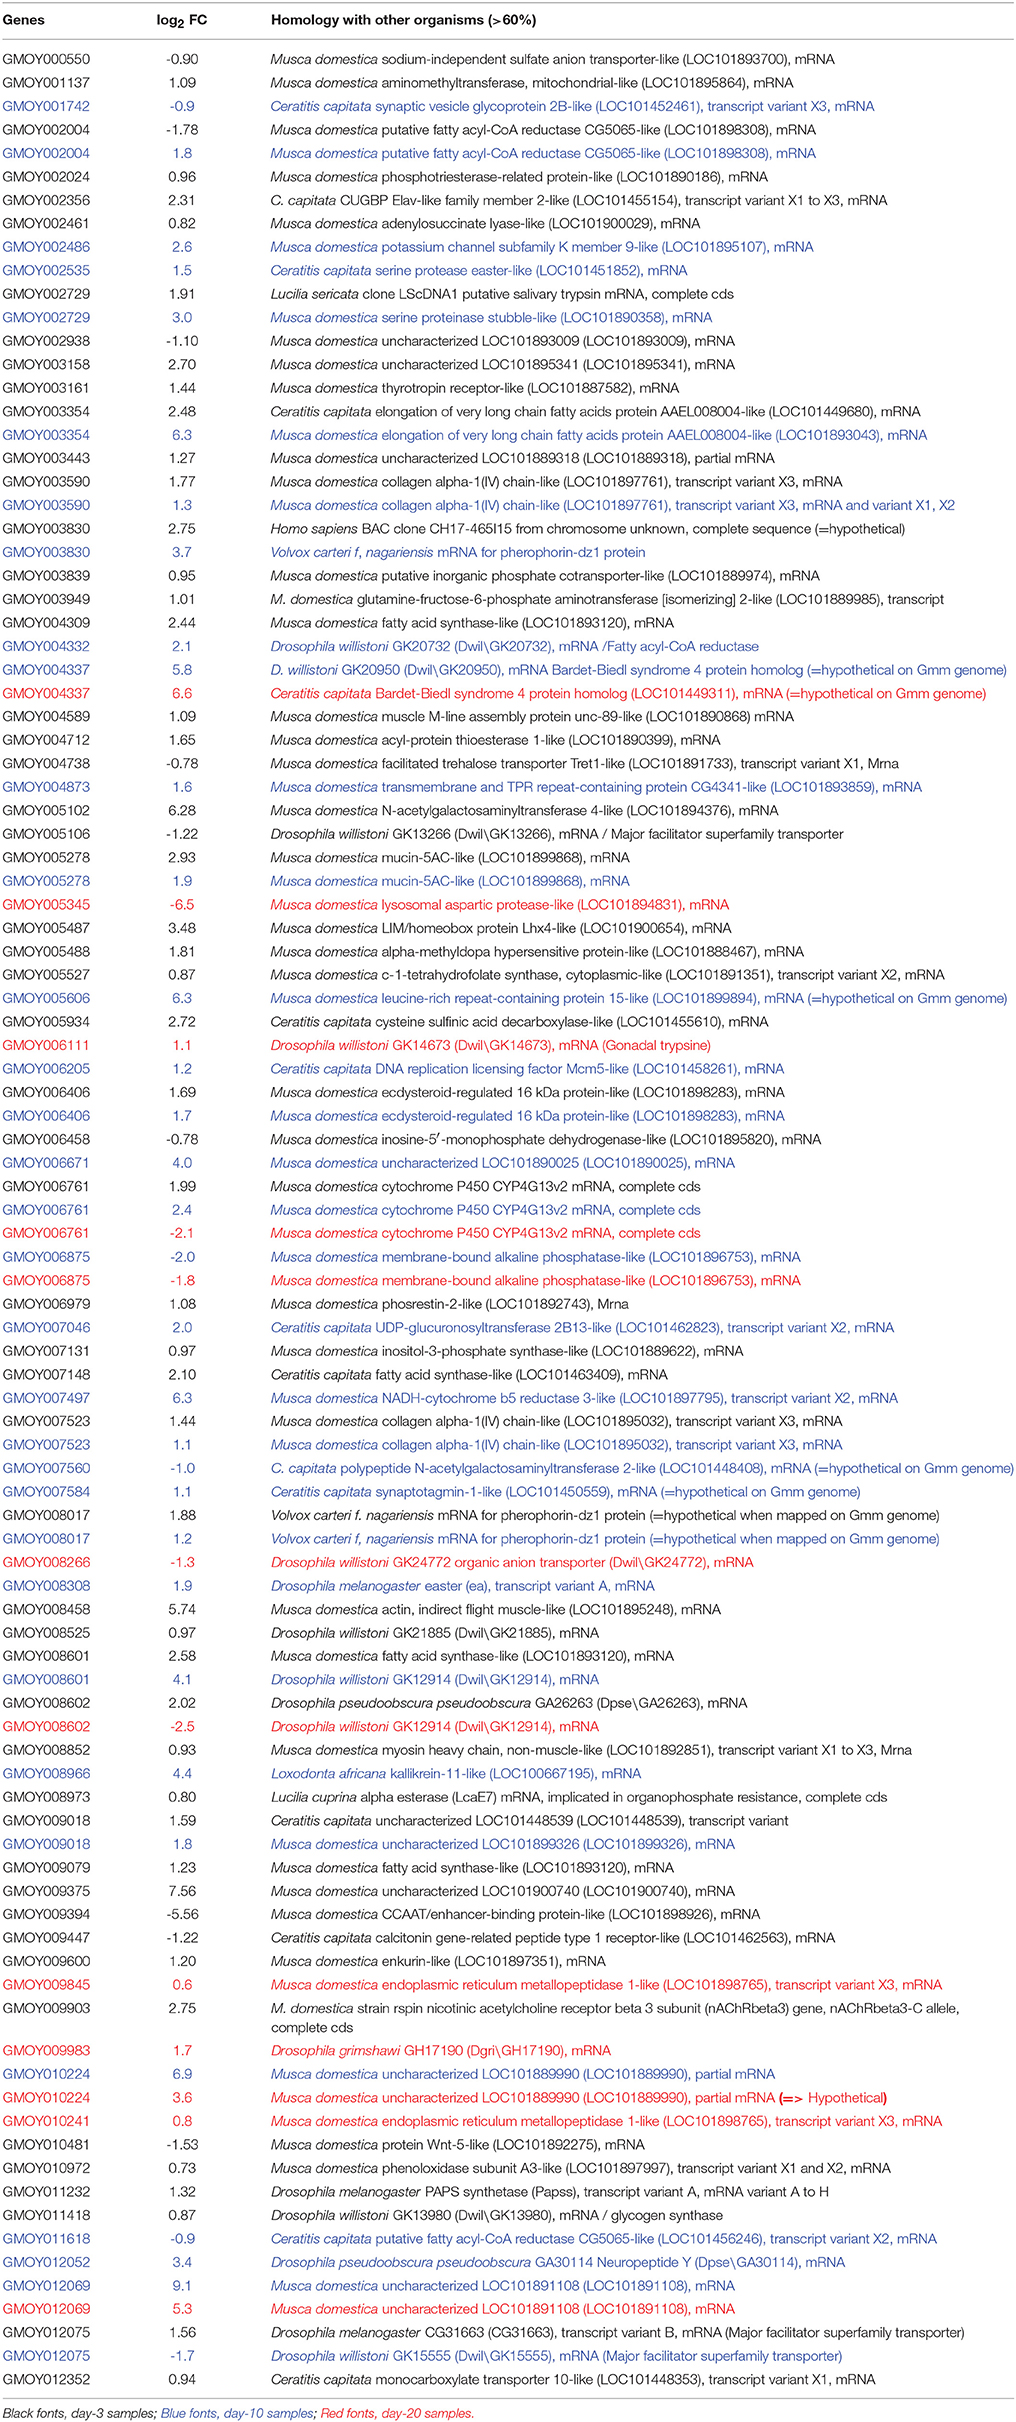
Table 5. Gmm gene heterologs of Gpg DEGs matching genes from other organism databases.
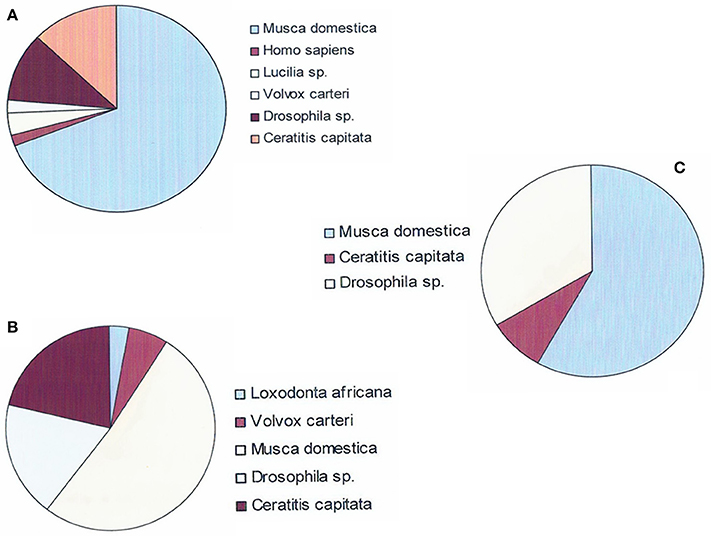
Figure 4. Species on which Gmm genes were mapped in order to characterize genes previously annotated as “hypothetical.” (A) Mapping of the 284 Gmm genes heterologous to Gpg DEGs in trypanosome stimulated vs. non-stimulated flies (day-3 sampling). (B) Mapping of the 139 Gmm genes heterologous to Gpg DEGs in trypanosome infected vs. non-infected flies (day-10 sampling). (C) Mapping of the 59 Gmm genes heterologous to Gpg DEGs in trypanosome infected vs. non-infected flies (day-20 sampling).
Among the 284 Gmm genes heterologous to the day-3 Gpg DEGs samples, 54 genes showed significant matches with other organisms in the investigated databases. The top homology matches were Drosophila sp. (11.1%), Ceratitis capitata (13%), and Musca domestica (68.5%). The remaining 7.4% of genes matched with either Homo sapiens (1.8%), Lucilia sericata (3.5%), or Volvox carteri (2.1%). Similarly, among the 139 Gmm genes heterologous to the day-10 Gpg DEGs samples, 33 genes showed significant matches with other organisms. The top homology matches were Drosophila (18.2%), Ceratitis capitata (21.3%), and Musca domestica (51.5%). The remaining 9% of genes matched with either Loxodonta africana (2.9%) or Volvox carteri (6.1%). Finally, among the 59 DEGs from day-20 samples, 12 DEGs displayed significant matches with Musca domestica (58.7%), Ceratitis capitata (8.3%), or Drosophila sp (33%).
Several trends appear when comparing results from the annotation reported in Table 5 with those reported in Supplementary Tables S1–S3 (or in Table 3, regarding the genes in which the differential expression level was –2 < log2 FC or log2 FC > 2). First, many genes were not annotated; second, for genes that were annotated, the fold-change was identical; and finally, several genes that were annotated as “Hypothetical” when mapped on the Gmm genome could be identified when mapped on other databases. This was the case regarding the genes GMOY003830 (i.e., = > Pherophorin-dz1 protein, when annotated on Volvox carteri), GMOY004337 (i.e., = > Bardet –Biedl syndrome 4 protein homolog, when annotated on D. willistoni or Ceratitis capitata), GMOY005606 (i.e., = > leucine-rich repeat-containing protein 15-like, when annotated on Musca domestica), GMOY007560 (i.e., = > N-acetylgalactosaminyl transferase 2-like, when annotated on C. capitata), GMOY007584 (i.e., = > Synaptotagmin-1-like, when annotated on C capitata), and GMOY008070 (i.e., = > Pherophorin-dz1 protein, when annotated on Volvox carteri).
Discussion
The chronic and acute forms of sleeping sickness endemic to sub-Saharan Africa are caused by two Trypanosoma sub-species, Tbg and Tbr, which are, respectively, transmitted to their vertebrate hosts by the Glossina species Gpg and Gmm (Aksoy et al., 2014; Beschin et al., 2014). Nevertheless, the biological cycles, vertebrate transmission processes, and pathogenicity development of the two parasites are similar. Recently, in the context of an anti-vector strategy project to fight the disease, we performed a global transcriptomic analysis of Gpg gene expression associated with fly infection by Tbg. More precisely, we attempted to characterize genes that were differentially expressed according to the status of the fly at several sampling times (i.e., non-infected, infected, or self-cured). This included genes that could be involved in the fly's vector competence, and consequently genes that could possibly be manipulated in order to reduce or even suppress this competence.
The similarities between the Tbg and Tbr life cycles prompted us to determine whether the Gmm genome carried genes that could be heterologous to the Gpg DEGs, which could then allow the development of common molecular approaches. Accordingly, the Gpg sequences resulting from the previous RNA-seq de novo assembly (Hamidou Soumana et al., 2015) were mapped on the Gmm genome, the DEGs were characterized, and the corresponding genes were annotated.
When the Gpg sequences were mapped and annotated on a panel of various databases (C. capitata, D. melanogaster, D. willistoni, D. virilis, D. mojavensis, Acyrthosiphon pisum, Hydra magnipapillata, Anopheles sp., Bombyx sp., Aedes sp., and G. morsitans; Hamidou Soumana et al., 2015) we identified 553 (S vs. NS), 52 (I10 vs. NI10), and 143 (I20 vs. NI20) DEGs. In contrast, we identified 284 (S vs. NS), 139 (I10 vs. NI10) and 59 (I20 vs. NI20) DEGs when sequences were mapped and annotated on the G. m. morsitans database (using its whole genome annotated on the Drosophila melanogaster, Aedes aegypti, Anopheles gambiae, Culex quinquefasciatus, and Phlebotomus papatasi databases; International Glossina Genome Initiative, 2014). The differences in the number of identified DEGs, as well as the high number of “uncharacterized” genes, could be due to differences in the database panels used to annotate Gpg or Gmm. We cannot exclude the possibility that some of the Gpg DEGs do not have heterologous genes in Gmm, or that some of them could be specific to either Gpg or Gmm and consequently cannot be annotated yet. Nevertheless, regarding I10 vs. NI10 sampling (and in contrast to the two other experimental conditions), the number of recorded DEGs was more than 2-fold higher when the Gpg transcripts were mapped on the Gmm genome, prompting questions of how this is possible. However, at this stage of our research we cannot offer a satisfactory explanation.
We examined the potential influence of database panel composition by annotating the Gmm DEGs on a separate set of databases that included D. melanogaster as an internal control. The results (Table 5) clearly demonstrate the validity of the annotation process, since all Gmm genes (GMOY, etc.) were annotated (best hit description and fold-change) on the novel set of databases as they had been annotated on the former set (Table 3), and that several genes could be identified thanks to their annotation primarily on the Volvox carteri or Musca domestica databases which had never been used before, and despite the fact these organisms (algae and mouse) are genetically distant from the tsetse fly.
The most important observation regarding our objective is that almost all of the Gpg genes previously considered to be potentially involved in tsetse fly vector competence (cf. Hamidou Soumana et al., 2015) had a “countrepart” (i.e., heterologous genes) in the Gmm genome, despite the fact that none of the Gpg DEGs matched with any Gmm genes. This was the case for the large array of genes encoding peptidases, especially serine peptidases (represented by more than 20 genes), identified in the genomes of both fly species. This was similarly observed for ~10 genes present in both genomes that encode chitin binding proteins, since chitin metabolism is involved in the ability of tsetse flies to host trypanosomes (Maudlin and Welburn, 1994; Welburn and Maudlin, 1999), in addition to cecropin (an antimicrobial peptide), among others (Weiss et al., 2014).
Here, we were particularly interested in detecting the presence or not of genes with a reported role in the immunity of tsetse flies or other organisms (Weiss et al., 2014). Genes encoding Pro3 protein (GMOY009756, GMOY000672) and transferrin (GMOY004228) were identified. Pro3 has a potential function as a serine protease (tyrosinase) and is specifically produced by the proventriculus, an organ that plays an important role in the tsetse immune response. This protein could be involved in the immune response via activation of the cascade of prophenol oxidase and melanization (Jiang et al., 1998). Moreover, the gene GMOY0010488 was identified as encoding an “immuno reactive putative protease inhibitor” that is overexpressed in trypanosome stimulated or infected Gpg flies. The transferrin gene was overexpressed in both stimulated and infected Gpg flies; this result is in agreement with Geiser and Winzerling (2012), who reported on the role of transferrin in the immune response of insects, as well as its role in iron transport. By reducing the oxidative stress in tsetse fly guts, transferrin may promote the survival of trypanosomes. Guz et al. (2012) observed transferrin overexpression after challenge with bacteria, even at a higher level than what is typically observed in the case of infection by trypanosomes.
The gene GMOY011809 encodes Pro 1 peritrophin, which is a constituent of the peritrophic membrane (PM). The PM is established after the fly takes its first blood meal, and it is permanently renewed by the proventriculus (Moloo et al., 1970; Tellam et al., 1999). The PM primarily functions to envelop the blood meal and protect the intestinal epithelium against abrasion by ingested matter, although it can also represent an obstacle to the passage of ingested parasites into the ectoperitrophic space (Lehane, 1997; Hegedus et al., 2009). The gene GMOY005278 encodes mucin, which participates with peritrophin in the composition of the PM.
We have also identified genes encoding antimicrobial peptides: in Supplementary Table S1, GMOY01052 through GMOY010524 encode attacin, whereas GMOY0011562 and GMOY0011563 encode cecropin. Furthermore, both attacin and cecropin are overexpressed in Gpg trypanosome stimulated or infected flies.
Our work is the first comparison of its kind between the two Glossina species. This is primarily due to the fact that the different scientific teams working on HAT commonly focus on investigating either Gmm (and the acute form of trypanosomiasis) or Gpg (and the chronic form of trypanosomiasis), but not both together. Indeed, one of our most relevant findings is the observation that Gmm has the same genes at its disposal that Gpg may use to control its vector competence. Importantly, this comparison will assist future studies in revealing common molecular targets to increase the refractoriness of either fly species to infection by trypanosomes.
Author Contributions
Conceived and designed the experiments: IH, AG. Performed the experiments: IH, BT, SR, HP. Analyzed the data: IH, SR, HP, AG. Wrote the paper: AG.
Conflict of Interest Statement
The authors declare that the research was conducted in the absence of any commercial or financial relationships that could be construed as a potential conflict of interest.
The reviewer CGFdL and handling Editor declared their shared affiliation, and the handling Editor states that the process nevertheless met the standards of a fair and objective review.
Acknowledgments
The authors thank the “Région Languedoc-Roussillon—Appel d'Offre Chercheur d'Avenir 2011” and the “Institut de Recherche pour le Développement” for their support.
Supplementary Material
The Supplementary Material for this article can be found online at: http://journal.frontiersin.org/article/10.3389/fmicb.2017.00540/full#supplementary-material
References
Aksoy, S., Weiss, B. L., and Attardo, G. M. (2014). Trypanosome transmission dynamics in tsetse. Curr. Opin. Insect Sci. 3, 43–49. doi: 10.1016/j.cois.2014.07.003
Anders, S., Pyl, P. T., and Huber, W. (2014). HTSeq - A Python framework to work with high-throughput sequencing data. Bioinformatics 31, 166–169. doi: 10.1093/bioinformatics/btu638
Benjamini, Y., and Hochberg, Y. (1995). Controlling the false discovery rate: a practical and powerful approach to multiple testing. J. R. Stat. Soc. Ser. B 57, 289–300.
Beschin, A., Van Den Abbeele, J., De Baetselier, P., and Pays, E. (2014). African trypanosome control in the insect vector and mammalian host. Trends Parasitol. 30, 538–547. doi: 10.1016/j.pt.2014.08.006
Bullard, J. H., Purdom, E., Hansen, K. D., and Dudoit, S. (2010). Upper quartile: evaluation of statistical methods for normalization and differential expression in mRNASeq experiments. BMC Bioinformatics 11:94. doi: 10.1186/1471-2105-11-94
Dennis, G. Jr., Sherman, B. T., Hosack, D. A., Yang, J., Gao, W., Lane, H. C., et al. (2003). DAVID: database for annotation, visualization, and integrated discovery. Genome Biol. 4:P3. doi: 10.1186/gb-2003-4-5-p3
Farikou, O., Njiokou, F., Mbida Mbida, J. A., Njitchouang, G. R., Djeunga, H. N., Asonganyi, T., et al. (2010). Tripartite interactions between tsetse flies, Sodalis glossinidius and trypanosomes-an epidemiological approach in two historical human African trypanosomiasis foci in Cameroon. Infect. Genet. Evol. 10, 115–121. doi: 10.1016/j.meegid.2009.10.008
Geiser, D. L., and Winzerling, J. J. (2012). Insect transferrins: multifunctional proteins. Biochim. Biophys. Acta 1820, 437–451. doi: 10.1016/j.bbagen.2011.07.011
Gentleman, R. C., Carey, V. J., Bates, D. M., Bolstad, B., Dettling, M., Dudoit, S., et al. (2004). Bioconductor: open software development for computational biology and bioinformatics. Genome Biol. 5:R80. doi: 10.1186/gb-2004-5-10-r80
Guz, N., Kilincer, N., and Aksoy, S. (2012). Molecular characterization of Ephestia kuehniella (Lepidoptera: Pyralidae) transferrin and its response to parasitoid Venturia canescens (Hymenoptera: Ichneumonidae Gravenhorst). Insect Mol. Biol. 21, 139–147. doi: 10.1111/j.1365-2583.2011.01129.x
Hamidou Soumana, I., Klopp, C., Ravel, S., Nabihoudine, I., Tchicaya, B., Parrinello, H., et al. (2015). RNA-seq de novo assembly reveals differential gene expression in Glossina palpalis gambiensis infected with Trypanosoma brucei gambiense vs. non-infected and self-cured flies. Front. Microbiol. 6:1259. doi: 10.3389/fmicb.2015.01259
Hamidou Soumana, I., Loriod, B., Ravel, S., Tchicaya, B., Simo, G., Rihet, P., et al. (2014a). The transcriptional signatures of Sodalis glossinidius in the Glossina palpalis gambiensis flies negative for Trypanosoma brucei gambiense contrast with those of this symbiont in tsetse flies positive for the parasite: possible involvement of a Sodalis-hosted prophage in fly Trypanosoma refractoriness? Infect. Genet. Evol. 24, 41–56. doi: 10.1016/j.meegid.2014.03.005
Hamidou Soumana, I., Tchicaya, B., Simo, G., and Geiger, A. (2014b). Comparative gene expression of Wigglesworthia inhabiting non-infected and Trypanosoma brucei gambiense-infected Glossina palpalis gambiensis flies. Front. Microbiol. 5:620. doi: 10.3389/fmicb.2014.00620
Hegedus, D., Erlandson, M., Gillott, C., and Toprak, U. (2009). New insights into peritrophic matrix synthesis, architecture, and function. Annu. Rev. Entomol. 54, 285–302. doi: 10.1146/annurev.ento.54.110807.090559
Hoare, C. A. (1972). The Trypanosomes of Mammals, A Zoological Monograph. Oxford: Blackwell Scientific Publications.
International Glossina Genome Initiative (2014). Genome sequence of the tsetse fly (Glossina morsitans): vector of African trypanosomiasis. Science 344, 380–386. doi: 10.1126/science.1249656
Jiang, H., Wang, Y., and Kanost, M. R. (1998). Pro-phenol oxidase activating proteinase from an insect, Manduca sexta: a bacteria-inducible protein similar to Drosophila easter. Proc. Natl. Acad. Sci. U.S.A. 95, 12220–12225. doi: 10.1073/pnas.95.21.12220
Kim, D., Pertea, G., Trapnell, C., Pimentel, H., Kelley, R., and Salzberg, S. L. (2013). TopHat2: accurate alignment of transcriptomes in the presence of insertions, deletions and gene fusions. Genome Biol. 14:R36. doi: 10.1186/gb-2013-14-4-r36
Langmead, B., and Salzberg, S. (2012). Fast gapped-read alignment with Bowtie 2. Nat. Methods 9, 357–359. doi: 10.1038/nmeth.1923
Lehane, M. J. (1997). Peritrophic matrix structure and function. Annu. Rev. Entomol. 42, 525–550. doi: 10.1146/annurev.ento.42.1.525
Louis, F. J., Simarro, P. P., and Lucas, P. (2002). Sleeping sickness: one hundred years of control strategy evolution. Bull. Soc. Pathol. Exot. 95, 331–336.
Maudlin, I., and Welburn, S. C. (1994). Maturation of trypanosome infections in tsetse. Exp. Parasitol. 79, 202–205. doi: 10.1006/expr.1994.1081
Moloo, S. K., Steiger, R. F., and Hecker, H. (1970). Ultrastructure of the peritrophic membrane formation in Glossina Wiedemann. Acta Trop. 274, 378–383.
Mount, D. W. (2007). Using the Basic Local Alignment Search Tool (BLAST). CSH Protoc. 2007:pdb.top17. doi: 10.1101/pdb.top17
Robinson, M. D., McCarthy, D. J., and Smyth, G. K. (2010). EdgeR: a Bioconductor package for differential expression analysis of digital gene expression data. Bioinformatics 26, 139–140. doi: 10.1093/bioinformatics/btp616
Savage, A. F., Kolev, N. G., Franklin, J. B., Vigneron, A., Aksoy, S., and Tschudi, C. (2016). Transcriptome profiling of Trypanosoma brucei development in the tsetse fly vector Glossina morsitans. PLoS ONE 11:e0168877. doi: 10.1371/journal.pone.0168877
Tellam, R. L., Wijffels, G., and Willadsen, P. (1999). Peritrophic matrix proteins. Insect Biochem. Mol. Biol. 29, 87–101. doi: 10.1016/S0965-1748(98)00123-4
Van den Abbeele, J., Claes, Y., van Bockstaele, D., Le Ray, D., and Coosemans, M. (1999). Trypanosoma brucei spp. development in the tsetse fly: characterization of the post mesocyclic stages in the foregut and proboscis. Parasitology 118, 469–478. doi: 10.1017/S0031182099004217
Vickerman, K., Tetley, L., Hendry, K. A., and Turner, C. M. (1988). Biology of African trypanosomes in the tsetse fly. Biol. Cell 64, 109–119. doi: 10.1016/0248-4900(88)90070-6
Weiss, B. L., Savage, A. F., Griffith, B. C., Wu, Y., and Aksoy, S. (2014). The peritrophic matrix mediates differential infection outcomes in the tsetse fly gut following challenge with commensal, pathogenic, and parasitic microbes. J. Immunol. 193, 773–782. doi: 10.4049/jimmunol.1400163
Welburn, S. C., and Maudlin, I. (1999). Tsetse-trypanosome interactions: rites of passage. Parasitol. Today 15, 399–403. doi: 10.1016/S0169-4758(99)01512-4
Welburn, S. C., Maudlin, I., and Simarro, P. P. (2009). Controlling sleeping sickness-a review. Parasitology 136, 1943–1949. doi: 10.1017/S0031182009006416
Keywords: human African Trypanosomiasis, Glossina palpalis gambiensis, Glossina morsitans morsitans, Trypanosoma brucei gambiense, differentially expressed genes, heterologous genes
Citation: Hamidou Soumana I, Tchicaya B, Rialle S, Parrinello H and Geiger A (2017) Comparative Genomics of Glossina palpalis gambiensis and G. morsitans morsitans to Reveal Gene Orthologs Involved in Infection by Trypanosoma brucei gambiense. Front. Microbiol. 8:540. doi: 10.3389/fmicb.2017.00540
Received: 01 December 2016; Accepted: 14 March 2017;
Published: 03 April 2017.
Edited by:
Alexandre Morrot, Federal University of Rio de Janeiro, BrazilReviewed by:
Celio Geraldo Freire De Lima, Federal University of Rio de Janeiro, BrazilElisangela Oliveira De Freitas, University of Oxford, UK
Geneviève Milon, Institut Pasteur (INSERM), France
Copyright © 2017 Hamidou Soumana, Tchicaya, Rialle, Parrinello and Geiger. This is an open-access article distributed under the terms of the Creative Commons Attribution License (CC BY). The use, distribution or reproduction in other forums is permitted, provided the original author(s) or licensor are credited and that the original publication in this journal is cited, in accordance with accepted academic practice. No use, distribution or reproduction is permitted which does not comply with these terms.
*Correspondence: Anne Geiger, anne.geiger@ird.fr