 Yi-Rui Yin1†Zhao-Hui Meng2†Qing-Wen Hu1Zhao Jiang1Wen-Dong Xian3Lin-Hua Li2Wei Hu2Feng Zhang4En-Min Zhou3
 Xiao-Yang Zhi1*
 Wen-Jun Li1,3,5*
- 1School of Life Sciences, Yunnan Institute of Microbiology, Yunnan University, Kunming, China
- 2Department of Cardiology, The First Affiliated Hospital of Kunming Medical University, Kunming, China
- 3State Key Laboratory of Biocontrol and Guangdong Provincial Key Laboratory of Plant Resources, School of Life Sciences, Sun Yat-Sen University, Guangzhou, China
- 4Key Laboratory of Biopesticide and Chemical Biology, School of Life Sciences, Fujian Agriculture and Forestry University, Fuzhou, China
- 5Key Laboratory of Biogeography and Bioresource in Arid Land, Xinjiang Institute of Ecology and Geography, Chinese Academy of Sciences, Ürümqi, China
Thermoactinospora rubra YIM 77501T is an aerobic, Gram-positive, spore-forming and cellulose degrading thermophilic actinomycete isolated from a sandy soil sample of a volcano. Its growth temperature range is 28–60°C. The genomic sequence of this strain revealed that there are 27 cellulase genes belonging to six glycoside hydrolase families. To understand the strategy that this strain uses to utilize carbon sources such as cellulose at different temperatures, comparative transcriptomics analysis of T. rubra YIM 77501T was performed by growing it with cellulose (CMC) and without cellulose (replaced with glucose) at 30, 40, and 50°C, respectively. Transcriptomic analyses showed four cellulase genes (TrBG2, TrBG3, TrBG4, and ThrCel6B) were up-regulated at 30, 40, and 50°C. The rate of gene expression of TrBG2, TrBG3, TrBG4, and ThrCel6B were 50°C > 30°C > 40°C. One cellulase gene (TrBG1) and two cellulase genes (TrBG5 and ThrCel6A) were up-regulated only at 30 and 50°C, respectively. These up-regulated cellulase genes were cloned and expressed in Escherichia coli. The enzymatic properties of up-regulated cellulases showed a variety of responses to temperature. Special up-regulated cellulases TrBG1 and ThrCel6A displayed temperature acclimation for each growth condition. These expression patterns revealed that a hybrid strategy was used by T. rubra to utilize carbon sources at different temperatures. This study provides genomic, transcriptomics, and experimental data useful for understanding how microorganisms respond to environmental changes and their application in enhancing cellulose hydrolysis for animal feed and bioenergy production.
Introduction
Cellulose, as a main carbon source in the biosphere, is utilized by microorganisms and animals (Hungate, 1964; Batjes, 1996; Amundson, 2001). Completely digestion of cellulose involves multiple cellulases, like endo-1, 4-β-glucanases (EC 3.2.1.4), cellobiohydrolases or exo-1, 4-β-glucanases (EC 3.2.1.91), and β-glucosidases (EC 3.2.1.21; Lynd et al., 2002; Gilbert et al., 2008). For microorganisms, secretion of cellulases may be effected by substances, pH, ion, and temperature (Lynd et al., 2002; López-Contreras et al., 2004; Sohail et al., 2009; Deng and Zhang, 2015; Hakkinen et al., 2015; Chen et al., 2016). Temperature is one of the most important environmental factors (Lin et al., 2016), and it may impact utilization of cellulose as a carbon source from two aspects: (1) it could affect the activity and stability of cellulases, and (2) it might be a crucial factor for inducing some cellulases under special temperatures. The different cellulases of microorganisms have diverse activity and stability at the same or different temperatures (Pardo and Forchiassin, 1999), such as enzyme, EG5C from Paenibacillus sp. IHB B 3084 shows optimum activity below 45°C (Dhar et al., 2015), while enzymes, ThCel6A from Thermobifida halotolerans YIM 90462T and CelA from Caldicellulosiruptor bescii show maximum activity between 50 and 60°C and higher than 80°C, respectively (Brunecky et al., 2013; Yin et al., 2015). Some cellulases are stable only at a low temperature (Dhar et al., 2015), while some remain stable at a high temperature (Brunecky et al., 2013). Under high temperatures, Thermobifida fusca secretes thermo stable cellulolytic enzymes to degrade cellulose (Adav et al., 2011). However, the potential strategy of carbon source acquisition (such as cellulose) at different temperatures remains unclear for microorganisms.
With the passage of time, the environment is always changing, including the microenvironment that the microorganisms inhabit. Microorganisms have developed many strategies to successfully survive, and they occupy most of the habitats on Earth after long-term evolution (Jorge-Villar and Edwards, 2013), even in extreme niches. To adapt to different environmental conditions, microorganisms can adopt three possible strategies: (1) the active strategy (special enzymes were up-regulated under different conditions), (2) the passive strategy (the same enzymes were up-regulated under different conditions), or (3) a hybrid strategy (both the same kinds of and special kinds of enzymes were up-regulated under different conditions). Microorganisms could respond to the environmental factors (such as temperature) during the process of carbon source acquisition.
Thermoactinospora rubra YIM 77501T is an aerobic, Gram-positive, spore-forming, and thermophilic actinomycete that was isolated from a sandy soil sample collected at the Tengchong National Volcanic Geological Park, Yunnan province, south-west China (Zhou et al., 2012). The growth temperature of strain YIM 77501T ranges from 28 to 60°C and it grows optimally at 45–55°C (Zhou et al., 2012). The result of plate testing for cellulase production using a Congo red plate assay (Teather and Wood, 1982) demonstrated that T. rubra has the ability to degrade cellulose (Figure S1). The crude cellulase activity test from culture supernatants of T. rubra in 0.2% carboxymethyl cellulose (CMC) medium to stationary phase at different temperatures showed that the cellulase activity of the culture at 30 and 50°C were higher than culture at 40°C (Figure S2). Furthermore, comparing the effect of temperature on crude enzymes (culture supernatants of T. rubra) activity showed that the sample from 30°C had higher activity at 30–45°C, and the sample from 50°C had higher activity at 50–70°C. These clues clearly indicate that T. rubra could express cellulases with different enzymatic characteristics to digest cellulose as carbon source at different temperatures.
In this study, the draft genome of T. rubra YIM 77501T was sequenced. The gene predication and function annotation revealed that there were 408 glycoside-hydrolase-encoding genes. The transcriptomes of T. rubra under different culture conditions (different temperatures: 30, 40, and 50°C; different carbon source: CMC sodium and glucose) were profiled as well. The cellulase genes, which were significantly up-regulated in the presence of CMC under different temperatures, were cloned and expressed heterogenetically. The enzymatic properties of these cellulases were characterized. This study shed light on the strategy of strain T. rubra for carbon source acquisition at different temperatures.
Materials and Methods
Growth and Genome Sequencing
T. rubra YIM 77501T (= DSM 45614T = CCTCC AA 2011014T) was cultured on R2A medium (yeast extract, 0.5 g/l; peptone, 0.5 g/l; glucose 0.5 g/l; soluble starch, 0.5 g/l; casein acid hydrolysates, 0.5 g/l; sodium pyruvate, 0.5 g/l; K2HPO4, 0.3 g; MgSO4, 0.024 g/l) at 50°C. Genomic DNA was purified from 100 ml of mid exponential phase R2A cultures using a MasterPure Gram-Positive DNA Purification kit (Epicentre MGP04100) following the standard DNA isolation procedure recommended by the manufacturer with modifications (Wu et al., 2009). Genomic DNA was sequenced using Illumina technology (Bennett, 2004) at the Beijing Genomics Institute (BGI Tech Solutions, Shenzhen, China). After the raw sequences were trimmed and their quality filtered (Q > 30), the clean reads with high quality were assembled using de Bruijn graphs in SOAP de novo v.1.05 (http://www.seekbio.com/soft/2754.html) with the K-mer parameter set to 41 (Li et al., 2008) and draft genomes were generated. The SOAPaligner v.2.21 alignment tool (http://soap.genomics.org.cn/soapaligner.html#down2) was used to align these reads against the de novo scaffolds to map reads and account for single nucleotide errors (Gu et al., 2013). Glimmer v3.0 (Chen et al., 2011) was used for gene prediction in assembled sequences of strain T. rubra. The sequence data described here have been deposited in JGI IMG (Submission ID: 105093) and DDBJ/ENA/GenBank (Accession number: MSZZ00000000). Carbohydrate-active enzymes (CAZymes) of T. rubra were determined using the CAZymes Analysis Toolkit (http://mothra.ornl.gov/cgi-bin/cat/cat.cgi; Petit et al., 2015). The results of GHs (Glycoside hydrolase families) were analyzed using the HMMER software based on the Pfam database (http://pfam.xfam.org/; Finn et al., 2011).
Transcriptome Sample Preparation and Sequencing
T. rubra YIM 77501T was cultured in a modified form of a previously described R2A medium containing the following (g/l): yeast extract, 0.5 g; peptone, 0.5 g; casein acid hydrolysates, 0.5 g; sodium pyruvate, 0.5 g; K2HPO4, 0.3 g; MgSO4, 0.024 g; with 2 g/l CMC sodium as the test sample (R2A-CMC medium) and with 2 g/l glucose as control (R2A-glucose medium), with the pH adjusted to 7.0 using KOH. The colony of T. rubra was inoculated to R2A-CMC and R2A-glucose media. The growth curves under different conditions were determined (Figure S3). After incubation to mid exponential phase (at 30°C 180 rpm for 7 days, 40°C 180 rpm for 3.5 days, and 50°C 180 rpm for 2 days), cells were harvested by centrifugation for 5 min at 12,000 × g at 4°C. Three independent biological replicates were performed for each condition. The cell biomass was washed with phosphate buffered saline, re-suspended in 100 μl TE buffer pH 8 (EMD Chemicals) containing 2 mg/ml lysozyme (Merck, USA), and incubated at 37°C for 40 min. Total RNA was isolated using the RNeasy RNA purification kit (QIAGEN, Germany) according to the manufacturer's instructions. Contaminating DNA was removed with RNase-free DNase I (QIAGEN, Germany). Ribosome RNA in total RNA preparation was removed by using the Ribo-Zero™ Magnetic Kit for Gram-Positive Bacteria (Epicentre, USA). The quality of RNA samples was assessed on the Agilent Bioanalyzer 2100 system. Library construction and Illumina sequencing (Illumina HiSeq™ 2500) were performed at the Beijing Novogene Biological Information Technology Co., Ltd., Beijing, China (http://www.novogene.cn/).
An RNA-seq analysis was performed according to the protocol recommended by the manufacturer (Illumina Inc.). Raw reads of fastq files were first processed through in-house Perl scripts. In this step, clean reads were utilized by removing reads containing adapter, reads containing poly-N and low quality reads from raw data. At the same time, the Q20, Q30, and GC contents of the clean data were calculated. All the following analyses were based on clean data with high quality. The reads from different conditions were mapped to the whole-genome of strain T. rubra using Bowtie 2.2.3 (Langmead and Salzberg, 2012). HTSeq v0.6.1 was used to count the read numbers mapped to each gene. Then, the FPKM of each gene was calculated based on the length of the gene and reads count mapped to this gene (FPKM, expected number of fragments per kilobase of transcript sequence per millions base pairs sequenced, considers the effect of sequencing depth and gene length for the reads count at the same time and is currently the most commonly used method for estimating gene expression levels; Trapnell et al., 2009). Here, FPKM > 1 means gene expression.
Differential expression analysis of two conditions (cultures in CMC media and glucose media) at the same temperature (three biological replicates per condition) were performed using the DESeq R package (1.18.0). DESeq provided statistical methods for determining differential expression in digital gene expression data using a model based on a negative binomial distribution. The resulting p-values were adjusted using the Benjamini and Hochberg approach for controlling false discovery rate. Genes with an adjusted p < 0.05 found by DESeq were assigned as differentially expressed (Wang et al., 2010).
Gene Cloning, Expression, and Purification of Cellulases
The full-length sequences of cellulase genes were amplified from T. rubra genomic DNA. Chromosomal DNA of T. rubra was isolated using the Ezup Bacteria DNA Kit (Sangon Biotech, China) according to the manufacturer's instructions. Base on genome sequences, primers of cellulase genes (Table S1) were designed by using Primer Premier 5 (http://www.bioprocessonline.com/doc/primer-premier-5-design-program-0001). The complete ORFs of cellulase genes were amplified by PCR using the TransStar FastPfu Fly DNA Polymerase (TransGen Biotech, China). Amplification was performed for 34 cycles of 98°C for 20 s, 65°C for 20 s, and 72°C for 1 min, 72°C for 5 min with initial 2 min denaturation at 98°C. PCR products were ligated into pEASY-Blunt E1 vector (TransGen Biotech, China) and transformed into Escherichia coli DH5α. After sequencing verification, the entire cellulase gene was confirmed; positive recombinant vectors were transformed into E. coli BL21 (DE3) for cellulase gene expression.
Transformants were cultured overnight in LB culture medium with 100 μg/ml ampicillin at 37°C and 220 rpm. Then, 1 ml of the cells was added to 100 ml LB medium at 25°C and 220 rpm. During cultivation, isopropyl β-D-1-thiogalactoside (IPTG) was added to a final concentration of 1 mM at mid-exponential phase (OD600 ≈ 0.6) and followed by further incubation 8 h at 25°C with 220 rpm. Cells were harvested by centrifugation at 4,000 × g and suspended in 20 ml PBS buffer (pH 8.0).
After ultrasonic cell disintegration and centrifugation at 12,000 × g for 30 min at 4°C, cell-free extracts were applied to a Ni-chelating affinity column (GE, USA) because the proteins possess an N-terminal His-tag. Then, the extract was washed with five column volumes of buffer A (20 mM sodium phosphate, 0.3 M NaCl, pH 8.0), followed by 10 column volumes of buffer A with 20 mM imidazole, pH 8.0, and was eluted with buffer A with 200 mM imidazole, pH 8.0. The eluted protein was used for enzyme characterization.
Enzyme Assays and Protein Assays
The homogeneity of the purified enzyme was monitored by SDS-PAGE using 10% acrylamide gels. Proteins were visualized by Coomassie brilliant blue R-250 as described by Liu et al. (2010). Protein concentration was determined with a protein assay kit (Sangon Biotech, China) using bovine serum albumin as a standard. Activity against CMC was determined by measuring the release of reducing sugar, with 1% (w/v) CMC as substrate, by the 3,5-dinitrosalicylic acid (DNS) assay (Miller, 1959). One unit (U) of CMCase activity was defined as the amount of enzyme to release 1 μmol glucose-equivalent reducing sugars per minute. β-glucosidase activity was assayed using a 200 μl reaction mixture containing 2.5 mM p-nitrophenyl-β-D-glucopyranoside (pNPGlu) (Sigma, St. Louis, MO, USA). After 5 min of incubation at optimal temperature, the reaction was stopped by adding 0.6 ml of 1 M Na2CO3 (Yang et al., 2015). The p-nitrophenol was determined by monitoring the absorbance at 405 nm (Harnpicharnchai et al., 2009). One unit of β-glucosidase activity is equivalent to 1 μmol of p-nitrophenol released from the pNPGlu in 1 min. The effect of temperature was determined at different temperatures from 20 to 90°C in optimal pH. Thermal stability of enzymes was determined by incubating equivalents of purified enzyme solutions for varied length of time intervals at 30, 40, and 50°C. The residual activity was determined by the standard method.
Results
Genomic Features of T. rubra
The draft genome sequence of T. rubra YIM 77501T consisted of 191 scaffolds, with 8,233,369 bp. The GC content was 71.7% and the genome contained 8,114 coding sequences, with an average length of 914 bp. The general genomic features of T. rubra are listed in Table S2. Among the predicted genes, 60% (4867 genes) have been assigned a function, and 40% (3,247 genes) have an unknown function. In addition, genes encoding one rRNA operon were found in proximity to the origin of function, and there were 54 tRNAs (Table S2).
Genes Encoding Carbohydrate-Active Enzymes
A CAZymes analysis was conducted to identify potential enzymes with plant cell-wall degradation ability. By applying this analysis, a total of 403 glycoside hydrolases (GHs) were distributed into 58 families, 226 carbohydrate-binding modules (CBMs) were distributed into 20 families, 20 polysaccharide lyases (PLs) were distributed into 7 families, 109 carbohydrate esterases (CEs) were distributed into 10 families, and 339 glycosyl transferases (GTs) were distributed into 26 families, are encoded in the genome of T. rubra (Figure 1). After analysis of GHs by using the HMMER software based on the Pfam database, 108 GH genes were distributed into 36 families (Figure 1). Twenty-seven cellulase genes were distributed to 6 GH families. The function of these 6 GH (GH1, GH3, GH5, GH6, GH9, and GH48) families may directly relate to cellulose digestion.
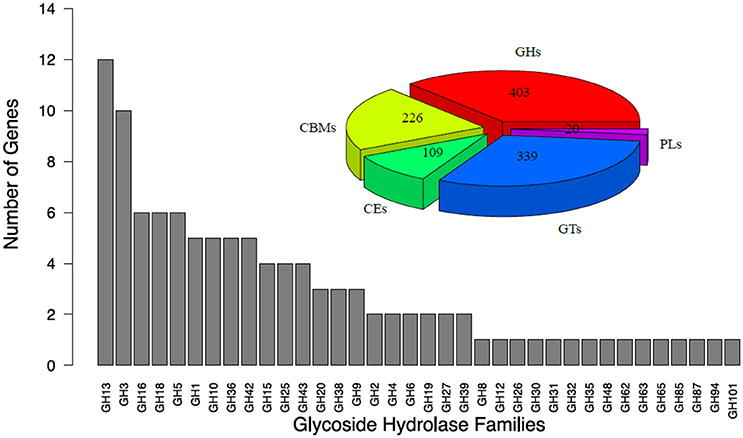
Figure 1. Glycoside hydrolase (GHs) families of T. rubra YIM 77501T. GHs, Glycoside Hydrolases; CBMs, Carbohydrate-Binding Modules; CEs, Carbohydrate Esterases; GTs, Glycosyl Transferases; PLs, Polysaccharide Lyases.
Transcriptome Sequencing and Analyses
Global gene expression profiles of T. rubra cultured on R2A-glucose and R2A-CMC media under different temperatures (30, 40, and 50°C) were examined using transcriptome sequencing. Finally, there are 406.48 million clean reads and 50.81 GB of RNA-seq data in treated and control strains after quality filtering (Error rate = 0.01%, Q20 > 98%, Q30 > 95%). More than 99% of the clean reads were mapped to the T. rubra YIM 77501T genome. The GC content of clean reads is within the scope of 68.2–69.2% for all samples (Table S3). All of the Pearson's correlations between biological replicates were >0.95 and indicated a high reliability of the experiment and rationality of sample selection (Figure S4). Comparing percentage of reads mapped to the genome regions at different temperatures, more reads were mapped to intergenic region at higher temperatures. Cultures of R2A-CMC media contained ~8.9, 12.3, and 21% reads mapping to intergenic regions at 30, 40, and 50°C, respectively. Cultures of R2A-glucose media contained ~10.8, 19.9, and 22.1% reads mapping to intergenic regions at 30, 40, and 50°C, respectively (Figure S5). These results revealed that intergenic regions might play some functions in adapting to higher temperatures for strain T. rubra.
Total 18, 19, and 21 cellulase genes showed expression (FPKM > 1) at 30, 40, and 50°C, respectively. In these genes, seven up-regulated cellulase genes belonging to GH1, GH3, and GH6 were detected, comparing the cellulase genes expressions of CMC cultures with glucose cultures. This means that not all cellulase genes expressed during our culture conditions and the presence of CMC were no need for expression of some cellulase genes. Comparing the cellulase genes expressions of CMC cultures with glucose cultures at same temperature, four cellulase genes (TrBG2, TrBG3, TrBG4, and ThrCel6B) were up-regulated at 30, 40, and 50°C (p < 0.01). The rates of gene expression of TrBG2, TrBG3, TrBG4, and ThrCel6B were relatively higher at 50°C; on the contrary, they were relatively lower at 40°C. One cellulase gene (TrBG1) was especially up-regulated at 30°C (p < 0.01); two cellulase genes (TrBG5 and ThrCel6A) were merely up-regulated at 50°C (p < 0.01; Figure 2). These findings suggested that culture temperature can affect cellulase gene expressions for T. rubra.
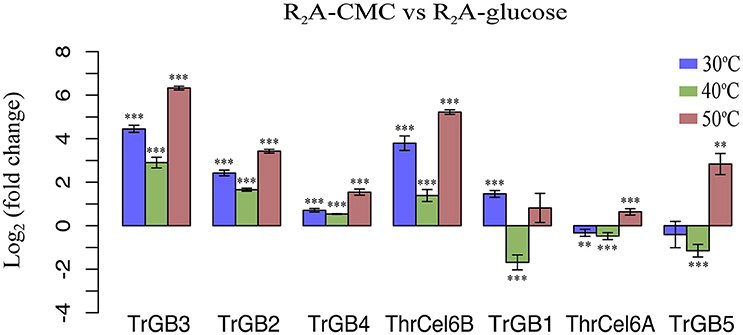
Figure 2. Log2 of fold change in gene expression of T. rubra YIM 77501T on R2A-CMC and R2A-glucose. Blue bars show the expression of R2A-CMC cultures relative to R2A-glucose cultures at 30°C, green bars show the expression of R2A-CMC cultures relative to glucose (Glu) cultures at 40°C, red bars show the expression of R2A-CMC cultures relative to R2A-glucose cultures at 50°C. Values represent the mean of three biological replicates. Error bars show the standard deviation. ***p < 0.01; **p < 0.05.
After data analysis, 7,084 and 7,132 genes expressed (FPKM > 1) when T. rubra was cultured at 30°C in R2A-CMC and R2A-glucose media, respectively; 7,009 and 6,839 genes were expressed (FPKM > 1) at 40°C in R2A-CMC and R2A-glucose media, respectively; 7,345 and 7,228 genes were expressed (FPKM > 1) at 50°C in R2A-CMC and R2A-glucose media, respectively, (Figure 3, Table S4). The expression of different genes in T. rubra showed high fluctuation when cultured at different temperatures on R2A-CMC and R2A-glucose media. High expression genes was observed (FPKM > 60), when T. rubra was cultured at 30 and 50°C as compared at 40°C. The genes 2,725 and 2,750, 2,231 and 2,543, 2,835 and 2,852 showed high expression (FPKM > 60) when T. rubra was cultured at 30, 40, and 50°C on R2A-CMC and R2A-glucose media, respectively (Table S4).
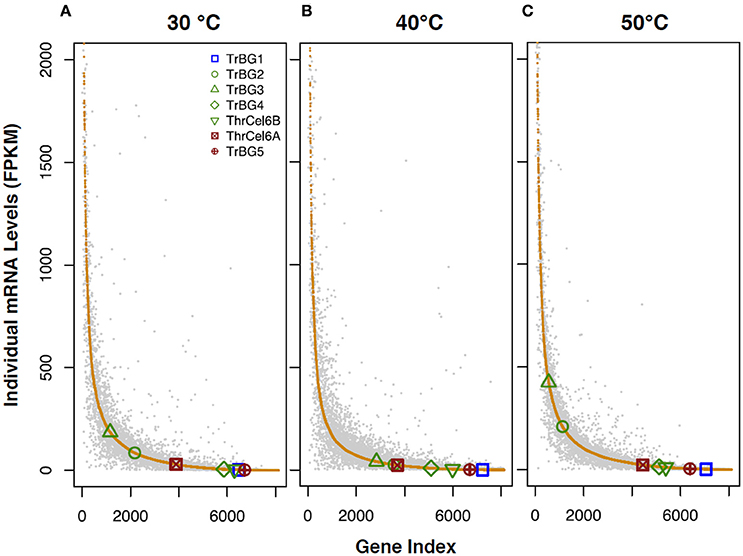
Figure 3. Illustration of the variation in transcription levels of T. rubra YIM 77501Tcultured in R2A-glucose (gray spots) and R2A-CMC (orange spots) media at different temperatures. T. rubra YIM 77501T was cultured at (A) 30°C, (B) 40°C, and (C) 50°C.
The genes expression profiles displayed remarkable differences when T. rubra was cultured at different temperatures in the same media (R2A-CMC or R2A-glucose). Comparing 30°C with 40°C, 4,473 genes (2,253 genes up-regulated and 2,220 genes down-regulated) were significant differentially expressed in R2A-CMC media and 3,894 genes (2,093 genes up-regulated and 1,801 genes down-regulated) were significant differentially expressed in R2A-glucose media. Comparing 30°C with 50°C, 4,918 genes (2,489 genes up-regulated and 2,429 genes down-regulated) were significant differentially expressed in R2A-CMC medium and 4,988 genes (2,510 genes up-regulated and 2,478 genes down-regulated) were significant differentially expressed in R2A-glucose medium. Comparing 40°C with 50°C, 4,293 genes (2,219 genes up-regulated and 2,074 genes down-regulated) were significant differentially expressed in R2A-CMC medium and 3,760 genes (1,805 genes up-regulated and 1,955 genes down-regulated) were significant differentially expressed in R2A-glucose medium (Figure S6A). The functions of these differentially expressed genes at different temperatures are mainly reflected in the biological process, cellular component, and molecular function (Figure S6B).
Comparing genes expression profiles of samples from R2A-CMC and R2A-glucose media at different temperatures, 3,398 genes (1,706 up-regulated genes and 1,692 down-regulated genes) were found at 30°C, 3,560 genes (1,929 up-regulated genes and down-regulated 1,631 genes) were found at 40°C, and 2,869 genes (1,412 up-regulated genes and 1,457 down-regulated genes) were found at 50°C. Among these differentially expressed genes at different temperatures, 1,278 genes were up- and down- regulated at all temperatures, and 732, 504, and 577 genes were specifically expressed at 30, 40, and 50°C, respectively (Figure 4, Figure S7). This also showed more genes were specific expression when T. rubra is cultured at 30 and 50°C than at 40°C.
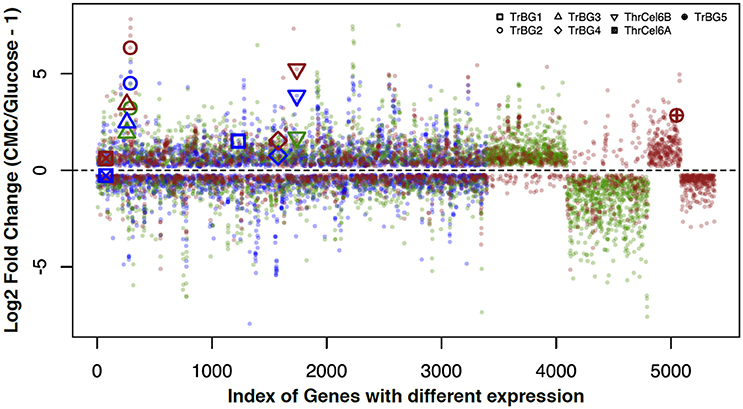
Figure 4. Correlation between the log2 fold changes of genes that were differentially expressed in response to CMC and Glucose at different temperature (30, 40, and 50°C). Genes that showed log2 fold change (CMC/Glucose-1) of > 0 or < 0 in the same culture temperature were included for comparison. Blue spots show cultures at 30°C; green spots show cultures at 40°C; red spots show cultures at 50°C.
Cloning, Expression, and Enzyme Activity of Up-Regulated Cellulases
TrBG2, TrBG3, TrBG4, ThrCel6B, TrBG1, TrBG5, and ThrCel6A were cloned and expressed in E. coli BL21. TrBG1, TrBG2, TrBG3, TrBG1, TrBG5, and ThrCel6A were purified (Figure S8) and their enzyme activities were tested (Figure S9). The kinetic parameters of these enzymes are shown in Table S5. The enzyme activities of TrBG4 was tested using crude enzymes. Based on experimental results, TrBG1, TrBG2, TrBG3, TrBG4, and TrBG5 showed β-glucosidase enzyme activity; ThrCel6A showed CMCase enzyme activity. The optimal temperatures of TrBG1, TrBG2, TrBG3, TrBG4, TrBG5, and ThrCel6A were 40, 60, 50, 60–70, 50–60, and 70°C, respectively. TrBG1 showed high relative enzyme activity at 30°C (~40%). TrBG2, TrBG3, and TrBG4 showed more than 20% relative enzyme activity at 30–50°C ThrCel6B cannot be expressed in E. coli (by expression vector). TrBG5 and ThrCel6A showed high relative enzyme activity at 50°C (~100 and 78%, respectively; Figure 5).
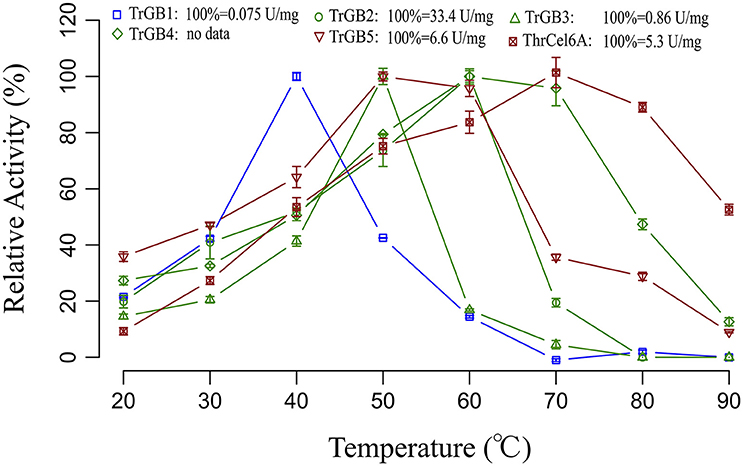
Figure 5. Thermo activity profiles for cellulases. Data points are initial rates of activity at a given temperature expressed as a proportion of the highest rate. The cellulase genes were up-regulated only at 30°C (blue); the cellulase genes were up-regulated at 30, 40 and 50°C (green); the cellulase genes were up-regulated only at 50°C (red). For TrBG1, 100% = 0.075 U/mg; TrBG2, 100% = 33.4 U/mg; TrBG3, 100% = 0.86 U/mg; TrBG4, no data; TrBG5, 100% = 6.6 U/mg; ThrCel6A, 100% = 5.3 U/mg. The error bars show the standard deviations from three measurements.
Comparing effects of temperatures on enzyme stability, TrBG1, TrBG2, TrBG3, TrBG4, TrBG5, and ThrCel6A kept more than 70% relative enzyme activity after incubating at 30 and 40°C for 6 h. TrBG2 and TrBG3 lost more than 50% relative enzyme activity after incubating at 50°C for 6 h, while TrBG1 and TrBG5 lost most enzyme activity (more than 80%) after incubating at 50°C for 3 h. These results revealed TrBG1 and TrBG5 may be unstable at 50°C in vitro. TrBG4 and ThrCel6A were stable (kept more than 90% relative enzyme activity) after incubating at 50°C for 6 h (Figure 6).
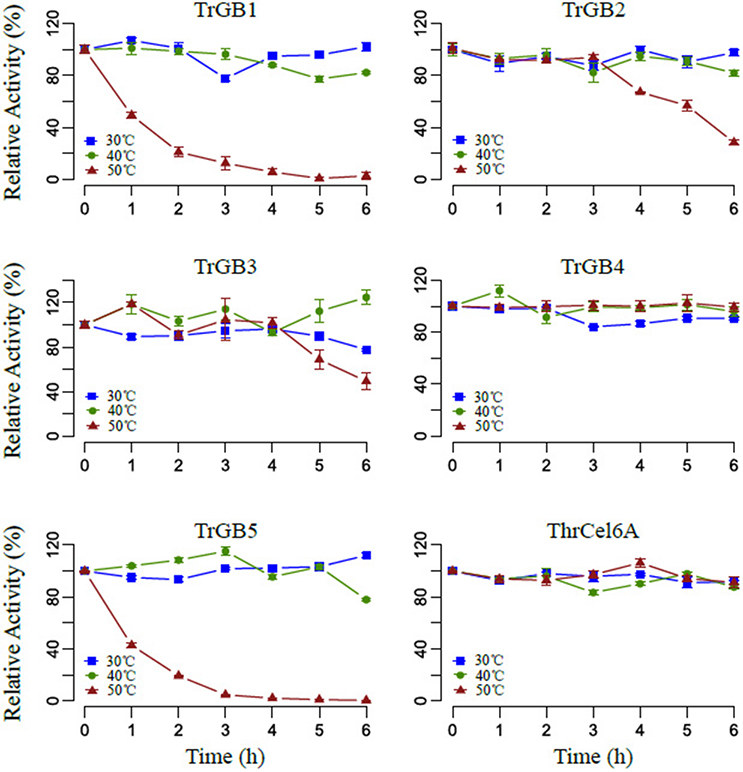
Figure 6. The effect of temperature on stability. Cellulases were incubated at temperatures 30°C (blue), 40°C (green), 50°C (red) for 0–6 h, and the remaining activities were assayed at optimal conditions. For TrBG1, 100% = 0.075 U/mg; TrBG2, 100% = 33.4 U/mg; TrBG3, 100% = 0.86 U/mg; TrBG4, no data; TrBG5, 100% = 6.6 U/mg; ThrCel6A, 100% = 5.3 U/mg. The error bars show the standard deviations from three measurements.
Discussion
Research has shown that some potential functions of microorganisms, such as degradation ability of carbon sources, implemented by special functional genes can be predicted based on genomic data analysis (Denger et al., 2006; Klippel et al., 2011; Wibberg et al., 2016). Numbers of genes encoding carbohydrate-active enzymes include more than 100 GHs were found in the genome of T. rubra, suggesting that this strain can convert cellulose as its own carbon source into biomass. Our results demonstrated that strain T. rubra has many choices of enzymes available to degrade cellulose at different temperatures.
Transcriptome analysis showed that temperature can affect the transcription of T. rubra. The clean reads of transcriptome sequencing displayed more reads were mapped to intergenic regions from the lower temperature to the higher temperature (30–50°C). The intergenic region may play a regulatory function in gene expression for some microorganisms (Beneke et al., 1995), e.g., lac operator. It demonstrated that some intergenic region sequences were increasingly transcribed with the rise of temperature, and they might regulate different gene expression to respond to temperatures. After transcriptome analysis, more genes showed high expression (FPKM > 60) when T. rubra was cultured both at 30 and 50°Ccompared with at 40°C. This could be attributed to 30 and 50°C being nearer the growth temperature range (28–60°C) of T. rubra (Zhou et al., 2012). Under the stress of lower or higher temperatures, microorganisms will overexpress some special proteins, such as cold shock proteins (CSPs) or heat shock proteins (HSPs), to protect themselves (Kondo and Inouye, 1994; Yin et al., 2012). In low temperature, secondary structures in mRNA would obstruct coupling processes of transcription and translation (El-Sharoud and Graumann, 2007). In E. coli, CSPs act as transcription anti-terminators or translational enhancers to destabilize RNA secondary structure (Nakaminami et al., 2006). Compared with culturing at 40 and 50°C, CSPs were up-regulated when T. rubra was cultured at 30°C (Figure S10A). This suggested that CSPs of T. rubra may function as an RNA chaperone to destabilize secondary structures and may be involved in regulating translation under lower temperatures. Heat shock proteins (HSPs) exist in all organisms and are important for stress tolerance (such as high temperature, oxidative, acid, and alkali stress) for microorganisms (Krajewski et al., 2014). When T. rubra was cultured at 50°C, HSP (dnaK) was up-regulated compared with culturing at 30 and 40°C (Figure S10B).
Comparing genes expression profiles when T. rubra was cultured at different temperatures, more genes were up-regulated at lower temperatures than higher temperatures (30°C > 40°C, 30°C > 50°C). These results indicated that T. rubra may need to express more genes to live at a lower temperature. Global transcriptome analysis of Lactococcus garvieae strains also found more up-regulated genes at 18°C than at 37°C (Aguado-Urda et al., 2013) and demonstrated that different temperatures induced various gene expression changes in T. rubra.
Not all cellulase genes of T. rubra expressed and up regulated in presence of CMC. It revealed that expression of some cellulase genes may need some special induced conditions and there may be expression of some cellulase genes under presence of other carbon source, like glucose. For Stachybotrys microsporeA19, carbon sources and the pH of the culture medium can direct a differential induction of various cellulases (such as endoglucanases and beta-glucosidases; Ben Hmad et al., 2014).
Temperature is an important environmental factor, and it determined the performance and stability of the enzyme used when utilizing a carbon source (Lin et al., 2016). For some microorganisms, temperature can affect the secretion of cellulases in the presence of cellulose substances, and this results in different cellulase enzyme activities at different temperatures (Sohail et al., 2009). T. fusca, as a thermophilic actinomycete, secretes thermo stable cellulolytic enzymes to digest cellulose at a high temperature (50°C) (Adav et al., 2011). Here, some cellulase genes were up-regulated by T. rubra when presented with CMC at all culture temperatures. In particular, other cellulase genes were up-regulated in just one temperature when presented with CMC. Based on the above-mentioned hypotheses, T. rubra used a hybrid strategy (combining the active strategy with the passive strategy) to utilize carbon sources at different temperatures. Comparing CMC cultures with glucose cultures, the expression of cellulase genes showed different patterns and levels at different temperatures. Four cellulase genes (TrBG2, TrBG3, TrBG4, and ThrCel6B) appeared to be up-regulated at three temperature conditions significantly, and one (TrBG1) and two (TrBG5 and ThrCel6A) cellulase genes were significantly up-regulated only at 30 and 50°C, respectively. Moreover, the expression levels of up-regulated cellulase genes (such as TrBG2, TrBG3, TrBG4, and ThrCel6B) at 30 and 50°Cwere higher than at 40°C. These results correspond with cellulase activity of culture supernatants (Figure S2) and reveal that T. rubra can regulate its cellulase gene expression during the process of utilizing carbon source at different temperatures.
The enzymatic properties analysis of these up-regulated cellulase genes that were cloned from T. rubra showed a variety of responses to temperature. TrBG2, TrBG3, and TrBG4 were up-regulated cellulase genes at 30, 40, and 50°C and were stable with more than 40% relative enzyme activity at 40°C. However, TrBG2 and TrBG3 had low activity (<30%) at 30°C and were not stable at 50°C after 6 h. Therefore, in light of evolution, extra cellulases may appear at lower temperatures (30°C) or higher temperatures (50°C). TrBG1is a special up-regulated cellulase gene at 30°C, and it has high (>50%) relative enzyme activity at 30°C. ThrCel6A is also a special up-regulated cellulase gene at 50°C and was stable at 50°C after 6 h. TrBG5 is a special up-regulated cellulase gene at 50°C, and its optimal temperature was 50°C. However, no signal peptide was predicted by using SignalP 4.1 Server (http://www.cbs.dtu.dk/services/SignalP/, Table S5) for TrBG5, and it is not as stable as ThrCel6A at 50°C. It almost lost enzyme activity after incubating at 50°C for 3 h in vitro (Figure 6). DnaK, a main HSP in bacteria (Flaherty et al., 1991), was up-regulated in T. rubra at 50°C (Figure S10B), and it may protect proteins including TrBG5 at high temperatures in vivo. The results of these regulations ensured an adequate supply of carbon source for the growth and reproduction of T. rubra. Transcriptome data and up-regulated cellulases properties were consistent with the cellulase activity of culture supernatants of strain T. rubra (Figure S2). Compared with the culture at 40°C, there were higher levels and extra up-regulated cellulase genes at 30 and 50°C. These extra up-regulated cellulase genes showed functional adaptation for 30 or 50°C.
Both enzymatic properties and gene expression levels of cellulases displayed adaption to temperature. The reason that higher levels and more numbers of cellulase genes were up-regulated at lower or higher temperatures may be explained by the effect of temperature to enzyme. As we know, temperature can affect the activity and stability of an enzyme (Pardo and Forchiassin, 1999). Most enzymes are stable in lower temperatures but have low enzyme activity. However, at higher temperature, they have higher enzyme activity and are not stable. When the enzymes perform biological functions, microorganisms need to balance the stability and activity of enzyme. The results of these regulations show that increased enzyme gene expression and up-regulated special enzyme genes at lower or higher temperatures may maintain biological functions of enzymes economically and efficiently for the microorganism at different temperatures. In addition to temperature, microorganisms can also change the expression of cellulase genes on other environmental factors, such as substrate, pH, and ions to utilize carbon source (Lynd et al., 2002; López-Contreras et al., 2004; Deng and Zhang, 2015; Hakkinen et al., 2015; Chen et al., 2016). The expression level of different cellulase genes can be changed by various substrates (López-Contreras et al., 2004). Ambient pH can regulate expression of cellulase and hemicellulase genes by the transcriptional regulator (PACI) for Trichoderma reesei (Hakkinen et al., 2015). After a long period of evolution and development, microorganisms have evolved diverse strategies to overcome the changing environment.
Over billions of years of evolution, microorganisms have created special strategies for environmental change. When a microorganism uses cellulose as a carbon source, cellulose induces several metabolic pathways (Adav et al., 2011). While, further research is needed for membrane transport and signal transduction, T. rubra YIM 77501T processes environmental information via different strategies to utilize carbon source at different temperatures.
Conclusions
To understand the strategies of carbon source acquisition, such as cellulose, in the environment at different temperatures for microorganisms, comparative transcriptomics of T. rubra grown with cellulose (CMC) and without cellulose (replace with glucose) at 30, 40, and 50°Cwere studied. The differences of the transcriptome analysis approach revealed that a hybrid strategy was used by T. rubra to utilize carbon sources at different temperatures. Higher levels and more numbers of cellulase genes were up-regulated at lower (30°C) or higher (50°C) temperatures than at a middle temperature (40°C). The enzymatic properties of up-regulated cellulase genes showed a variety of responses to temperature. Special up-regulated cellulases TrBG1 and ThrCel6A displayed temperature acclimation. These results may mean T. rubra has evolved an economical and efficient strategy to utilize carbon sources at different temperatures. This study provides genomic, transcriptomics, and experimental data useful for understanding how microorganisms respond to environmental changes and for their application in enhancing cellulose hydrolysis for animal feed and bioenergy production.
Author Contributions
WL, YY, and XZ designed research and project outline. YY, ZJ, and WX performed growth and genome sequencing. XZ, EZ, and FZ performed transcriptome sample preparation and sequencing. QH, LL, and WH provided the gene cloning, expression and purification of cellulases. ZM, FZ, and YY performed enzyme assays and protein assays. WL, YY, and XZ drafted the manuscript. All authors read and approved the final manuscript.
Conflict of Interest Statement
The authors declare that the research was conducted in the absence of any commercial or financial relationships that could be construed as a potential conflict of interest.
Acknowledgments
This work was supported by the Key Project of International Cooperation of Ministry of Science and Technology, China (MOST) (No. 2013DFA31980), the National Natural Science Foundation of China (Nos. 31470139 and 31560309), the Yunnan Provincial Natural Science Foundation (2013FA004) and the Leading Talent Program (L-201203) of Yunnan Province of China. WL was also supported by the Guangdong Province Higher Vocational Colleges and Schools Pearl River Scholar Funded Scheme (2014).
Supplementary Material
The Supplementary Material for this article can be found online at: http://journal.frontiersin.org/article/10.3389/fmicb.2017.00942/full#supplementary-material
References
Adav, S. S., Ng, C. S., and Sze, S. K. (2011). iTRAQ-based quantitative proteomic analysis of Thermobifida fusca reveals metabolic pathways of cellulose utilization. J. Proteomics 74, 2112–2122. doi: 10.1016/j.jprot.2011.05.038
Aguado-Urda, M., Gibello, A., Blanco Mdel, M., Fernández-Garayzábal, J. F., López-Alonso, V., and López-Campos, G. H. (2013). Global transcriptome analysis of Lactococcus garvieae strains in response to temperature. PLoS ONE 8:e79692. doi: 10.1371/journal.pone.0079692
Amundson, R. (2001). The carbon budget in soils. Annu. Rev. Earth Planet. Sci. 29, 535–562. doi: 10.1146/annurev.earth.29.1.535
Batjes, N. H. (1996). Total carbon and nitrogen in the soils of the world. Eur. J. Soil Sci. 47, 151–163. doi: 10.1111/j.1365-2389.1996.tb01386.x
Beneke, S., Bestgen, H., and Klein, A. (1995). Use of the Escherichia coli uidA gene as a reporter in Methanococcus voltae for the analysis of the regulatory function of the intergenic region between the operons encoding selenium-free hydrogenases. Mol. Gen. Genet. 248, 225–228. doi: 10.1007/BF02190804
Ben Hmad, I., Abdeljalil, S., Saibi, W., Amouri, B., and Gargouri, A. (2014). Medium initial pH and carbon source stimulate differential alkaline cellulase time course production in Stachybotrysmicrospora. Appl. Biochem. Biotechnol. 172, 2640–2649. doi: 10.1007/s12010-013-0705-1
Brunecky, R., Alahuhta, M., Xu, Q., Donohoe, B. S., Crowley, M. F., Kataeva, I. A., et al. (2013). Revealing nature's cellulase diversity: the digestion mechanism of Caldicellulosiruptor bescii CelA. Science 342, 1513–1516. doi: 10.1126/science.1244273
Chen, L., Zou, G., Wang, J., Wang, J., Liu, R., Jiang, Y., et al. (2016). Characterization of the Ca2+ -responsive signaling pathway in regulating the expression and secretion of cellulases in Trichoderma reesei Rut-C30. Mol. Microbiol. 100, 560–575. doi: 10.1111/mmi.13334
Chen, Y., He, Y., Zhang, B., Yang, J., Li, W., Dong, Z., et al. (2011). Complete genome sequence of Alicyclobacillus acidocaldarius strain Tc-4-1. J. Bacteriol. 193, 5602–5603. doi: 10.1128/JB.05709-11
Deng, Y., and Zhang, X. (2015). DtxR, an iron-dependent transcriptional repressor that regulates the expression of siderophore gene clusters in Thermobifida fusca. FEMS Microbiol. Lett. 362, 1–6. doi: 10.1093/femsle/fnu053
Denger, K., Smits, T. H., and Cook, A. M. (2006). Genome-enabled analysis of the utilization of taurine as sole source of carbon or of nitrogen by Rhodobacter sphaeroides 2.4.1. Microbiology 152, 3197–3206. doi: 10.1099/mic.0.29195-0
Dhar, H., Kasana, R. C., Dutt, S., and Gulati, A. (2015). Cloning and expression of low temperature active endoglucanase EG5C from Paenibacillus sp. IHB B 3084. Int. J. Biol. Macromol. 81, 259–266. doi: 10.1016/j.ijbiomac.2015.07.060
El-Sharoud, W. M., and Graumann, P. L. (2007). Cold shock proteins aid coupling of transcription and translation in bacteria. Sci. Prog. 90, 15–27. doi: 10.3184/003685007780440549
Finn, R. D., Clements, J., and Eddy, S. R. (2011). HMMER web server: interactive sequence similarity searching. Nucleic Acids Res. 39, W29–W37. doi: 10.1093/nar/gkr367
Flaherty, K. M., McKay, D. B., Kabsch, W., and Holmes, K. C. (1991). Similarity of the three-dimensional structures of actin and the ATPase fragment of a 70-kDa heat shock cognate protein. Proc. Natl. Acad. Sci. U.S.A. 88, 5041–5045. doi: 10.1073/pnas.88.11.5041
Gilbert, H. J., Stalbrand, H., and Brumer, H. (2008). How the walls come crumbling down: recent structural biochemistry of plant polysaccharide degradation. Curr. Opin. Plant Biol. 11, 338–348. doi: 10.1016/j.pbi.2008.03.004
Gu, S., Fang, L., and Xu, X. (2013). Using SOAPaligner for short reads alignment. Curr. Protoc. Bioinformatics 44, 11.11.1–17. doi: 10.1002/0471250953.bi1111s44
Hakkinen, M., Sivasiddarthan, D., Aro, N., Saloheimo, M., and Pakula, T. M. (2015). The effects of extracellular pH and of the transcriptional regulator PACI on the transcriptome of Trichoderma reesei. Microb. Cell Fact. 14:63. doi: 10.1186/s12934-015-0247-z
Harnpicharnchai, P., Champreda, V., Sornlake, W., and Eurwilaichitr, L. (2009). A thermotolerant beta-glucosidase isolated from an endophytic fungi, Periconia sp., with a possible use for biomass conversion to sugars. Protein Expr. Purif. 67, 61–69. doi: 10.1016/j.pep.2008.05.022
Jorge-Villar, S. E., and Edwards, H. G. (2013). Microorganism response to stressed terrestrial environments: a Raman spectroscopic perspective of extremophilic life strategies. Life 3, 276–294. doi: 10.3390/life3010276
Klippel, B., Lochner, A., Bruce, D. C., Davenport, K. W., Detter, C., Goodwin, L. A., et al. (2011). Complete genome sequence of the marine cellulose- and xylan-degrading bacterium Glaciecola sp. strain 4H-3-7+YE-5. J. Bacteriol. 193, 4547–4548. doi: 10.1128/JB.05468-11
Kondo, K., and Inouye, M. (1994). Cold shock response of microorganism. Tanpakushitsu Kakusan Koso 39, 818–827.
Krajewski, S. S., Joswig, M., Nagel, M., and Narberhaus, F. (2014). A tricistronic heat shock operon is important for stress tolerance of Pseudomonas putida and conserved in many environmental bacteria. Environ. Microbiol. 16, 1835–1853. doi: 10.1111/1462-2920.12432
Langmead, B., and Salzberg, S. L. (2012). Fast gapped-read alignment with Bowtie 2. Nat. Methods 9, 357–359. doi: 10.1038/nmeth.1923
Li, R., Li, Y., Kristiansen, K., and Wang, J. (2008). SOAP: short oligonucleotide alignment program. Bioinformatics 24, 713–714. doi: 10.1093/bioinformatics/btn025
Lin, Q., He, G., Rui, J., Fang, X., Tao, Y., Li, J., et al. (2016). Microorganism-regulated mechanisms of temperature effects on the performance of anaerobic digestion. Microb. Cell Fact. 15, 96. doi: 10.1186/s12934-016-0491-x
Liu, S. Y., Shibu, M. A., Jhan, H. J., Lo, C. T., and Peng, K. C. (2010). Purification and characterization of novel glucanases from Trichoderma harzianum ETS 323. J. Agric. Food Chem.58, 10309–10314. doi: 10.1021/jf1029338
López-Contreras, A. M., Gabor, K., Martens, A. A., Renckens, B. A., Claassen, P. A., Van Der Oost, J., et al. (2004). Substrate-induced production and secretion of cellulases by Clostridium acetobutylicum. Appl. Environ. Microbiol. 70, 5238–5243. doi: 10.1128/AEM.70.9.5238-5243.2004
Lynd, L. R., Weimer, P. J., van Zyl, W. H., and Pretorius, I. S. (2002). Microbial cellulose utilization: fundamentals and biotechnology. Microbiol. Mol. Biol. Rev. 66, 506–577. doi: 10.1128/MMBR.66.3.506-577.2002
Miller, G. L. (1959). Use of dinitrosalicylic acid reagent for determination of reducing sugar. Anal. Chem. 31, 426–428. doi: 10.1021/ac60147a030
Nakaminami, K., Karlson, D. T., and Imai, R. (2006). Functional conservation of cold shock domains in bacteria and higher plants. Proc. Natl. Acad. Sci. U.S.A. 103, 10122–10127. doi: 10.1073/pnas.0603168103
Pardo, A. G., and Forchiassin, F. (1999). Influence of temperature and pH on cellulase activity and stability in Nectria catalinensis. Rev. Argent. Microbiol. 31, 31–35.
Petit, E., Coppi, M. V., Hayes, J. C., Tolonen, A. C., Warnick, T., Latouf, W. G., et al. (2015). Genome and Transcriptome of Clostridium phytofermentans, catalyst for the direct conversion of plant feedstocks to fuels. PLoS ONE 10:e0118285. doi: 10.1371/journal.pone.0118285
Sohail, M., Siddiqi, R., Ahmad, A., and Khan, S. A. (2009). Cellulase production from Aspergillus niger MS82: effect of temperature and pH. N. Biotechnol.25, 437–441. doi: 10.1016/j.nbt.2009.02.002
Teather, R. M., and Wood, P. J. (1982). Use of Congo red-polysaccharide interactions in enumeration and characterization of cellulolytic bacteria from the bovine rumen. Appl. Environ. Microbiol. 43, 777–780.
Trapnell, C., Pachter, L., and Salzberg, S. L. (2009). TopHat: discovering splice junctions with RNA-Seq. Bioinformatics 25, 1105–1111. doi: 10.1093/bioinformatics/btp120
Wang, L., Feng, Z., Wang, X., Wang, X., and Zhang, X. (2010). DEGseq: an R package for identifying differentially expressed genes from RNA-seq data. Bioinformatics 26, 136–138. doi: 10.1093/bioinformatics/btp612
Wibberg, D., Al-Dilaimi, A., Busche, T., Wedderhoff, I., Schrempf, H., Kalinowski, J., et al. (2016). Complete genome sequence of Streptomyces reticuli, an efficient degrader of crystalline cellulose. J. Biotechnol. 222, 13–14. doi: 10.1016/j.jbiotec.2016.02.002
Wu, D., Hugenholtz, P., Mavromatis, K., Pukall, R., Dalin, E., Ivanova, N. N., et al. (2009). A phylogeny-driven genomic encyclopaedia of bacteria and archaea. Nature 462, 1056–1060. doi: 10.1038/nature08656
Yang, F., Yang, X., Li, Z., Du, C., Wang, J., and Li, S. (2015). Overexpression and characterization of a glucose-tolerant beta-glucosidase from T. aotearoense with high specific activity for cellobiose. Appl. Microbiol. Biotechnol. 99, 8903–8915. doi: 10.1007/s00253-015-6619-9
Yin, H., Tang, M., Zhou, Z., Fu, X., Shen, L., Liang, Y., et al. (2012). Distinctive heat-shock response of bioleaching microorganism Acidithiobacillus ferrooxidans observed using genome-wide microarray. Can. J. Microbiol. 58, 628–636. doi: 10.1139/w2012-023
Yin, Y. R., Zhang, F., Hu, Q. W., Xian, W. D., Hozzein, W. N., Zhou, E. M., et al. (2015). Heterologous expression and characterization of a novel halotolerant, thermostable, and alkali-stable GH6 endoglucanase from Thermobifida halotolerans. Biotechnol. Lett. 37, 857–862. doi: 10.1007/s10529-014-1742-8
Keywords: Thermoactinospora rubra, transcriptome, up-regulated cellulases, hybrid strategy, carbon source, different temperatures
Citation: Yin Y-R, Meng Z-H, Hu Q-W, Jiang Z, Xian W-D, Li L-H, Hu W, Zhang F, Zhou E-M, Zhi X-Y and Li W-J (2017) The Hybrid Strategy of Thermoactinospora rubra YIM 77501T for Utilizing Cellulose as a Carbon Source at Different Temperatures. Front. Microbiol. 8:942. doi: 10.3389/fmicb.2017.00942
Received: 01 February 2017; Accepted: 10 May 2017;
Published: 29 May 2017.
Edited by:
Baolei Jia, Chung-Ang University, South KoreaReviewed by:
Angel Angelov, Technische Universität München, GermanyAnandham Rangasamy, Tamil Nadu Agricultural University, India
Guangyu Yang, Shanghai Jiao Tong University, China
Copyright © 2017 Yin, Meng, Hu, Jiang, Xian, Li, Hu, Zhang, Zhou, Zhi and Li. This is an open-access article distributed under the terms of the Creative Commons Attribution License (CC BY). The use, distribution or reproduction in other forums is permitted, provided the original author(s) or licensor are credited and that the original publication in this journal is cited, in accordance with accepted academic practice. No use, distribution or reproduction is permitted which does not comply with these terms.
*Correspondence: Xiao-Yang Zhi, xyzhi@ynu.edu.cn
Wen-Jun Li, liwenjun3@mail.sysu.edu.cn
†These authors have contributed equally to this work.