 Ed W. J. van Niel
 Basti Bergdahl†
 Bärbel Hahn-Hägerdal
- Division of Applied Microbiology, Lund University, Lund, Sweden
Most fermentative microorganisms grow well-under anaerobic conditions managing a balanced redox and appropriate energy metabolism, but a few species do exist in which cells have to cope with inadequate energy recovery or capture and/or redox balancing. Two cases of these species, i.e., the metabolically engineered Saccharomyces cerevisiae enabling it to ferment xylose and Lactobacillus reuteri fermenting glucose via the phosphoketolase pathway, are here used to introduce a quantification parameter to capture what limits the growth rate of these microorganisms under anaerobic conditions. This dimensionless parameter, the cofactor formation flux ratio (RJ), is the ratio between the redox formation flux (JNADH+NADPH), and the energy carrier formation flux (JATP), which are mainly connected to the central carbon pathways. Data from metabolic flux analyses performed in previous and present studies were used to estimate the RJ-values. Even though both microorganisms possess different central pathways, a similar relationship between RJ and the specific growth rate (μ) was found. Furthermore, for both microorganisms external electron acceptors moderately reduced the RJ-value, thereby raising the μ accordingly. Based on the emerging profile of this relationship an interpretation is presented suggesting that this quantitative analysis can be applied beyond the two microbial species experimentally investigated in the current study to provide data for future targeted strain development strategies.
Introduction
In intracellular metabolism redox reactions stand central. Many of these reactions are mediated by the cofactors NADH, NADPH, and ATP. There are connections between these co-factors through a complex metabolic interplay and the cell seeks to balance their levels to reach homeostasis (e.g., Holm et al., 2010). Even though NADH and NADPH are usually seen as carriers of reducing power, they can also be considered as energy currencies, like ATP (Alberts et al., 2014). Under aerobic and anaerobic respiration the strong reducing power of NAD(P)H can be converted to ATP by means of an electron transport chain and proton motive force (pmf). This is vital because NAD(P)H needs to be constantly reoxidized to ensure maintenance of metabolic fluxes. Under fermentative conditions, NADH is reoxidized via an organic electron acceptor often provided through the glycolysis, such as pyruvate and acetyl-CoA. In the majority of fermentative microorganisms, the redox and energy balances can reach homeostatic consensus. However, there are examples of anaerobic metabolism where redox imbalance is clearly seen to affect cell growth. Two such cases will be described in this paper in greater detail.
The first case is the longstanding quest to enable yeast to ferment pentoses, with the purpose to have a cost-effective conversion into ethanol from lignocellulosic substrates (Sassner et al., 2008; Moysés et al., 2016). Many metabolic engineering attempts have been made to implement an efficient xylose pathway in Saccharomyces cerevisiae that was recently summarized in relation to fermentation of industrial raw material (Sànchez Nogué and Karhumaa, 2015). Like in natural xylose-metabolizing yeasts, these engineered strains cannot (properly) grow anaerobically on xylose. Especially, the xylose pathway consisting of two redox-mediated enzymes, i.e., xylose reductase (XR) and xylitol dehydrogenase (XDH), is hampered with a redox imbalance. This is due to XR being predominantly NADPH-dependent while the XDH is exclusively NAD+-dependent (Figure S1). The NADPH-dependent XR has been engineered to increase the affinity for NADH, but the introduction of such a variant into S. cerevisiae is not sufficient to enable anaerobic growth on xylose as sole carbon source (Bengtsson et al., 2009), thus it required additional metabolic and evolutionary engineering to accomplish that (Runquist et al., 2009, 2010). Similarly, the alternative strategy to implement a fungal xylose isomerase (XI) to avoid the redox problem displayed anaerobic growth of S. cerevisiae on xylose only after several rounds of extensive evolutionary engineering (Kuyper et al., 2004; Kikuta, 2013). The nature of the evolved metabolism has to the best of our knowledge not been disclosed in the public domain. A study has been carried out to visualize specifically the underlying problem using the strain C1 that had evolved as a subpopulation in an anaerobic culture on xylose under carbon-limitation pressure (Sonderegger et al., 2004). The main conclusion, based on metabolic flux analysis and acetoin as external NADH sink, was that absence of anaerobic growth was not determined by the redox balance alone, but also by a limited ATP formation flux, and most importantly, that both are interrelated.
The second case is the intriguing natural metabolism of the lactic acid bacterium Lactobacillus reuteri displaying a heterofermentative profile. Investigating the reason why L. reuteri ATCC 55730, when grown on glucose, produced more lactate than C2-byproducts (acetate and ethanol), it was found that the central carbon metabolism consists of simultaneous operation of the Phosphoketolase pathway (PKP) and the Embden-Meyerhof-Parnas pathway (EMP; Figure S2, Årsköld et al., 2008). The latter functions only at a minor flux (about 30% of the total carbon-flux), which might for a part be due to a crippled EMP: the pfkA gene is missing, but instead the cell can express one or both minor PFK genes (lr0160 and lr0378) that are similar to the pfkB gene of Escherichia coli. In this case, growth on glucose was not limited by the ATP-formation flux, because in the presence of an external electron acceptor, as NADH sink, the ATP-formation flux did not improve, even though the growth rate had increased nearly 2-fold (Årsköld et al., 2008). It was concluded from these two studies that somehow in both microorganisms redox imbalance imposes a higher demand for ATP. The question as to why L. reuteri requires to run a dual central carbon pathway instead of the PKP alone remained unanswered.
In the current paper, a direction to a possible answer is formulated. The determinants behind the described anaerobic growth restriction are proposed in the form of kinetics instead of stoichiometry through a relation between the redox formation flux and the energy carrier formation flux. For this, a dimensionless parameter is introduced, i.e., the NAD(P)H/ATP formation flux ratio, and its graphical relationship with the rate of anaerobic growth of S. cerevisiae on xylose and L. reuteri on glucose is investigated.
Materials and Methods
Microorganisms and Culture Media
The growth data of the various S. cerevisiae strains were obtained elsewhere (Table 1): strain TMB 3001 is a haploid CEN.PK117 strain harboring the integrated genes YYL1 and XYL2 encoding the Pichia stipitis xylose reductase and xylitol dehydrogenase, respectively, and the endogenous XKS gene encoding xylulokinase (Wahlbom and Hahn-Hägerdal, 2002); strain C1, an evolved mutant of TMB3001 (Sonderegger et al., 2004); strain 3415 harbors the xylose pathway with a mutated XYL1 (K270R) gene and overexpresses genes encoding the enzymes of the non-oxidative pentose phosphate pathway [transaldolase (TAL), transketolase (TKL), ribose 5-phosphate ketol-isomerase (RKI), and ribulose 5-phosphate epimerase (RPE)] (Runquist et al., 2009); and strains TMB 3420 (selected population), TMB 3421 and TMB 3422 harboring mutated XYL1 (N272D/P275Q) and XYL1 (N272D), respectively (Runquist et al., 2010).
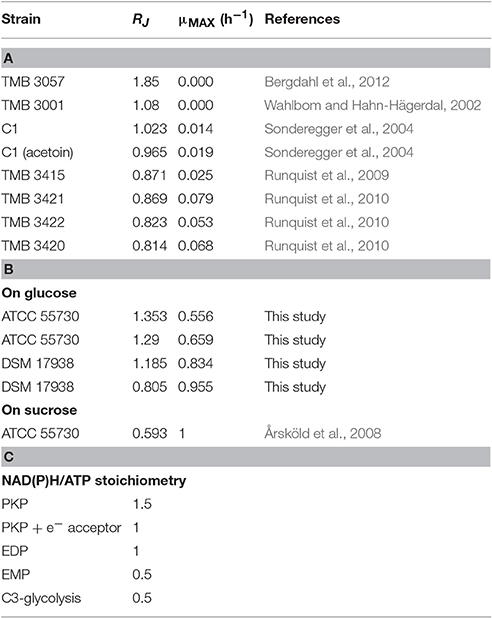
Table 1. (A) Cofactor formation flux ratio (RJ) and corresponding specific growth rates of Saccharomyces cerevisiae strains on xylose; (B) Cofactor formation flux ratio and corresponding normalized specific growth rates of Lactobacillus reuteri strains on glucose or sucrose; (C) Stoichiometry of redox over energy carrier ratios of various catabolic pathways in yeast and mesophilic prokaryotes under fermentative conditions.
For the model plots of the cofactor formation flux ratio and growth rate the details on the cultivation conditions of S. cerevisiae TMB 3057 containing the XR/XDH pathway are described by Bergdahl et al. (2012). In short, the dynamics of the concentrations of a number of intracellular metabolites were monitored by LC-MS/MS in a culture in transit from glucose to xylose metabolism, which also includes the purine nucleotides and redox factors.
The data of the non-engineered type strain L. reuteri ATCC 55730 growing on sucrose were obtained as described elsewhere (Årsköld et al., 2008) and growth on glucose was acquired in the current study. L. reuteri DSM 17938, the cured strain of L. reuteri ATCC 55730 (Rosander et al., 2008), was obtained from BioGaia AB, Stockholm, Sweden. Both strains were routinely anaerobically cultured in MRS (Merck, Darmstadt, Germany) at 37°C in 50 mL tubes (Sarstedt, Nümbrecht, Germany) and the cells were spun down at 4,000 g and kept in 1.5 mL cryovials in MRS supplemented with 10% (v/v) glycerol and stored at −80°C. Precultures inoculated from the cryovials were grown 12 h at 37°C in MRS and a 5% (v/v) inoculum was transferred to SD4, i.e., a semi-defined medium (Levander et al., 2001) with the following additions to the medium (g·L−1): NaAc 0.5, MnCl2·2H2O 0.013, L-glutamine 0.20, and glucose 25. Subsequently, an outgrown culture was used as inoculum (5% v/v) to start 1 L batch-mode cultures in a 2-L pH-controlled Biostat A bioreactor (B. Braun Biotech International, Melsungen, Germany) kept thermostatically at 37°C. The pH was kept at 5.5 through automatic titration with 3 M KOH. The stirring speed was set to 100 rpm. Anaerobic conditions were maintained by the production of carbon dioxide in the culture. Sample treatment and analysis was similar as described previously (van Niel et al., 2012).
Metabolic Flux Analysis
For both cases, the metabolic flux analyses were done for batch cultures during the exponential growth phase. The metabolic fluxes through the central carbon pathways operating during anaerobic growth on (i) glucose and xylose in S. cerevisiae and (ii) glucose and sucrose in L. reuteri were estimated based on stoichiometric models as described in Sonderegger et al. (2004) and Årsköld et al. (2008), respectively. For S. cerevisiae the metabolic flux model contained eleven intracellular reactions and five fluxes exchanged with the medium (Table S1), including the glycolysis, pentose phosphate pathway, pyruvate metabolism, and citric acid cycle. For L. reuteri the metabolic flux model contained four intracellular reactions and four or five extracellular fluxes, including the PKP, the EMP, pyruvate and acetyl-P metabolism, and the reduction of fructose. The specific consumption and specific production of each metabolite (Y) were estimated during the exponential phase of batch cultures (mmol metabolite· g dry weight−1). The fluxes (r) (Table S2) were calculated by multiplying the specific production with the maximum specific growth rate: r = μMAX·Y. Both flux models were solved in MATLAB R2012b (Mathworks, USA). For S. cerevisiae the ATP formation fluxes were calculated from the fluxes through glyceraldehyde-3-phosphate (GAPDH) to pyruvate pathway and the acetate pathway, and the NAD(P)H formation fluxes were calculated from the fluxes through the xylose pathway, oxidative pentose phosphate pathway, GAPDH, and the acetate pathway. For L. reuteri the ATP formation fluxes were calculated from the fluxes to acetate and lactate, whereas the NAD(P)H formation fluxes were calculated from the PKP flux and the flux through GAPDH.
Model Simulations
The flux distribution among intracellular reactions in S. cerevisiae was simulated using the COBRA toolbox in MATLAB R2012b (Mathworks, USA). The genome-scale metabolic model iMM904 (Mo et al., 2009) was updated to generate better predictions of flux distributions during anaerobic glucose and xylose fermentation at steady state. The modifications made to the model included inactivation of genes know to be suppressed during anoxic conditions, revision of the biosynthetic pathways of amino acids, and addition of new reactions that describe the need for FADH2 during protein folding in the endoplasmic reticulum. The new model was named iBB912 and contained 912 genes that described 1,102 reactions. Simulated data were generated using a modified version of the dFBA function in the COBRA toolbox. The modifications made in the function were added to allow the use of rate equations for glucose and xylose uptake, glycerol production, and an empirical equation describing the relative flux between the XR:NADH and XR:NADPH reactions (Equations 1–4). The parameters in the rate equations (Table S3) were adjusted to give an accurate description of the fermentation profiles of extracellular metabolites (Figures S3A,B) obtained in a previous study of xylose fermentation (Bergdahl et al., 2012). In the final model, the non-growth-associated maintenance (NGAM) and the growth-associated maintenance (GAM) were set to 0.00907 mmol ATP g−1 h−1 and 53 mmol ATP g−1 h−1, respectively. The kinetic equations set the constraints of the flux model and fluxes were calculated using flux balance analysis. The calculated fluxes were used to update the extracellular concentrations after 0.25 h and new constraints were calculated using the kinetic equations. After simulating a total of 40 h, all intracellular reactions in which nadh[c], nadph[c], or atp[c] were produced at any time point, were identified. For each of the three metabolites, the total production flux was calculated by adding together the fluxes of the individual reactions at every time point. The calculated production fluxes, i.e., RNADH, RNADPH, and RATP, were used to calculate the RJ at every time point of the simulation.
Results
Introduction of the NAD(P)H/ATP Formation Flux Ratio
As the previous studies imply, anaerobic growth of both S. cerevisiae on xylose and L. reuteri on glucose are in one way or another determined by a cellular redox imbalance combined with a limited ATP-formation flux (Sonderegger et al., 2004; Årsköld et al., 2008). It has been argued that these two factors are highly interrelated, hence they should be captured by a parameter that reflects the state of the cell as such. In addition, the specific growth rate should be directly linked to this parameter. Even though the cells undergo a redox burden, a parameter containing any combinations of NAD(P)H or ATP formation and consumption fluxes will not work, since formation and consumption fluxes will cancel each other out on the metabolic map. Moreover, consumption fluxes, especially those for NADPH and ATP are less traceable as many reactions are involved that cannot be satisfactorily quantified individually. What remains are the formation fluxes of NADPH, NADH, and ATP that mainly take place in the central carbon pathways. The two cases in this study, upon which the proposed parameter is based, have both substantial NADPH formation next to NADH formation in the main catabolic pathways. To take account for this, the fluxes of these two redox cofactors are added together to give the overall redox cofactor formation flux [JNAD(P)H]. With the energy carrier formation flux (JATP) we propose to express their interrelationship as a dimensionless quantification parameter, i.e., the cofactor formation flux ratio:
with both fluxes having the unit mmol·g dry weight−1·h−1. The relationship of this parameter with the growth rate will now be analyzed for the two cases presented.
Case 1: Anaerobic Growth of S. cerevisiae on Xylose
The long track record of engineering the xylose conversion pathway in S. cerevisiae provides a series of strains with successive improvements of anaerobic growth on xylose (Table 1A). Strains TMB 3001 and TMB 3057 fermented xylose without any measurable growth (Eliasson et al., 2000; Bergdahl et al., 2012), whereas strains C1, TMB 3415, TMB 3420, TMB 3421, and TMB 3422 displayed measurable growth rates (Sonderegger et al., 2004; Runquist et al., 2009, 2010). It was observed that by adding an external electron acceptor (acetoin) to cultures of strain C1 the growth rate increased by 36% and the RJ-value decreased accordingly (Table 1A). Each of these studies contained sufficient data to estimate the metabolic fluxes through the central carbon pathways and allowed to estimate values for RJ, revealing that several of them are above 1.0, with strains having a RJ-value of ca. 0.81 displaying measurable growth (Table 1A). Unfortunately, the maximum anaerobic specific growth rate on xylose is not known, but a rough value was calculated as follows. Maximum specific growth rates of S. cerevisiae on glucose aerobically: anaerobically = 1: 0.66, as estimated from data of Petersson et al. (2006) and Verduyn et al. (1990). Thus in analogy, the anaerobic maximum specific growth on xylose was assumed to be 0.66 × aerobic specific growth rate on xylose (0.21–0.28 h−1, Jeppsson et al., 2003) or 0.16 ± 0.033 h−1. The corresponding RJ-value (0.529) is based on absence of a redox imbalance (no acetate formation, minimum flux through the oxidative PPP and maximum flux to ethanol). In contrast, at high RJ-values cellular metabolism lacks capacity for growth. Interestingly, plotting the discrete values of RJ against the corresponding maximum specific growth rate revealed a sigmoidal profile (Figure 1A).
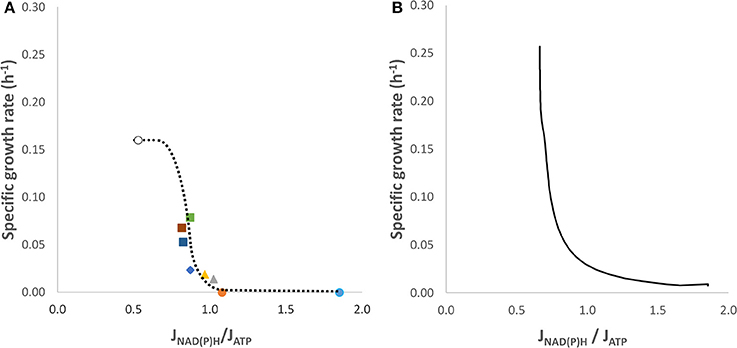
Figure 1. Relationship between the cofactor formation flux ratio and the specific growth rate of various S. cerevisiae constructs growing anaerobically on xylose. (A) These data points were calculated from various publications (Table 1A; i.e., starting from the right dot to the left): ( ) strain TMB3057 (Bergdahl et al., 2012), (
 ) strain TMB 3001, (Wahlbom and Hahn-Hägerdal, 2002); strain C1 without (
 ) and with acetoin (
 ), (Sonderegger et al., 2004); strain TMB 3415 (Runquist et al., 2009) (
 ); strain TMB 3421 (
 ), strain TMB 3422 (
 ), and strain 3420 (
 ) (Runquist et al., 2010). The ideal case (o), i.e., the anaerobically maximum specific growth on xylose has not been established yet, instead a guestimated value is presented here. (B) Relationship between the cofactor formation flux ratio and the specific growth rate during the transition from anaerobic glucose/xylose to exclusive xylose metabolism in an anaerobic culture of S. cerevisiae TMB3057 as described in Bergdahl et al. (2012).
A later study (Bergdahl et al., 2012) aimed to capture the dynamics of intracellular metabolite concentrations in a S. cerevisiae TMB 3057 culture shifting its metabolism from glucose to xylose fermentation. The established data set allowed to simulate this transition accurately for biomass production, and glucose and xylose consumption (Figures S3A,B). The model generated a continuous line of the transition of the maximum specific growth rate on glucose to an almost zero growth rate on xylose (Figure S3C) as well as the change in RJ (Figure S3D) and the relationship between RJ and the specific growth rate (Figure 1B). The value of RJ changed from 0.66 (with glucose plus xylose), at which the growth rate was maximal, to 1.85 (only xylose; Table 1) where growth had nearly ceased. During the shift glucose and xylose were taken up and metabolized simultaneously, after which the xylose metabolism became gradually more dominant as the glucose approached complete consumption (at t = 21 h, Figure S3B). This simulation illustrates the gradual transition of the RJ from the full growth to the non-growth situation very well. Note that the profiles in Figures 1A,B are very similar, however, the former is based on fermentation xylose alone, whereas in the latter glucose and xylose were converted simultaneously during the shift (compare Figure S3B with Figure S3D).
Case 2: Anaerobic Growth of L. reuteri on Glucose
In this case, several natural strains are involved, each possessing its own maximum specific growth rate. Therefore, the specific growth rate was normalized for construction of the growth vs. RJ plot. Part of the data originated from a L. reuteri ATCC 55370 culture on sucrose (Årsköld et al., 2008) and on glucose (this study) and a part from L. reuteri DSM 17938 cultures on glucose (this study; Table 1B). For this organism the fructose half of sucrose functions only as an external electron acceptor, therefore higher growth rates are obtained for cultures on sucrose than for cultures on glucose and concomitantly the RJ-value declines accordingly, like for S. cerevisiae on xylose and acetoin. Plotting the RJ against the corresponding specific growth rate again suggests a sigmoidal profile even though there is a lack of data at the low growth rates (Figure 2). Therefore, we added a theoretical point for the case there is a 100% flux through the PKP, and no flux through the EMP pathway, at which the value of RJ should become 1.5 and our expectation is that the specific growth rate will be close to zero (Figure 2).
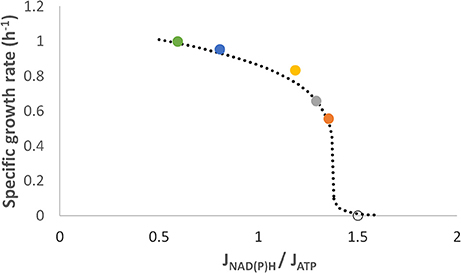
Figure 2. Relationship between the cofactor formation flux ratio and the normalized specific growth rate of various L. reuteri strains growing anaerobically. These data points were calculated from (left to right): ( ) strain ATCC 55730 on sucrose (Årsköld et al., 2008), (
 ,
,  ) strain DSM 17938 on glucose (this study) and (
 ,
,  ) strain ATCC 55730 on glucose (this study). No growth (o) is assumed to be in the case there is zero flux through the EMP (100% flux through the PKP) and thus the RJ is equal to 1.5 (Table 1C).
Discussion
In this paper, we introduce a dimensionless parameter to quantify a physiological phenomenon that has been observed in some microorganisms under anaerobic conditions, of which one is the xylose metabolism manufactured in S. cerevisiae by metabolic engineering and the other is glucose metabolism in L. reuteri. This parameter is a ratio between the formation fluxes of redox carriers and energy carrier and is thus based on the kinetics rather than the stoichiometry of the reactions. This parameter (RJ) was logically built on the conclusion of a previous study that a combination of redox imbalance and a limited ATP formation flux forces metabolically active cells of S. cerevisiae on xylose to meander close to the edge of propagation (Sonderegger et al., 2004). A sigmoidal correlation between RJ and the specific growth rate was substantiated through plotting new and old data of two cases, i.e., S. cerevisiae fermenting xylose and L. reuteri fermenting glucose (Figures 1A, 2). The excellent match between the continuous line generated in the simulation of the metabolism of a single strain (Figure 1B) with the profile that emerged from plotting discrete datapoints of various strains (Figure 1A) gives weight to apply RJ for describing the metabolic state of the cell under such confined growth.
In the case of anaerobic cultures of metabolically engineered S. cerevisiae strains on xylose, cells are continuously consuming the sugar, thereby maintaining their high energy charge, but still keeping them in a state of restrictive growth (Bergdahl et al., 2012). A perpetual process enrolls in which energy extracted in the fermentation of xylose is used in a futile correction of the redox imbalance, which is similar to the uncoupling of energy metabolism and anion accumulation in cells when exposed to weak acids at low pH (Russell, 1992). The existence of both the redox imbalance and lack of sufficient ATP formation are inherent to the creation of the xylose metabolism in these engineered strains. The moderately mitigation of the redox imbalance through addition of an external electron acceptor increased the growth rate and lowered the RJ-value accordingly (Table 1A).
In the case of L. reuteri growth on glucose allows a fair growth rate, most probably due to that this microorganism possesses two simultaneously operating central carbon pathways as a way to partially alleviating the redox burden while acquiring an improved ATP formation flux as well. Again as for xylose metabolizing S. cerevisiae, this can be further mended by adding an external electron acceptor, leading to both higher growth rate and cell yield (Årsköld et al., 2008): the growth rate on sucrose (the fructose part acted as the external electron acceptor) was 1.82-fold higher than the growth rate on glucose. As expected, the corresponding RJ-value for the sucrose-grown cells was seen to decrease substantially (Table 1B). The same can be said for Leuconostoc oenos that can use citrate as an electron acceptor. As it relies entirely on the PKP as its central carbon pathway, its growth rate is at the very low, i.e., 0.087 and 0.038 h−1 with and without citrate, respectively (Salou et al., 1994). The corresponding RJ-values were 1.12 and 1.32, respectively, as estimated from the graphical information given in their paper.
Does this phenomenon relate to growth at near-zero growth rates? There has been a renewed interest in microbial physiology of anaerobically growing microorganisms, both prokaryotes and eukaryotes at near-zero to zero growth rates (Goffin et al., 2010; Boender et al., 2011). One approach is by using rentostats to obtain growth rates as low as 0.0002 h−1 for Lactobacillus plantarum (Goffin et al., 2010); a second approach is to have cultures growing up in batch mode on a rich medium after which the cells are allowed to enter a prolonged stationary phase in which the quiescent state of S. cerevisiae cells is obtained (Gray et al., 2004). In both cases, the cultures started from high growth rates after which they decelerate gradually to the (almost) non-growth state. Monitoring the metabolic activity of L. plantarum in the rentostat during the gradual growth rate decline, the cells maintained the same physiology at all growth rates, including the absence of diversion toward higher ATP-yielding pathways (Goffin et al., 2010). On the other hand, S. cerevisiae at near-zero growth rates, like stationary phase cells, enter quiescence leading to a changed phenotype related to carbon starvation (Gray et al., 2004; Boender et al., 2011), but growth was never limited by redox or energy fluxes. In other words, in this approach neither redox burdens nor shortages of ATP formation fluxes were created, hence RJ-values will remain near 0.5.
The sigmoidal profile of the plot for S. cerevisiae (Figure 1) is quite similar to that of L. reuteri (Figure 2), even though the approach of the curve is from the “bottom up” concerning the former and from the “top down” for the latter. Interestingly, the profile that emerged from each of the plots reflects a second-order phase transition, which is characterized by the continuous transition shape (Waigh, 2007). As a consequence, there is a critical RJ that is situated at the inflection point of the profile (most visible in Figure 1A) similar to the melting temperature of DNA in the classical GC-content determination. It can be argued that the critical value for prokaryotes is equal to ≈1.0–1.3 and for yeast ≈0.8. The nature of the critical RJ merits further investigation, and might represent the critical point where the redox formation and ATP formation fluxes match beyond which the “restrictive growth mode” dissolves. In addition, the underlying sigmoidal pattern might be related to the spatial-temporal nature of this phenomenon occurring in a molecular crowded cytoplasm that affects diffusion of the cofactors to their targets (Klann and Koeppl, 2012).
An explanation for the summation of the formation fluxes of NADH and NADPH can be either setting the redox potential or their accompanying protons, in other words the JNAD(P)H represents also a proton formation flux (JH+). However, the influence of the redox can be questionable. On the one hand, both the NADPH/NADP ratio and the NADH/NAD ratio declined somewhat during the shift from glucose to xylose metabolism in S. cerevisiae TMB 3057 (Bergdahl et al., 2012), and on the other hand glutathione with an intracellular concentration of ca. 10 mM (Penninckx, 2002) will be present in a 5-fold higher concentration than the sum of the two redox carriers and thus will dominate the redox potential. A proton formation flux would imply that at high RJ-values the cytoplasm might be relatively more acidic. This needs to be verified with the strains mentioned in this study, but the observation of the intracellular pH being lower in xylose-metabolizing than in glucose-metabolizing Pichia stipitis and Candida tropicalis as measured with 31P-NMR (Lohmeier-Vogel et al., 1995, 1996) represents a good indication. Hence, the RJ-value might reflect the success of the excretion of protons over the cell membrane as mediated by ATPase. Indeed, under anaerobic conditions, the cytoplasmic pH (pHC) is dependent on the level of the H+-ATPase activity (Kobayashi, 1985). Addition of external electron acceptors did remedy this burden to a moderate extent for both S. cerevisiae and L. reuteri (Tables 1A,B). Therefore, with a RJ beyond a critical value the JATP would be simply too low to cope sufficiently with the demand for the proton excretion flux. In particular, S. cerevisiae is severely restricted in its efficiency to remove protons from the cytosol as it costs 1 ATP per excretion of 1 proton (Van Leeuwen et al., 1992).
Orij et al. (2012) demonstrated that the pHC directly controls the growth rate in S. cerevisiae, with a reduction in pHC leading to lower growth rates. Furthermore, transient changes in the pHC function as signals in yeasts for various processes in the cell, including positive feedback to initiate glucose metabolism, cell cycle progression, apoptosis, and morphological changes (Orij et al., 2011; Kane, 2016). Intracellar pH does not seem to be having a signaling role in bacteria, but pH homeostasis is controlled by proton-ATPases and Na+/H+ and K+/H+ antiporters (see e.g., Krulwich et al., 2011). Yet, it remains to be investigated how the cofactor formation flux ratio is involved in any cytosolic acidification as the latter is imposed by several other cellular processes and environmental conditions (Kane, 2016).
L. reuteri maintains high growth rates at higher RJ-values than S. cerevisiae (Figure 1 vs. Figure 2). This is probably due to that in the eukaryote ATP is converted in more cellular processes than in the prokaryote, especially when the organelles are taken into account. This also includes mitochondria, as under anaerobic conditions these organelles rely on cytosolic ATP to maintain a proper proton motive force, which may amount to at least 30 nmol ATP·mg protein−1·min−1 (Venard et al., 2003).
The cofactor formation ratio can also be used to reevaluate central carbon metabolisms in prokaryotes (Tables 1B,C). To compare the EMP with the PKP and the Entner-Doudoroff pathway (EDP) as isolated pathways in the absence of any metabolic flux analyses, we can use the stoichiometric ratio of the redox formation and energy carrier formation [NAD(P)H/ATP, mol·mol−1]. With respect to this ratio, it is clear that the EMP possesses the lowest RJ-value compared to the EDP and PKP with or without an electron acceptor (Table 1C). This pathway operates ideally under fermentative conditions, leading to relatively high growth rates and biomass yields. Therefore, with a formation flux ratio of 0.5 this catabolic pathway can be used as a benchmark. It is the lower half of the EMP, the C3-branch, which determines its formation flux ratio (Table 1C). Interestingly, this C3-branch is shared with all the other catabolic pathways that include more oxidation steps than the EMP and thus raises the redox formation flux (Table 1C). This simple comparison makes clear that the PKP owns the highest RJ-value and it can be argued whether microorganisms possessing only this central carbon pathway will grow under anaerobic conditions in the absence of an appropriate electron acceptor. That might give the answer to the question why L. reuteri possesses a “crippled” EMP in addition to the PKP: to enable growth under anaerobic conditions. The same can be considered for anaerobic microorganisms having only the EDP. This topic has been addressed recently (Flamholz et al., 2013), and indeed these metabolic types are hardly present among anaerobes.
One notable exception is Zymomonas mobilis that anaerobically grows best in the presence of high glucose concentrations (>0.5 M). It earns very low biomass yields due to a net yield of 1 mol ATP·mol glucose−1 (Fuhrer et al., 2005). Z. mobilis is able to do so because of having a metabolic highway from glucose to ethanol comprising 50% of the total cell protein and other physiological adjustments, allowing for exceptionally high metabolic fluxes to ethanol and only minor fluxes to biosynthesis (Sprenger, 1996; Fuhrer et al., 2005; Seo et al., 2005; Lee et al., 2010; Widiastuti et al., 2010). Thus, the anaerobically operating EDP comes with a price: minimum biomass yields are acquired but its existence is restricted to environments containing high sugar concentrations. Another exception is E. coli that is only able to grow anaerobically on xylose in the presence of pyruvate formate lyase (PFL; Hasona et al., 2004). Under that condition, equal amounts of ethanol and acetate corresponds to a RJ of 1.11; a Δpfl mutant failed to grow, but then the value for RJ would have been a fatally high 2.5.
A step toward answering the long-standing question why certain types of metabolic pathways do not guarantee growth under anaerobic conditions is proposed here via introduction of a quantification parameter, RJ, based on kinetics. The current analysis of the available data reveals a relationship between this new dimensionless parameter and the specific growth rate. In what mechanistic way, the cofactor formation flux ratio is connected to acidification of the cytosol merits specific investigation. The value of this parameter implies how far the metabolism is from the critical situation beyond which unrestricted growth is allowed. Therefore, RJ can be used as a novel analytical tool for targeted design of new strains, and is easily implemented in metabolic flux model simulations.
Author Contributions
Ev conceived and designed part of the experiments and drafted the manuscript with BH. BB performed the model simulations. All authors critically read, contributed to, approved the final version of the manuscript, and agreed to be accountable for all parts of the work.
Conflict of Interest Statement
The authors declare that the research was conducted in the absence of any commercial or financial relationships that could be construed as a potential conflict of interest.
Acknowledgments
The authors thank Christer Larsson and Dr. Elke Lohmeier-Vogel for providing data on L. reuteri DSM 17938. Ev acknowledges receiving financial support from BioGaia AB.
Supplementary Material
The Supplementary Material for this article can be found online at: http://journal.frontiersin.org/article/10.3389/fmicb.2017.01149/full#supplementary-material
Figure S1. Central metabolic pathways in S. cerevisiae capable of fermenting glucose and xylose. The pathways include the Embden-Meyerhof-Parnas pathway, pentose phosphate pathway, the engineered xylose pathway, and the pathways leading to acetate and ethanol. FBP, fructose bisphosphate; DHAP, dihydroxyacetone phosphate; GAP, glyceraldehyde 3-phosphate; PYR, pyruvate; R5P, ribose 5-phosphate; S7P, sedoheptulose 7-phosphate; E4P, erythrose 4-phosphate.
Figure S2. Central metabolic pathways in the heterofermentative L. reuteri. The central pathways consists of the phosphoketolase pathway (from glucose 6-phosphate to acetyl phosphate (AcP) and glyceraldehyde 3-phosphate (GAP) and the Embden-Meyerhof-Parnas pathway. Either glucose or sucrose is used as substrate, in which the latter is split into glucose and fructose. The latter is used as electron acceptor being reduced to mannitol and the former enters the central carbon pathways via glucose 1-phosphate. F6P, fructose 6-phosphate; FBP, fructose bisphosphate; DHAP, dihydroxyacetone phosphate; AcCoA, Acetyl-CoA; PYR, pyruvate.
Figure S3. Transition profiles of the metabolism of an anaerobic culture of S. cerevisiae TMB 3057 from glucose to xylose in batch cultures as described in Bergdahl et al. (2012). The symbols represent the measured data points and the lines are generated by the simulation model. (A) Biomass production. (B) Glucose (o) and xylose (□) consumption. (C) Specific growth rate. (D) Change of the cofactor formation flux ratio (RJ) from simultaneous glucose and xylose metabolism to exclusive xylose metabolism.
Table S1. Metabolite consumption and production rates for S. cerevisiae during exponential growth on xylose. Symbols: μ, specific growth rate (h−1); r, specific consumption/production rates (mmol·g DW−1·h−1); rS, specific substrate consumption rate; rXol, specific xylitol production rate; rG, specific glycerol production rate; rA, specific acetate production rate; rE, specific ethanol production rate.
Table S2. Metabolite consumption and production rates for L. reuteri during exponential growth on glucose or sucrose. Symbols: μ, non-normalized specific growth rate (h−1); r, specific consumption/production rates (mmol·g DW−1·h−1); rS, specific substrate consumption rate; rL, specific lactate production rate; rE, specific ethanol production rate; rA, specific acetate production rate.
Table S3. Parameter values of the kinetic equations to estimate the fermentation profiles of the external fluxes of S. cerevisiae strain 3057. Symbols: , the maximum specific glucose conversion rate; , the affinity constant for glucose; , the xylose inhibition constant for glucose conversion; , the ethanol inhibition constant for glucose conversion; , the maximum specific xylose conversion rate; , the affinity constant for xylose; , the glucose inhibition constant for xylose conversion; , the ethanol inhibition constant for xylose conversion; Yglyc/(glc+xyl), the glycerol yield on glucose and xylose; Yglyc/xyl, the glycerol yield on xylose. The ratio between the XR:NADH and XR:NADPH reactions was described by a generalized logistic function with the following parameters: A, the lower asymptote; K, the upper asymptote; Q, affects the value of the ratio at time, t = 0; B, the growth rate; M, sets the starting time; ν, affects near which asymptote maximum growth occurs.
References
Alberts, B., Johnson, A., Lewis, J., Morgan, D., Raff, M., Roberts, K., et al. (2014). Molecular Biology of the Cell, 6th Edn. New York, NY: Garland Science, 63.
Årsköld, E., Lohmeier-Vogel, E., Cao, R., Roos, S., Rådström, P., and van Niel, E. W. J. (2008). Phosphoketolase pathway dominates in Lactobacillus reuteri ATCC 55730 containing dual pathways for glycolysis. J. Bacteriol. 190, 206–212. doi: 10.1128/JB.01227-07
Bengtsson, O., Hahn-Hägerdal, B., and Gorwa-Grauslund, M.-F. (2009). Xylose reductase from Pichia stipitis with altered coenzyme preference improves ethanolic xylose fermentation by recombinant Saccharomyces cerevisiae. Biotechnol. Biofuels 2:9. doi: 10.1186/1754-6834-2-9
Bergdahl, B., Heer, D., Sauer, U., Hahn-Hägerdal, B., and van Niel, E. W. J. (2012). Dynamic metabolomics differentiates between carbon and energy starvation in recombinant Saccharomyces cerevisiae fermenting xylose. BMC Biotechnol. Biofuels 5:34. doi: 10.1186/1754-6834-5-34
Boender, L. G. M., van Maris, A. J. A., de Hulster, E. A. F., Almering, M. J. H., van der Klei, I. J., Veenhuis, M., et al. (2011). Cellular response of Saccharomyces cerevisiae at near-zero growth rates: transcriptome analysis of anaerobic retentostat cultures. FEMS Yeast Res. 11, 603–620. doi: 10.1111/j.1567-1364.2011.00750.x
Eliasson, A., Christensson, C., Wahlbom, C. F., and Hahn-Hägerdal, B. (2000). Anaerobic xylose fermentation by recombinant Saccharomyces cerevisiae carrying XYL1, XYL2 and XKS in mineral medium chemostat cultures. Appl. Environ. Microbiol. 66, 3381–3386. doi: 10.1128/AEM.66.8.3381-3386.2000
Flamholz, A., Noor, E., Bar-Even, A., Liebermeister, W., and Milo, R. (2013). Glycolytic strategy as a tradeoff between energy yield and protein cost. Proc. Natl. Acad. Sci. U.S.A. 110, 10039–10044. doi: 10.1073/pnas.1215283110
Fuhrer, T., Fischer, E., and Sauer, U. (2005). Experimental identification and quantification of glucose metabolism in seven bacterial species. J. Bacteriol. 187, 1581–1590. doi: 10.1128/JB.187.5.1581-1590.2005
Goffin, P., van de Bunt, B., Giovane, M., Leveau, J. H. J., Höppener-Ogawa, S., Teusink, B., et al. (2010). Understanding the physiology of Lactobacillus plantarum at zero growth. Mol. Syst. Biol. 6, 413. doi: 10.1038/msb.2010.67
Gray, J. V., Petsko, G. A., Johnston, G. C., Ringe, D., Singer, R. A., and Werner-Washburne, M. (2004). “Sleeping beauty”: quiescence in Saccharomyces cerevisiae. Microbiol. Mol. Biol. Rev. 68, 187–206. doi: 10.1128/MMBR.68.2.187-206.2004
Hasona, A., Kim, Y., Healy, F. G., Ingram, L. O., and Shanmugam, K. T. (2004). Pyruvate formate lyase and acetate kinase are essential for anaerobic growth of Escherichia coli on xylose. J. Bacteriol. 186, 7593–7600. doi: 10.1128/JB.186.22.7593-7600.2004
Holm, A. K., Blank, L. M., Oldiges, M., Schmid, A., Solem, C., Jensen, P. R., et al. (2010). Metabolic and transcriptional response to cofactor perturbations in Escherichia coli. J. Biol. Chem. 285, 17489–17506. doi: 10.1074/jbc.M109.095570
Jeppsson, M., Johansson, B., Ruhdal Jensen, P., Hahn-Hägerdal, B., and Gorwa-Grauslund, M. F. (2003). The level of glucose-6-phosphate dehydrogenase activity strongly influences xylose fermentation and inhibitor sensitivity in recombinant Saccharomyces cerevisiae. Yeast 20, 1263–1272. doi: 10.1002/yea.1043
Kane, P. M. (2016). “Proton transport and pH control in fungi,” in Yeast Membrane Transport. Advances in Experimental Medicine and Biology, Vol. 892, eds J. Ramos, H. Sychrová, and M. Kschischo (Berlin; Heidelberg: Springer International Publishing), 33–68. doi: 10.1007/978-3-319-25304-6_3
Klann, M., and Koeppl, H. (2012). Spatial simulations in systems biology: from molecules to cells. Int. J. Mol. Sci. 13, 7798–7827. doi: 10.3390/ijms13067798
Kobayashi, H. (1985). A proton-translocating ATPase regulates pH of the bacterial cytoplasm. J. Biol. Chem. 260, 72–76.
Krulwich, T. A., Sachs, G., and Padan, E. (2011). Molecular aspects of bacterial pH sensing and homeostasis. Nat. Rev. Microbiol. 9, 330–343. doi: 10.1038/nrmicro2549
Kuyper, M., Winkler, A. A., van Dijken, J. P., and Pronk, J. T. (2004). Minimal metabolic engineering of Saccharomyces cerevisiae or efficient anaerobic xylose fermentation: a proof of principle. FEMS Yeast Res. 5, 399–409. doi: 10.1016/j.femsyr.2004.09.010
Lee, K. Y., Park, J. M., Kim, T. Y., Yun, H., and Lee, S. Y. (2010). The genome-scale metabolic network analysis of Zymomonas mobilis ZM4 explains physiological features and suggests ethanol and succinic acid production strategies. Microb. Cell Fact. 9:94. doi: 10.1186/1475-2859-9-94
Levander, F., Svensson, M., and Rådström, P. (2001). Small-scale analysis of exopolysaccharides from Streptococcus thermophilus grown in a semi-defined medium. BMC Microbiol. 1:23. doi: 10.1186/1471-2180-1-23
Lohmeier-Vogel, E. M., Hahn-Hägerdal, B., and Vogel, H. J. (1995). Phosphorus-31 and carbon-13 nuclear magnetic resonance studies of glucose and xylose metabolism in Candida tropicalis cell suspensions. Appl. Environ. Microbiol. 61, 1414–1419.
Lohmeier-Vogel, E. M., McIntyre, D. D., and Vogel, H. J. (1996). Phosphorus-31 and carbon-13 nuclear magnetic resonance studies of glucose and xylose metabolism in cell suspensions and agarose-immobilized cultures of Pichia stipitis and Saccharomyces cerevisiae. Appl. Environ. Microbiol. 62, 2832–2838.
Mo, M. L., Palsson, B. O., and Herrgard, M. J. (2009). Connecting extracellular metabolomic profiles to intracellular metabolic states in yeast. BMC Syst. Biol. 3:37. doi: 10.1186/1752-0509-3-37
Moysés, D. N., Reis, V. C. B., de Almeida, J. R. M., de Moraes, L. M. P., and Torres, F. A. G. (2016). Xylose fermentation by Saccharomyces cerevisiae: challenges and prospects. Int. J. Mol. Sci. 17, 207. doi: 10.3390/ijms17030207
Orij, R., Brul, S., and Smits, G. J. (2011). Intracellular pH is a tightly controlled signal in yeast. Biochim. Biophys. Acta 1810, 933–944. doi: 10.1016/j.bbagen.2011.03.011
Orij, R., Urbanus, M. L., Vizeacoumar, F. J., Giaever, G., Boone, C., Nislow, C., et al. (2012). Genome-wide analysis of intracellular pH reveals quantitative control of cell division rate by pHC in Saccharomyces cerevisiae. Genome Biol. 13:R80. doi: 10.1186/gb-2012-13-9-r80
Penninckx, M. J. (2002). An overview on glutathione in Saccharomyces versus non-conventional yeasts. FEMS Yeast Res. 2, 295–305. doi: 10.1016/S1567-1356(02)00081-8
Petersson, A., Almeida, J. R. M., Modig, T., Karhumaa, K., Hahn-Hägerdal, B., Gorwa-Grauslund, M.-F., et al. (2006). A 5-hydroxymethyl furfural reducing enzyme encoded by the Saccharomyces cerevisiae ADH6 gene conveys HMF tolerance. Yeast 23, 455–464. doi: 10.1002/yea.1370
Rosander, A., Connolly, E., and Roos, S. (2008). Removal of antibiotic resistance gene-carrying plasmids from Lactobacillus reuteri ATCC 55730 and characterization of the resulting daughter strain DSM 17938. Appl. Environm. Microbiol. 74, 6032–6040. doi: 10.1128/AEM.00991-08
Runquist, D., Hahn-Hägerdal, B., and Bettiga, M. (2009). Increased expression of the oxidative pentose phosphate pathway and gluconeogenesis in anaerobically growing xylose-utilizing Saccharomyces cerevisiae. Microb. Cell Fact. 8:49. doi: 10.1186/1475-2859-8-49
Runquist, D., Hahn-Hägerdal, B., and Bettiga, M. (2010). Increased ethanol productivity in xylose-utilizing Saccharomyces cerevisiae via a randomly mutagenized xylose reductase. Appl. Environ. Microbiol. 76, 7796–7802. doi: 10.1128/AEM.01505-10
Russell, J. B. (1992). Another explanation for the toxicity of fermentation acids at low pH: anion accumulation versus uncoupling. J. Appl. Bacteriol. 73, 363–370. doi: 10.1111/j.1365-2672.1992.tb04990.x
Salou, P., Loubiere, P., and Pareilleux, A. (1994). Growth and energetics of Leuconostoc oenos during cometabolism of glucose with citrate or fructose. Appl. Environ. Microbiol. 60, 1459–1466.
Sànchez Nogué, V., and Karhumaa, K. (2015). Xylose fermentation as a challenge for commercialization of lignocellulosic fuels and chemicals. Biotechnol. Lett. 37, 761–772. doi: 10.1007/s10529-014-1756-2
Sassner, P., Galbe, M., and Zacchi, G. (2008). Techno-economic valuation of bioethanol production from three different lignocellulosic materials. Biomass Bioener. 32, 422–430. doi: 10.1016/j.biombioe.2007.10.014
Seo, J.-S., Chong, H., Park, H. S., Yoon, K.-O., Jung, C., Kim, J. J., et al. (2005). The genome sequence of the ethanologenic bacterium Zymomonas mobilis ZM4. Nat. Biotechnol. 23, 63–68. doi: 10.1038/nbt1045
Sonderegger, M., Jeppsson, M., Hahn-Hägerdal, B., and Sauer, U. (2004). Molecular basis for anaerobic growth of Saccharomyces cerevisiae on xylose, investigated by global gene expression and metabolic flux analysis. Appl. Environ. Microbiol. 70, 2307–2317. doi: 10.1128/AEM.70.4.2307-2317.2004
Sprenger, G. A. (1996). Carbohydrate metabolism in Zymomonas mobilis: a catabolic highway with some scenic routes. FEMS Microbiol. Lett. 145, 301–307. doi: 10.1111/j.1574-6968.1996.tb08593.x
Van Leeuwen, C. C., Weusthuis, R. A., Postma, E., van den Broek, P. J., and van Dijken, J. P. (1992). Maltose/proton co-transport in Saccharomyces cerevisiae. Comparative study with cells and plasma membrane vesicles. Biochem. J. 284, 441–445. doi: 10.1042/bj2840441
van Niel, E. W. J., Larsson, C., Lohmeier-Vogel, E. M., and Rådström, P. (2012). The potential of biodetoxification activity as a probiotic property in Lactobacillus reuteri. Int. J. Food Microbiol. 152, 206–210. doi: 10.1016/j.ijfoodmicro.2011.10.007
Venard, R., Brèthes, D., Giraud, M.-F., Vaillier, J., Velours, J., and Haraux, F. (2003). Investigation of the role and mechanism of IF1 and STF1 proteins, twin inhibitory peptides which interact with the yeast mitochondrial ATP synthase. Biochemistry 42, 7626–7636. doi: 10.1021/bi034394t
Verduyn, C., Postma, E., Scheffers, W. A., and van Dijken, J. P. (1990). Physiology of Saccharomyces cerevisiae in anaerobic glucose-limited chemostat cultures. J. Gen. Microbiol. 136, 395–403. doi: 10.1099/00221287-136-3-395
Wahlbom, C. F., and Hahn-Hägerdal, B. (2002). Furfural, 5-hydroxymethyl furfural, and acetoin act as external electron accept ors during anaerobic fermentation of xylose in recombinant Saccharomyces cerevisiae. Biotechnol. Bioeng. 78, 172–178. doi: 10.1002/bit.10188
Waigh, T. A. (2007). Applied Biophysics. Chichester: John Wiley & Sons Ltd. doi: 10.1002/9780470513156
Keywords: NADH, NADPH, ATP, Saccharomyces cerevisiae, Lactobacillus reuteri, redox imbalance, ATP formation flux, NAD(P)H formation flux
Citation: van Niel EWJ, Bergdahl B and Hahn-Hägerdal B (2017) Close to the Edge: Growth Restrained by the NAD(P)H/ATP Formation Flux Ratio. Front. Microbiol. 8:1149. doi: 10.3389/fmicb.2017.01149
Received: 07 February 2017; Accepted: 07 June 2017;
Published: 22 June 2017.
Edited by:
Marc Strous, University of Calgary, CanadaReviewed by:
Pablo Ivan Nikel, The Novo Nordisk Foundation Center for Biosustainability (DTU Biosustain), DenmarkJuan Carlos Aon, GlaxoSmithKline, United States
Miguel A. Aon, National Institute on Aging (NIH), United States
Copyright © 2017 van Niel, Bergdahl and Hahn-Hägerdal. This is an open-access article distributed under the terms of the Creative Commons Attribution License (CC BY). The use, distribution or reproduction in other forums is permitted, provided the original author(s) or licensor are credited and that the original publication in this journal is cited, in accordance with accepted academic practice. No use, distribution or reproduction is permitted which does not comply with these terms.
*Correspondence: Ed W. J. van Niel, ed.van_niel@tmb.lth.se
†Present Address: Basti Bergdahl, Christian Hansen A/S, Hørsholm, Denmark