 Kathryn L. Kay1,2
 Frederick Breidt1,2*
 Pina M. Fratamico3
 Gian M. Baranzoni3
 Gwang-Hee Kim3,4
 Amy M. Grunden1
 Deog-Hwan Oh4
- 1Department of Plant and Microbial Biology, North Carolina State University, Raleigh, NC, United States
- 2Food Science Research Unit, United States Department of Agriculture-Agriculture Research Service, Raleigh, NC, United States
- 3United States Department of Agriculture, Agricultural Research Service, Eastern Regional Research Center, Wyndmoor, PA, United States
- 4Department of Food Science and Biotechnology, College of Bioscience and Biotechnology, Kangwon National University, Chuncheon, South Korea
Shiga toxin producing Escherichia coli (STEC) strains vary in acid resistance; however, little is known about the underlying mechanisms that result in strain specific differences. Among 25 STEC O157:H7 strains tested, 7 strains flocculated when grown statically for 18 h in minimal salts medium at 37°C, while 18 strains did not. Interestingly, the flocculation phenotype (cells came out of suspension) was found to correlate with degree of acid sensitivity in an assay with 400 mM acetic acid solution at pH 3.3 targeting acidified foods. Strains exhibiting flocculation were more acid sensitive and were designated FAS, for flocculation acid sensitive, while the acid resistant strain designated PAR for planktonic acid resistant. Flocculation was not observed for any strains during growth in complex medium (Luria Bertani broth). STEC strains B201 and B241 were chosen as representative FAS (2.4 log reduction) and PAR (0.15 log reduction) strains, respectively, due to differences in acid resistance and flocculation phenotype. Results from electron microscopy showed evidence of fimbriae production in B201, whereas fimbriae were not observed in B241.Curli fimbriae production was identified through plating on Congo red differential medium, and all FAS strains showed curli fimbriae production. Surprisingly, 5 PAR strains also had evidence of curli production. Transcriptomic and targeted gene expression data for B201 and B241indicated that csg and hde (curli and acid induced chaperone genes, respectively) expression positively correlated with the phenotypic differences observed for these strains. These data suggest that FAS strains grown in minimal medium express curli, resulting in a flocculation phenotype. This may be regulated by GcvB, which positively regulates curli fimbriae production and represses acid chaperone proteins. RpoS and other regulatory mechanisms may impact curli fimbriae production, as well. These findings may help elucidate mechanisms underlying differences among STEC strains in relating acid resistance and biofilm formation.
Introduction
Shiga toxin producing Escherichia coli (STEC) O157:H7 and some related serotypes are of particular interest in food safety and public health due to their ability to colonize a human host with a low infectious dose, as little as 2–2,000 cells for foodborne outbreak strains, and cause severe illness (Buchanan and Doyle, 1997). E. coli O157:H7 and other STEC produce Shiga toxins, the most critical virulence factor involved in inducing gastrointestinal illness characterized by hemorrhagic colitis, which may develop into hemolytic uremic syndrome (HUS) and can ultimately result in death (Buchanan and Doyle, 1997; Park et al., 2001; Pennington, 2010). Previous work has identified STEC strains as acid resistant pathogens of concern for acidified foods (Breidt et al., 2007, 2013). Acid and acidified food products are defined as foods having a pH of 4.6 or lower, which prevents residual spores from germinating as mandated in the United States Code of Federal Regulations (21 CFR 114; US Food Drug Administration, 2012). These foods contain a variety of organic acids, which contribute to flavor and have antimicrobial effects (Breidt et al., 2004; Oh et al., 2009).
Weak acids, such as acetic acid and lactic acid, are able to diffuse across the bacterial cell membranes and dissociate intracellularly because the intracellular pH is higher than the environmental pH. The acidification of the cell cytoplasm and intracellular accumulation of acid anions can lead to cell death, but cell death due to acid stress is also dependent on other factors such as, acid type, pH, temperature, and growth phase (Lin et al., 1996; Diez-Gonzalez and Russell, 1997, 1999; Castanie-Cornet et al., 1999; Breidt et al., 2004). Disease outbreaks of E. coli O157:H7 from acid and acidified foods, such as the multi-state outbreak in apple cider, have made the relationship between the antimicrobial effects of weak acids and E. coli's acid resistance systems an important concern (Miller and Kaspar, 1994; Buchanan and Doyle, 1997; Rangel et al., 2005).
Acid habituation, induced by growing cells in mildly acidic medium, results in higher survival rates in response to acid challenge compared to cells grown in neutral pH media (Buchanan and Edelson, 1996; Brudzinski and Harrison, 1998). There are multiple acid resistance systems (designated AR1 through AR4) in E. coli. AR1 was observed in stationary cells grown in pH 5.5 buffered Luria broth (Bearson et al., 2009). These cells were able to survive acid challenge whereas cells grown at higher pH could not. The RpoS sigma factor and the F1F0 ATPase are required for this system (Lin et al., 1996). Other acid resistance mechanisms require decarboxylase and antiporter systems, based on glutamate (AR2) or arginine (AR3) substrates, to effectively export protons out of the cell and raise the intracellular pH (Lin et al., 1995; Hersh et al., 1996; Castanie-Cornet et al., 1999; Iyer et al., 2003; Bearson et al., 2009). The activity of these acid resistance systems correlates with internal pH and the optimal pH function of the decarboxylases (Foster, 2004). A lysine decarboxylase system (AR4) has also been identified, but it is not as effective as AR2 or AR3 in raising intracellular pH (Iyer et al., 2003).
RpoS is activated during stationary phase or environmental stresses, such as, acid shock, to induce stress response genes. In Salmonella enterica serovar Typhimurium, it was found that RpoS expression affects the cell's acid stress response for all AR systems (Lin et al., 1995). Active RpoS has been found to be essential for AR1 in E. coli, and RpoS mutants appear to indirectly affect AR2 and AR3 decarboxylase activity (Lin et al., 1996; Castanie-Cornet et al., 1999). RpoS also plays an important role in the regulation of biofilm formation, including the formation of extracellular curli amyloid protein fibers (Uhlich et al., 2013).
Curli expression by STEC is characterized by adhesive fimbrial aggregates that can result in biofilm production, contributing to the transition of motile cells to the sessile phenotype during environmental stress. Regulation of curli is complex, mediated by RpoS, regulatory small RNAs (sRNA), cross-talk with other surface fimbriae, and other regulatory molecules acting at both the transcription and translational levels (Beloin et al., 2008; Pesavento et al., 2008; Boehm and Vogel, 2012; Lloyd et al., 2012a). Carbon source quality, osmotic imbalance, and nutrient deprivation activate regulatory small RNAs (McaS, OmpR, and GcvB) that target curli synthesis at the translational level (Vidal et al., 1998; Chen et al., 2002; Jorgensen et al., 2012). Of particular interest, GcvB acts as a global repressor of amino acid metabolism, and transcription of gcvB is dependent on the concentration of environmental glycine. GcvB is also known to be a regulator of acid induced chaperone proteins (Urbanowski et al., 2000). If the concentration of environmental glycine is high, gcvB transcription may be upregulated, repressing expression of csgD and the curli structural genes csgBA, as well as inducing acid stress chaperone proteins encoded by hdeAB. GcvB has also been found to increase expression of RpoS under acid stress (Jin et al., 2009; Stauffer and Stauffer, 2012a).
A correlation between the production of curli fimbriae and acid resistance has been observed previously in E. coli O157:H7 strains, but the regulatory mechanisms responsible for coordinate regulation and the relationship to nutrient limitation are not understood. We proposed a hypothesis that nutrient limitation influenced expression of GcvB, RpoS, and other regulatory molecules that control expression of CsgD (curli) and HdeAB (acid chaperones). Because the differences in regulation of curli fimbriae were only observed for more acid sensitive cells grown in a minimal medium, gene expression of carbon storage, curli fimbriae, and changes in global regulators for acid resistance were targeted. These data will contribute to our understanding of how STEC strains respond differently to nutrient limitation and acid stress.
Materials and Methods
Bacterial Strains and Culture Conditions
All E. coli O157:H7 and K-12 strains used were obtained from the USDA Food Science Research Unit, Raleigh, NC culture collection and are listed in Table 1. Bacteria were grown statically in either 10 ml of Luria Bertani broth supplemented with 1% glucose (LBG; LB, Becton Dickinson, Sparks, MD) or a defined minimal medium (5X M9 Minimal Salts, Sigma-Aldrich, St. Louis, MO) supplemented with 1% glucose and 0.005% thiamine (M9GT) at 37°C for 18 h to induce acid resistance. Glycine (5 mM) was added to M9GT as indicated below. Cultures were harvested by centrifugation (5,000 × g, 10 min, 10°C, Sorvall Superspeed Centrifuge, SS-34 rotor, DuPont Instruments, Newton, CT), decanted, and re-suspended in 10 ml sterile saline [0.85% sodium chloride (NaCl)] twice prior to use.
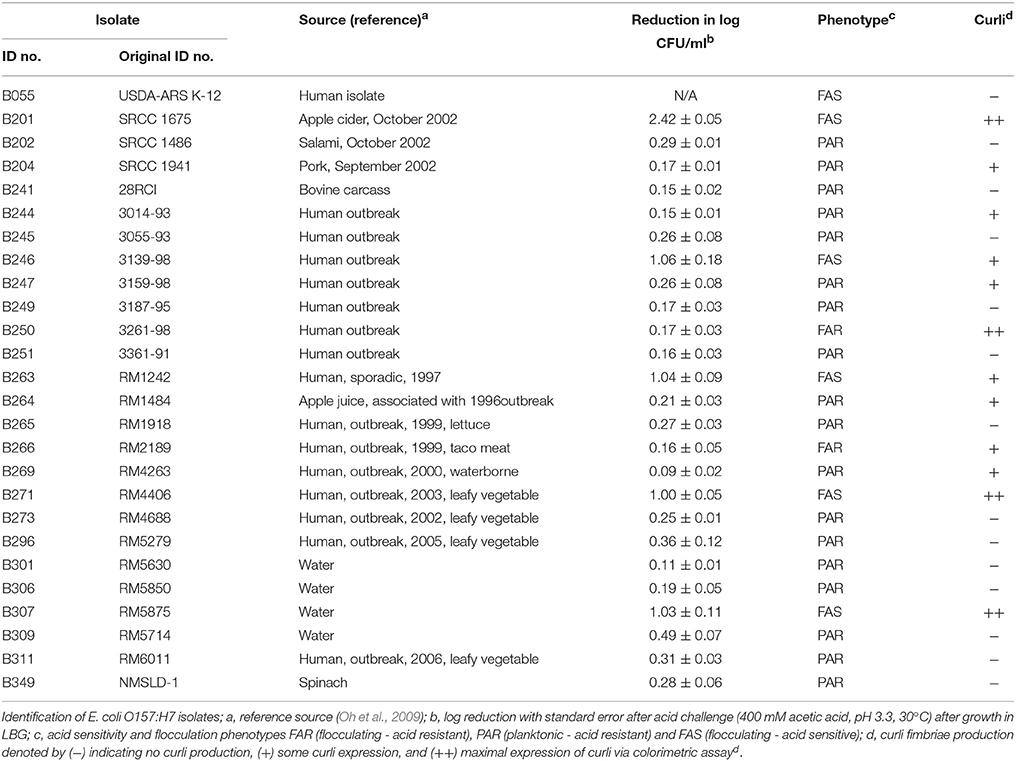
Table 1. Escherichia coli O157:H7 isolates, acid resistance, and designated flocculation and curli phenotypes used in this study.
For acid challenge experiments, initial cell concentrations were approximately 109 CFU/ml. After acid challenge (see below) cells were diluted 1:10 in 0.1 M 3 N-morpholino propane sulfonic acid buffer (MOPS; pH 7.2, Sigma Aldrich) to relieve acid stress, followed by serial dilution in sterile saline. Cells were enumerated on LB agar (Becton Dickinson) using a spiral plater (Autoplate 4000, Spiral Biotech, Inc., Norwood, MA) and an automated plate reader (QCount, Spiral Biotech), or by plating 10 μl onto 5 ml of LB agar in 24-well microtiter plate wells to estimate counted colony forming units (CFU).
For gene deletion experiments, bacterial strains were grown in LBG broth or on LB agar supplemented with antibiotics at the following concentrations, 50 μg/ml ampicillin and 25 μg/ml chloramphenicol. For gene deletion experiments, bacteria were grown aerobically in 1.0 ml of LBG at 37°C overnight at 1200 RPM in the Eppendorf Thermomixer R (Hamburg, Germany). Overnight cultures (30 μL) were re-inoculated in 1.0 ml fresh LBG and grown for 3 h at 37°C before electroporation.
Curli and Motility Assays
Curli phenotype was determined for all strains of E. coli O157:H7 and a K-12 strain. Cultures were grown in LBG or M9GT broth at 37°C for 18 h, and then plated onto Congo red indicator (CRI) agar composed of 10 g/L casamino acids (Becton Dickinson), 1 g/L yeast extract (Becton Dickinson), and 20 g/L agar (Thermo Fisher Scientific, Fair Lawn, NJ) with 20 mg/L of Congo red (Polysciences, Inc., Warrington, PA) with and without 10 mg/L Coomassie Brilliant Blue G-250 (MP Biomedicals, Inc., Solon, OH; Uhlich et al., 2006). LB agar supplemented with 200 mg/L calcoflour white stain (Fluka Analytical), a UV fluorescent stain that binds to cellulose and chitin, plates were used to identify cellulose production (Hammar et al., 1995; Uhlich et al., 2006). Motility was determined using motility test medium (MTM; 3 g/L beef extract (Becton Dickinson), 10 g/L pancreatic digest of casein (Becton Dickinson), 5 g/L NaCl, and 4 g/L agar) stab cultures grown 18 h at 37°C (Atlas and Parks, 1993).
Acid Resistance Assay
To determine acid resistance of STEC strains, acetic acid solutions were prepared as described previously (Oh et al., 2009). The pH of the glacial acetic acid solutions (400 mM) was adjusted to 3.3 with the addition of sodium hydroxide (1N). Cell suspensions were added (200 μl) into 1.8 ml of acetic acid solution in 12-well tissue culture plates. The 12-well tissue culture plate was incubated aerobically at 30°C for 25 min (Oh et al., 2009). After incubation, 20 μl of the cell suspension was transferred into 180 μl of 0.1 M MOPS followed by serial 10-fold dilutions and plating onto LB agar to determine CFU/ml as described above.
Transmission Electron Microscopy
Transmission electron microscopy (TEM) was performed to confirm the presence or absence of flagella in acid resistant and sensitive strains. Cultures were grown statically in 10 ml of M9GT or LBG at 37°C for 18 h, harvested by centrifugation (5,000 × g, 10 min, 10°C), and then re-suspended in 1 ml sterile saline and serially diluted into 3% glutaraldehyde fixative at 4°C for 4 h. Cells were harvested in a microcentrifuge (10,000 × g, 10 min, 22°C, Spectrafuge 24D Digital Microcentrifuge, Labnet International, Inc., Edison, NJ), re-suspended in 0.1 M sodium acetate buffer at pH 7.0, and transported to North Carolina State University's Center for Electron Microscopy for processing. Cells were stained with 1 and 0.5% phosphotungstic acid (PTA; Ernest F. Fullan, Inc., Schenectady, NY) on 400-mesh carbon grids (Ladd Research Industries, Williston, VT). Cells on the grids were imaged at a magnification of either 12,000X or 15,000X on a JEOL JEM 1200 EX (JEOL U.S.A., Peabody, MA) transmission electron microscope at 80 kV.
RNA Extraction
Two volumes of RNA-protect Bacterial Reagent (Qiagen Sciences, Inc., Germantown, MD) were added to one volume (1.5 ml) of culture (approximately 109 CFU/ml) grown statically in M9GT ± 1% glycine at 37°C for 18 h. Cells were incubated at room temperature for 5 min and harvested by centrifugation (5,000 × g, 10 min, 10°C). Total RNA was extracted using the RNeasy Mini Kit (Qiagen Sciences) with an additional on-column DNaseI digestion following the manufacturer's protocol. For transcriptomic analysis, a higher yield of total RNA was required, and thus the RNeasy Midi Kit (Qiagen Sciences) was used. DNA and ribosomal RNA (rRNA) were removed from the extracted RNA using the TURBO DNA-free kit (Thermo Fisher Scientific) and Ribo-Zero rRNA Removal Gram-Negative kit (Illumina, Inc., San Diego, CA). The rRNA-depleted RNA samples were concentrated and purified using Zymo RNA Clean & Concentrator columns (Zymo Research, Irvine, CA). Concentration and quality of RNA were determined using the RNA Nano-chip and the RNA Pico-chip on an Agilent 2100 Bioanalyzer (Agilent, Santa Clara, CA) for transcriptomic analysis, or a Nanodrop ND-1000 UV-visible wavelength spectrophotometer (NanoDrop Technologies, Wilmington, DE) for RT-qPCR experiments.
RNA Sequencing and Transcriptomic Analysis
One library for each strain (B201, B241, and B250) was prepared using the Ion Total RNA-Seq Kit v2 (Thermo Fisher Scientific) following the manufacturer's instructions with one exception: incubation time for RNA shearing was reduced to 2.5 min. The final cDNA library was quantified with a 2100 Bioanalyzer using a High Sensitivity DNA Chip (Agilent). Library enrichment was carried out with an Ion PGM™ Template OT2 200 kit and Ion OneTouch™ 2 system (Thermo Fisher Scientific). Each library was sequenced with an Ion 318 Chip using an Ion PGM 200 Sequencing kit (Thermo Fisher Scientific) on the Ion Personal Genome Machine (Thermo Fisher Scientific). RNA-Seq data were analyzed by ProteinCT Biotechnologies (Madison, WI, USA). Briefly, raw reads were mapped to the E. coli O157 B201 and B241 genome sequences (Baranzoni et al., 2016) using the Subjunc program from the Subread-1.4.6 package (http://bioinf.wehi.edu.au/subread). Raw gene counts were generated by FeatureCounts from the Subread package, and differential expression was calculated using the Limma package (https://bioconductor.org/packages/release/bioc/html/limma.html). Transcriptomics data are available under NCBI BioProject number PRJNA381969.
Quantitative Real-Time Reverse Transcriptase-PCR (RT-qPCR)
For quantitative analysis of gene expression, the Bio-Rad One-Step RT-qPCR kit (Bio-Rad, Hercules, CA) was used to synthesize cDNA from cellular RNA (2 μl template) extracted from E. coli B201, B241, and B250. Primers for selected transcripts (Table 2) were designed with the IDT Real Time PCR Tool. Gene expression analysis was performed on the Bio-Rad CFX96 Touch Real-Time PCR Detection System (Bio-Rad). The Bio-Rad One-Step RT-qPCR kit (Bio-Rad) was tested without RNA, without primers, and without reverse transcriptase as negative controls to determine the efficacy of the kit, the presence of additional genomic DNA, and potential primer-dimer interactions, respectively. Target genes were normalized using the tus gene as an endogenous control (Crépin et al., 2012; Porcheron et al., 2014). Cycle threshold (CT) values and relative fold change were calculated as (2−ΔΔCT), using an average of three independent replications (Livak and Schmittgen, 2001).
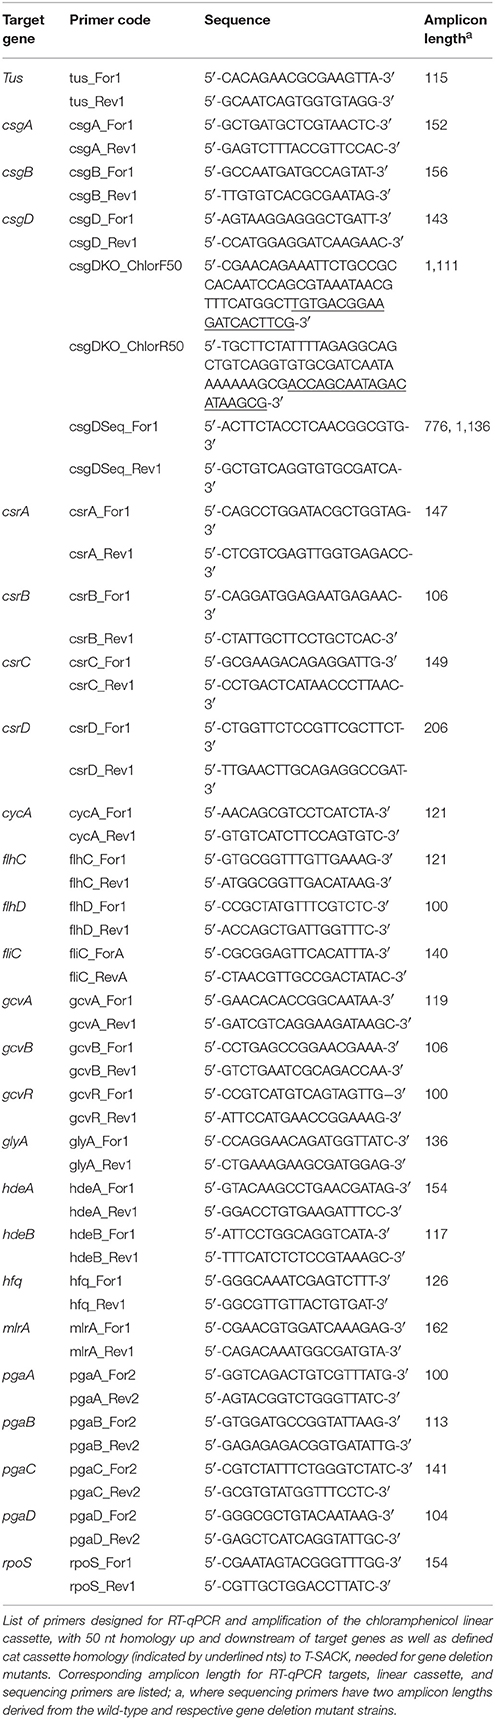
Table 2. The primer sequences for RT-qPCR and chloramphenicol linear cassette.
Generation of a Functional Chloramphenicol Cassette
Primers for gene deletion mutants (Table 2) were designed to produce a functional chloramphenicol linear cassette (1,011 bp). Linear cassette primers were designed with 50 bp homology directly up and downstream of the target insertion site and with flanking homology arms to a cat (CmR) region in T-SACK (Li et al., 2013). T-SACK, an E. coli strain carrying amplifiable drug resistance cassettes [tetA-sacB, amp, cat, and kan], was generously provided to us by Dr. Donald Court at the National Cancer Institute (Frederick, MD). Additional primers for gene sequencing were designed with the IDT Real Time PCR Tool (Table 2). Platinum PCR Supermix High Fidelity (Invitrogen, Carlsbad, CA) was used for amplification of the functional chloramphenical cassette. T-SACK DNA template was used for the initial amplification of the chloramphenicol cassette, but secondary amplification was performed with PCR product template for increased DNA concentrations (approximately 400 ng/μl). PCR products were purified to eliminate unincorporated primers, primer-dimers, and non-specific amplification products with the QIAquick PCR Purification Kit (Qiagen Sciences, Inc., Germantown, MD). DNA concentration and quality was determined using the Nanodrop ND-100 UV-visible wavelength spectrophotometer (NanoDrop Technologies, Wilmington, DE). Lastly, the chloramphenicol cassette was visualized by confirming the correct band size, 1,111 bp, through gel electrophoresis.
Gene Deletion Mutants
The Quick & Easy E. coli Gene Deletion Kit (Gene Bridges, Heidelberg, Germany) was used according to manufacturer's protocol, with some exceptions, to produce gene deletion mutants. E. coli strains B201 and B241 were grown as stated for gene deletion experiments and transformed with 5 μl Red/ET expression plasmid carrying a functional amp region (pRedET, 20 ng/μl) by electroporation (Eppendorf 2510 Electroporator) at 1350 V, 10μF, 600 Ohms with a 5 ms pulse rate. Transformants (B201+pRedET and B241+pRedET) were selected on LB-ampicillin agar grown at 30°C overnight. Transformant colonies were grown as stated for gene deletion experiments, but at 30°C in LBG supplemented with ampicillin. Overnight cultures (30 μl) were re-inoculated in fresh media conditioned with ampicillin at 30°C for 2 h before inducing pRedET with 50 μl 10% L-arabinose and incubating at 37°C for 1 h. Induced cells were harvested in a cooled benchtop microcentrifuge (13,000 × g, 1 min, 4°C, Spectrafuge 24D Digital Microcentrifuge, Labnet International, Inc., Edison, NJ), decanted, and re-suspended in sterile ice cold de-ionized water three times before electroporation with the chloramphenicol cassette (1 μg/μl). Electroporated transformants were added to 1.0 ml LBG without antibiotics and incubated at 37°C for 3 h for recombineering to occur. Recombinant colonies were grown on LB agar conditioned with chloramphenicol at 37°C overnight.
Gel Electrophoresis and Sequencing of Gene Deletion Mutants
Gene deletion mutants were confirmed through colony PCR. Briefly, recombinant and wild-type colonies were re-suspended in 30 μl of de-ionized water and incubated at 98°C for 5 min to lyse cells. PCR was performed with Platinum PCR Supermix High Fidelity recombinant and wild-type DNA templates (2 μl), linear cassette primers, and sequencing primers. PCR products were visualized by agarose gel electrophoresis, ran at 65V for 100 min, and confirmed by band size by comparison with standards (accession number CP015020 and CP015023 for B201 and B241, respectively). Additionally, gene deletion mutants and wild-type target genes were confirmed through PCR product sequencing by Eton Biosciences, Inc. (Durham, NC). PCR product chromatographs were analyzed through FinchTV software (Perkin Elmer, Waltham, MA) and the corresponding sequences were aligned with B201 (accession number CP015020) and B241 (accession number CP015023) sequences through GenBank Blastn software (National Center for Biotechnology Information, Bethesda, MD; Baranzoni et al., 2016).
Statistical Analysis
All experiments were done with three or more independent replications. Statistical analysis for acid challenge and CT data was performed in SAS (version 9.4 software, SAS Institute, Inc., Cary, NC). Differences (p < 0.05) in acid resistance between bacterial strains were determined using the student t-test. Distribution and variance was determined (p < 0.05) through the Shapiro-wilk and Fligner-Killeen tests, respectively. Differences (p < 0.05) in acid resistance between the presence or absence of flocculation or curli fimbriae production were determined using the Welch t-test, due to the data not being distributed normally and having heterogeneous variance. Differences (p < 0.05) between strain gene expression were analyzed with both ΔCT and linearized () values by student t-test controlling the False Discovery Rate using Benjamini-Hochberg correction.
Results
Characterization of Flocculating and Planktonic STEC Strains
When grown in M9GT, the flocculation phenotype was found to correlate to acid sensitivity (p < 0.05). Planktonic strains were in general more acid resistant than flocculating strains, typically having less than a 1 log reduction in cell number in the acid resistance assay (Table 1). These strains were designated PAR (planktonic acid resistant). Flocculating strains had greater acid sensitivity, and were designated FAS (flocculating acid sensitive). Of the 26 E. coli strains tested 6 were defined as FAS, including a K-12 strain, while 18 were classified as PAR (Table 1). Two remaining strains (B250 and B266) had an intermediate phenotype and were designated FAR (flocculating acid resistant). B241 and B201 were chosen as representative PAR and FAS strains because of contrasting acid resistance, with log reduction values of 0.15 and 2.42, respectively, in the acetic acid assay (Table 1). B201 was isolated from apple cider, and B241 was a bovine isolate. These two O157:H7 strains have been sequenced (Baranzoni et al., 2016) and both STEC strains had similar genome size and content, and each strain harbored a large 81 kb (B241) or 95 kb (B201) plasmid.
Figure 1 shows the flocculation phenotype for representative strains B201 (FAS, 2.42 log reduction) and suspended phenotype for B241 (PAR, 0.15 log reduction) grown in M9GT and LBG. Additionally, acid resistance of 3 of the 26 strains B201, B241, and B250 (FAR, 0.17 log reduction) was tested when the strains were grown in M9GT with and without supplemental glycine. No significant difference was seen in viability between strains grown in M9GT and LBG. Flocculation was not apparent regardless of acid resistance phenotype in complex medium or M9GT with glycine supplementation (Figure 1).
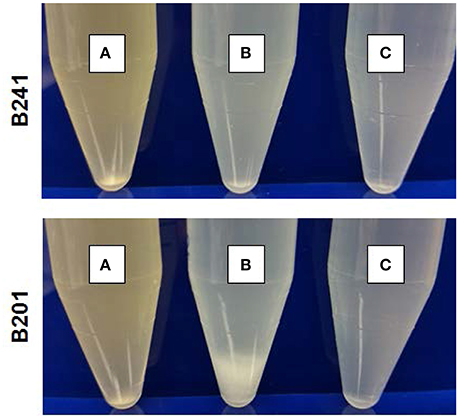
Figure 1. Growth of E. coli O157:H7 PAR strain B241 (top) and FAS strain B201 (bottom) in (A) LBG, (B) M9GT, and (C) M9GT supplemented with 1% glycine. Representative flocculation phenotype is displayed by FAS strain B201 in M9GT whereas flocculation is repressed with glycine supplementation.
Curli Expression for Acid Sensitive and Resistant STEC
Strains B201 and B241 were grown in both M9GT and LBG and subjected to TEM. We found that B201 cells grown in M9GT appeared in clumps with a network of fimbriae, and flagella were not observed (Figure 2A). These data indicated that B201 should be non-motile when grown in M9GT. Data from a motility test were inconclusive; however, B241 cells grown under the same conditions were not observed to have fimbriae or flagella (Figure 2B). However, B201 and B241 cells grown in LBG displayed flagella with no apparent fimbriae (Figures 2C,D, respectively). All strains were screened for the curli phenotype using CRI agar assay (Table 1). FAS strains all produced curli, and the curli phenotype was statistically associated (p < 0.05) with lower levels of acid resistance when compared to non-curli producing strains. Of the 20 acid resistant strains, 13 strains did not produce curli. Notably, acid resistant strain B250 exhibited high levels of curli production when compared to other resistant strains (Table 1). Interestingly, the calcofluor assay indicated that cellulose, which may be present during biofilm formation and associated with curli production, was not being produced by any of the strains (data not shown). Constructed curli deletion mutant B201ΔcsgD, which did not express the curli regulatory protein CsgD, did not flocculate when grown in M9GT. Unsurprisingly, no difference in phenotype was observed for B241ΔcsgD when grown in M9GT. Additional studies with B201ΔcsgD and B241ΔcsgD will be the subject to future work. These data support the hypothesis that curli fimbriae production was responsible for the flocculation seen in FAS STEC strains.
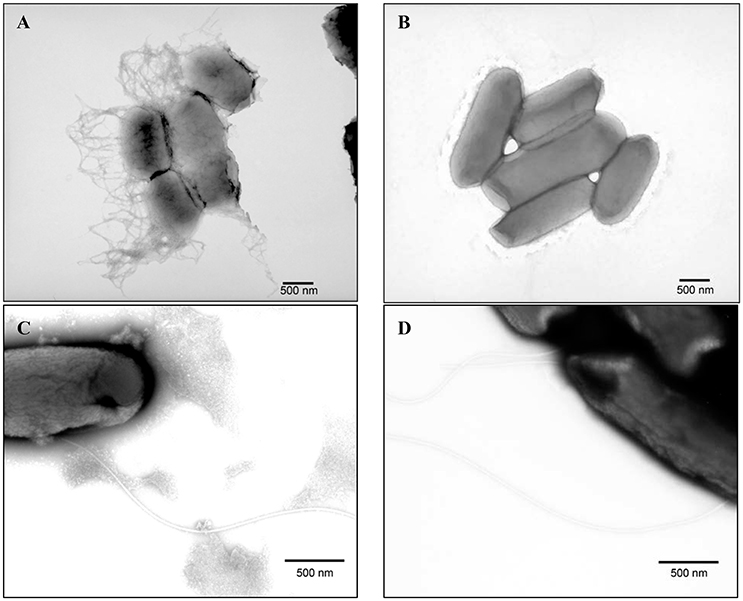
Figure 2. Transmission electron microscopy images of PTA stained (A) acid sensitive (B201) grown in M9GT exhibiting curli, (B) acid resistant (B241) grown in M9GT without curli, (C) acid sensitive (B201) grown in LBG exhibiting flagella, and (D) acid resistant (B241) grown in LBG exhibiting flagella.
The Carbon Storage, Flagella, and Chaperone Proteins
To determine if carbon storage gene regulation correlated with curli fimbriae and flagella expression, we examined the expression of target genes for carbon storage regulation csrABCD (Dubey et al., 2003; Suzuki et al., 2006; Jonas and Melefors, 2009), flagella, and biofilm production flhDC (Wei et al., 2001; Yakhnin et al., 2013), fliC (Ogasawara et al., 2011), mlrA (Uhlich et al., 2013), and pgaABCD (Wang et al., 2005) in B201 and B241 grown in M9GT using a transcriptomic approach. We found that csrB and csrC (and other genes encoding sRNAs, including the regulatory sRNA gcvB, see below) were not present in the Limma package output, and quantitative expression studies for these genes were done using RT-qPCR. Expression of csrA, flhC, flhD, mlrA, and pgaAB was significantly different (p < 0.05) between B201 and B241, where csrA was down-regulated (−5.43 fold change) for B201 in comparison to B241 when grown in minimal medium and flhC, flhD, mlrA, and pgaAB were up-regulated (+1.76, +1.56, +1.27, +2.53, and +1.67, respectively). Fold-change values were determined for carbon storage, csrBC, and biofilm, pgaCD, genes (−1.33, −1.41, +1.85 and +1.76, respectively) although no statistical significance (p > 0.05) between mRNA levels was seen. Average CT values and associated fold change are listed on Table 3. Transcriptomic analysis showed that some flagella genes, including the flagellar assembly protein FliH and the flagellar transcription regulatory protein FlhD were upregulated in B241 compared to B201, along with DnaK, ClpB, HtpG, and FimC precursor (Supplementary Table 1).
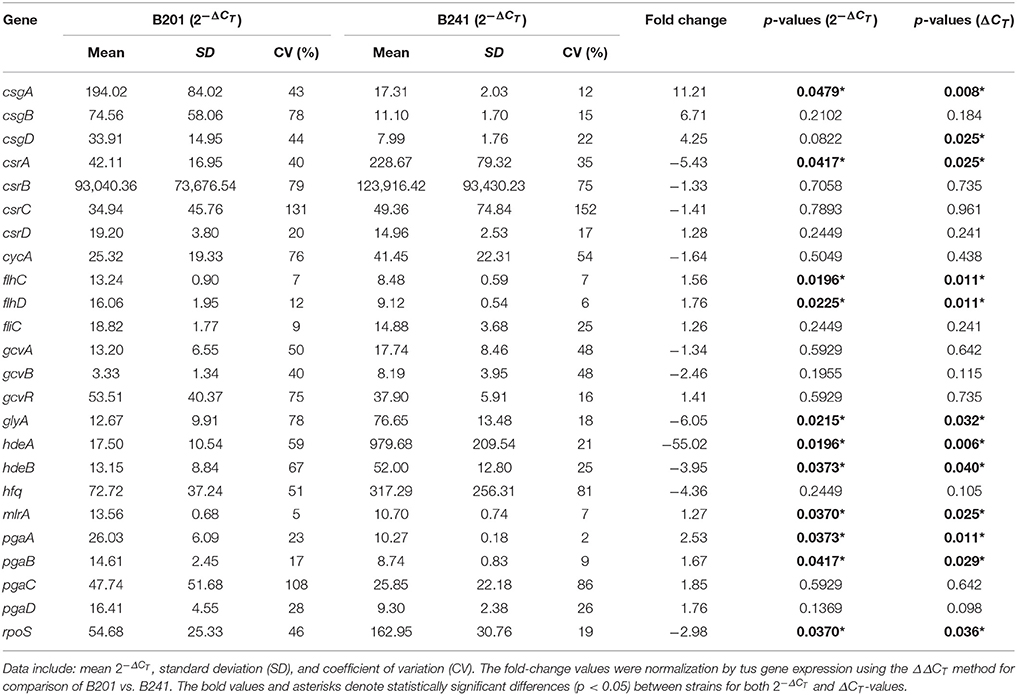
Table 3. Transcriptomics data for selected genes from strains B201 and B241.
The Curli Regulatory Network
To determine whether curli gene expression correlated with gcvB expression, we examined target genes csgBA, csgD, gcvAB, gcvR (Urbanowski et al., 2000), glyA (Ghaz-Jahanian et al., 2013), and hfq (Mika and Hengge, 2013) in B201 and B241. In addition to curli expression, we examined targets regulated by GcvB, such as, acid stress response (hdeAB and rpoS) and amino acid transport (cycA) genes. Expression of csgA, glyA, hdeAB, and rpoS was significantly different (p < 0.05) between B201 and B241, as measured by RT-qPCR by the transformation (Table 3). However, csgD was statistically significant (p < 0.05) when using the ΔCT method as well. The results supported the conclusions from the CRI assays that the genes required for the curli phenotype, csgA and csgD, were up-regulated (+11.21 and +4.25 fold change, respectively) for B201 in comparison to B241. Transcription levels for glyA (involved in glycine production and transport) were down-regulated (−6.05 fold change) in B201. Expression of rpoS was also down-regulated (−2.98 fold change) for B201 in comparison to B241. Furthermore, expression of hdeAB was down-regulated (−55.02 and −3.95 fold change, respectively). Fold-change values were determined for csgB, gcvAB, gcvR, and hfq genes (+6.71, −1.34, −2.46, +1.41 and −4.36 fold change, respectively), yet statistical analysis indicated that there was no significance (p > 0.05) between treatments. RNA-Seq transcriptomic data showed that csgBA were up-regulated, whereas hdeAB were down-regulated for B201 in comparison to B241. In addition, the glutamate decarboxylase (AR2) genes were upregulated in B241 (Supplementary Tables 1, 2). As expected, the genes showing the largest decrease in expression in B241 compared to B201 included csgA and csgB (Supplementary Table 2).
Effect of Glycine on Curli Expression
The glycine cleavage system, dependent on glycine concentrations in the environment, is known to regulate both curli and acid chaperone protein expression (Urbanowski et al., 2000; Jin et al., 2009; Stauffer and Stauffer, 2012a), thus addition of glycine to FAS strains was performed to determine if curli production persisted. The curli phenotype for B201 was not observed when glycine was added to M9GT medium (Figure 1), and similar results were observed for FAR strain B250 which had intermediate acid resistance-flocculation phenotype (Table 1). As expected, the addition of glycine to M9GT cultures of B241 had no effect (Figure 1). We examined the effects of exogenous glycine on the glycine cleavage system genes, curli expression, and acid induced chaperone proteins (Table 4). Expression of csgA, csgD, gcvA, mlrA, and rpoS was up-regulated in B201 compared to B201 supplemented with glycine (+1.07, +1.41, +1.66, +2.12, and +3.29 fold change, respectively). As expected, expression of cycA, gcvB, gcvR, glyA, hdeAB, and hfq was down-regulated (−1.32, −9.66, −1.11, −1.37, −12.65, −1.10, and −2.07 fold-change, respectively) in B201. Unexpectedly, csgB was also down-regulated (−1.39 fold-change). However, acid challenge of B201 in M9GT showed similar log reduction values with and without glycine supplementation (1.52 log reduction in M9GT and 1.45 log reduction in M9GT supplemented with glycine, data not shown).
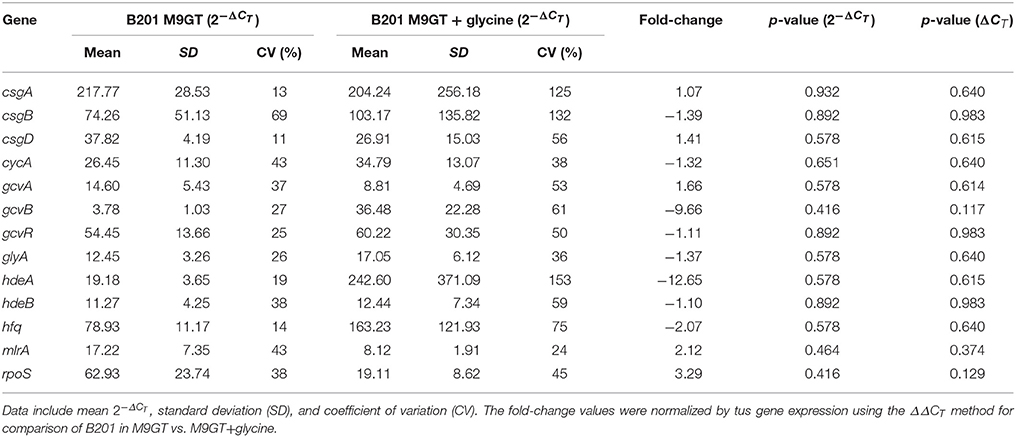
Table 4. Transcriptomics data for selected genes from strain B201 grown in M9GT and M9GT + glycine.
Regulation of Curli Expression in Strain B250
We measured expression of selected curli and chaperone target genes in strain B250, which was determined to be acid resistant, but exhibited the flocculation phenotype (Table 1). RT-qPCR data revealed that expression of csgA, cycA, gcvR, glyA, hdeAB, hfq, and rpoS was significantly different (p < 0.05) from B241, where csgA exhibited a +3.69 fold change in B250 in comparison to B241, yet no significant difference (p > 0.05) was seen in csgB or csgD expression (+9.15 and −1.07 fold change, respectively; Table 5). Expression of cycA and glyA was down-regulated (−3.50 and −6.75 fold change, respectively) in B250 when compared to B241, which was consistent with the data for strains B201 and B241. Additionally, gcvR and hfq expression was down-regulated (−1.86 and −14.77 fold change, respectively) in B250, although no statistically significant difference (p > 0.05) was seen in csgD, gcvA, or gcvB expression between treatments. Expression of hdeAB and rpoS was down-regulated (−87.80, −5.11, −12.55 fold change, respectively) in B250 in comparison to B241 which may account for the differences in acid sensitivity.
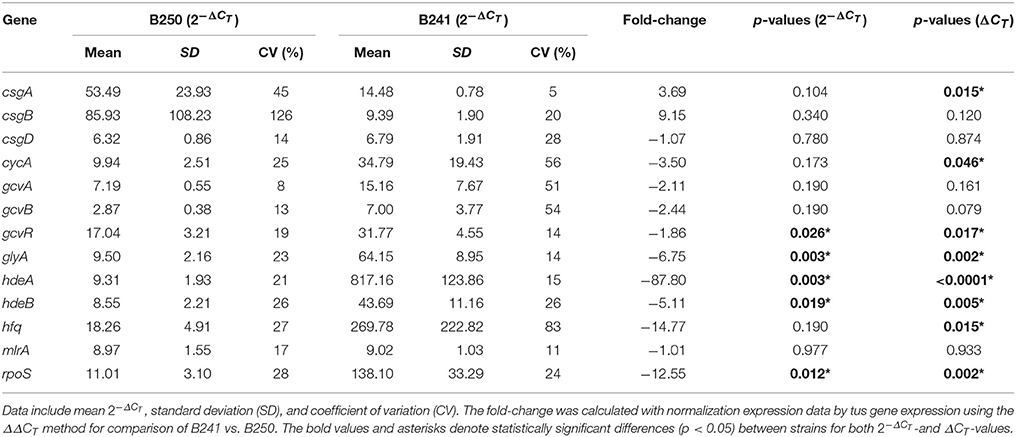
Table 5. Transcriptomics data for selected genes from strains B241 and B250.
Discussion
All strains grew normally in LBG (a complex medium), however flocculation and curli production was found to correlate with acid sensitivity in a minimal medium, M9GT. However, two of the more acid resistant strains, B250 and B266, flocculated when grown in M9GT (minimal medium). Our findings agree with previous research that determined that E. coli does not express curli in static broth (LBG) or agar plates at 37°C (Barnhart and Chapman, 2006). The flocculation phenotype described in our work has been seen previously under environmental stress, including LB supplemented with NaCl, for the Shiga-toxin producing E. coli O111 serogroup (Diodati et al., 2015). In that study, environmental and outbreak strains displayed the aggregative curli phenotype, which was proposed to be related to biofilm formation, while sporadic-case strains did not. Furthermore, our curli gene deletion mutant, B201ΔcsgD, was unable to express curli and did not flocculate when grown in M9GT. This observation proves that curli production is responsible for the flocculation phenotype observed in acid sensitive E. coli O157:H7 strains. In a study with E. coli O157:H7, curli production by strains grown in LB supplemented with NaCl was found to correlate with acid resistance (Carter et al., 2011). The data showed a 5-fold increase in the survival rate of non-curli variants after 6 h incubation in acidified broth when compared to curli variants challenged under the same conditions, although no regulatory link was proposed for curli and acid resistance. Carter et al. (2011) suggested that non-curli variants may be better fit for host colonization due to its acid resistance properties, whereas curliated E. coli O157:H7 may mediate attachment better to environmental surfaces such as, soils and plant tissues. Curli production may compensate for the absence of other fimbriae, such as, long polar fimbriae (Lpf), involved in colonization of human intestinal epithelial cells. For example, enhanced curli production and adhesion to cultured intestinal epithelial cells was seen in E. coli O157:H7 lpfA1 and lpfA2 deletion mutants after exposure to T84 cells (Lloyd et al., 2012a,b). Although the absence of Lpf did not activate curli production itself, alternative structures may be required under various environmental pressures. This transition suggests a regulatory connection between curli and Lpf, but specific mechanisms are currently unknown (Lloyd et al., 2012a,b). Using a proteomic approach (Gunther et al., 2014), Gunther and colleagues proposed a regulatory connection between the gad genes and the curli phenotype. Our transcriptomic data showed that glutamate decarboxylase genes were among those showing the largest increase in expression (Supplementary Table 1) for strain B241 compared to strain B201, which could contribute to the PAR phenotype we observed in M9GT, although further research would be needed to confirm this observation.
The carbon storage network of E. coli has been found to promote glycolysis and flagella production during growth in a complex medium, but gluconeogenesis and biofilm formation were stimulated by low pH and acetic acid (Suzuki et al., 2002; Mondragón et al., 2006; Jonas and Melefors, 2009; Chavez et al., 2010). Due to the glucose consumption during growth in M9GT, organic acid (primarily D-lactic acid) is produced by E. coli, which lowers the pH. These conditions led us to investigate csr genes in relation to the flocculation phenotype. We hypothesized that there would be increased expression of the sRNAs (CsrB and CsrC) that would affect other csr genes in FAS strain B201 compared to PAR strain B241. We found that the relative expression of csrA, flhDC, fliC, and pgaAB (for flagella and biofilm formation), was significantly different between FAS and PAR strains. Expression of csrBC, sRNA regulators, was not significantly different between B201 and B241 (Table 3). These data agree with other studies showing that decreased csrA expression correlated with increased biofilm through poly-N-acetylglucosamine production. Interestingly, we report decreased csrA expression with increased expression of flagella genes, flhDC. This appears to contradict reported findings from other studies on flagella formation regulation (Wei et al., 2001; Wang et al., 2005). We found that the carbon storage network affects biofilm formation and probably contributes to the flocculation phenotype, although we did not see regulation through csrC and csrB, small changes in sRNAs may account for large changes in target gene expression. It is likely that other changes in carbon metabolism are affecting this system that we did not evaluate.
For quantitative PCR data, the cycle threshold, or ΔCT, value is an exponential number based on a log-linear plot of the PCR signal vs. the cycle number. While some authors suggest statistical analysis on normalized untransformed ΔCT-values (Yuan et al., 2006), Livak and Schmittgen (2001) suggest performing statistical analysis with normalized exponential values, because the untransformed ΔCT-values may introduce more sample-to-sample variation. We found that the statistical significance for fold change for gene expression varied depending on method of calculation (transformed vs. untransformed), including csgD for comparisons between B201 and B241, as well as csgA, csgD, and hfq in comparison between B241 and B250. Changes in gene expression for these genes were statistically significant when analyzed with ΔCT-values but were not when analyzed with the -values. Because csgD appears to be a central regulatory molecule in acid resistance and curli production (influencing gadAB and csgBA expression, respectively), we therefore included both analyses in our data (Tables 3–5). Further work may be necessary to determine the significance of these observations, perhaps with increased replication of measurements.
Curli production by E. coli may aid biofilm formation under various environmental stresses (Olsén et al., 1989; Vidal et al., 1998; Uhlich et al., 2006; Ogasawara et al., 2007). The results of the CRI assay provide evidence for curli production by acid sensitive strains (Table 1). Although the K-12 strain we tested was considered acid sensitive, the CRI assay did not provide evidence for curli production. This is likely because previous research has found that E. coli K-12 produces curli at 37°C, but not on agar plates at this temperature (Barnhart and Chapman, 2006). Interestingly, mlrA expression, a MerR-like receptor controlled by RpoS that activates CsgD expression (Chen et al., 2013; Uhlich et al., 2013), was only significantly different between B201 and B241 despite the differences seen in rpoS expression between B241 and B250 (Tables 3, 5). This finding was surprising because PAR strain B241 had significantly higher expression of rpoS than B201 and B250, yet curli expression was higher in B201 and B250. This is in contrast to other studies showing that the Crl protein, required for curli production in most strains, up-regulates rpoS expression in response to temperature (Bougdour et al., 2004). RpoS then stimulates mlrA and thus csgD for curli production (Robbe-Saule et al., 2006; Ogasawara et al., 2009). Some strains of E. coli O157:H7 have been shown to differ in rpoS expression, with phage insertions in mlrA limiting curli production (Uhlich et al., 2013). Similar to our results, other research has shown that a sRNA, GcvB, helps activate RpoS as well as repress CsgD. Although we did not see statistical significance in gcvB expression between strains, we hypothesize that small change in sRNAs may cause large changes in target gene expression. This hypothesis is supported in both the RT-qPCR and global transcriptomics data via RNA-Seq, where the genes targeted by gcvB, csgD, and hdeAB, are affected according to previously reported gene regulation (Jin et al., 2009). These data support the regulatory pattern (i.e. lack of curli expression) we observed for PAR strain B241. While some PAR strains (B204, B244, B247, B264, and B269) had evidence of curli expression by the Congo red assay, the level of expression was evidently insufficient to result in flocculation.
Curli production has also been linked to the presence of glycine (Urbanowski et al., 2000; Pulvermacher et al., 2008; Jin et al., 2009). When levels of glycine are high in the environment, GcvA activates GcvB, which represses CsgD and curli production. GcvB also directly represses cycA, which acts as a transporter of extracellular glycine into the cell, under nutrient rich conditions (Stauffer and Stauffer, 2012b). Acid induced chaperone genes, hdeAB and rpoS, are positively regulated by the gcv system (Stauffer and Stauffer, 2012a). When levels of glycine are low in the environment, GcvA and GcvR repress GcvB, which relieves repression of CsgD and curli production (Urbanowski et al., 2000; Jorgensen et al., 2012). CsgD in turn regulates GlyA, which converts serine to glycine. We found that supplementing M9GT with glycine suppressed the flocculation phenotype in B201 (Figure 1), indicating that curli expression was prevented. Unexpectedly, no differences in gene expression were seen between strains B201 and B201 supplemented with glycine even though the flocculation phenotype was relieved when grown in the presence of exogenous glycine. Fold-change observations are consistent with a model of gene regulation depicting the relationship between curli production in minimal medium and acid sensitivity (Figure 3). It is possible that a glycine-based feedback loop mediated by GcvB in B201 modulates curli expression, although other factors (indicated by question marks in Figure 3) may affect GcvB control of CycA and GlyA under nutrient limitation.
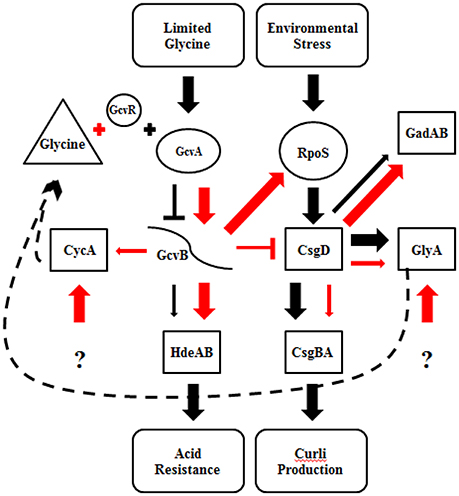
Figure 3. Regulatory model for curli expression and acid resistance phenotype of STEC strains B201 and B241. Proposed gene regulation of FAS (black) and PAR (red) STEC strains. The thickness of the arrows represents the amount of transcription, where thinner arrows indicate less transcription than thicker arrows. Barred lines represent transcription repression, the arrows increased transcription. The dashed line represents a proposed glycine feedback loop. Gene target categories are grouped by shape; regulatory genes (boxes), glycine cleavage system and RpoS (circles), sRNA (curved line), environmental conditions (oval), and glycine (triangle). The question mark indicates unknown effectors.
Previous findings for strains grown in complex medium show that GcvB represses GlyA due to CsgD repression (Stauffer and Stauffer, 2012b). The phenotypes observed may be due to selective pressure, where survival of acid sensitive strains under nutrient starvation may depend on biofilm formation (presaged by curli), whereas more acid resistant strains do not require this survival strategy. Previously, Oh et al. (2009) compared resistant and sensitive strains and found that strains of animal origin may (in general) be more acid resistant than food or human isolates, although acid resistance mechanisms were not addressed. Further research will focus on determining the effects of gene knockouts and complementation of target genes, gcvB and hdeAB, on FAS and PAR phenotypes, as well as the generation of metabolomic, proteomic, and additional transcriptomic data for these strains. These experiments may help to confirm our proposed model and possibly identify additional regulatory factors promoting curli formation in FAS and PAR STEC strains.
Author Contributions
KK, GK, and DO performed laboratory analysis of acid resistance of STEC strains. KK conducted the quantitative reverse transcriptase PCR. PF, GB, and GK conducted transcriptomic analysis and KK and GB contributed to statistical analysis of the data. FB, AG, PF, and DO contributed to the original conception and design of the work. All authors contributed to the drafting the manuscript and have agreed to support submission for publication.
Funding
This research was supported in part by an appointment to the Agricultural Research Service (ARS) Research Participation Program administered by the Oak Ridge Institute for Science and Education (ORISE) through an interagency agreement between the U.S. Department of Energy (DOE) and the USDA. ORISE is managed by ORAU under DOE contract number DE-AC05-06OR23100.
Disclaimer
Mention of a trademark or proprietary product does not constitute a guarantee or warranty of the product by the U. S. Department of Agriculture or North Carolina Agricultural Research Service, nor does it imply approval to the exclusion of other products that may be suitable. USDA is an equal opportunity provider and employer.
Conflict of Interest Statement
The authors declare that the research was conducted in the absence of any commercial or financial relationships that could be construed as a potential conflict of interest.
Acknowledgments
The authors would like to thank Dr. Lee-Ann Jaykus, NCSU Dept. of Food, Bioprocessing and Nutrition Sciences, for assistance with quantitative PCR experiments, Mr. Robert Price for lab assistance, Ms. Valerie Lapham with electron microscopy, Dr. Cameron Parsons for helpful discussions and lab aid. We also thank Dr. Sophia Kathariou for helpful review of the manuscript, Dr. Jason Osbourne for help with statistical analysis, and Sandra Parker for excellent editorial and administrative assistance.
Supplementary Material
The Supplementary Material for this article can be found online at: http://journal.frontiersin.org/article/10.3389/fmicb.2017.01404/full#supplementary-material
References
Baranzoni, G. M., Fratamico, P. M., Reichenberger, E. R., Kim, G.-H., Breidt, F., Kay, K., et al. (2016). Complete genome sequences of Escherichia coli O157:H7 strains SRCC 1675 and 28RC, which vary in acid resistance. Genome Announc. 4:e00743–16. doi: 10.1128/genomeA.00743-16
Barnhart, M. M., and Chapman, M. R. (2006). Curli biogenesis and function. Ann. Rev. Microbiol. 60, 131–147. doi: 10.1146/annurev.micro.60.080805.142106
Bearson, B. L., Lee, I. S., and Casey, T. A. (2009). Escherichia coli O157:H7 glutamate- and arginine-dependent acid-resistance systems protect against oxidative stress during extreme acid challenge. Microbiology 155, 805–812. doi: 10.1099/mic.0.022905-0
Beloin, C., Roux, A., and Ghigo, J. M. (2008). Escherichia coli biofilms. Curr. Top. Microbiol. Immunol. 322, 249–289. doi: 10.1007/978-3-540-75418-3_12
Boehm, A., and Vogel, J. (2012). The csgD mRNA as a hub for signal integration via multiple small RNAs. Mol. Microbiol. 84, 1–5. doi: 10.1111/j.1365-2958.2012.08033.x
Bougdour, A., Lelong, C., and Geiselmann, J. (2004). Crl, a low temperature-induced protein in Escherichia coli that binds directly to the stationary phase σsubunit of RNA polymerase. J. Biol. Chem. 279, 19540–19550. doi: 10.1074/jbc.M314145200
Breidt, F., Hayes, J., and McFeeters, R. F. (2004). Independent effects of acetic acid and pH on survival of Escherichia coli in simulated acidified pickle products. J. Food Protoc. 67, 12–18. doi: 10.4315/0362-028X-67.1.12
Breidt, F., Hayes, J., and McFeeters, R. F. (2007). Determination of 5-log reduction times for food pathogens in acidified cucumbers during storage at 10 and 25°C. J. Food Protoc. 70, 2638–2641. doi: 10.4315/0362-028X-70.11.2638
Breidt, F., Kay, K., Cook, J., Osborne, J., Ingham, B., and Arritt, F. (2013). Determination of 5-log reduction times for Escherichia coli O157:H7, Salmonella enterica, or Listeria monocytogenes in acidified foods with pH 3.5 or 3.8 3. J. Food Protoc. 76, 1245–1249. doi: 10.4315/0362-028X.JFP-12-528
Brudzinski, L., and Harrison, M. A. (1998). Influence of incubation conditions on survival and acid tolerance response of Escherichia coli O157:H7 and non-O157:H7 isolates exposed to acetic acid. J. Food Protoc. 61, 542–546. doi: 10.4315/0362-028X-61.5.542
Buchanan, R. L., and Doyle, M. P. (1997). Foodborne disease significance of Escherichia coli O157:H7 and other enterohemorrhagic E. coli. Food Technol. 51, 69–76.
Buchanan, R. L., and Edelson, S. G. (1996). Culturing enterohemorrhagic Escherichia coli in the presence and absence of glucose as a simple means of evaluating the acid tolerance of stationary- phase cells. Appl. Environ. Microbiol. 62, 4009–4013.
Carter, M. Q., Brandl, M. T., Louie, J. W., Kyle, J. L., Carychao, D. K., Cooley, M. B., et al. (2011). Distinct acid resistance and survival fitness displayed by curli variants of Enterohemorrhagic Escherichia coli O157:H7. Appl. Environ. Microbiol. 77, 3685–3695. doi: 10.1128/AEM.02315-10
Castanie-Cornet, M. P., Penfound, T. A., Smith, D., Elliott, J. F., and Foster, J. W. (1999). Control of acid resistance in Escherichia coli. J. Bacteriol. 181, 3525–3535.
Chavez, R. G., Alvarez, A. F., Romeo, T., and Georgellis, D. (2010). The physiological stimulus for the BarA sensor kinase. J. Bacteriol. 192, 2009–2012. doi: 10.1128/JB.01685-09
Chen, C.-Y., Hofmann, C. S., Cottrell, B. J., Strobaugh, T. P. Jr., Paoli, G. C., Nguyen, L.-H., et al. (2013). Phenotypic and genotypic characterization of biofilm forming capabilities in non-O157 Shiga toxin-producing Escherichia coli strains. PLoS ONE 8:e84863. doi: 10.1371/journal.pone.0084863
Chen, S., Lesnik, E. A., Hall, T. A., Sampath, R., Griffey, R. H., Ecker, D. J., et al. (2002). A bioinformatics based approach to discover small RNA genes in the Escherichia coli genome. Biosystems 65, 157–177. doi: 10.1016/S0303-2647(02)00013-8
Crépin, S., Houle, S., Charbonneau, M.-È., Mourez, M., Harel, J., and Dozois, C. M. (2012). Decreased expression of type 1 fimbriae by a pst mutant of uropathogenic Escherichia coli reduces urinary tract infection. Infect. Immun. 80, 2802–2815. doi: 10.1128/IAI.00162-12
Diez-Gonzalez, F., and Russell, J. B. (1997). The ability of Escherichia coli 0157:H7 to decrease its intracellular pH and resist the toxicity of acetic acid. Microbiology 143, 1175–1180. doi: 10.1099/00221287-143-4-1175
Diez-Gonzalez, F., and Russell, J. B. (1999). Factors affecting the extreme acid resistance of Escherichia coli O157:H7. Food Microbiol. 16, 367–374. doi: 10.1006/fmic.1998.0249
Diodati, M. E., Bates, A. H., Cooley, M. B., Walker, S., Mandrell, R. E., and Brandl, M. T. (2015). High genotypic and phenotypic similarity among Shiga toxin–producing Escherichia coli O111 environmental and outbreak strains. Foodborne Pathog. Dis. 12, 235–243. doi: 10.1089/fpd.2014.1887
Dubey, A. K., Baker, C. S., Suzuki, K., Jones, A. D., Pandit, P., Romeo, T., et al. (2003). CsrA regulates translation of the Escherichia coli carbon starvation gene, cstA, by blocking ribosome access to the cstA transcript. J. Bacteriol. 185, 4450–4460. doi: 10.1128/JB.185.15.4450-4460.2003
Foster, J. W. (2004). Escherichia coli acid resistance: tales of an amateur acidophile. Nat. Rev. Microbiol. 2, 898–907. doi: 10.1038/nrmicro1021
Ghaz-Jahanian, M. A., Khodaparastan, F., Berenjian, A., and Jafarizadeh-Malmiri, H. (2013). Influence of small RNAs on biofilm formation process in bacteria. Mol. Biotechnol. 55, 288–297. doi: 10.1007/s12033-013-9700-6
Gunther, N. W., Liu, Y., Nunez, A., Paul, M., and Uhlich, G. A. (2014). Nonlabeled quantitative proteomic comparison identifies differences in acid resistance between Escherichia coli O157:H7 curli production variants. Foodborne Pathog. Dis. 11, 30–37. doi: 10.1089/fpd.2013.1570
Hammar, M., Arnqvist, A., Bian, Z., Olsén, A., and Normark, S. (1995). Expression of two csg operons is required for production of fibronectin- and congo red-binding curli polymers in Escherichia coli K-12. Mol. Microbiol. 18, 661–670. doi: 10.1111/j.1365-2958.1995.mmi_18040661.x
Hersh, B. M., Farooq, F. T., Barstad, D. N., Blankenhorn, D. L., and Slonczewski, J. L. (1996). A glutamate-dependent acid resistance gene in Escherichia coli. J. Bacteriol. 178, 3978–3981. doi: 10.1128/jb.178.13.3978-3981.1996
Iyer, R., Williams, C., and Miller, C. (2003). Arginine-agmatine antiporter in extreme acid resistance in Escherichia coli. J. Bacteriol. 185, 6556–6561. doi: 10.1128/JB.185.22.6556-6561.2003
Jin, Y., Watt, R. M., Danchin, A., and Huang, J. (2009). Small noncoding RNA GcvB is a novel regulator of acid resistance in Escherichia coli. BMC Genomics 10:165. doi: 10.1186/1471-2164-10-165
Jonas, K., and Melefors, Ö. (2009). The Escherichia coli CsrB and CsrC small RNAs are strongly induced during growth in nutrient-poor medium. FEMS Microbiol. Lett. 297, 80–86. doi: 10.1111/j.1574-6968.2009.01661.x
Jorgensen, M. G., Nielsen, J. S., Boysen, A., Franch, T., Møller-Jensen, J., and Valentin-Hansen, P. (2012). Small regulatory RNAs control the multi-cellular adhesive lifestyle of Escherichia coli. Mol. Microbiol. 84, 36–50. doi: 10.1111/j.1365-2958.2012.07976.x
Li, X.-T., Thomason, L., Sawitzke, J., Costantino, N., and Court, D. (2013). Positive and negative selection using the tetA-sacB cassette: recombineering and P1 transduction in Escherichia coli. Nucleic Acids Res. 41, e204. doi: 10.1093/nar/gkt1075
Lin, J., Lee, I. S., Frey, J., Slonczewski, J. L., and Foster, J. W. (1995). Comparative analysis of extreme acid survival in Salmonella typhimurium, Shigella flexneri, and Escherichia coli. J. Bacteriol. 177, 4097–4104. doi: 10.1128/jb.177.14.4097-4104.1995
Lin, J., Smith, M. P., Chapin, K. C., Baik, H. S., Bennett, G. N., and Foster, J. W. (1996). Mechanisms of acid resistance in enterohemorrhagic Escherichia coli. Appl. Environ. Microbiol. 62, 3094–3100.
Livak, K. J., and Schmittgen, T. D. (2001). Analysis of relative gene expression data using real-time quantitative PCR and the 2−ΔΔCT method. Methods 25, 402–408. doi: 10.1006/meth.2001.1262
Lloyd, S. J., Ritchie, J. M., Rojas-Lopez, M., Blumentritt, C. A., Popov, V. L., Greenwich, J. L., et al. (2012a). A double, long polar fimbria mutant of Escherichia coli O157:H7 expresses curli and exhibits reduced in vivo colonization. Infect. Immun. 80, 914–920. doi: 10.1128/IAI.05945-11
Lloyd, S. J., Ritchie, J. M., and Torres, A. G. (2012b). Fimbriation and curliation in Escherichia coli O157:H7. Gut Microbes 3, 272–276. doi: 10.4161/gmic.20661
Mika, F., and Hengge, R. (2013). Small regulatory RNAs in the control of motility and biofilm formation in E. coli Salmonella. Int. J. Mol. Sci. 14, 4560–4579. doi: 10.3390/ijms14034560
Miller, L. G., and Kaspar, C. W. (1994). Escherichia coli 0157:H7 acid tolerance and survival in apple cider. J. Food Protoc. 57, 1–5. doi: 10.4315/0362-028X-57.6.460
Mondragón, V., Franco, B., Jonas, K., Suzuki, K., Romeo, T., Melefors, Ö., et al. (2006). pH-dependent activation of the BarA-UvrY two-component system in Escherichia coli. J. Bacteriol. 188, 8303–8306. doi: 10.1128/JB.01052-06
Ogasawara, H., Hasegawa, A., Kanda, E., Miki, T., Yamamoto, K., and Ishihama, A. (2007). Genomic SELEX search for target promoters under the control of the PhoQP-RstBA signal relay cascade. J. Bacteriol. 189, 4791–4799. doi: 10.1128/JB.00319-07
Ogasawara, H., Kori, A., Yamada, K., Yamamoto, K., and Ishihama, A. (2009). Regulation of the E. coli csgD gene encoding the master regulator of biofilm formation: Interplay between multiple transcription factors. Microbiology 156, 2470–2483. doi: 10.1099/mic.0.039131-0
Ogasawara, H., Yamamoto, K., and Ishihama, A. (2011). Role of the biofilm master regulator CsgD in cross-regulation between biofilm formation and flagellar synthesis. J. Bacteriol. 193, 2587–2597. doi: 10.1128/JB.01468-10
Oh, D.-H., Pan, Y., Berry, E., Cooley, M., Mandrell, R., and Breidt, F. (2009). Escherichia coli O157:H7 strains isolated from environmental sources differ significantly in acetic acid resistance compared with human outbreak strains. J. Food Protoc. 72, 503–509. doi: 10.4315/0362-028X-72.3.503
Olsén, A., Jonsson, A., and Normark, S. (1989). Fibronectin binding mediated by a novel class of surface organelles on Escherichia coli. Lett. Nat. 338, 652–655. doi: 10.1038/338652a0
Park, S., Worobo, R. W., and Durst, R. A. (2001). Escherichia coli O157:H7 as an emerging foodborne pathogen: a literature review. Crit. Rev. Biotechnol. 21, 27–48. doi: 10.1080/20013891081674
Pennington, H. (2010). Escherichia coli O157. Lancet 376, 1428–1435. doi: 10.1016/S0140-6736(10)60963-4
Pesavento, C., Becker, G., Sommerfeldt, N., Possling, A., Tschowri, N., Mehlis, A., et al. (2008). Inverse regulatory coordination of motility and curli-mediated adhesion in Escherichia coli. Genes Dev. 22, 2434–2446. doi: 10.1101/gad.475808
Porcheron, G., Habib, R., Houle, S., Caza, M., Lépine, F., Daigle, F., et al. (2014). The small RNA RyhB contributes to siderophore production and virulence of uropathogenic Escherichia coli. Infect. Immun. 82, 5056–5068. doi: 10.1128/IAI.02287-14
Pulvermacher, S. C., Stauffer, L. T., and Stauffer, G. V. (2008). The role of the small regulatory RNA GcvB in GcvB/mRNA posttranscriptional regulation of oppA and dppA in Escherichia coli. FEMS Microbiol. Lett. 281, 42–50. doi: 10.1111/j.1574-6968.2008.01068.x
Rangel, J. M., Sparling, P. H., Crowe, C., Griffin, P. M., and Swerdlow, D. L. (2005). Epidemiology of Escherichia coli O157:H7 outbreaks, United States, 1982-2002. Emerg. Infect. Dis. 11, 603–609. doi: 10.3201/eid1104.040739
Robbe-Saule, V., Jaumouillé, V., Prévost, M. C., Guadagnini, S., Talhouarne, C., Mathout, H., et al. (2006). Crl activates transcription initiation of RpoS-regulated genes involved in the multicellular behavior of Salmonella enterica serovar Typhimurium. J. Bacteriol. 188, 3983–3994. doi: 10.1128/JB.00033-06
Stauffer, L. T., and Stauffer, G. V. (2012a). Antagonistic roles for GcvA and GcvB in hdeAB expression in Escherichia coli. ISRN Microbiol. 2012, 1–10. doi: 10.5402/2012/697308
Stauffer, L. T., and Stauffer, G. V. (2012b). The Escherichia coli GcvB sRNA uses genetic redundancy to control cycA expression. ISRN Microbiol. 2012, 1–10. doi: 10.5402/2012/636273
Suzuki, K., Babitzke, P., Kushner, S. R., and Romeo, T. (2006). Identification of a novel regulatory protein (CsrD) that targets the global regulatory RNAs CsrB and CsrC for degradation by RNase E. Genes Dev. 20, 2605–2617. doi: 10.1101/gad.1461606
Suzuki, K., Wang, X., Weilbacher, T., Pernestig, A., Georgellis, D., Babitzke, P., et al. (2002). Regulatory circuitry of the CsrA/CsrB and BarA/UvrY Systems of Escherichia coli. J. Bacteriol. 184, 5130–5140. doi: 10.1128/JB.184.18.5130-5140.2002
Uhlich, G. A., Chen, C. Y., Cottrell, B. J., Hofmann, C. S., Dudley, E. G., Strobaugh, T. P., et al. (2013). Phage insertion in mlrA and variations in rpoS limit curli expression and biofilm formation in Escherichia coli serotype O157:H7. Microbiology 159, 1586–1596. doi: 10.1099/mic.0.066118-0
Uhlich, G. A., Cooke, P. H., and Solomon, E. B. (2006). Analyses of the red-dry-rough phenotype of an Escherichia coli O157:H7 strain and its role in biofilm formation and resistance to antibacterial agents analyses of the red-dry-rough phenotype of an Escherichia coli O157:H7 strain and its role in biofilm. Appl. Environ. Microbiol. 72, 2564–2562. doi: 10.1128/AEM.72.4.2564-2572.2006
Urbanowski, M. L., Stauffer, L. T., and Stauffer, G. V. (2000). The gcvB gene encodes a small untranslated RNA involved in expression of the dipeptide and oligopeptide transport systems in Escherichia coli. Mol. Microbiol. 37, 856–868. doi: 10.1046/j.1365-2958.2000.02051.x
US Food and Drug Administration (2012). Food for Human Consumption. Acidified Foods. 21 CFR 114. Washington, DC: US Food and Drug Administration.
Vidal, O., Longin, R., Prigent-Combaret, C., Dorel, C., Hooreman, M., and Lejeune, P. (1998). Isolation of an Escherichia coli K-12 mutant strain able to form biofilms on inert surfaces: involvement of a new ompR allele that increases curli expression. J. Bacteriol. 180, 2442–2449.
Wang, X., Dubey, A. K., Suzuki, K., Baker, C. S., Babitzke, P., and Romeo, T. (2005). CsrA post-transcriptionally represses pgaABCD, responsible for synthesis of a biofilm polysaccharide adhesin of Escherichia coli. Mol. Microbiol. 56, 1648–1663. doi: 10.1111/j.1365-2958.2005.04648.x
Wei, B. L., Brun-Zinkernagel, A. M., Simecka, J. W., Prüß, B. M., Babitzke, P., and Romeo, T. (2001). Positive regulation of motility and flhDC expression by the RNA-binding protein CsrA of Escherichia coli. Mol. Microbiol. 40, 245–256. doi: 10.1046/j.1365-2958.2001.02380.x
Yakhnin, A. V., Baker, C. S., Vakulskas, C. A., Yakhnin, H., Berezin, I., Romeo, T., et al. (2013). CsrA activates flhDC expression by protecting flhDC mRNA from RNase E-mediated cleavage. Mol. Microbiol. 87, 851–866. doi: 10.1111/mmi.12136
Keywords: STEC, acid resistance, nutrient limitation, curli, GcvB
Citation: Kay KL, Breidt F, Fratamico PM, Baranzoni GM, Kim G-H, Grunden AM and Oh D-H (2017) Escherichia coli O157:H7 Acid Sensitivity Correlates with Flocculation Phenotype during Nutrient Limitation. Front. Microbiol. 8:1404. doi: 10.3389/fmicb.2017.01404
Received: 14 November 2016; Accepted: 11 July 2017;
Published: 26 July 2017.
Edited by:
Lanming Chen, Shanghai Ocean University, ChinaReviewed by:
Analía Inés Etcheverría, National University of Central Buenos Aires, ArgentinaFrancisco Diez-Gonzalez, University of Georgia, United States
Jesús Santos, Universidad de León, Spain
Copyright © 2017 Kay, Breidt, Fratamico, Baranzoni, Kim, Grunden and Oh. This is an open-access article distributed under the terms of the Creative Commons Attribution License (CC BY). The use, distribution or reproduction in other forums is permitted, provided the original author(s) or licensor are credited and that the original publication in this journal is cited, in accordance with accepted academic practice. No use, distribution or reproduction is permitted which does not comply with these terms.
*Correspondence: Frederick Breidt, fred.breidt@ars.usda.gov