 Gordon T. Taylor*
 Elizabeth A. Suter
 Zhuo Q. LiStephanie ChowDallyce StintonTatiana Zaliznyak
 Steven R. Beaupré
- School of Marine and Atmospheric Sciences, Stony Brook University, Stony Brook, NY, United States
A new method to measure growth rates of individual photoautotrophic cells by combining stable isotope probing (SIP) and single-cell resonance Raman microspectrometry is introduced. This report explores optimal experimental design and the theoretical underpinnings for quantitative responses of Raman spectra to cellular isotopic composition. Resonance Raman spectra of isogenic cultures of the cyanobacterium, Synechococcus sp., grown in 13C-bicarbonate revealed linear covariance between wavenumber (cm−1) shifts in dominant carotenoid Raman peaks and a broad range of cellular 13C fractional isotopic abundance. Single-cell growth rates were calculated from spectra-derived isotopic content and empirical relationships. Growth rates among any 25 cells in a sample varied considerably; mean coefficient of variation, CV, was 29 ± 3% (σ/), of which only ~2% was propagated analytical error. Instantaneous population growth rates measured independently by in vivo fluorescence also varied daily (CV ≈ 53%) and were statistically indistinguishable from single-cell growth rates at all but the lowest levels of cell labeling. SCRR censuses of mixtures prepared from Synechococcus sp. and T. pseudonana (a diatom) populations with varying 13C-content and growth rates closely approximated predicted spectral responses and fractional labeling of cells added to the sample. This approach enables direct microspectrometric interrogation of isotopically- and phylogenetically-labeled cells and detects as little as 3% changes in cellular fractional labeling. This is the first description of a non-destructive technique to measure single-cell photoautotrophic growth rates based on Raman spectroscopy and well-constrained assumptions, while requiring few ancillary measurements.
Introduction
Ecological theory suggests that predictions about population dynamics in planktonic systems have limited skill if intraspecific trait variation and heterogeneous resource distributions are ignored. Intraspecific trait variation within microalgal and bacterial populations has been shown to non-linearly affect intra- and interspecific interactions and population responses to resource availability, pathogens, and predators (Hellweger and Kianirad, 2007; Bolnick et al., 2011; Bucci et al., 2012). Such trait variations can arise from any of the following: physiological history of individual cell lines, niche plasticity, natural selection, mutation, genetic drift, or recombinant events (Bolnick et al., 2011). Even clonal populations (isogenic) in apparently homogenous cultures exhibit varying genetics, biochemistry, physiology, and behavior, all of which can produce a range of “growth phenotypes” (Lidstrom and Konopka, 2010; Damodaran et al., 2015; Kopf et al., 2015). This recognition has given rise to agent-based or individual-based models which don't assume that cell attributes within a population are uniformly or normally distributed around their mean values (e.g., Hellweger and Kianirad, 2007). In addition, aquatic ecologists and biogeochemists now recognize that the planktonic realm has fine-scale structure imposed by heterogeneous distributions of nutrients, oxygen, particles, colonial microbes, and polymeric gels, as well as by metazoan behavior, and symbiotic associations (Azam, 1998; Simon et al., 2002; Wagner et al., 2006; Stocker, 2012; Gemmell et al., 2016). Historically however, the vast majority of measurements have overlooked this microspatial heterogeneity and cryptic material exchanges (e.g., Canfield et al., 2010), and have provided net biogeochemical transformations at best. They also fail to unequivocally link key players to particular processes. These limitations hamper a deeper mechanistic understanding of planktonic dynamics. Single-cell techniques are the only way forward to empirically determine how intraspecific phenotypic/genotypic variations and microspatial architecture (the aquascape) determine individual ecophysiologies and translate into collective population responses.
Several single-cell technologies have enabled examination of intra-population variability in genotype, phenotype, activity and cellular growth. Single-cell genomics and transcriptomics provide unique information on genetic variations and are gaining popularity in the aquatic sciences (Stepanauskas, 2012; Wu et al., 2014). The synchrotron X-ray microprobe has provided insights into intraspecific variability in individual cell elemental stoichiometries (Twining et al., 2008). Highly sensitive serial resonant mass sensor arrays have enabled measurement of changes in buoyant masses of bacterial and mammalian cells as they transit through microfluidic channels, thereby tracking somatic growth of individual cells through time (Cermak et al., 2016). Combining fluorescent in situ hybridization (FISH) with microautoradiography (MAR-FISH) (Lee et al., 1999) or with secondary ion mass spectrometry (nano-SIMS-FISH) (Orphan et al., 2002) provides single-cell resolution for linking identity to ecophysiology in complex microbial assemblages. Nano-SIMS-FISH has been combined with SIP to detect nutrient assimilation by individual cells (Musat et al., 2008; Orphan et al., 2009; Foster et al., 2011). Using deuterated water (D2O) and 15 as tracers and SIP-Nano-SIMS analysis enabled Kopf et al. (2015) to demonstrate that intra-population variability in growth rates and ammonium assimilation could be measured in chemostat-grown bacterial cells. However, these techniques generally have low sample throughput, demanding sample preparation requirements, and can be costly in terms of time and/or money invested per cell, all of which can limit the scale of population surveys.
Raman microspectroscopy is amenable to single-cell applications and is complementary to MAR-FISH and nano-SIMS-FISH. Raman microspectroscopy has the advantages of non-destructively yielding intracellular molecular information, of requiring minimal sample preparation, and enabling rapid interrogation of many preserved or live cells. Recent advances in Raman microspectroscopic technology have dramatically broadened its microbiological applications (Brehm-Stecher and Johnson, 2004; Wagner, 2009; Huang et al., 2010; Wang et al., 2016). For example, Raman spectra of single cells have revealed metabolic histories and species identity, through characterization of an organism's macromolecular composition (e.g., Huang et al., 2004, 2007a; Hermelink et al., 2009; Hall et al., 2011). Huang et al. (2007b) demonstrated that intensity ratios of specific wavenumbers within Raman spectra from individual bacteria varied quantitatively with amount of 13C-glucose available. Furthermore, those cells were phylogenetically identifiable by FISH probing (SIP-Raman-FISH). Li et al. (2012) recently demonstrated that assimilation of 13C-enriched dissolved inorganic carbon (DIC) by individual photoautotrophic cells can be accurately quantified from wavenumber shifts in resonance Raman (SCRR) spectral peaks emanating from carotenoid pigments. Carotenoids are excellent target analytes because all photoautotrophic microbial taxa produce at least one form as accessory light-harvesting pigments or as protection against reactive oxygen species (Garcia-Asua et al., 1998). They are easily resolved by resonance Raman scattering, which increases photon scattering efficiency over spontaneous Raman scattering by at least a 1,000-fold by using laser excitation within the electronic transition frequency band of the analyte (e.g., Taylor et al., 1990; Robert, 2009).
We present a refinement of the SIP-SCRR-FISH approach (Li et al., 2012) that now enables quantitative Raman spectrometric measurement of growth rates in individual photoautotrophic cells. We use this tool to examine growth as the ultimate expression of inter- and intraspecific trait variability. Cells from replicate isogenic Synechococcus sp. cultures provided with varying concentrations of 13C-bicarbonate were interrogated by SCRR through time course experiments to determine their degree of labeling from which single-cell growth rates were calculated and compared to independent measurements of population growth. 13C-labeled populations of Synechococcus sp. and the diatom, Thalassiosira pseudonana, growing at known, but different rates were mixed to demonstrate that SCRR could distinguish among them. Optimal experimental design, underlying assumptions, analytical precision, and intra-population heterogeneity are evaluated. This technique has the advantages of relatively high sample throughput, low analytical costs, and potential application to natural phytoplankton communities in field experiments.
Materials and Methods
Media Preparation and Cultivation Conditions
Phytoplankton cultures were grown in f/2 media (Guillard and Ryther, 1962) in which total inorganic carbon (CT = CO2 + H2CO3 + + ) was either replaced or augmented with varying proportions of 13C-enriched bicarbonate [; see Supplementary Material (SM) 1]. The 12C- and 13C-bicarbonate solutions (Cambridge Isotope Laboratories, Inc. Andover, MA; 99% 13C, 97% chemical purity) were prepared as 0.4 M working stocks. Nutrient and bicarbonate solutions were aseptically added to autoclaved filtered seawater (<0.22 μm = FSW) in 200-ml sealed septum bottles. CT concentrations were then measured using a flow injection analysis system and compared to known CT standards (Hall and Aller, 1992).
For the SIP experiment examining isotopic end-members, cultures of the cyanobacterium, Synechococcus sp. (RS9916), were grown at natural 13C abundances and at conditions under which 96% of the CT was replaced with 13C-bicarbonate by pH manipulation (see SM 1). For the SIP calibration experiment, complete f/2 media was augmented with sterile bicarbonate solutions with varying 13C abundances (fmedia = 13Cmedia/(12Cmedia + 13Cmedia)) and a mean final CT of 3.78 ± 0.10 mM C (2 mM added). To minimize variations in growth conditions, CT was kept constant while fmedia was manipulated. Nominal (gravimetric) fmedia determinations (0.011, 0.10, 0.20, 0.30, 0.40, and 0.50) were corrected to 0.011, 0.11, 0.22, 0.32, 0.43, and 0.54, respectively, based on actual fmedia measured by isotope ratio mass spectrometry (IRMS) at the UC Davis Stable Isotope Facility. After inoculation, each septum bottle was attached to its own venting system permitting atmospheric exchange of all gases, except CO2. Modifications of Li et al.'s (2012) venting system were as follows: Ascarite II™ (Thomas Scientific®) replaced NaOH pellets as our CO2 trap in open 30 ml syringe barrels, capped with polyester fiber, and connected to 0.2 μm in-line filters that were joined to septum bottles by 1/8” (O.D.) stainless steel swan neck tubes. The swan neck replaced vertical tubes to prevent condensate from the CO2 trap leaking into septum bottles during extended incubations and contaminating samples. Cultures were subsampled through time while incubating at 20°C on a rotating platform that assured uniform light exposure (48–63 μmol quanta m−2 s−1) during a 12:12 h light/dark cycle.
Directly evaluating the SIP-SCRR method's ability to measure varying fcell or growth rate in natural phytoplankton assemblages is difficult, if not impossible, without an independent method to measure non-uniform growth rates among the assemblage members. Therefore, a Synechococcus sp. assemblage was constructed by mixing equal volumes of 12-days cultures from six different fmedia ratios. These cells were ostensibly growing at the same rate, but had different fcell signatures due to exposure to different fmedia, essentially mimicking a mixed assemblage with varying growth rates. In a second experiment to compare contemporaneous slow-growing (Synechococcus sp.; mean g = 4.12 days) and fast-growing (T. pseudonana; mean g = 1.44 days) populations, cultures were grown in parallel at natural (0.011 fmedia) and elevated 13C abundances (0.48 fmedia) and subsampled through time. SCRR filters were prepared from mixtures of these cells as a mimic of a heterogeneous environmental sample.
Population Growth in SIP Experiments
Daily change in in vivo chlorophyll a fluorescence was used to measure population growth in all treatments. After gentle agitation, triplicate 200-μl subsamples were assayed in a Turner Designs® Aquafluor™ fluorometer, calibrated according to manufacturer's instructions. When required, subsamples were diluted with sterile f/2 to remain below 80% detector saturation. Population growth rates (μpop) were calculated from arbitrary fluorescence units (AFU) either as the regression slope of ln AFU vs. time for the entire exponential growth phase (mean μpop) or as the difference between neighboring ln AFUs within the time course (instantaneous μpop,inst = [ln AFUt+1–ln AFUt]/[(t+1)–t]). Direct microscopic cell counts in the control sample confirmed that AFU values were highly correlated with cell concentrations (r2 = 0.97, p < 0.001) during exponential growth phase, signifying that ΔAFU/Δt is a reliable proxy for population growth under our experimental conditions.
SCRR Sample Preparation from SIP Experiments
For SCRR microspectrometry sampling, volumes removed (0.25—5.00 ml) were adjusted to obtain cell densities of 20–50 cells per microscope field and replaced with N2 gas to prevent a partial vacuum within the incubation bottles. After vortexing subsamples, cells were collected on 25 mm 0.2 μm polycarbonate membranes (Millipore® GTTP™) and rinsed with phosphate-buffered saline and filtered to dryness. Membranes were then air-dried in Millipore® PetriSlides™ and stored at −20°C.
In early experiments, potential interference of Cy3 fluorescent oligonucleotide probes with SCRR data acquisition was evaluated on membrane subsamples subjected to FISH. Membrane wedges were hybridized with a general bacterial probe (EUBMIX: Amann et al., 1990; Daims et al., 1999) in 35% formamide for 2 h and washed with buffer for 30 min and stored at −20°C until analysis (Pernthaler et al., 2001).
Although polycarbonate membranes are widely used for FISH and other fluorescence microscopies, these and most other types of filters and membranes produce contaminating Raman emissions (Raman-active). Likewise, borosilicate glass slides and cover slips and most mounting fluids (Citifluor™, Vectashield™, Cargille® Type A™ immersion oil, and glycerol) are Raman-active, water being the exception. Therefore, we developed a technique to transfer cells from polycarbonate membranes to mirror-finished 304 stainless steel slides (1 × 3 × 0.0235″) supplied by Stainless Supply® (Monroe, NC USA). Prior to use, slides were sequentially washed in an ultrasonic bath using acetone, isopropanol, and methanol, followed by MilliQ™ water rinsing at each step, and then air-dried.
To prepare both probe-hybridized (FISH) and non-hybridized cells for SCRR, samples were transferred to cleaned metal slides using a modified filter-transfer-freeze (FTF) technique (Hewes and Holm-Hansen, 1983). Briefly, each membrane wedge was placed sample-side down on a small droplet of sterile, particle-free MilliQ™ water (2–5 μl depending on wedge size) and the slide was placed on an aluminum cooling (−80°C) block. The membrane was peeled from the steel surface immediately after freezing, leaving most cells frozen to the slide, which was then air-dried in the dark (Suter, 2017). Transfer efficiency of Synechococcus cells was determined microscopically on filter wedge replicates; one set analyzed prior to freeze transfer and the other afterwards.
Single-Cell Resonance Raman Microspectrometry
SCRR measurements were performed using a Renishaw® inVia™ confocal Raman microspectrometer configured with a modified upright Leica® DM2700™ fluorescence microscope, a computer-controlled motorized XYZ stage (0.1 μm step size), 514 nm Ar+ ion laser, and 1,040 × 256 CCD Peltier-cooled detector. After cells were manually targeted by mouse clicks on a Cy3-fluorescent or autofluorescent digital image, the automated stage centered each cell under the laser beam for Raman data acquisition. For each sample, 25–40 cells (0.5–1.8 μm equivalent spherical diameters) were individually interrogated at 10% laser power (92 ± 7 μW at sample) through a Leica® dry 100 × (NA = 0.90) objective lens which produced a spot diameter of 0.7 μm. Spectra were obtained using a 65 μm slit centered at 1,752 μm, a 1,800 line/mm diffraction grating, aligned to wavenumber region between ~400 and 2,000 cm−1 (1,350 cm−1 center) and acquisition of two 1 s CCD detector exposures.
Spectral Analysis
Spectra were processed using Renishaw's® Wire 4.1™ software by first subtracting baselines using the software's standard best fit polynomial algorithm, and its intensity normalization function to standardize all spectra to a maximum peak value of 1, because cell-to-cell Raman scattering intensities are variable. Effects of 13C enrichment on behavior of dominant resonance Raman (RR) peaks were evaluated by two methods; peak-picking and curve-fitting. For peak-picking, center positions and widths of dominant spectral peaks were simply tabulated by the software and recognition thresholds were adjusted manually when required.
For curve-fitting analyses, two of the dominant RR peaks, usually positioned at ~1,521 and 1,157 cm−1, were deconvolved using Wire 4.1's function with our own empirical scripts. Peak shape and position are controlled by relative contributions of each isotopologue bond (e.g., 12C12C, 12C13C, 13C13C) to total peak area (see SM 2). Center positions ( = wavenumber, cm−1) for pure 12C12C and 13C13C isotopologues were estimated from the regression intercept and slopes of calibration curves [e.g., ν (C = C) vs. fcell], respectively. Center positions for the intermediate isotopologue peaks were estimated as the midpoint between the end-members. After local baseline correction, contribution of each isotopologue to triplet peak area was determined by allowing peak positions to float ± 1 cm−1 and peak widths to float ± 10 cm−1 and by running a full Voigt fit routine (floating Lorentzian and Gaussian contributions to peak form) for 5,000 iterations or a <0.00001 tolerance (difference between reduced chi-square values of two successive iterations), whichever came first. The curve fit function continuously compared the sum of the isotopologues' areas (synthetic peak) to observed data and reported the reduced Chi square values (goodness of fit).
Determination of Cell Labeling and Single Cell Growth Rates
Since CO2 in the septum bottles is not allowed to exchange with the atmosphere, the isotopic signature of autotrophic cells (fcell) must predictably approach that of the media's DIC (fmedia, scaled for isotopic fractionation, α) with every cell division. Fractional labeling of populations was thus computed as follows.
To estimate α, an average δ13C value of −23%0 for marine plankton and a mean δ13C value of +1.5%0 for the ocean's mixed layer CT pool were selected from global summaries (Goericke and Fry, 1994; Hoefs, 2009). Cellular 13C fractionation, αcell−DIC, was calculated from the isotope ratios (R = 13C/12C) of phytoplankton and seawater DIC using Equation (1).
Values for fcell in specific samples were calculated via Equation (2), with uncertainties propagated from individual terms (see SM 3 and 4 for derivations of equations).
where fo = ancestral fractional isotopic signature of the media (0.011 13C) and n = number of generations completed in the presence of enriched DI13C, which was calculated by Equation (3) using the population's specific growth (μpop, day−1) measured by in vivo fluorescence.
where t = time elapsed (days) and g = generation time (days).
Single-cell growth (μsc) can be calculated independently of population growth data if the fcell of individual cells can be measured. SCRR enables such determinations if a spectral feature, such as mean peak wavenumber () for the ν(C = C) or ν(C-C) bonds in carotenoids varies predictably with fcell. This relationship can be utilized according to Equation (4).
After determining the values of b0 and b1 experimentally, the number of generations (n) completed after spiking samples with DI13C can be calculated from measurements of (Raman), fmedia, and fo with Equation (5). Once n is derived, g or μsc is calculated from Equation (3).
Statistics
Descriptive statistics, linear regressions, and analyses of variance (Kruskal-Wallis, Tukey, Dunn's and Holm-Sidak pair-wise comparison methods) were performed using SigmaPlot™ 13.0 software (Systat Software Inc.®). Graphics were produced by either Renishaw® Wire 4.1™ or SigmaPlot™ 13.0 software.
Results
SIP Experimental Design
For SIP experimental design, it was initially critical to establish whether DIC replacement or augmentation is preferable, to determine how much 13C-bicarbonate tracer is required, and then to accurately establish the value of fmedia. In principle, a known amount of the CT pool must be removed before replacing with sufficient 13C-bicarbonate to return media to the original CT pool size. Among published DIC replacement strategies, such as microwaving (Li et al., 2012), N2 purging, and pH manipulation, only pH manipulation adequately constrained the CT and fmedia terms (see SM 1).
DIC replacement may be suitable for experiments with cultivated populations in synthetic media, but is clearly inappropriate for experiments with natural field assemblages. DIC augmentation requires less manipulation and therefore potentially introduces fewer artifacts. More than doubling CT depressed the pH of filtered seawater (FSW) by only 0.23 units (Table S1). In this study, CT concentrations established gravimetrically from DIC additions closely agreed with those determined by flow injection analysis and by mass spectrometry, so the CT and fmedia terms were very well-constrained in experiments presented below (Table S2), which is absolutely essential for accurate growth calculations. Accordingly, experiments reported here used media augmented with the same CT but varying fmedia, and pH was titrated back to 8.0 prior to inoculation with 0.1N NaOH (SM1), unless otherwise noted.
SIP-Raman-FISH Spectra
While the identities of our cultures are known, phylogenetic identification of target cells by FISH enables application of SIP-SCRR to field samples. Cells hybridized against the Cy3-EUBMIX probe fluoresce brightly (Figure 1A) and can also be observed under bright-field illumination (Figure 1B). Cy3 fluorescence did not interfere with SCRR spectral acquisition when exciting within the carotenoid spectral absorption band (370–530 nm) at 514 nm (Figure 1C). Spectral responses to 13C enrichment of cellular biomass are evident in spectra i–v (Figure 1C). Spectrum i obtained in 2 s from a single cell grown in control media (fmedia = 0.011) was dominated by three major peaks attributed to carotenoids. The 1,521 cm−1 peak has previously been assigned to ν (C = C) in-phase stretching, the 1,156 cm−1 to ν (C-C) in-phase stretching, and 1,004 cm−1 to a combination of δ (C = CH3) methyl deformation and δ (C-H) out-of-plane bending modes in β-carotene (Marshall and Marshall, 2010). Evolution of red-shifted peaks is evident as cells are grown in 54% DI13C for 3, 6, 12, and 24 days (spectra ii–v). Thus, cells actively growing photoautotrophically in DI13C are easily recognized by red-shifted positions of any of these three SCRR peaks.
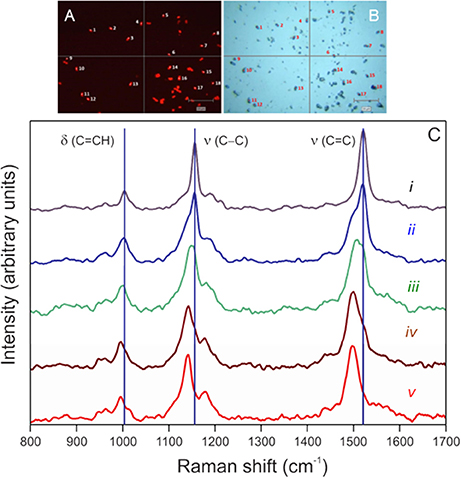
Figure 1. Examples of resonance Raman spectra obtained from EUBMIX-hybridized (Cy3) Synechococcus sp. (RS9916) cells (0.5–1.8 μm in diameter) pictured in fluorescence (Y3 ET, k—545 excitation/610 emission) (A) and bright-field (B) images. Cells manually targeted in the microscope field by the computer mouse are numbered, then automatically revisited under laser illumination for Raman interrogation. (C) Single-cell spectrum i was obtained from a culture grown on natural 13C abundances (fmedia = 0.011 DI13C). Single-cell spectra ii–v were obtained from a culture in f/2 media augmented with 2 mM bicarbonate yielding a final fractional 13C-content of 54% (0.54 fmedia) after 3 (ii), 6 (iii), 12 (iv), and 24 (v) days of incubation. Vertical lines denote major peak positions in the control culture. Spectra were baseline-corrected, intensities normalized from 0 to 1, and smoothed using standard Renishaw™ Wire 4.1® routines.
Quantitative Application of Single-Cell Resonance Raman Microspectrometry
To evaluate whether SCRR microspectrometry can accurately quantify fractional labeling of individual photoautotrophic cells (fcell), parallel time course incubations of Synechococcus sp. were conducted under varying fmedia. Populations maintained exponential growth for the first 18 days at a mean rate of μpop = 0.220 ± 0.002 day−1 (g = 3.20 ± 0.03 days) for all treatments as measured by in vivo fluorescence (Figure S1) and thus were unaffected by fmedia values between 0.011 and 0.54 (p > 0.98; Kruskal-Wallis one-way ANOVA). Thus, the range of fmedia used did not appear to introduce artifacts to the SIP-SCRR experiments and theory dictates that all populations would incorporate 13C into intracellular pools in proportion to their particular fmedia.
SCRR spectra were subjected to Renishaw's® Wire 4.1™ curve-fitting routine to illustrate how resonances from 12C12C, 12C13C, and 13C13C bonds (isotopologues) contribute to the total area, position, and shape of peaks as cells become 13C-enriched. As an example, cells grown in fmedia = 0.011 (Figure 2A) and 0.54 for 3–9 days illustrate the effects of 13C enrichment on the 1,521 cm−1 (ν (C = C)) peak (Figures 2B–D). During early stages of labeling (Figures 2B,C), the triplet peak widens with a distinct shoulder that disappears as 12C=13C replaces 12C=12C (Figure 2D). This transition causes red-shifting of the triplet peak's mean resonance () and eventually leads to bandwidth narrowing (Figures 1, 2D). Curve-fitting skill is illustrated by the coherence between fit curve solutions (gray lines; Figure 2) and observed data (green lines; Figure 3). The mean reduced Chi Square was 1.00 ± 0.25 (S.D.) for the entire 0.54 fmedia time course (N = 172 cells).
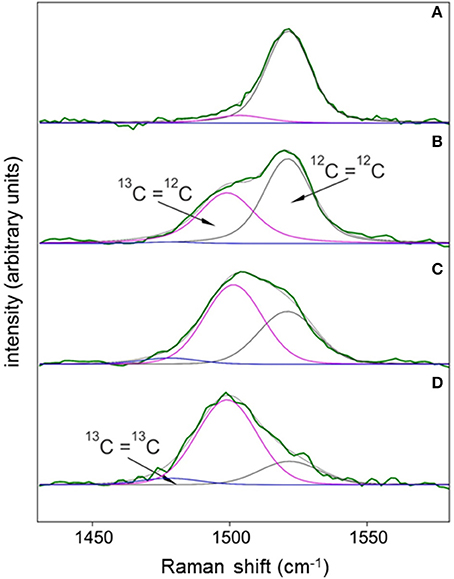
Figure 2. Examples of the varying contributions of 12C=12C, 12C=13C, and 13C=13C isotopologues to the shape, position, and areas of the ν (C = C) Raman spectral peak for carotenoids of cells assimilating varying amounts of DI13C. Each Raman spectrum was obtained from individual cells grown in either 0.011 fmedia (A) or 0.54 fmedia for 3 (B), 6.2 (C), or 9.2 (D) days. Spectra were subjected to local baseline subtraction (1,360–1,660 cm−1), intensity normalization (0–1), and a full Voigt curve-fitting routine (convolution of Lorentzian and Gaussian profiles) with 5,000 iterations or a 0.00001 tolerance using Renishaw™ Wire 4.1® software. Center positions for each of the three isotopologues were constrained within narrow consensus ranges (± 1 cm−1) determined from regression coefficients presented in Figure 5. Isotopologue peak widths and symmetries were allowed to float to optimize curve fits.
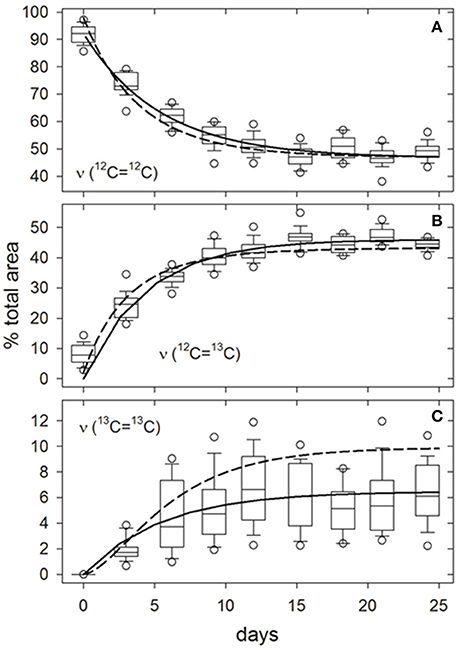
Figure 3. Example of growth-dependent variations in the relative proportions of ν (12C=12C) (A), ν (12C=13C) (B), and ν (13C=13C) (C) isotopologue bond peak areas to the total ν (C = C) Raman peak area at ~1,521 cm−1 for carotenoids in Synechococcus sp. (RS9916) cells grown in 0.32 fmedia. Boxes represent the interquartile range (25–75th percentiles) for peak areas in spectra from 25 ± 3 individual cells. Internal horizontal lines, whiskers, and circles are medians, 10 to 90th, and 5 to 95th percentiles for all observations, respectively. Solid curves are hyperbolic fits to all observations (N = 250 cells). Broken lines are responses predicted from arguments presented in SM 2 and SM 3, particularly Equations (S11, S20).
Curve-fitting analysis of spectra from the entire fmedia = 0.32 time course illustrate that the proportion of underlying peak areas attributed to 12C=12C bonds decreased asymptotically to ~50%, while those of 12C=13C and 13C=13C bonds increased asymptotically to ~44 and ~6%, respectively, as 13C was incorporated into cellular biomass (non-linear least-squares regression, solid lines, Figure 3). Observed changes are consistent with our model for 13C-incorporation at random positions in a representative carotenoid molecule (β-carotene) (dashed lines, Figure 3; see SM 2 and SM 3 for derivation). In the present example, fractionation would theoretically limit fcell to a maximum value of 0.31, at which the expected proportions of 12C=12C, 12C=13C, and 13C=13C bonds and their associated peak areas would approach 48, 43, and 10%, respectively (Equations S11, S20). However, unlike 12C=12C and 12C=13C bonds, the observed and predicted proportions of 13C=13C bonds were significantly different after 24 days (Figure 3C). We attribute this discrepancy to lower curve-fitting skill caused by the baseline correction method employed, which could undoubtedly be improved upon. The same time/growth-dependent trends in isotopologue contributions to the (ν (C = C)) peak area were observed at all levels of DI13C augmentation (not presented). Curve-fitting skills for the isotopologues contributing to the 1,156 cm−1 (ν (C-C)) and 1,004 cm−1 (δ (C = CH)) peak areas were less satisfactory due to baseline uncertainties and overlapping spectral features from other molecular bonds, particularly near 1,004 cm−1 (not presented).
As an alternative to curve-fitting peak areas as a function of time (e.g., Figure 3), we simply compared software-determined center positions () of major peaks in randomly selected cells (N = 25 cells sample−1) for all DI13C-augmented cultures to the control (0.011 fmedia). Figure 4 illustrates typical asymptotic responses of the three major peak wavenumbers as functions of growth in the fmedia = 0.32 treatment. Declines in peak wavenumber (red shifts) are steep over the first 2 generations, slowing as they approach an asymptote in about 5–7 generations. Clearly, growth-dependent changes in mean Raman peak wavenumbers () of the three carotenoid signature peaks observed in single-cells (boxes and whiskers) agree well with theoretical predictions (dashed lines) of red-shifting resonances for a population isotopically equilibrating with its media (see SM 2 for derivation of prediction).
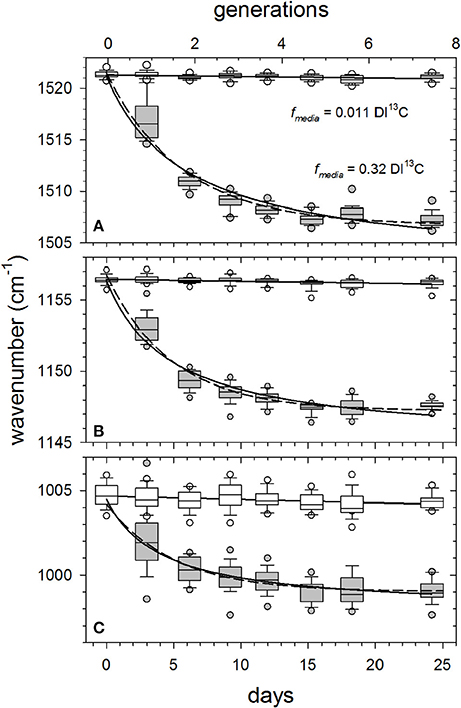
Figure 4. Examples of growth-dependent shifts in mean wavenumbers of the major carotenoid resonance Raman spectral peaks as Synechococcus sp. (RS9916) cells grown in 0.32 fmedia compared with 0.011 fmedia controls. Generations (n) were calculated from generation times (g) presented in Figure S1 and incubation times (n = t/g). Box and whisker plot details are as described in Figure 3. Solid curves are hyperbolic fits to all observations (N = 325 cells). Dashed lines are theoretical predictions for a population isotopically equilibrating with its media based on wavenumber response to fcell and generation time (see SM 2 and SM 3 for derivation). Solid horizontal lines are least square means of all observations in control samples. Peak assignments are (A) ν (C = C), (B) ν (C-C), and (C) δ (C = CH).
The most useful, generalized trend is obtained by constructing calibration curves directly comparing with fcell. Knowing fmedia and population growth (μpop or g) from independent chemical and fluorescence measurements (Figure S1) and assuming an isotopic fractionation factor (α) of 0.976 Equation (1), fcell can be calculated from Equation (2) and Equation (3). Mean SCRR wavenumbers () of the three major carotenoid peaks declined linearly across all values of fcell examined; from natural 13C abundances (fcell = 0.0107) to an fcell of ~0.53 (Figure 5). The regressions' coefficients of determination (r2 = 0.88–0.97), the slopes' standard errors (s.e. = 0.18–0.26) and 99% confidence intervals demonstrate well-constrained relationships between fcell and (). Collectively, the robust linear regressions and their agreement with theory suggest that fcell can be reliably approximated by simply measuring .
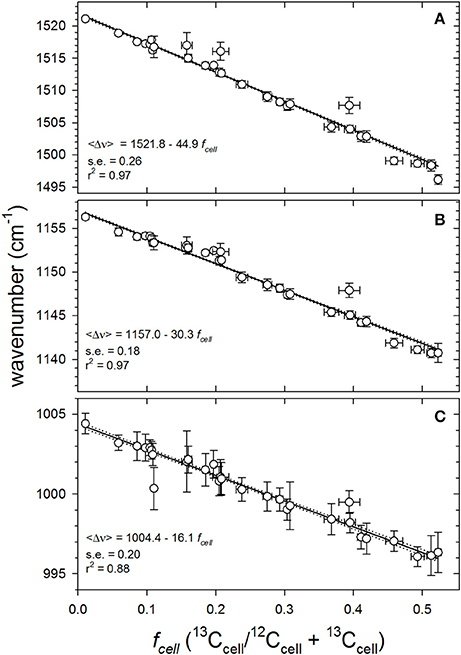
Figure 5. Quantitative responses of mean SCRR wavenumbers of the three dominant carotenoid peaks to varying cellular fractional labeling (fcell) for all fmedia (0.011–0.54) throughout exponential growth phase (0–18 days). Symbols and vertical error bars represent mean SCRR wavenumber observations ± 1 S.D., respectively. Horizontal error bars represent uncertainties propagated in calculating fcell (see SM 3). Solid lines are empirical least squares linear regressions through individual data points (N = 836 cells). Dotted lines define the 99% confidence intervals of each slope (b1); (A) ν (C = C), (B) ν (C-C), and (C) δ (C = CH).
Analogous examination of the curve-fitting approach across the entire fcell range yielded results consistent with peak position analysis, i.e., contributions of the individual isotopologues to triplet peak area varied predictably with cell 13C-content (not presented). However, scatter evident in isotopologue peak contributions, largely due to variable curve-fitting skill, renders isotopologue peak area analysis less suitable than the highly predictable relationship between and fcell for quantitative applications. Nevertheless, empirical curve-fitting results conform to theory and illustrate the mechanics behind red-shifting peak wavenumbers.
Variability and Sensitivity of SCRR
Scatter in SCRR microspectrometric data emanate from both natural cell-to-cell variability in 13C-content inherent to different growth phenotypes and from analytical uncertainty. Our sample size (25–40 cells) was adequate to distinguish between time points and treatments and to represent intra-population variability (e.g., Figures 3–5). If required, uncertainty could be reduced somewhat with larger sample sizes. Potential sources of analytical error in Raman microspectrometry include: improper spectrometer calibration, beam misalignment, varying laser intensity, poor beam focusing, variable target geometry, and contaminating materials associated with target cells. However, current instrumentation and best practices eliminate or minimize most of these issues. Concerns about small variations in focus and target geometry are irrelevant because they primarily affect emission intensity which is not critical to our analyses.
Synechococcus sp. cells perpetually grown on natural 13C/12C abundances serve as the best candidate for an authentic standard to assess analytical error. Table 1 summarizes spectral data obtained from all control cultures. Assuming 13C and 12C atoms are distributed at random positions in the carotenoid molecules, about 98% of all C = C bonds are predicted to be 12C=12C in populations grown in natural 13C abundances (see SM 2). In the dataset most amenable to curve-fitting [the ν (C = C) triplet], however, the 12C=12C isotopologue in all control cultures accounted for an average of 89 ± 9% of the ν (C = C) peak area with 12C=13C and 13C=13C isotopologues contributing the remaining 9 and 1%, respectively (Figure 2A, Table 1). Although within uncertainty of the predicted percentages, this large discrepancy likely results from our curve-fitting model's simplicity, uncertainties in absolute peak positions of the three isotopologues, baseline position, and peak broadening in condensed matter, all of which could contribute to curve-fitting inaccuracies.
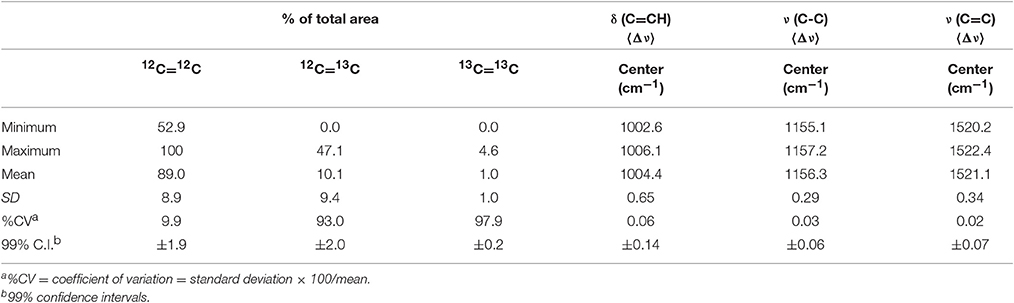
Table 1. Analytical precision of single-cell resonance Raman spectral features assessed from 150 Synechococcus sp. (RS9916) continuously cells grown at natural 13C abundances (fmedia = 0.011).
In contrast, the mean wavenumbers () of all three carotenoid signature peaks were practically invariant in natural 13C abundance control populations, and indicate the technique's analytical reproducibility (Table 1). Precision for peak position determinations was excellent; the 99% confidence intervals around the 1004.4, 1156.3, and 1521.1 cm−1 means were ±0.14, 0.06, and 0.07 cm−1, respectively for 150 Synechococcus cells. From these analyses, we conclude that is a far more precise indicator of fcell than isotopologue peak areas, and that the positions of the ν (C-C) and ν (C = C) peaks in control cultures are more reproducible than that of the δ (C = CH) peak.
Carotenoids in photoautotrophs have evolved a wide variety of chemical structures along diverging phylogenetic lines. Therefore, SCRR spectra from different species are likely to differ subtly. In the interest of developing a broadly applicable SCRR tool to ultimately determine growth rates in complex phytoplankton communities, available Raman spectral data for carotenoids were evaluated (Table 2). Among a variety of photoautotrophic microorganisms, the ν (C = C) and δ (C = CH) peak positions in cells growing at natural 13C abundances spanned 10.2 and 8.1 cm−1, respectively, while the ν (C-C) peak spanned just 2.4 cm−1 (Table 2). Furthermore, ν (C-C) peak wavenumbers observed in photoautotrophic protists were statistically indistinguishable from those of cyanobacteria (ANOVA p-value = 0.905), whereas the ν (C = C) and δ (C = CH) peak positions were more phylogenetically distinctive (Table 2). Therefore, even though the ν (C = C) peak had the broadest dynamic range and highest precision within our Synechococcus cultures, we chose the more phylogenetically conserved ν (C-C) peak for further quantitative analyses.
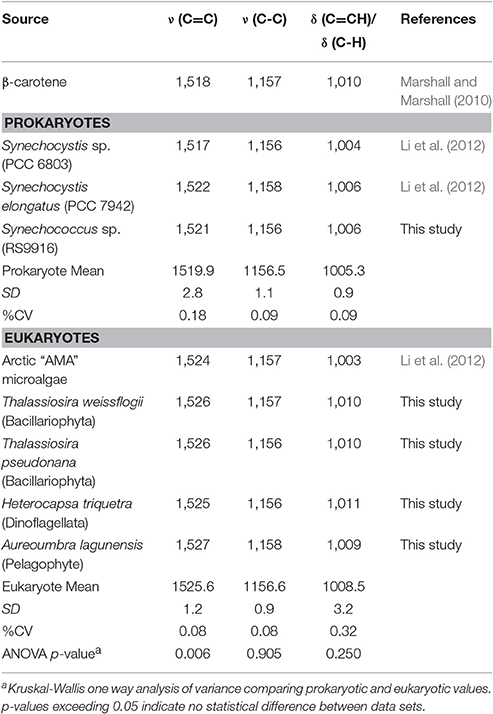
Table 2. Variability in major wavenumber positions (cm−1) for carotenoid peaks in photosynthetic microorganisms grown under natural stable isotope abundances.
Theoretical sensitivity or limit of detection (LOD) of the mean SCRR wavenumber approach was calculated using the regression statistics from Figure 5 and the formula, LOD = 3 SP/b1, where SP is the pooled standard deviations (±0.305 cm−1) of observed at each value of fcell and b1 = 30.3 cm−1/fcell (Winefordner and Long, 1983). This calculation yielded a LOD of 0.03 leading us to conclude that a Δ fcell of ~3% is detectable by our technique.
Single-Cell Growth Rates Determined by SCRR
Autotrophs will necessarily approach the isotopic signature of DI13C-augmented media (fmedia) as a function of time, growth rate, and isotopic fractionation [Equation (2) and Equation (3)]. Therefore, the empirical linear relationship between and fcell (Figure 5) can be used to estimate single-cell growth rates from time course (e.g., Figure 4) or brief end-point incubations. To illustrate, 25 single-cell growth rates (μsc) throughout the 0.32 and 0.43 fmedia incubations are compared to proximal daily population growth rates (μpop,inst) determined at tx−1, tx, and tx+1 (open boxes and whiskers Figures 6A,B). While mean μpop from 0 to 18 days was ~0.21 day−1 for both populations (broken horizontal lines), these relatively slow-growing photoautotrophs (g ≈ 3.3 days) exhibited considerable day-to-day oscillations in μpop,inst. (diamonds). We speculate that these oscillations result from intrinsic cell cycle periodicity and/or extrinsic variations in incubation conditions. Nonetheless, median growth rates computed over the entire exponential phase of fmedia 0.32 and 0.43 cultures were 0.22 ± 0.07 and 0.20 ± 0.07 day−1 for single cells (Raman-derived) and 0.22 ± 0.07 and 0.22 ± 0.07 day−1 for populations (fluorescence-derived), respectively (Figures 6A,B). In fact, μsc computed from SCRR measurements between 0 and 18 d for the 0.11, 0.32, 0.43, and 0.54 fmedia treatments were statistically indistinguishable from μpop,inst measured over the same period (p > 0.05; ANOVA). Inexplicably, μsc rates derived from the 0.22 fmedia treatment were lower than those from μpop,inst measurements in all but the 3 day sample (p < 0.05 ANOVA; not presented).
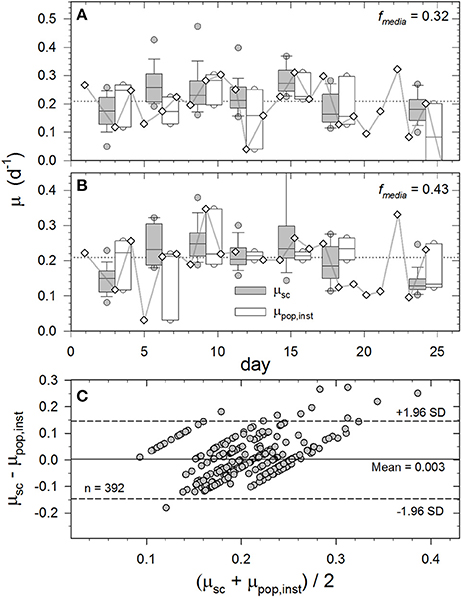
Figure 6. Temporal variations in single-cell growth rates (μsc) calculated from SCRR peak positions and daily population growth rates (μpop,inst–diamonds) based on in vivo fluorescence measurements (Figure S1) for cultures incubated in fmedia = 0.32 (A) and 0.43 (B), and Bland and Altman (1986) plot comparing results from both methods and treatments (C). See Materials and Methods for calculations. Box and whisker plot details are as described in Figure 3. Shaded boxes represent single-cell growth rates (μsc) and open boxes represent daily population growth rates (μpop,inst) at tx−1, tx, and tx+1. Horizontal broken line is mean μpop over entire exponential growth phase (0–18 days). (C) Differences between μsc and μpop,inst compared to their mean values to assess their agreement. Broken horizontal lines represent the 95% confidence intervals (±1.96 standard deviations).
Both in vivo fluorescence and SIP-SCRR based measurements of specific growth rate are subject to errors that may contribute differing amounts to the observed variability. For comparison, the mean %CV for values obtained by SCRR (± 0.05%; N = 861) within individual samples was two orders of magnitude smaller than that obtained by daily triplicate in vivo fluorescence measurements (± 3.7%; N = 144; S.E. = ± 0.23). The mean relative error for fcell was ±2.0% (S.E. ± 0.25), which is controlled by uncertainties in b0 and b1 in Figure 5 and measurements of fmedia. CVs for μsc tend to be higher at lower fmedia and shorter incubations times (see SM 4 for discussion of uncertainties). Of the observed variance for μsc through time ( = 29% ±2.4 S.E.) illustrated in Figure 6, more than 93% appears to be due to cell-to-cell heterogeneity in physiological state within these isogenic populations. Likewise, most variance observed in μpop,inst through time ( = 64%±24 S.E.) is likely due to actual variations in cell division, rather than analytical imprecision. We note that in vivo fluorescence measurements were made at approximately the same time every day (±1.5 h). Consequently, samples were undoubtedly withdrawn at different points within the 3.3 days cell cycle of these populations.
An approach routinely used in biomedical studies for evaluating agreement between two independent methods of measuring a single variable is to visualize the distributions of the differences between the two measurements plotted against their means (Bland and Altman, 1986). The Bland-Altman plot is more appropriate than regression analysis when those independent measurements have small dynamic ranges that are surpassed by the measurements' observed variability. Distributions of observed μsc—μpop,inst in the fmedia = 0.32 and 0.43 at each time point are compared to (μsc + μpop,inst)/2 in Figure 6C, where the μpop,inst term for each μsc was the mean determined at tx−1, tx, and tx+1. If the two measurement methods consistently produced identical results, all points would fall on the horizontal zero line. In the current case, the average difference is +0.003, meaning that on average the μsc method returns a 0.3% higher value than the μpop,inst method among all observations. The +1.96 and –1.96 boundaries (broken horizontal lines) represent the 95% confidence intervals, and 16 of the 17 outliers are positive, again illustrating that the μsc method tends to return slightly higher values than the μpop,inst method. Absolute accuracy of our μsc method cannot be determined from this analysis largely due to cell-to-cell variability and uncertainties over which of the daily μpop,inst measurements are most representative of a particular μsc time point. Nonetheless, the data distribution in Figure 6C illustrates that the vast majority of SIP-SCRR-derived growth rates are within the 95% confidence intervals of independently-measured population growth rates. Furthermore, the preceding error analysis suggests that most observed variability is attributable to real differences in growth activity and not to analytical error.
SIP-SCRR-Derived Growth Rates in Mixed Assemblages
Our final objective was to demonstrate that SIP-SCRR can measure growth rates of individual cells in a mixed photoautotrophic assemblage whose members are assimilating 13C-bicarbonate at contrasting rates. In the absence of an independent method to measure single-cell growth in natural communities, we constructed an artificial assemblage by dispensing equal volumes of Synechococcus cell suspensions from the six fmedia treatments (Figure 5) at a single time point. Figure 7A presents the SCRR spectra obtained from 13 individual cells in the mixed assemblage (Figure 7B). After interrogating multiple fields, the statistical distribution of Synechococcus sp. cells with six distinctive 13C signatures added to the mixture were indistinguishable (ANOVA; p = 1.00) from those recognized by SIP-SCRR (Figure 7C). Therefore, morphologically identical cells with distinctive 13C signatures can be recognized and reliably quantified within an isotopically mixed assemblage by this method.
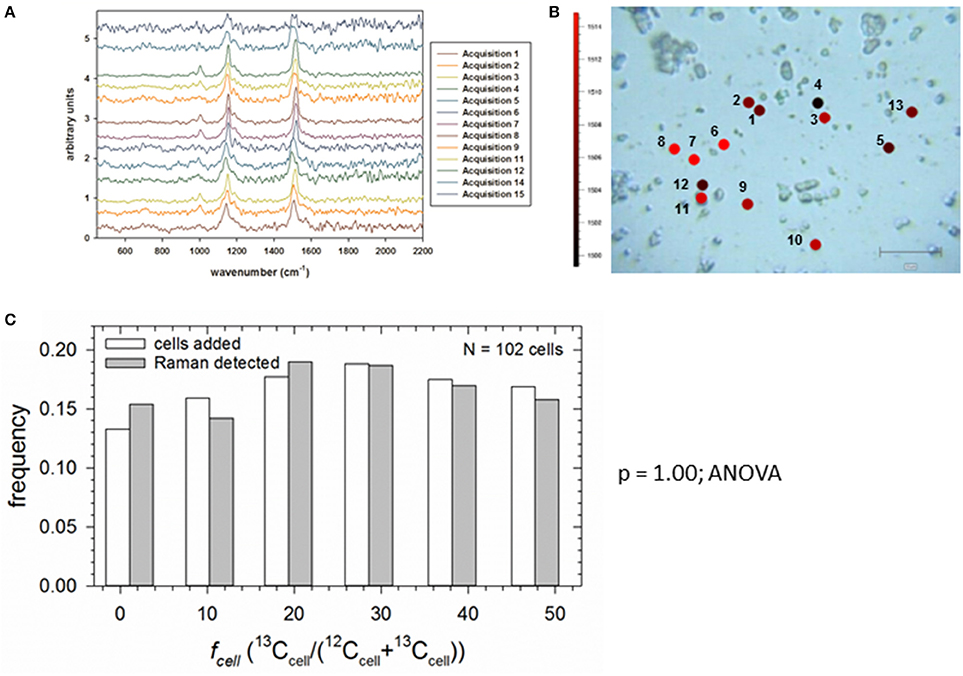
Figure 7. SCRR of an artificial assemblage constructed of known concentrations of Synechococcus sp. populations with distinct fcell labeling. (A) Stacked SCRR spectra from cells 1–13. (B) Bright field image of cells 1–13 targeted for Raman interrogation in a single field superimposed with wavenumber color codes. (C) Comparison of frequency of occurrence of cells added from each fcell population (open bars) and those detected by SCRR (shaded bars).
To further evaluate application of this technique to phylogenetically diverse field assemblages, subsamples of parallel cultures of relatively slow-growing cyanobacteria and fast-growing diatoms were mixed at several time points. Grown in identical media (fmedia = 0.011 and 0.48), the diatom, T. pseudonana, and cyanobacterium, Synechococcus sp., maintained exponential growth for 6 days, attaining population growth rates of 0.483 and 0.161 day−1, respectively. In Figure 8, the distribution of fcell values computed by plugging SCRR observations of into Equation (4) are compared to fcell values predicted from α, fmedia, population growth measured by in vivo fluorescence of the cultures and Equation (2). The trend line computed from all cells (N = 253) spanning fcell values of 0.0107 to 0.449 is not significantly different from the 1:1 line. These results demonstrate that within experimental error and intra-population variability, fractional 13C-labeling of single diatom and cyanobacterial cells computed from SIP-SCRR measurements closely agrees with fractional labeling of entire populations grown at natural and enhanced 13C-DIC abundances. Results presented in Figures 7, 8 support the proposition that single-cell growth rates within mixed natural photoautotrophic assemblages can be computed from SIP-SCRR measurements.
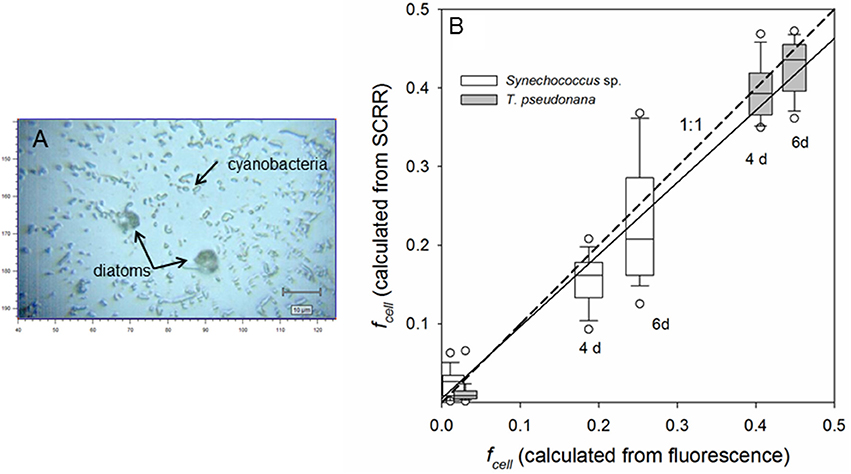
Figure 8. Bright-field image (A) and measurement of fractional labeling (B) of single cells in artificial assemblages through time. Parallel cultures of a fast-growing diatom, Thalassiosira pseudonana (μpop = 0.483 day−1) and a slow-growing cyanobacterium, Synechococcus sp. (μpop = 0.161 day−1) in labeled (fmedia = 0.48) and unlabeled (fmedia = 0.011) were subsampled through exponential growth phase, mixed, and prepared for SCRR interrogation. Values of fcell computed from SCRR peak positions and Equation (4) in individual cells are compared with fcell computed from α, fmedia, population growth measured by in vivo fluorescence, and Equation (2) (B). Solid line represents linear regression of all observations (N = 253 cells) including natural 13C abundance controls (fcell ≈ 0.0107); fcell(SCRR) = 0.005 + 0.92±0.02 fcell (fluorescence), r2 = 0.92.
Discussion
Single-Cell Productivity Techniques
Individual or agent-based ecological models suggest that intra-population variability in genetics, cell line history and microspatial geochemical heterogeneity can influence population responses to environmental forcing along multiple pathways and lead to divergent outcomes (e.g., Hellweger and Kianirad, 2007; Bolnick et al., 2011; Bucci et al., 2012; Fredrick et al., 2013). Empirical testing of such models is challenging because the requisite single-cell productivity measurements have been limited historically to a few laboratory techniques with cultures. For example, division of individual cells encapsulated in mineral oil has been followed through time microscopically (Dewan et al., 2012; Damodaran et al., 2015) and increasing mass of individual cells has been measured through time in serial microfluidic mass sensor arrays (Cermak et al., 2016). MAR-FISH provides single-cell activity measurements, but does not yield growth rates per se. Recent evidence suggests that two complementary techniques, SIP-nano-SIMS-FISH and SIP-Raman-FISH, hold the most promise for providing single-cell growth rates in both the lab and field experiments.
SIP-nano-SIMS-FISH has been used to estimate growth of anaerobic phototrophic bacteria as well as for cells in syntrophic and symbiotic partnerships (Musat et al., 2008; Orphan et al., 2009; Foster et al., 2011). However, the growth computations in these studies depended upon several variables with unspecified uncertainties, such as substrate pools' isotopic composition estimates, assumed assimilative/dissimilative relationships, and microscopic biovolume measurements used to derive elemental content based on allometry. Recognizing this limitation, Kopf et al. (2015) recently demonstrated that accurate single-cell growth rates could be derived by applying appropriate mathematical models to data obtained from bacterial chemostat cultures labeled with 2H2O under well-constrained conditions and analyzed by SIP-nano-SIMS.
Previous studies applying SIP-Raman to aquatic microbiology measured cell activity levels by altered Raman spectral features and then cataloged them either morphometrically or by combining with FISH (e.g., Huang et al., 2007b; Li et al., 2012; Berry et al., 2014). Huang et al. (2007b) were the first to demonstrate that red shift ratios in single-cell Raman spectra of cultivated bacteria varied predictably with 13C-content of the media. Li et al. (2012) recently demonstrated that SIP-SCRR red shifts in the three major carotenoid peaks () vary quantitatively with fcell of Synechocystis sp. and Synechococcus elongatus, grown in 13C-bicarbonate enriched media. In fact, when their data from these two cyanobacteria are combined, we obtain functional responses that closely agree with those presented in Figure 5; e.g., = 1156.5–31.0±1.4 fcell; r2 = 0.99 (computed from Figure 3 in Li et al., 2012). The fcell values derived from mass spectrometric analysis of extracted cellular protein (Li et al., 2012) yielded essentially the same functional responses as carotenoid . This is consistent with the postulates that turnover of major intracellular molecular pools are tightly coupled under optimal culture conditions and that the isotopic signatures are equivalent, i.e., αprotein ≈ αcarotenoids, which supports the validity of our approach. Furthermore, it corroborates the proposition that as long as α and μpop are known and fmedia is well-constrained, mean fcell of an autotrophic culture can be reliably computed and precludes the need for mass spectrometry. To our knowledge, the present study is the first to extend SIP-SCRR data interpretation beyond fractional labeling and relative activity determinations to quantify absolute single-cell growth rates from photoautotrophic populations.
Single-Cell Growth Rates by SIP-SCRR-FISH
Our approach is well-suited to examine cell to cell heterogeneity in photoautotrophic growth in both cultures and field samples. Almost all carbon assimilated by aquatic photoautotrophs is drawn from the CT pool. Therefore, dissolved 13C-bicarbonate, which equilibrates with CT species, is an unsurpassed tracer of autotrophic production. Surface ocean values of CT only vary between ~1.95 and 2.25 mM C globally (Key et al., 2004), and can be empirically measured in samples by several methods (e.g., Hall and Aller, 1992; Key et al., 2004; Kaltin et al., 2005). Therefore, the experimentalist can add precisely measured masses of H13 to samples and accurately calculate fmedia, which is ultimately needed to derive μsc. In contrast, DIC replacement manipulations lead to uncertainties in CT and calculation of fmedia (Table S1), necessarily alter water chemistry, and are impractical for field experiments. Therefore, we conclude that spiking unaltered samples with a sterile H13 concentrate to achieve the desired fmedia is preferable to any DIC replacement protocol (e.g., Li et al., 2012). In principle, our experiments demonstrated that H13 amendments as small as 10% are adequate to exceed our LOD (3% Δfcell) within 0.5 generations (Figure 5) and enable recognition of active cells. However, if accurate and precise determination of μsc is the objective, then H13 amendments yielding 0.3–0.5 fmedia and incubation durations of one generation are recommended to constrain the optimal propagated relative uncertainties (± σμ/μ) to between 6.6 and 11.0% (see Figures S2–S4). These amendments do not appear to significantly alter photoautotrophic growth in seawater (Figure S1).
Sample processing requirements for SCRR or SCRR-FISH are relatively simple. Samples can be captured on membranes and frozen or preserved with formaldehyde or paraformaldehyde, but not glutaraldehyde (due to fluorescence interference). If FISH is required, samples are processed by standard membrane-based protocols (e.g., Pernthaler et al., 2001; Stoecker et al., 2010). In contrast, previous SIP-Raman-FISH studies required performing hybridizations on cell suspensions (liquid-FISH) concentrated by centrifugation or resuspension from a membrane, then spotting suspensions onto quartz or Al-coated glass slides, followed by drying, rinsing and DAPI counter-staining (Huang et al., 2007b; Berry et al., 2014). Membrane-based approaches are advantageous because cell recovery exceeds that obtained by centrifugation or by resuspension from membranes. Furthermore, the risk of cell loss from the microscope slide during rinsing or counter-staining in the liquid-FISH technique is eliminated.
Hybridization of fluorophore-labeled oligonucleotide FISH probes into cells may introduce two challenges to Raman interrogation; unwanted fluorescence and isotope dilution. Persistent fluorescence from a sample illuminated by a laser within its electronic transition band can prevent acquisition of Raman spectra altogether. As demonstrated by Huang et al. (2007b), bacterial cells hybridized with FISH probes labeled with Cy3, Cy5, or Fluorescein (Fluos) were all amenable to single-cell Raman microspectroscopy using a 532 nm laser, but cells labeled with Cy3 required brief photobleaching prior to acquisition of spectra. We only tested a Cy3-labeled probe using our 514 nm laser and could obtain high quality SCRR spectra of carotenoids without significant fluorescent interference. Nonetheless, Cy5, Fluos and perhaps other yet-to-be tested fluorophores are probably preferable to Cy3 for most applications, but practitioners should test fluorophores with desired laser line.
Isotope dilution created by incorporation of a FISH probe is a concern with SIP-nano-SIMS because the instrument is measuring secondary ions generated from individual atoms ablated from a specimen, irrespective of source molecules. Thus, ionized carbon from isotopically-enriched biomass can be diluted with ionized light carbon from a FISH probe. In the SIP-Raman-FISH approach, however, isotopic content determinations arise from wavenumber shifts in signature molecular bond vibrations, in the present case from ν(C-C) in carotenoids. Therefore, aliasing fcell determinations from diagnostic SCRR peaks by isotopically-light FISH probes is improbable in the present study and can be avoided in other Raman assays. For example, Huang et al. (2007b) determined 13C-content in FISH-hybridized cells from red shift ratios in diagnostic peaks emanating from the essential amino acid, phenylalanine, were indistinguishable from unhybridized cells. Cells hybridized by CARD-FISH (catalyzed reporter deposition) may not be amenable to Raman interrogation because required reagents may be Raman-active and contaminate the spectra, but this requires future evaluation.
While membrane-based cell collection, hybridization, and staining techniques present significant advantages for working with microbes in natural waters, all tested membranes and filters are Raman-contaminating and consequently can't be used directly in the instrument. Therefore, we were motivated to develop a rapid, simple method to efficiently transfer concentrated and stained cells from low sorption membranes (polycarbonate) to a Raman-neutral substrate for interrogation. With minimal optimization efforts, the filter-transfer-freeze (FTF) technique met those goals and achieved transfer efficiencies of 51–77% for Synechococcus to mirror-finished stainless steel slides. For most anticipated applications, complete cell transfer is not required to adequately subsample populations captured on membranes. However, evaluation of other membrane materials may be warranted to maximize transfer efficiencies and minimize selective retention on membranes. The steel slides have several advantages. Firstly, they are completely reusable after solvent cleaning. Secondly, they cost 1–3% that of the quartz and Al-coated slides used in previous Raman studies (e.g., Huang et al., 2007b; Li et al., 2012). The third advantage is that potentially higher quantum efficiencies improve the method's sensitivity. This is explained as follows: Raman-shifted photons tend to scatter more or less in a 360° sphere (isotropic), depending on sample morphology, opacity, volume, and substrata properties. However, reflective opaque metal slides or Al-coated glass substrata limit scattering geometry to 180°, reflecting photons upward and thus potentially doubling photon capture efficiency compared to transparent substrata. Lastly, the highly reflective surface enables recognition of cells as small as bacteria under bright-field illumination without using any staining or FISH procedures.
Intra-Population Growth Rate Heterogeneity
In this study, computed growth rates within a given isogenic Synechococcus sp. population varied from cell to cell by ~27% (CV) around the mean at any particular time point after removal of the ~2% propagated analytical error. Similar intra-population variations have been observed in isogenic populations of photoautotrophic protists. For example, microscopic cell count measurements of μsc for Chlorella vulgaris varied between 0.55 and 1.52 day−1 ( = 1.16 ± 0.37 SD) among mineral oil-encapsulated droplets of media within a microfluidic device, yielding a CV of 32%, while μpop in bulk media was 1.12 day−1 (Dewan et al., 2012). Similarly, subpopulations in a synchronized isogenic Chlamydomonas reinhardtii culture grew at significantly different rates among oil-encapsulated droplets within a millifluidic sampler (Damodaran et al., 2015). Using SIP-nano-SIMS, Kopf et al. (2015) reported CVs of 19–51% for μsc of chemostat cultures of the bacterium, Staphylococcus aureus. Interestingly, the heterogeneity in single cell growth rate (CV) varied inversely with chemostat dilution rate, i.e., behavior of individual cells in slow growing S. aureus populations was less uniform than that of fast growers. We observed a similar trend with fast-growing T. pseudonana (CV = 8–9%) and slower-growing Synechococcus sp. (CV = 23–34%) (Figure 8).
We are unaware of any comparable measurements of μsc in cyanobacteria. However, significant variations in elemental stoichiometry within Synechococcus field populations have been observed using synchrotron X-ray fluorescence microscopy. For example, an average CV of 120% in Si/P ratios was apparent among cells within discrete tropical and subtropical water samples (Baines et al., 2012). Similarly, quotas for P and Fe varied by 68 and 97% CV, respectively, among individual Synechococcus cells in the Sargasso Sea (Twining et al., 2010). Even individual Synechococcus, Prochlorococcus, and Thalassiosira cultures exhibit significant intra-population variability in intracellular P content (CV = 17–86%), which can affect the collective population growth rate (Fredrick et al., 2013). Thus, considerable cell-to-cell variation in elemental composition, activity, and growth of photoautotrophic populations can be expected whether they are isogenic and exposed to ostensibly homogenous conditions or are anisogenic and living in dynamic heterogeneous environments. Such findings and agent-based ecological models underscore the need for reliable single-cell measurements to better understand processes driving plankton population dynamics as well as biological cycling of key elements (Bolnick et al., 2011; Bucci et al., 2012; Fredrick et al., 2013).
Conclusions
We conclude that, compared to other technologies, our approach to single-cell growth measurement has some clear advantages. SCRR has minimal sample preparation requirements, provides relatively high sample throughput, and at low cost per analysis (excluding capital expenses). Specimens can be interrogated in vivo, in vitro, frozen, preserved, or dried, and don't require special analytical conditions, such as electrical conductivity, embedding, or high vacuum (as in nano-SIMS). Organisms can be recognized by bright-field, autofluorescence, fluorescent stains, or FISH illumination. All targeted cells in a field can then be immediately analyzed by Raman microspectrometry by altering the optical path with a few computer keystrokes and allowing the automated stage to center each target under the laser spot. Raman microspectrometry offers a unique and powerful set of capabilities to chemically interrogate individual cells and investigate biogeochemical processes at spatial scales relevant to microorganisms. Combining SIP with FISH and Raman microspectrometry allows identification of key players in cycling of a particular element or compound and thereby enables linking function with phylogeny. Furthermore, rates of material cycling can be determined from features within single-cell Raman spectra. If the stable isotope traces the sole source of that element into cells and fmedia of that element can be measured, then single-cell growth rates can be determined.
As demonstrated in this study, a 13C-bicarbonate tracer and SCRR of carotenoids appear to be particularly well-suited to investigate intra- and inter-population variability in growth of cultured photoautotrophs. As documented by Goericke and Welschmeyer (1993), carotenoid labeling rates closely match population growth rates during balanced growth which occurs during exponential phase in cultures. However, they also observed that nutrient and light stresses may alter this relationship, conditions which may be encountered in field samples. We recommend conducting SIP experiments over an entire diel cycle (24 h) to account for variability in light field responses and intrinsic biosynthetic periodicities and to produce sufficient signal. Resolution of the impact of light and nutrient limitation on broad application of the SIP-SCRR approach to examining intra- and inter-population growth variability in the field requires further systematic evaluation under a range of conditions.
Author Contributions
All authors listed have made a substantial, direct and intellectual contribution to the work, and approved it for publication.
Conflict of Interest Statement
The authors declare that the research was conducted in the absence of any commercial or financial relationships that could be construed as a potential conflict of interest.
Acknowledgments
Authors are grateful to J. Collier for Synechococcus cultures, S. Zegers for T. pseudonana cultures, C. Heilbrun for DIC analyses and M. Pachiadaki for insightful comments on an earlier draft. IRMS analyses of DI13C were conducted by the UC Davis Stable Isotope Facility. Raman data were acquired in SoMAS' NAno-Raman Molecular Imaging Laboratory (NARMIL), a community resource dedicated to environmental science applications and founded with NSF-MRI grant OCE-1336724. This research was also partially supported by NSF grants OCE-1335436 and OCE-1259110 and Gordon and Betty Moore Foundation Grant #5064. School of Marine and Atmospheric Sciences contribution number 1436.
Supplementary Material
The Supplementary Material for this article can be found online at: http://journal.frontiersin.org/article/10.3389/fmicb.2017.01449/full#supplementary-material
References
Amann, R. I., Krumholz, L., and Stahl, D. A. (1990). Fluorescent oligonucleotide probing of whole cells for determinative, phylogenetic, and environmental studies in microbiology. J. Bacteriol. 172, 762–770. doi: 10.1128/jb.172.2.762-770.1990
Azam, F. (1998). Microbial control of oceanic organic carbon flux: the plot thickens. Science 280, 694–696. doi: 10.1126/science.280.5364.694
Baines, S. B., Twining, B. S., Brzezinski, M. A., Krause, J. W., Vogt, S., Assael, D., et al. (2012). Significant silicon accumulation by marine picocyanobacteria. Nat. Geosci. 5, 886–891. doi: 10.1038/ngeo1641
Berry, D., Madera, E., Lee, T. K., Woebken, D., Wang, Y., Zhu, D., et al. (2014). Tracking heavy water (D2O) incorporation for identifying and sorting active microbial cells. Proc. Natl. Acad. Sci. U.S.A. 112, E194–E203. doi: 10.1073/pnas.1420406112
Bland, J. M., and Altman, D. G. (1986) Statistical methods for assessing agreement between two methods of clinical measurement. Lancet 327 307–310. doi: 10.1016/S0140-6736(86)90837-8
Bolnick, D. I., Amarasekare, P., Araújo, M. S., Bürger, R., Levine, J. M., Novak, M., et al. (2011). Why intraspecific trait variation matters in community ecology. Trends Ecol. Evol. 26, 183–192. doi: 10.1016/j.tree.2011.01.009
Brehm-Stecher, B. F., and Johnson, E. A. (2004). Single-cell microbiology: tools, technologies, and applications. Microbiol. Mol. Biol. Rev. 68, 538–559. doi: 10.1128/MMBR.68.3.538-559.2004
Bucci, V., Nunez-Milland, D., Twining, B. S., and Hellweger, F. L. (2012). Microscale patchiness leads to large and important intraspecific internal nutrient heterogeneity in phytoplankton. Aquat. Ecol. 46, 101–118. doi: 10.1007/s10452-011-9384-6
Canfield, D. E., Stewart, F. J., Thamdrup, B., De Brabandere, L., Dalsgaard, T., Delong, E. F., et al. (2010). A cryptic sulfur cycle in oxygen-minimum zone waters off the Chilean coast. Science 330, 1375–1378. doi: 10.1126/science.1196889
Cermak, N., Olcum, S., Delgado, F. F., Wasserman, S. C., Payer, K. R., Murakami, M. A., et al. (2016). High-throughput measurement of single-cell growth rates using serial microfluidic mass sensor arrays. Nat. Biotechnol. 34, 1052–1059. doi: 10.1038/nbt.3666
Daims, H., Bruhl, A., Amann, R., Schleifer, K.-H., and Wagner, M. (1999). The domain-specific probe EUB338 is insufficient for the detection of all bacteria: development and evaluation of a more comprehensive probe set. Syst. Appl. Microbiol. 22, 434–444. doi: 10.1016/S0723-2020(99)80053-8
Damodaran, S. P., Eberhard, S., Boitard, L., Rodriguez, J. G., Wang, Y., Bremond, N., et al. (2015). A millifluidic study of cell-to-cell heterogeneity in growth-rate and cell-division capability in populations of isogenic cells of Chlamydomonas reinhardtii. PLoS ONE 10:e0118987. doi: 10.1371/journal.pone.0118987
Dewan, A., Kim, J., McLean, R. H., Vanapalli, S. A., and Karim, M. N. (2012). Growth kinetics of microalgae in microfluidic static droplet arrays. Biotechnol. Bioeng. 109, 2987–2996. doi: 10.1002/bit.24568
Foster, R. A., Kuypers, M. M. M., Vagner, T., Paerl, R. W., Musat, N., and Zehr, J. P. (2011). Nitrogen fixation and transfer in open ocean diatom–cyanobacterial symbioses. ISME J. 5, 1484–1493. doi: 10.1038/ismej.2011.26
Fredrick, N. D., Berges, J. A., Twining, B. S., Nuñez-Milland, D., and Hellweger, F. L. (2013). Use of agent-based modeling to explore the mechanisms of intracellular phosphorus heterogeneity in cultured phytoplankton. Appl. Environ. Microbiol. 79, 4359–4368. doi: 10.1128/AEM.00487-13
Garcia-Asua, G., Lang, H. P., Cogdell, R. J., and Hunter, C. N. (1998). Carotenoid diversity: a modular role for the phytoene desaturase step. Trends Plant Sci. 3, 445–449. doi: 10.1016/S1360-1385(98)01329-6
Gemmell, B. J., Oh, G., Buskey, E. J., and Villareal, T. A. (2016). Dynamic sinking behaviour in marine phytoplankton: rapid changes in buoyancy may aid in nutrient uptake. Proc. R. Soc. B 283:20161126. doi: 10.1098/rspb.2016.1126
Goericke, R., and Fry, B. (1994). Variations of marine plankton δ13C with latitude, temperature, and dissolved CO2 in the world ocean. Glob. Biogeochem. Cycles 8, 85–90. doi: 10.1029/93GB03272
Goericke, R., and Welschmeyer, N. A. (1993). The carotenoid-labeling method - measuring specific rates of carotenoid synthesis in natural phytoplankton communities. Mar. Ecol. Prog. Ser. 98, 157–171. doi: 10.3354/meps098157
Guillard, R. R. L., and Ryther, J. H. (1962). Studies of marine planktonic diatoms: I. Cyclotella nana Hustedt, and Detonula confervacea (Cleve) Gran. Can. J. Microbiol. 8, 229–239. doi: 10.1139/m62-029
Hall, E. K., Singer, G. A., Pölzl, M., Hämmerle, I., Schwarz, C., Daims, H., et al. (2011). Looking inside the box: using Raman microspectroscopy to deconstruct microbial biomass stoichiometry one cell at a time. ISME J. 5, 196–208. doi: 10.1038/ismej.2010.115
Hall, P. O. J., and Aller, R. C. (1992). Rapid, small-volume, flow injection analysis for ∑CO2, and in marine and freshwaters. Limnol. Oceanogr. 37, 1113–1119. doi: 10.4319/lo.1992.37.5.1113
Hellweger, F. L., and Kianirad, E. (2007). Accounting for intra-population variability in biogeochemical models using agentbased methods. Environ. Sci. Technol. 41, 2855–2860. doi: 10.1021/es062046j
Hermelink, A., Brauer, A., Lasch, P., and Naumann, D. (2009). Phenotypic heterogeneity within microbial populations at the single-cell level investigated by confocal Raman microspectroscopy. Analyst 134, 1149–1153. doi: 10.1039/b822574e
Hewes, C. D., and Holm-Hansen, O. (1983). A method for recovering nanoplankton from filters for identification with the microscope. The filter-transfer-freeze (FTF) technique. Limnol. Oceanogr. 28, 389–394. doi: 10.4319/lo.1983.28.2.0389
Huang, W. E., Bailey, M. J., Thompson, I. P., Whiteley, A. S., and Spiers, A. J. (2007a). Single-cell Raman spectral profiles of Pseudomonas fluorescens SBW25 reflects in vitro and in planta metabolic history. Microb. Ecol. 53, 414–425. doi: 10.1007/s00248-006-9138-5
Huang, W. E., Griffiths, R. I. A., Thompson, I. P., Bailey, M. J., and Whiteley, A. S. (2004). Raman microscopic analysis of single microbial cells. Anal. Chem. 76, 4452–4458. doi: 10.1021/ac049753k
Huang, W. E., Li, M., Jarvis, R. M., Goodacre, R., and Banwart, S. A. (2010). Shining light on the microbial world: The application of Raman microspectroscopy. Adv. Applied Microbiol. 70, 153–186. doi: 10.1016/S0065-2164(10)70005-8
Huang, W. E., Stoecker, K., Griffiths, R., Newbold, L., Daims, H., Whiteley, A. S., et al. (2007b). Raman-FISH: combining stable-isotope Raman spectroscopy and fluorescence in situ hybridization for the single cell analysis of identity and function. Environ. Microbiol. 9, 1878–1889. doi: 10.1111/j.1462-2920.2007.01352.x
Kaltin, S., Haraldsson, C., and Anderson, L. G. (2005). A rapid method for determination of total dissolved inorganic carbon in seawater with high accuracy and precision. Mar. Chem. 96, 53–60. doi: 10.1016/j.marchem.2004.10.005
Key, R. M., Kozyr, A., Sabine, C. L., Lee, K., Wanninkhof, R., Bullister, J. L., et al. (2004). A global ocean carbon climatology: results from Global Data Analysis Project (GLODAP). Glob. Biogeochem. Cycles 18:GB4031. doi: 10.1029/2004GB002247
Kopf, S. H., McGlynn, S. E., Green-Saxena, A., Guan, Y., Dianne, K., Newman, D. K., et al. (2015). Heavy water and 15N labelling with NanoSIMS analysis reveals growth rate-dependent metabolic heterogeneity in chemostats. Environ. Microbiol. 17, 2542–2556. doi: 10.1111/1462-2920.12752
Lee, N., Nielsen, P. H., Andreasen, K. H., Juretschko, S., Nielsen, J. L., Schleifer, K. H., et al. (1999). Combination of fluorescent in situ hybridization and microautoradiography – a new tool for structure–function analyses in microbial ecology. Appl. Environ. Microbiol. 65, 1289–1297.
Li, M., Canniffe, D. P., Jackson, P. J., Davison, P. A., FitzGerald, S., Dickman, M. J., et al. (2012). Rapid resonance Raman microspectroscopy to probe carbon dioxide fixation by single cells in microbial communities. ISME J. 6, 875–885. doi: 10.1038/ismej.2011.150
Lidstrom, M. E., and Konopka, M. C. (2010). The role of physiological heterogeneity in microbial population behavior. Nat. Chem. Biol. 6, 705–712. doi: 10.1038/nchembio.436
Marshall, C. P., and Marshall, A. O. (2010). The potential of Raman spectroscopy for the analysis of diagenetically transformed carotenoids. Philos. Trans. R Soc. A 368, 3137–3144. doi: 10.1098/rsta.2010.0016
Musat, N., Halm, H., Winterholler, B., Hoppe, P., Peduzzi, S., Hillion, F., et al. (2008). A single-cell view on the ecophysiology of anaerobic phototrophic bacteria. Proc. Natl. Acad. Sci. U.S.A. 105, 7861–17866. doi: 10.1073/pnas.0809329105
Orphan, V. J., House, C. H., Hinrichs, K. U., McKeegan, K. D., and DeLong, E. F. (2002). Direct phylogenetic and isotopic evidence for multiple groups of Archaea involved in the anaerobic oxidation of methane. Geochim. Cosmochim. Acta 66:A571. doi: 10.1016/S0016-7037(02)01016-5
Orphan, V. J., Turk, K. A., Green, A. M., and House, C. H. (2009). Patterns of 15N assimilation and growth of methanotrophic ANME-2 archaea and sulfate-reducing bacteria within structured syntrophic consortia revealed by FISH-SIMS. Environ. Microbiol. 11, 1777–1791. doi: 10.1111/j.1462-2920.2009.01903.x
Pernthaler, J., Glockner, F. O., Schonhuber, W., and Amann, R. (2001). Fluorescence in situ hybridization with rRNA-targeted oligonucleotide probes. Methods Microbiol. 30, 207–210. doi: 10.1016/S0580-9517(01)30046-6
Robert, B. (2009). Resonance Raman spectroscopy. Photosyn. Res. 101, 147–155. doi: 10.1007/s11120-009-9440-4
Simon, M., Grossart, H.-P., Schweitzer, B., and Ploug, H. (2002). Microbial ecology of organic aggregates in aquatic ecosystems. Aquat. Microbiol. Ecol. 28, 175–211. doi: 10.3354/ame028175
Stepanauskas, R. (2012). Single cell genomics: an individual look at microbes. Curr. Opin. Microbiol. 15, 613–620. doi: 10.1016/j.mib.2012.09.001
Stocker, R. (2012). Marine microbes see a sea of gradients. Science 338, 628–633. doi: 10.1126/science.1208929
Stoecker, K., Dorninger, C., Daims, H., and Wagner, M. (2010). Double labeling of oligonucleotide probes for fluorescence in situ hybridization (DOPE-FISH) improves signal intensity and increases rRNA accessibility. Appl. Environ. Microbiol. 76, 922–926. doi: 10.1128/AEM.02456-09
Suter, L. (2017). Modified Filter-Transfer-Freeze (“FTF”) Technique for Raman Microspectroscopic Analysis of Single Cells. Version 2. Open Access Repository of Science Methods.
Taylor, G. T., Sharma, S. K., and Mohanan, K. (1990). Optimization of a flow-through sampling system for quantitative analysis of dilute aqueous solutions using combined resonance and surface-enhanced Raman spectroscopy (SERRS). Appl. Spectrosc. 44, 635–640. doi: 10.1366/0003702904087217
Twining, B. S., Baines, S. B., Vogt, S., and de Jonge, M. D. (2008). Exploring ocean biogeochemistry by single-cell microprobe analysis of protist elemental composition. J. Eukaryot. Microbiol. 55, 151–162. doi: 10.1111/j.1550-7408.2008.00320.x
Twining, B. S., Nuñez-Milland, D., Vogt, S., Johnson, R. S., and Sedwick, P. N. (2010). Variations in Synechococcus cell quotas of phosphorus, sulfur, manganese, iron, nickel, and zinc within mesoscale eddies in the Sargasso Sea. Limnol. Oceanogr. 55, 492–506. doi: 10.4319/lo.2010.55.2.0492
Wagner, M. (2009). Single-cell ecophysiology of microbes as revealed by Raman microspectroscopy or secondary ion mass spectrometry imaging. Annu. Rev. Microbiol. 63, 411–429. doi: 10.1146/annurev.micro.091208.073233
Wagner, M., Nielsen, P. H., Loy, A., Nielsen, J. L., and Daims, H. (2006). Linking microbial community structure with function: fluorescence in situ hybridization microautoradiography and isotope arrays. Curr. Opin. Biotechnol. 17, 83–91. doi: 10.1016/j.copbio.2005.12.006
Wang, Y., Huang, W. E., Cui, L., and Wagner (2016). Single cell stable isotope probing in microbiology using Raman microspectroscopy. Curr. Opin. Biotechnol. 41, 34–42. doi: 10.1016/j.copbio.2016.04.018
Winefordner, J. D., and Long, G. L. (1983). Limit of detection: a closer look at IUPAC definition. Anal. Chem. 55, 712A–724A.
Keywords: single-cell analysis, carbon fixation, photosynthesis, productivity, intraspecific trait variability, Raman microspectrometry, carotenoids, stable isotope probing
Citation: Taylor GT, Suter EA, Li ZQ, Chow S, Stinton D, Zaliznyak T and Beaupré SR (2017) Single-Cell Growth Rates in Photoautotrophic Populations Measured by Stable Isotope Probing and Resonance Raman Microspectrometry. Front. Microbiol. 8:1449. doi: 10.3389/fmicb.2017.01449
Received: 17 January 2017; Accepted: 17 July 2017;
Published: 03 August 2017.
Edited by:
Chuanlun Zhang, Southern University of Science and Technology, ChinaReviewed by:
Douglas Andrew Campbell, Mount Allison University, CanadaMa Bo, Qingdao Institute of Bioenergy and Bioprocess Technology (CAS), China
Copyright © 2017 Taylor, Suter, Li, Chow, Stinton, Zaliznyak and Beaupré. This is an open-access article distributed under the terms of the Creative Commons Attribution License (CC BY). The use, distribution or reproduction in other forums is permitted, provided the original author(s) or licensor are credited and that the original publication in this journal is cited, in accordance with accepted academic practice. No use, distribution or reproduction is permitted which does not comply with these terms.
*Correspondence: Gordon T. Taylor, gordon.taylor@stonybrook.edu