 Yantao Liang
 Yongyu Zhang
 Nannan Wang
 Tingwei Luo
 Yao Zhang
 Richard B. Rivkin
- 1Research Center for Marine Biology and Carbon Sequestration, Shandong Provincial Key Laboratory of Energy Genetics, Qingdao Institute of Bioenergy and Bioprocess Technology, Chinese Academy of Sciences, Qingdao, China
- 2Institute of Marine Microbes and Ecospheres, State Key Laboratory of Marine Environmental Science, Xiamen University, Xiamen, China
- 3Department of Ocean Sciences, Memorial University of Newfoundland, St. John’s, NL, Canada
Picophytoplankton are acknowledged to contribute significantly to primary production (PP) in the ocean while now the method to measure PP of picophytoplankton (PPPico) at large scales is not yet well established. Although the traditional 14C method and new technologies based on the use of stable isotopes (e.g., 13C) can be employed to accurately measure in situ PPPico, the time-consuming and labor-intensive shortage of these methods constrain their application in a survey on large spatiotemporal scales. To overcome this shortage, a modified carbon-based ocean productivity model (CbPM) is proposed for estimating the PPPico whose principle is based on the group-specific abundance, cellular carbon conversion factor (CCF), and temperature-derived growth rate of picophytoplankton. Comparative analysis showed that the estimated PPPico using CbPM method is significantly and positively related (r2 = 0.53, P < 0.001, n = 171) to the measured 14C uptake. This significant relationship suggests that CbPM has the potential to estimate the PPPico over large spatial and temporal scales. Currently this model application may be limited by the use of invariant cellular CCF and the relatively small data sets to validate the model which may introduce some uncertainties and biases. Model performance will be improved by the use of variable conversion factors and the larger data sets representing diverse growth conditions. Finally, we apply the CbPM-based model on the collected data during four cruises in the Bohai Sea in 2005. Model-estimated PPPico ranged from 0.1 to 11.9, 29.9 to 432.8, 5.5 to 214.9, and 2.4 to 65.8 mg C m-2 d-1 during March, June, September, and December, respectively. This study shed light on the estimation of global PPPico using carbon-based production model.
Introduction
Marine picophytoplankton, which mainly include the autotrophic Prochlorococcus, Synechococcus, and picoeukaryotes, are autotrophic prokaryotes and eukaryotes with an equivalent spherical diameter of less than 2–3 μm. Their abundance and distributions in the ocean have been well-studied during the past two decades. Now it is well known that picophytoplankton are ubiquitous and abundant (i.e., 102 to 106 cells mL-1) in the photic zone and contribute significantly to autotrophic carbon biomass and primary production (PP) (Worden et al., 2004, 2015; Jardillier et al., 2010; Buitenhuis et al., 2012). In some oligotrophic regions, this diverse group can contribute up to 80% of the fixed carbon in the ocean (Campbell et al., 1994; Partensky and Garczarek, 2010). Among picophytoplankton, Prochlorococcus is abundant (up to 106 cells mL-1) in the ocean at a wide latitudinal range, i.e., 45°N to 40°S (Scanlan et al., 2009), and are particular abundant in oligotrophic areas (Partensky and Garczarek, 2010). In comparison with Prochlorococcus, abundances of Synechococcus are generally one to two orders of magnitude lower, they are more widely distributed in the ocean and usually most abundant in mesotrophic seawaters (Partensky et al., 1999; Zhang et al., 2008; Cottrell and Kirchman, 2009). Picoeukaryotes are much less abundant than Prochlorococcus and Synechococcus in the ocean, while they are as important in terms of biomass and PP as picocyanobacteria (Worden et al., 2004, 2015; Jardillier et al., 2010; Buitenhuis et al., 2012).
Although picophytoplankton are acknowledged to contribute very importantly to oceanic PP, whereas so far the accurate estimation of the PP of picophytoplankton (PPPico) in a wide survey on large spatiotemporal scales is still challenging. This is due to the traditional 14C method to measure in situ PPPico is much time-consuming and labor-intensive, which constrains its actual application in global surveys. In addition to the traditional 14C method, the new technologies (e.g., NanoSIMS) based on the uptake of natural abundances of the stable isotopes (e.g., 13C) have open new perspectives in the measurement of the in situ phytoplanktonic CO2 fixation (Popa et al., 2007; Ploug et al., 2010; Klawonn et al., 2016). The in situ measurement of PPPico using the new technologies could enhance our understanding and provide new data about PPPico. So far, our understanding of picophytoplankton PPPico is much more limited than their global distributions and diversity. This paucity of data also limits our in-depth understanding about their contributions to ocean carbon cycles (Jiao et al., 2010). To reduce the gaps in knowledge about the PPPico at large spatial and temporal scale, the development of accurate prediction model is considered as a promising approach to evaluate the PPPico. The PP of total phytoplankton in the global ocean had been well studied by using model predictions (Behrenfeld and Falkowski, 1997; Field et al., 1998; Tilstone et al., 2015), whereas the relative contribution of picophytoplankton among the total phytoplankton to the oceanic PP is not well understood. Recently, a pigment-based modeling of PP was applied to estimate the size-dependent PP using the remotely sensed chlorophyll (Chl) concentration (Uitz et al., 2008, 2010, 2012; Kheireddine et al., 2017). However, the relationship between Chl and carbon biomass (C) of phytoplankton in response to the variability of light, nutrient stress, taxonomy, and other environmental stressors is extremely plastic (Geider, 1987; Falkowski and La Roche, 1991), also the PP refers to the rate of carbon turnover, but not Chl, therefore carbon biomass rather than Chl is more appropriate to describe the standing stocks of picophytoplankton, and is more suitable to estimate the PP (Westberry et al., 2008). Moreover, the carbon biomass of picophytoplankton appears to be well related with their abundance (Buitenhuis et al., 2012), whereas the relationship between PP and abundance of picophytoplankton has not yet been well established.
In this study, an adaptation of the carbon-based production model (CbPM) of Behrenfeld et al. (2005) was proposed to estimate the PP of specific groups of picophytoplankton, e.g., Prochlorococcus, Synechococcus, and picoeukaryotes. The rates of carbon production of the three abundant and important marine autotrophic picoplankton can be estimated from the following parameters, literature-reported carbon conversion factors (CCF), temperature dependent growth rates, in situ cell abundances of picophytoplankton and remotely determined environmental variables. Defining the relationship between PP and picophytoplankton abundance will contribute to the development of a modeling method for estimating the PPPico. Future application of the CbPM for large-scale investigation of the PPPico will contribute to a deeper understanding of the important contributions of picophytoplankton to the marine carbon cycle in the global oceans.
Materials and Methods
Modeling Primary Production of Picophytoplankton
PP of Prochlorococcus, Synechococcus, and picoeukaryotes was estimated from a modification of the carbon-based PP model of Behrenfeld et al. (2005).
where PP is the depth integrated primary production (mg C m-2 d-1), C is the carbon biomass of picophytoplankton in the surface layer (mg C m-3), μ is the growth rate (d-1), Zeu is the depth of euphotic zone (m), and h(I0) describes how changes in surface irradiance influence the depth-dependent profile of carbon fixation.
The C of picophytoplankton was computed as the product of cell abundance and cellular carbon content using published CCF. The minimum, maximum, and average values of CCF of unialgal cultures for Prochlorococcus, Synechococcus, and picoeukaryotes were compiled by Buitenhuis et al. (2012) and shown in Table 1. In this study, the average CCF of 36, 255, and 2590 fg C cell-1 for Prochlorococcus, Synechococcus, and picoeukaryotes, respectively, were used to calculate the group-specific picophytoplankton biomass.
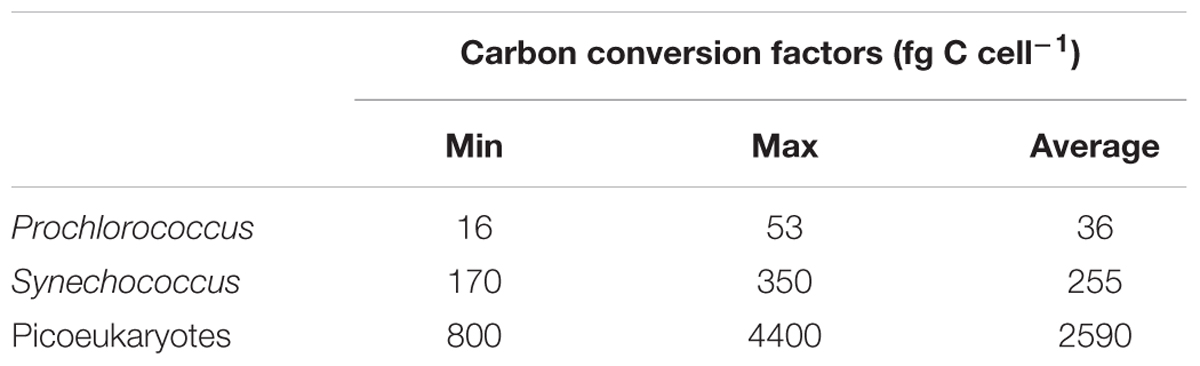
TABLE 1. Carbon conversion factors as reported by Buitenhuis et al. (2012). Here, we used the average value.
The temperature-dependent growth rates of Prochlorococcus, Synechococcus, and picoeukaryotes were estimated from published growth–temperature relationships (Johnson et al., 2006; Chen et al., 2014; Pittera et al., 2014). Binominal equation was used to describe the temperature dependence of growth rate of Prochlorococcus, as their relationships were not linear and not suitable for the application of Arrhenius equation. An Arrhenius equation was used to describe the temperature dependence of growth rate of Synechococcus and picoeukaryotes, μ = μce-E/kT, in which μ is the growth rate varying with temperature, μc is a normalization constant, E is the activation energy (eV, 1 eV = 96.49 kJ mol-1), k is the Boltzmann constant (8.62 × 10⁻⁵ eV K-1), and T is absolute temperature (K) (Brown et al., 2004).
According to the original model (Behrenfeld et al., 2005), Zeu was calculated as:
The h(I0) is computed as:
As Zeu in the original model was developed for oligotrophic and upwelling waters and may overestimate the Zeu in the turbid coastal waters (Shang et al., 2011; Tripathy et al., 2012), the MODIS/Aqua Zeu products based on inherent optical properties (IOP-approach) (Lee et al., 2005, 2007; Shang et al., 2011) was used in the Bohai Sea1.
The PPs of Prochlorococcus, Synechococcus, and picoeukaryotes were calculated according to the Eqs 1–3. The PPPico is the sum of PPs of Prochlorococcus, Synechococcus, and picoeukaryotes.
Data on Primary Production and Abundance of Picophytoplankton
To test the reliability and validity of the modified CbPM method, we compared the estimated PPPico by CbPM with the actually measured PPPico data using the radiolabeled carbon uptake method (i.e., 14C method). Firstly, for this purpose, a field dataset of PP and abundance of picophytoplankton (Figure 1 and Supplementary Data Sheet 1) was compiled from Atlantic Meridional Transect (Marañón et al., 2003), Southern Ocean (Smetacek et al., 1997), Atlantic Ocean (Li, 1994; Jardillier et al., 2010; Hartmann et al., 2014), South China Sea (Chen et al., 2014; Xie and Huang, unpublished data), and French Polynesian atoll lagoons (Charpy and Blanchot, 1998). In this field datasets, the PPPico was measured using the 14C uptake method, and the abundance of picophytoplankton were measured using flow cytometry.
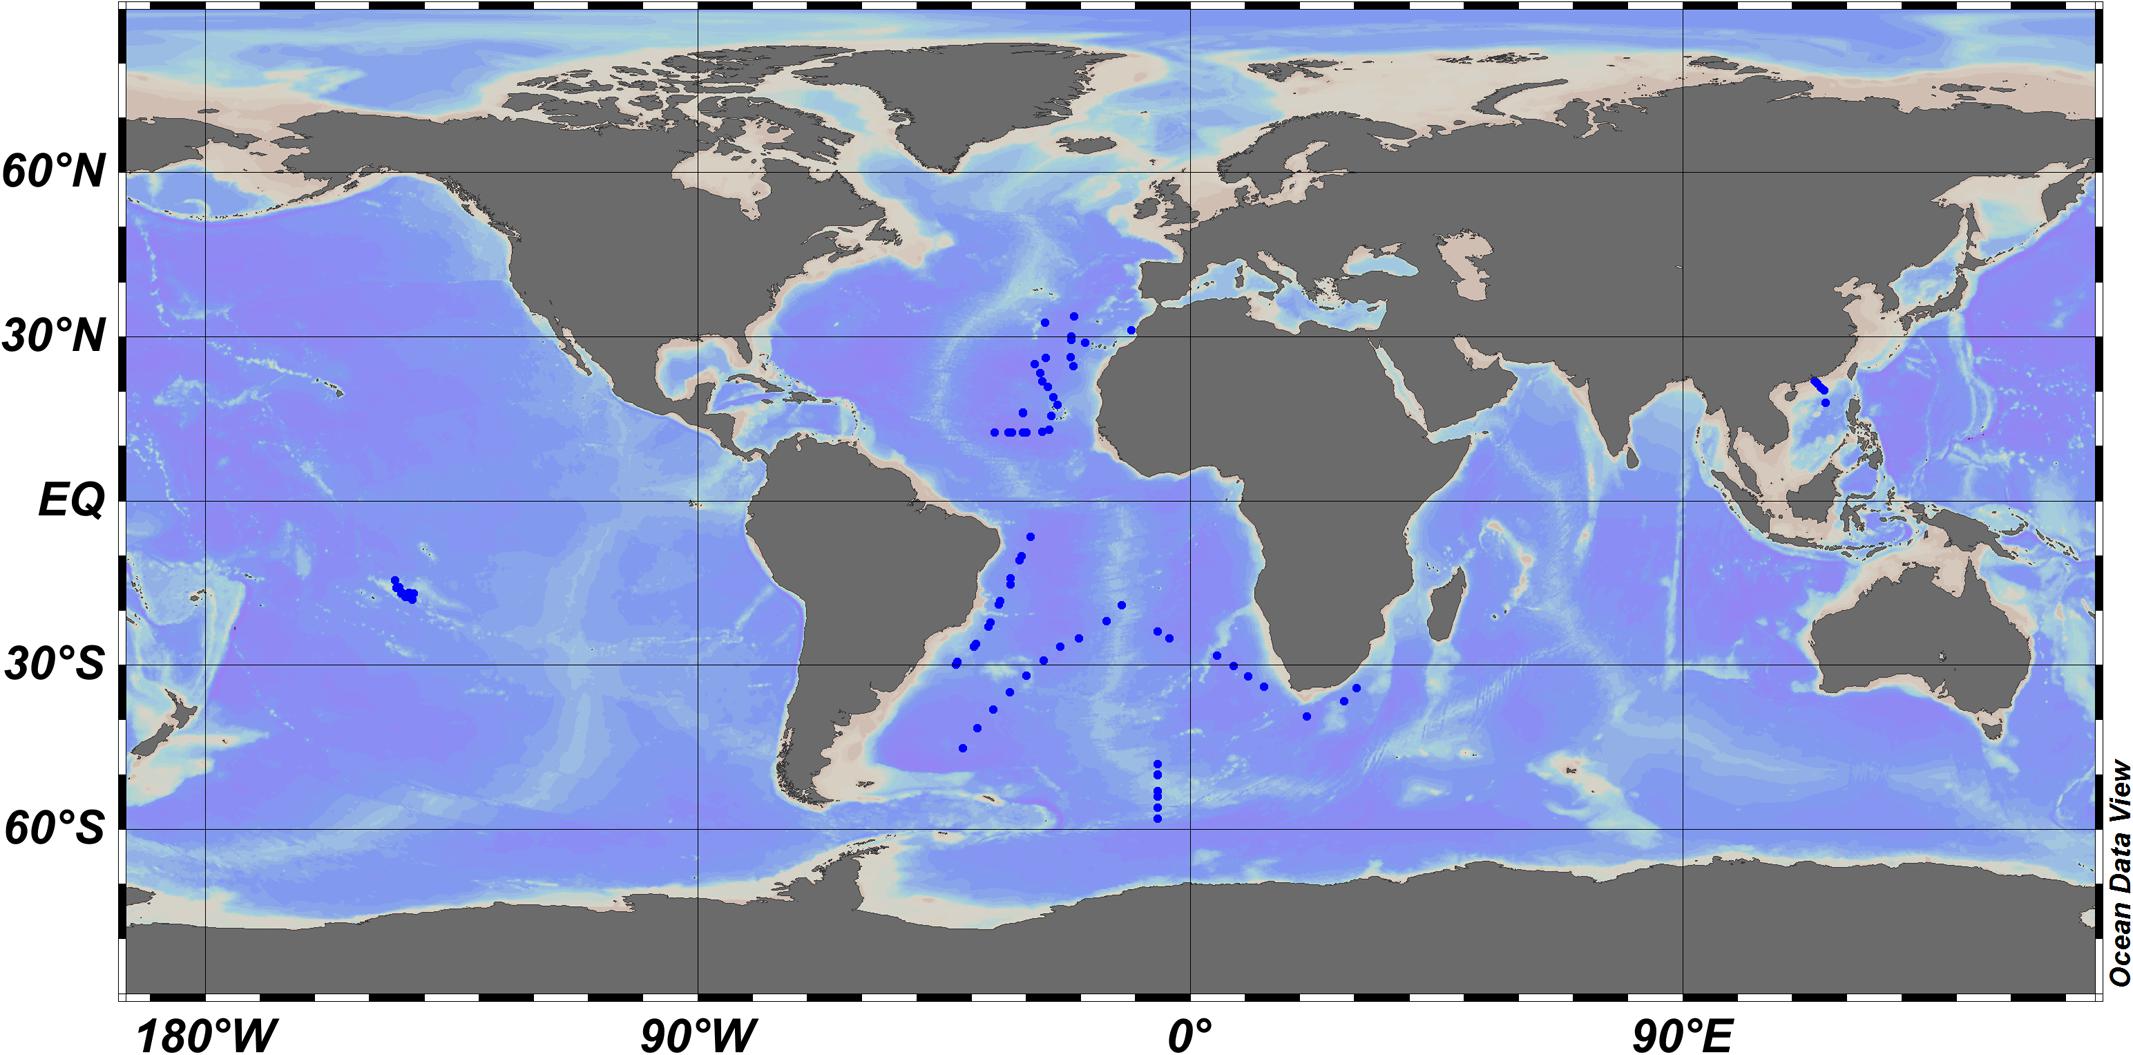
FIGURE 1. Location of the stations where the abundance and 14C-based primary production of picophytoplankton were measured.
Picophytoplankton Abundance and Environmental Variables in the Bohai Sea, China
A case study and test of concept of the modified CbPM was conducted in the Bohai Sea, China to estimate the PPPico. The Bohai Sea is a large semi-enclosed shallow sea basin in the western Pacific Ocean (117° 30′–121°E, 37–41°N), with an average depth of 18.7 m (Zhang et al., 2004). It includes three coastal bays (Liaodong, Bohai, and Laizhou Bays) and central Bohai Sea. Summers are wet and warm. Winters are cold and dry, with strong northerly monsoons blowing from late November to March. Spring and autumn are transitional seasons between summer and winter (Tang, 2003). The Bohai Sea in general has been extensively studied since the late 1950s (Zhang et al., 2004). Although the distributions of phytoplankton, Chl a, PP, and nutrients are well defined (Sun et al., 2002; Wei et al., 2004; Zhang et al., 2004), little is known about the PPPico in the Bohai Sea.
Four field expeditions were conducted during 2005 (March 26 to April 12, June 10 to July 11, September 9–24, and November 30 to December 8) in the Bohai Sea. During December, samples were collected only from the surface layer of the western areas. During the other sampling periods, when the water depth was less than 10 m, samples were collected only from the surface layer; when the water depth was between 10 and 20 m, samples were collected from the surface, 5 and 10 m layers; and when the water depth was deeper than 20 m, water samples were collected from the surface, 10 and 20 m layers using 10-L Niskin bottles.
Triplicate 2 mL water samples were collected from Niskin bottles mounted on a Rosette sampling assembly and were fixed on-board to a final concentration of 1% glutaraldehyde. After 15–20 min of fixation in dark at room temperature, samples were immersed in liquid nitrogen for 10 min and then stored in -80°C until further analysis. Picophytoplankton were analyzed on an Epics Altra II flow cytometer (Beckman Coulter, United States) with a 306C–5 argon laser (Coherent, United States) according to Jiao et al. (2002).
Environmental variables of Bohai Sea required for estimating PPPico were compiled from the monthly average Level-3 4-km MODIS/Aqua data. These include sea surface temperature (°C), the depth of euphotic zone (Zeu; m), diffuse attention coefficients at 490 nm (k490: m-1), surface Chl (mg m-3), and surface photosynthesis active radiation (I0; moles photons m-2 h-1) for the corresponding sampling stations from March to December 2005. Data were downloaded from the NASA Ocean Color website (see text footnote 1). The temperature profile data of Bohai Sea was extracted from the World Ocean Atlas 2013 (Ocean Data View website2) and the resolution was 0.25° × 0.25° grids.
Statistical and Sensitivity Analysis
Analysis of variance (ANOVA) was used to assess differences in picophytoplankton abundances at different depth during each expedition (SPSS 18) and Model 2 regression (Reduced Major Axis) was used to assess the relationships between selected parameters (Ricker, 1973; Blackburn and Gaston, 1998).
Results and Discussion
Estimation of the Growth Rates of Picophytoplankton
The group-specific growth rates of the picophytoplankton community were significantly related to temperature (Figure 2). For Prochlorococcus, the laboratory-determined growth rate of the two most abundant Prochlorococcus ecotypes (eMIT9312 and eMED4) in tropical and temperate waters were compiled from Johnson et al. (2006) and Biller et al. (2015). Temperature was a statistically significant predictor of growth rates for both Prochlorococcus eMIT9312 and eMED4 (r2 = 0.78, P < 0.001 and 0.60, P < 0.01, respectively. Figures 2A,B). As the two high light-adapted Prochlorococcus ecotypes are abundant in tropical and temperate waters, the relationships between growth rate and temperature were used to estimate the growth of Prochlorococcus in the CbPM.
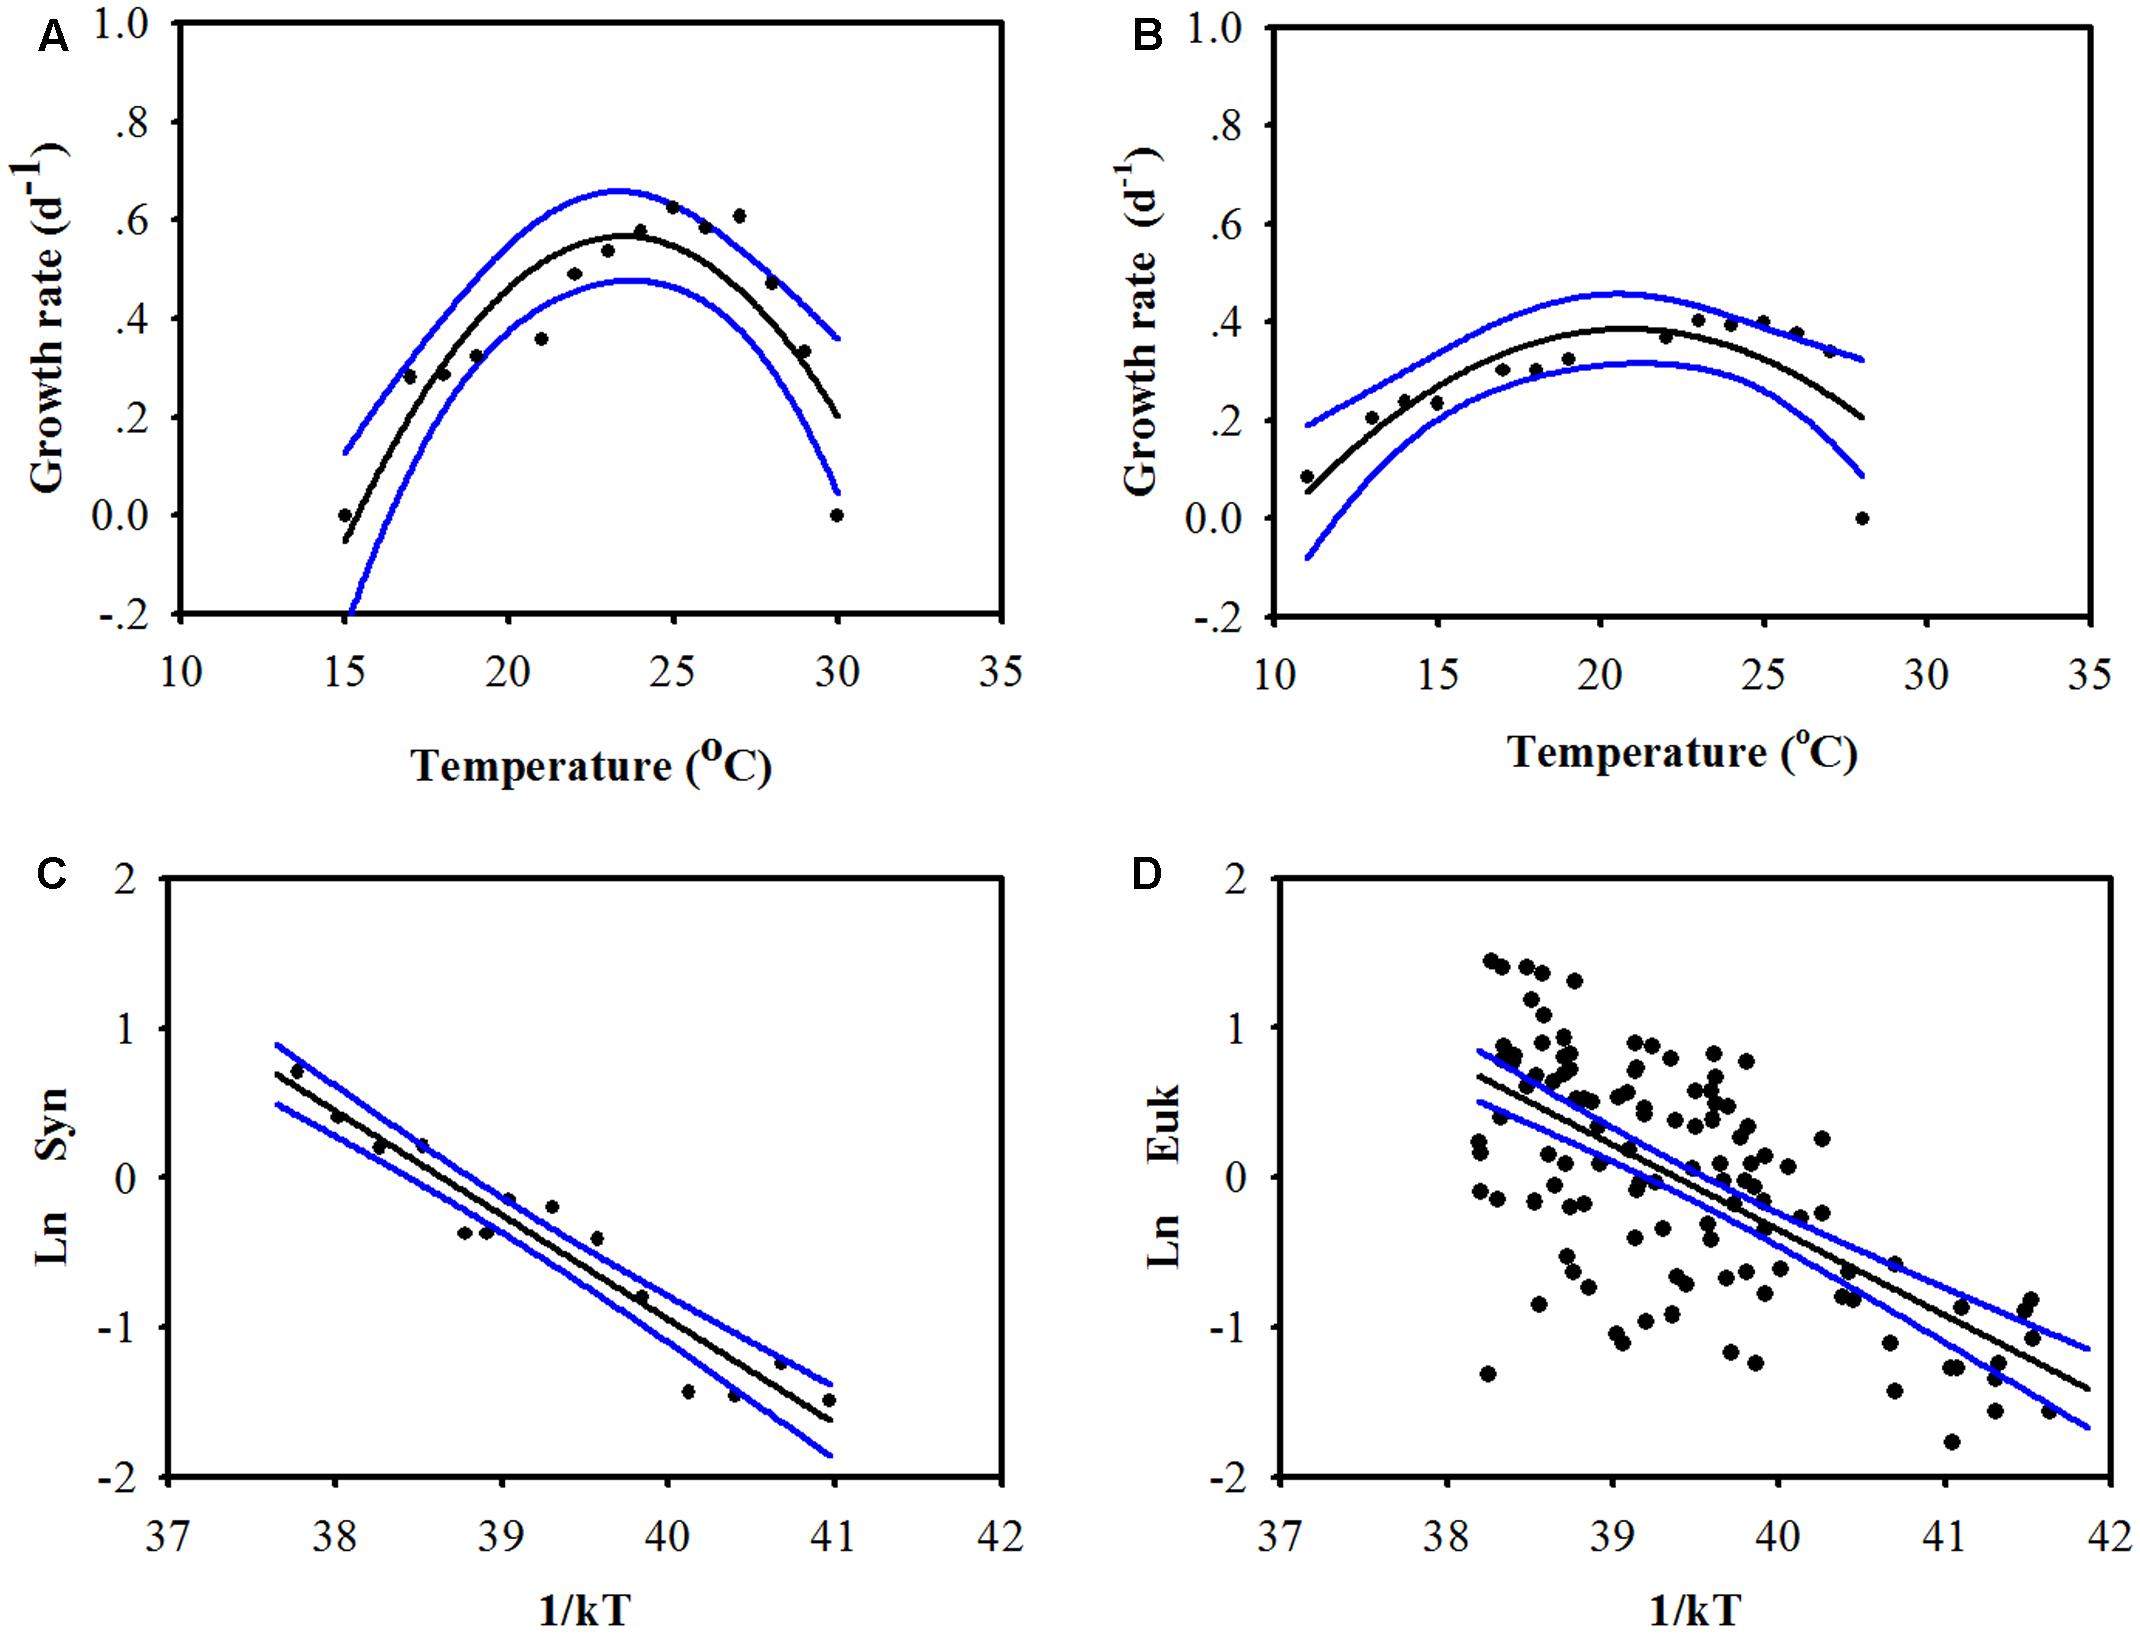
FIGURE 2. Relationship between temperature and the growth rates of low-latitude-dominated Prochlorococcus (A, eMIT9312, using lab data, growth rate = –4.17 + 0.40 × temperature – 0.0086 × temperature2, r2 = 0.78, P < 0.001), high-latitude-dominated Prochlorococcus (B, eMED4, using lab data, growth rate = –1.11 + 0.14 × temperature – 0.0035 × temperature2, r2 = 0.60, P < 0.01), Synechococcus [C, using lab data, according to the Arrhenius equation, LnμSyn = –0.73 (CI = –0.88 to –0.60)/kT + 28.13 (CI = 23.20–34.15), r2 = 0.92, P < 0.001], and picoeukaryotes [D, using field data when Chl is higher than 0.5 mg m-3, according to the Arrhenius equation, LnμEuk = –0.86 (CI = –1.07 to –0.68)/kT + 33.85 (CI = 26.94–42.35), r2 = 0.41, P < 0.001]. The blue lines and the value in the parentheses represent the 95% confidence interval (CI). The growth rate data of Prochlorococcus, Synechococcus, and picoeukaryotes were collected from Johnson et al. (2006), Chen et al. (2014), and Pittera et al. (2014), respectively.
For Synechococcus, the average temperature-dependent growth rate of six marine Synechococcus strains (tropical, A15-37 and M16.1; mid-latitude, WH7803 and ROS8604 and high-latitude, MVIR-16-2 and MVIR-18-1; Pittera et al., 2014) was computed for the temperature range of 10–34°C). Temperature was appeared also as a statistically significant predictor (r2 = 0.92, P < 0.001; Figure 2C) that closely correlated with the growth rates of Synechococcus.
The dataset used to simulate the relationships between temperature and the growth rates of Prochlorococcus and Synechococcus was from studies that used cultured strains isolated from particular marine sites (Johnson et al., 2006; Pittera et al., 2014; Biller et al., 2015). The data from limited number strains does not represent the full range of growth characteristic of Prochlorococcus and Synechococcus, although these datasets were widely used in other modeling studies (Boyd et al., 2015; Hynes et al., 2015; Stawiarski et al., 2016; Grossowicz et al., 2017). We recognize that the high phenotypic diversity of Prochlorococcus and Synechococcus combined with the limited number of cultured strains for which there are growth rates data represents an inherent limitation of model parameterizations.
While the prokaryotic fraction of picophytoplankton is dominated by two genera, Prochlorococcus and Synechococcus, the picoeukaryotic fraction is much more diverse and nearly every algal classes contain its representative species (Vaulot et al., 2008; de Vargas et al., 2015; Worden et al., 2015). Hence, the temperature-dependent growth rate of single picoeukaryotic taxa would not have been suitable for estimating growth rate of total picoeukaryotic community. Therefore, the temperature-dependent growth rate of picoeukaryotes was estimated using the field-measured growth rates of picoeukaryotic community reported by Chen et al. (2014). When the total Chl concentration is higher than 0.5 mg m-3, the growth rates of picoeukaryotes were related with temperature (r2 = 0.41, P < 0.001; Figure 2D). However, when the total Chl concentration is less than 0.5 mg m-3, the growth rates of picoeukaryotes were not significantly related with temperature (P > 0.05). The variability in the relationship between growth rates of picoeukaryotes and temperature is relatively large (Figure 2D), suggests that environmental factors which were not included in our model (e.g., light intensity, nutrients, Chl concentration, etc.) were important for the growth rates of picoeukaryotes (Chen et al., 2014). Based on the analyses presented in Figure 2D, the model may overestimate the growth rate of picoeukaryotes by an average of 58%. Picoeukaryotes represent variable fraction of the total picophytoplankton community (Table 2) and contribution to their photosynthetic carbon production (Figure 3). Hence, the proposed model introduces a level of uncertainty to the estimation of PPPico. More field data about the relationship between temperature and the growth rates of picoeukaryotes and the integration of other environmental factors into the estimation of the growth rates of picoeukaryotes would help to improve the accuracy of the model estimates.
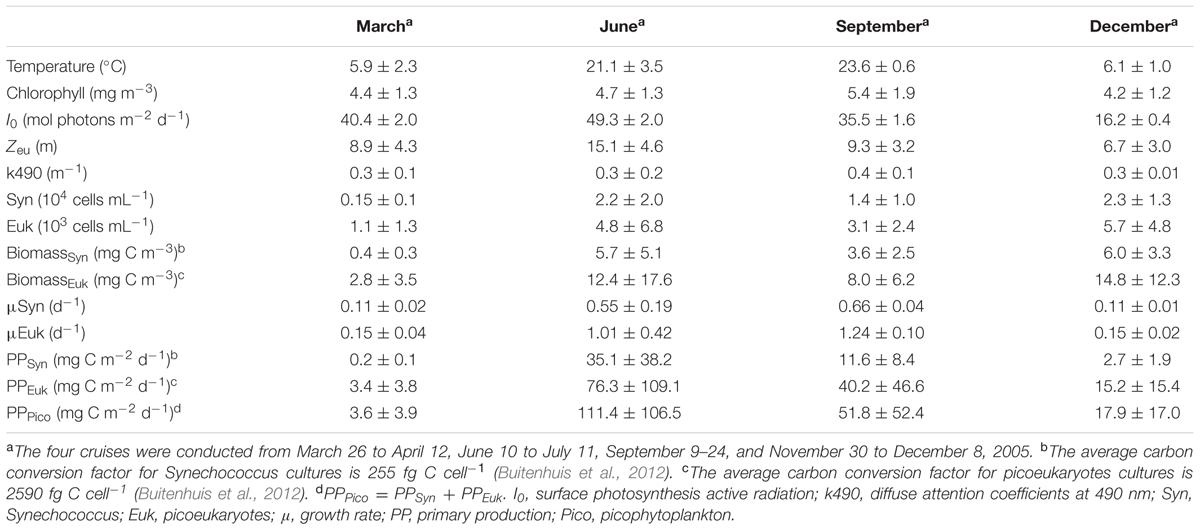
TABLE 2. Mean and standard deviation of surface environmental parameters and abundance, carbon biomass, and primary production of picophytoplankton in the Bohai Sea.
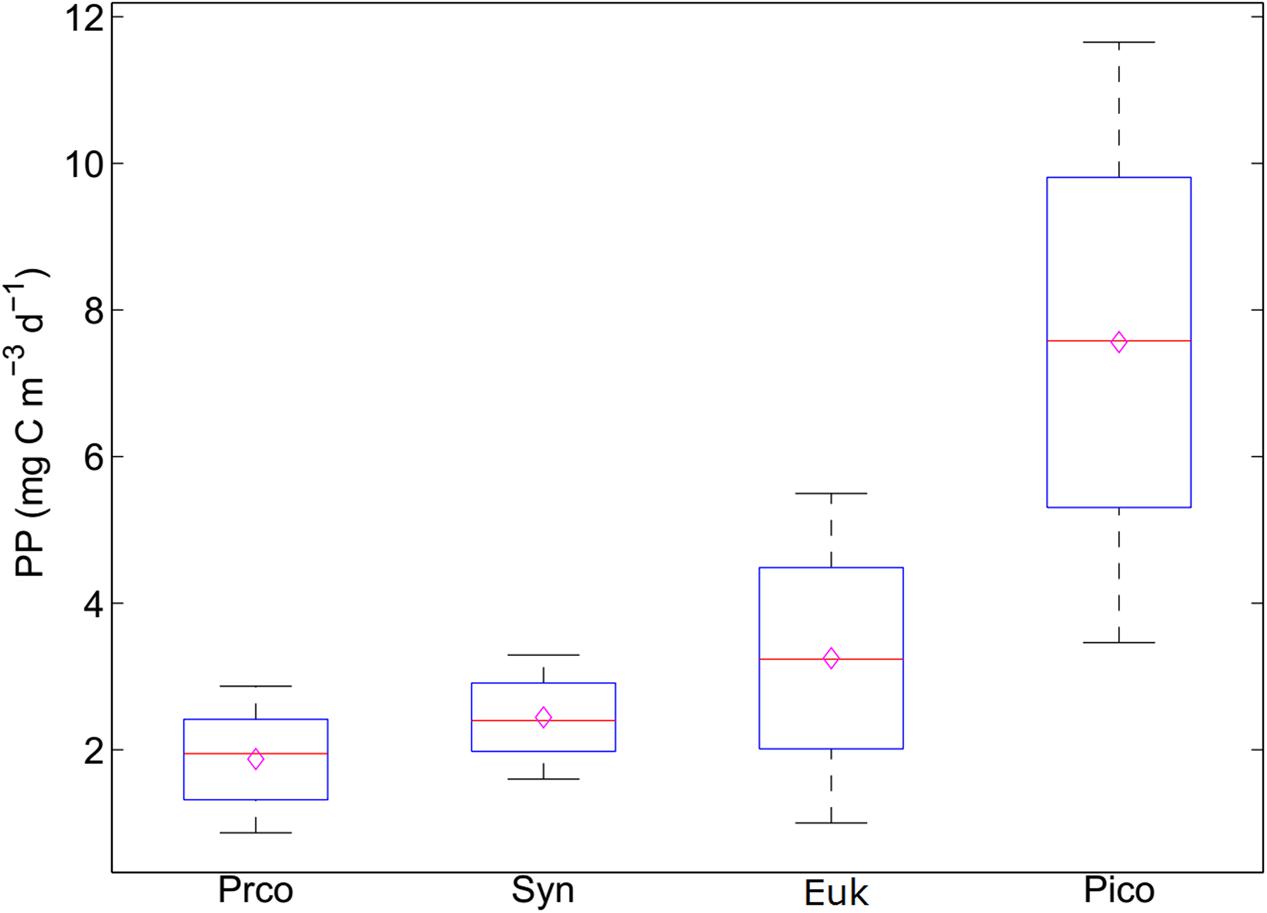
FIGURE 3. Sensitivity analysis of the carbon conversion factors on the primary production of picophytoplankton. The black lines represent the 95% confidence interval. The red line represents the median value. The hollow purple diamond represents the mean value. Proc, Prochlorococcus; Syn, Synechococcus; Euk, picoeukaryotes; Pico, picophytoplankton.
The Influence of CCF on the Calculation of PPPico
To test the influence of CCF on the calculated PPPico, the PPPico is calculated according to Eq. 4 (PP = C × μ), in which C is the product of the measured cell abundances and CCF values. The CCFs for each functional type of picophytoplankton is selected from the minimum to the maximum at increments of 10% (Buitenhuis et al., 2012). Sensitivity analysis showed that there is some uncertainty in the CCF, with larger variations for picoeukaryotes (∼5-fold) than Prochlorococcus and Synechococcus (two- to threefold), and this can lead to a ∼3-fold variation in computed PPPico (Figure 3). It follows that the determination of appropriate CCF is essential for accurate estimation of the picophytoplankton biomass and production. Besides the use a fixed CCF, the CCF could be calculated from cell size or volume (Buitenhuis et al., 2012). However, the cell size of different phytoplanktonic group could not be separated by the traditional flow cytometry method (Jiao et al., 2002; Buitenhuis et al., 2012). In future, the applications of new technologies (e.g., multi-laser flow cytometry method and the combination of fluorescence in situ hybridization and flow cytometry, etc.) into the measurement of calibrated cell size of particular picophytoplankton group could improve the accurate estimation of the picophytoplankton biomass (Thompson and van den Engh, 2016; Riou et al., 2017).
Buitenhuis et al. (2012) compiled the CCF from both unialgal cultures and in situ samples. The in situ CCF was calculated from the cell sizes estimated from flow cytometry and carbon:volume relationships (Campbell et al., 1994; Garrison et al., 2000; Worden et al., 2004; Bec et al., 2008). Due to the large variability of ratio of cell carbon:volume of picoplankton, the use of cell volume does not provide a clear advantage over CCF to estimate carbon biomass. Buitenhuis et al. (2012) compared the influence of the CCF directly measured and in situ estimated (the average values were 60, 154, and 1319 fg C cell-1 for Prochlorococcus, Synechococcus, and picoeukaryotes, respectively) on the estimation of carbon biomass using they compiled global picophytoplankton abundance dataset. Their analyses showed that the average carbon biomass using the in situ CCFs is 72% of that estimated using from that directly measured. Using the dataset in this study (Supplementary Data Sheet 1), we compared the influence of the direct and in situ CCFs on the estimation of carbon biomass and PPPico. The estimated carbon biomass using the direct and in situ CCFs was 10.0 ± 10.8 and 10.0 ± 7.7 mg C m-3 (n = 171), respectively, and the estimated PPPico was 7.3 ± 11.6 and 5.2 ± 6.9 mg C m-3 d-1, respectively. Although the differences in cell carbon content in laboratory grown and in situ populations could introduce uncertainties in the estimation of carbon biomass and PPPico, other well-accepted models and modeling studies used these CCFs to represent in situ processes (Buitenhuis et al., 2012). In future, the routine measurement of calibrated cell size of particular picophytoplankton group as the additional measurement was strongly recommended and could improve the accurate estimation of the picophytoplankton biomass and production (Thompson and van den Engh, 2016; Riou et al., 2017).
Comparison of the Measured and Model-Estimated Primary Production of Picophytoplankton
Model-estimated and measured PPPico were compared using the CbPM model based on the datasets of picophytoplankton abundance and their concomitantly measured PP using the 14C-uptake method. The data sets represent a wide geographic area and ocean domains and include the Atlantic Meridional Transect (Marañón et al., 2003), Southern Ocean (Smetacek et al., 1997), Atlantic Ocean (Li, 1994; Jardillier et al., 2010; Hartmann et al., 2014), South China Sea (Chen et al., 2014; Y. Xie and B. Huang, unpublished data), and French Polynesian atoll lagoons (Charpy and Blanchot, 1998) (Figure 1 and Supplementary Data Sheet 1).
The computed PPPico (sum of PPs of Prochlorococcus, Synechococcus, and picoeukaryotes), ranged from 0.04 to 104.8 mg C m-3 d-1, and the estimated and measured PPPico were significantly related (r2 = 0.53 and 0.46 for normal and log10-transformed data, respectively, P < 0.001, n = 171; Figure 4). This suggested the practical applicability of CbPM to estimate the PPPico. A Model 2 regression was used to assess the relationship between directly measured PPPico (using size fractionated 14C uptake) and model predicted PPPico. The slope of the relationship was greater than 1 (i.e., slope = 1.73, CI = 1.49–1.99), suggesting that our model overestimated PPPico by an average of 73% comparing to the measured PPPico. This overestimation depends on the relative composition of the picophytoplankton as well as the model’s representation of their growth characteristics. The use of variable CCFs and the larger data sets representing diverse community and growth conditions will improve the future model performance.
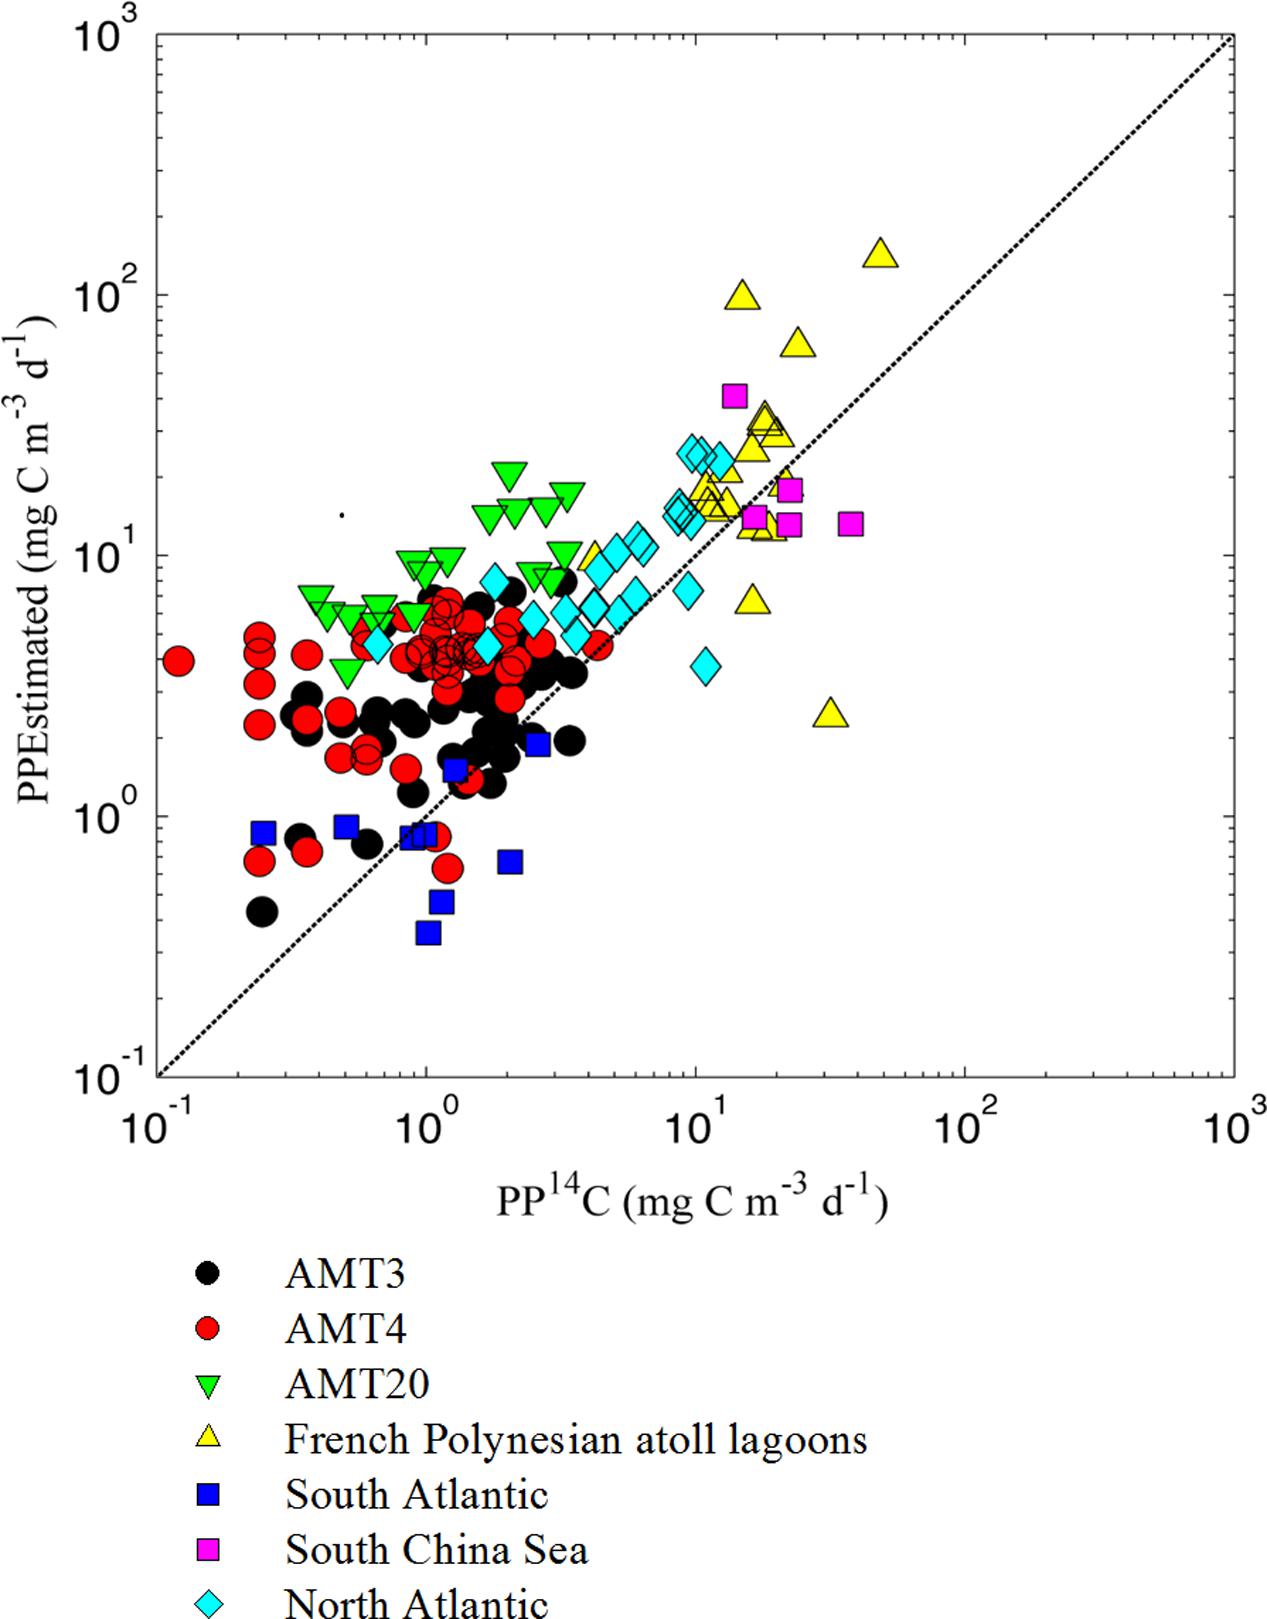
FIGURE 4. Relationship between model calculated and 14C-based estimates of primary production conducted in different ocean regions [PPEstimated = 1.73 (CI = 1.49–1.99) × PP14C + 0.57 (CI = 0.36–1.63), r2 = 0.53, P < 0.001, n = 171, Model 2 regression, Reduced Major Axis]. Calculated primary production was obtained by multiplying picophytoplankton growth rates times picophytoplankton carbon biomass. Carbon conversion was obtained from abundances of the picophytoplanktonic community and established average carbon to abundance conversions (Buitenhuis et al., 2012). The 14C-based primary production data were collected from Atlantic Meridional Transect (Marañón et al., 2003), Southern Ocean (Smetacek et al., 1997), Atlantic Ocean (Li, 1994; Jardillier et al., 2010; Hartmann et al., 2014), South China Sea (Chen et al., 2014; Y. Xie and B. Huang, unpublished data), and French Polynesian atoll lagoons (Charpy and Blanchot, 1998). The dashed black line represents the 1:1 line.
PP of total phytoplankton community is well characterized in the global ocean (Behrenfeld and Falkowski, 1997; Field et al., 1998; Tilstone et al., 2015). However, the contribution of picophytoplankton to total PP is still poorly understood. This is because that the ratio of in situ PPPico to total PP using the 14C-uptake method is extensively time-consuming and labor-intensive (Uitz et al., 2010; Landry et al., 2011; Laws, 2013). Although pigment-based modeling of PP has been applied to estimate the size-dependent PP (Uitz et al., 2008, 2010, 2012), due to the plasticity of Chl:C in response to the variability of environmental parameters, C rather than Chl is considered more suitable to estimate the PP (Westberry et al., 2008). Moreover, since the picoeukaryotes among picophytoplankton could not be separated from nano- and micro-phytoplanktonic eukaryotes through pigment analysis, the unique contribution of picoeukaryotes to total PP of phytoplankton is hard to be characterized, despite that the contribution of picoeukaryotes could be comparable to picocyanobacteria in some marine environments (Worden et al., 2004, 2015; Jardillier et al., 2010; Uitz et al., 2010). The modified CbPM in this study provides a carbon-based protocol which also takes into consideration the contribution of picoeukaryotes for PPPico estimation. As compared to the 14C-uptake method, due to the simplicity and convenience, CbPM can likely become a promising substitute method for large-scale survey for PPPico estimation in future.
Case Study of Estimating the PPPico in Bohai Sea by Using CbPM
The PPPico model was applied in the Bohai Sea, China, using the in situ picophytoplankton abundance and remotely sensed environmental variables. A total of 131 picophytoplankton abundance samples were collected during four seasonal 2005 cruises. Synechococcus and picoeukaryotes were identified and enumerated using flow cytometry (Jiao et al., 2002). Prochlorococcus was not detected in all samples. Previous studies showed that although Prochlorococcus was detected in the offshore waters of East China Sea and South China Sea, they were not detected in the Yellow Sea and Bohai Sea (Jiao and Yang, 2002; Jiao et al., 2002, 2005; Bai et al., 2012; Guo et al., 2014).
The abundance and distributions of Synechococcus and picoeukaryotes were shown in Table 2 and Figure 5. During March 2005, the abundances and distributions of Synechococcus and picoeukaryotes were similar and higher in the southern region than northern regions (Figures 5A,B). During June, the abundances of Synechococcus were higher in Laizhou Bay and Liaodong Bay mouth (Figure 5C). Picoeukaryotes abundance was higher in the Liaodong and Laizhou Bays (Figure 5D). During September, Synechococcus and picoeukaryotic abundance were generally higher along the eastern and north regions of the Bohai Sea (Figures 5E,F). During December, Synechococcus and picoeukaryotic abundance were generally higher in the offshore areas of the western areas of the Bohai Sea (Figure 5G). No significant depth-dependent variation in the abundance of picophytoplankton was observed during any of the cruises (ANOVA, P > 0.05; Supplementary Figures S1A–C).
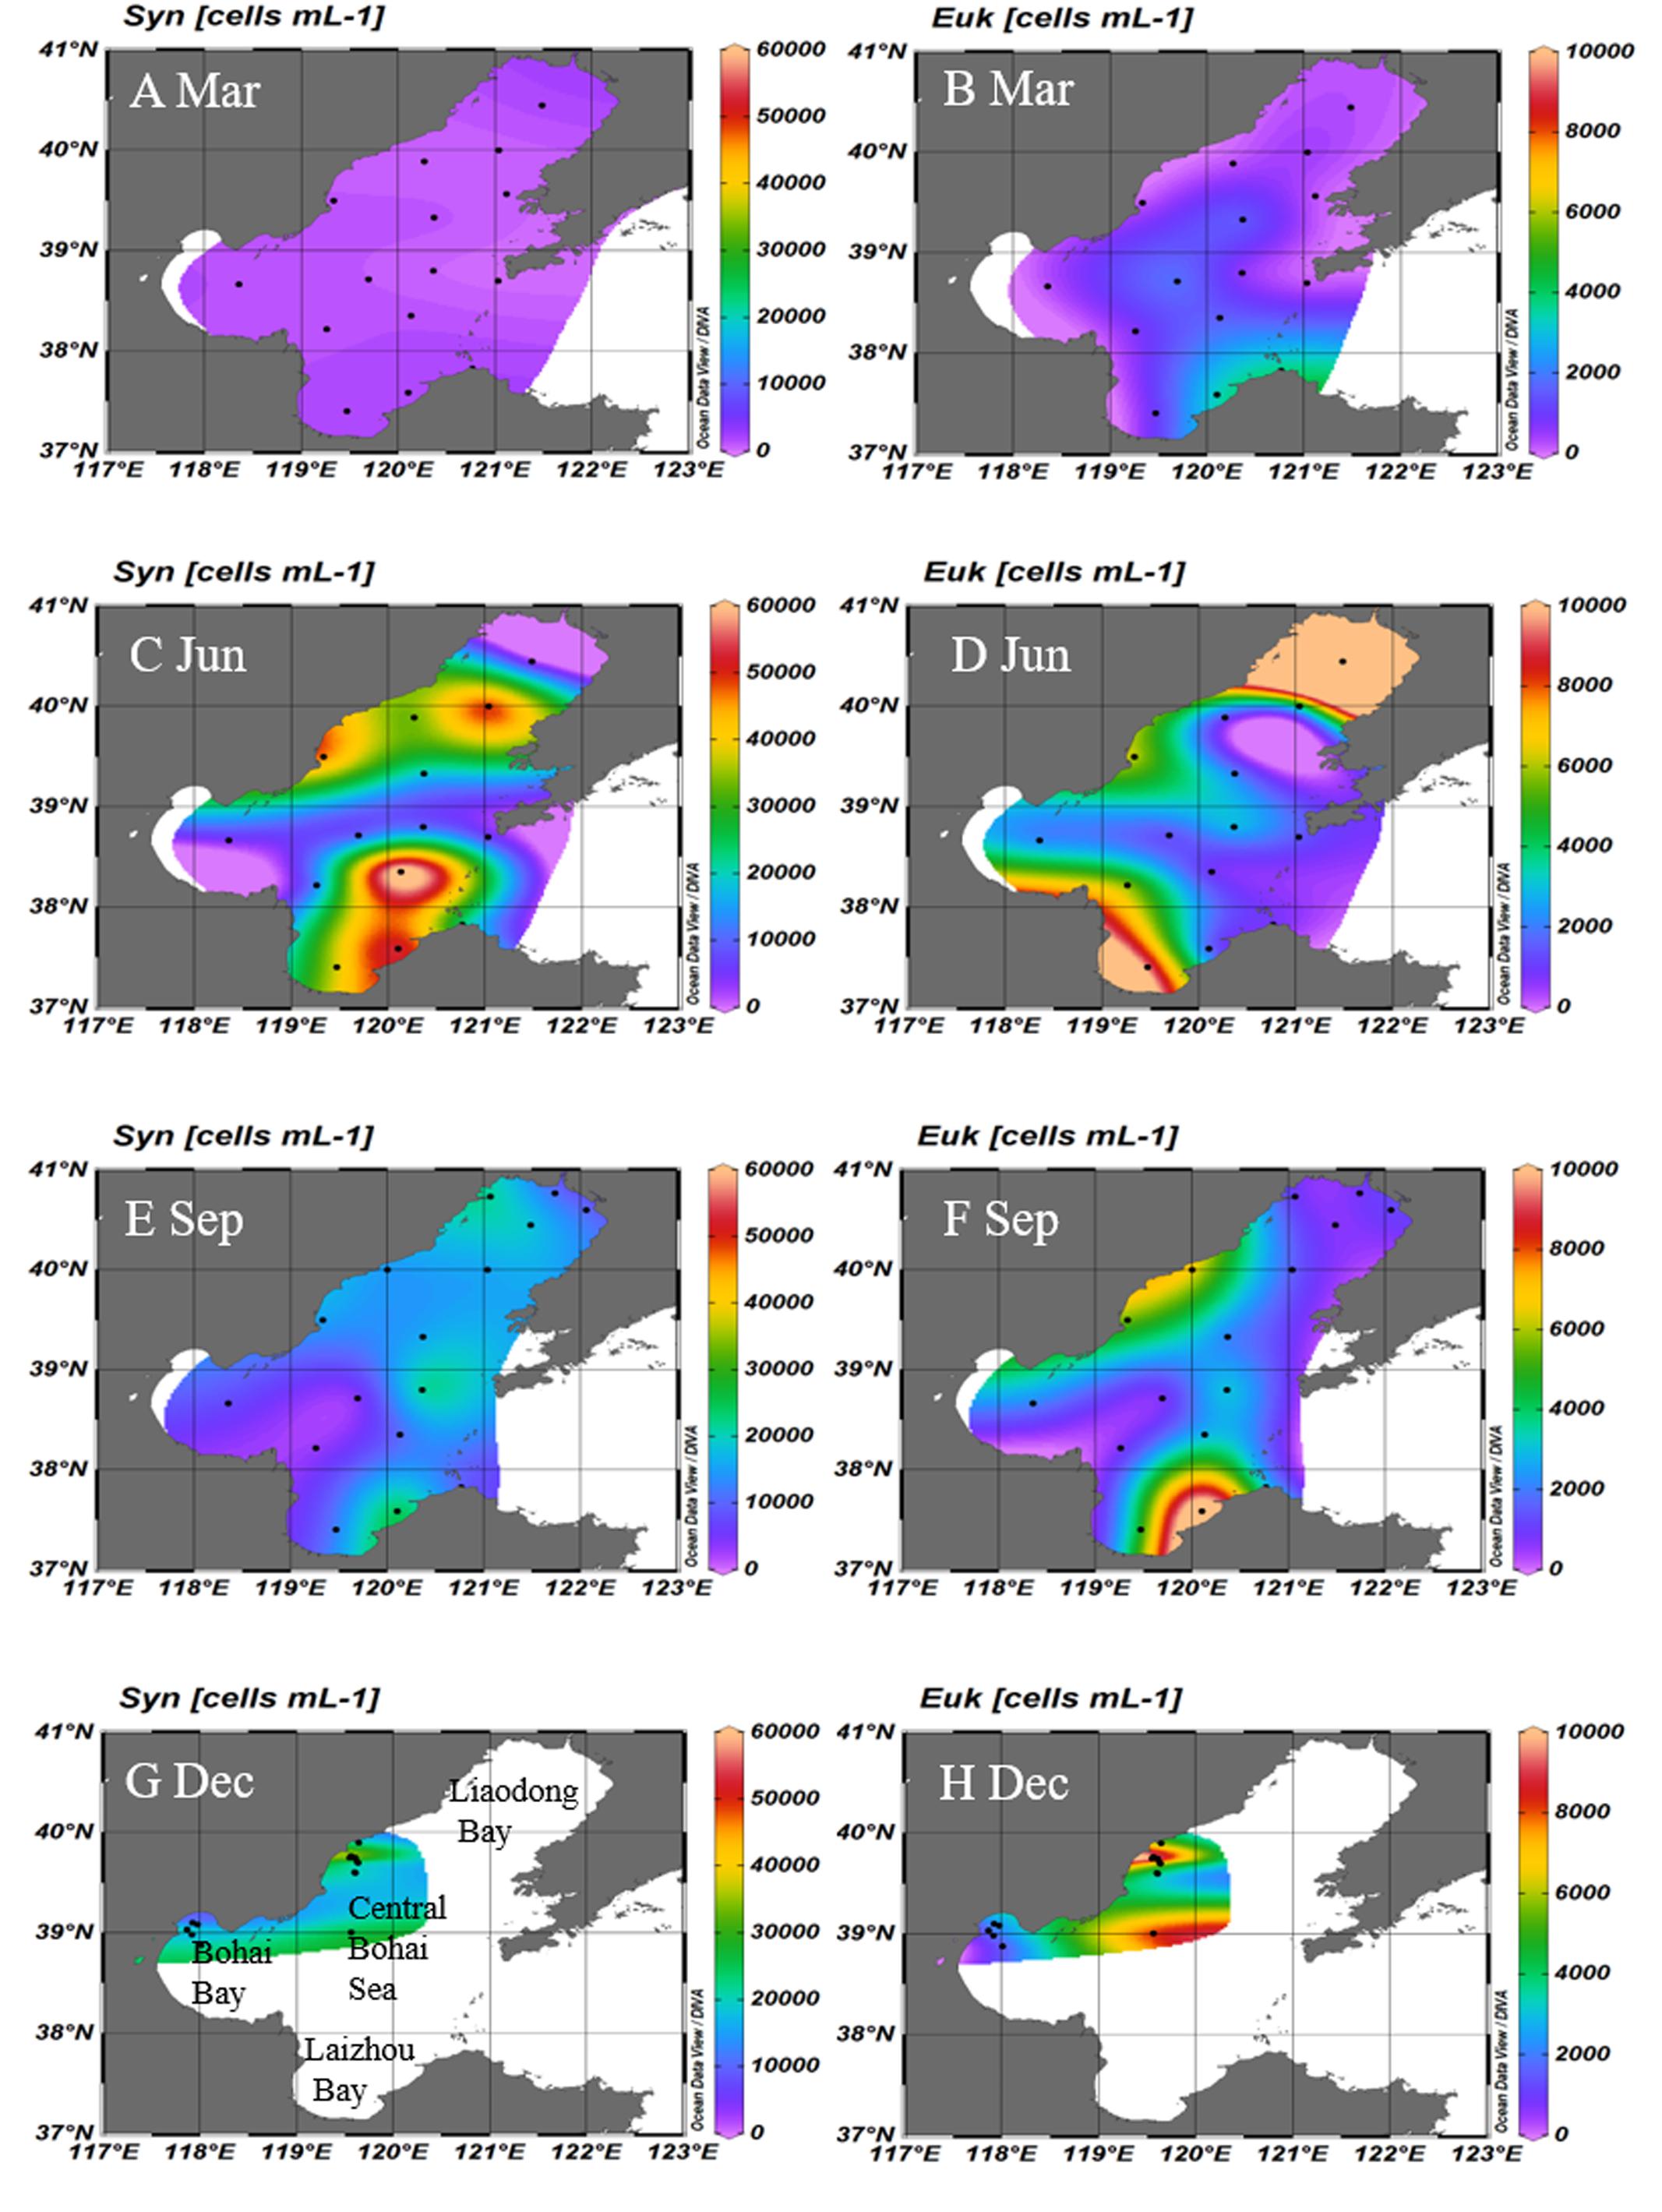
FIGURE 5. Surface distributions of Synechococcus (A,C,E,G) and picoeukaryotes (B,D,F,H) in the Bohai Sea in March, June, September, and December, respectively. Unit: cells mL-1. Black dotes represents the stations where samples were collected. Syn, Synechococcus; Euk, picoeukaryotes; Mar, March; Jun, June; Sep, September; Dec, December.
Table 2 and Supplementary Figures S2, S3 present the environmental variables in the Bohai Sea. The temperature increased from March to September (Supplementary Figure S2 and Table 2) and was isothermal during the March, September, and December (Supplementary Figure S3). Chl concentration was relatively stable and higher than 4.2 mg m-3 during the four cruises. I0 and Zeu increased from December to June. k490 was relatively stable during the four cruises (Table 2). The equations for Zeu in the original CbPM model were derived from the oligotrophic and upwelling waters. The application of the equations for Zeu might overestimate the Zeu in turbid coastal water which is a seasonal condition in the Bohai Sea, and thus overestimate the calculated PPPico using modified CbPM model (Behrenfeld et al., 2005; Shang et al., 2011; Tripathy et al., 2012). Shang et al. (2011) showed that the MODIS/Aqua Zeu products based on IOP-approach (Lee et al., 2005, 2007) were well related with the field-measured Zeu in the China Sea (including the coastal and shelf waters). Hence, the MODIS/Aqua Zeu products was used in the Bohai Sea.
The estimated PPs of Synechococcus, picoeukaryotes and picophytoplankton were shown in the Table 2 and Figure 6. The PPPico ranged from 0.1 to 11.9, 29.9 to 432.8, 5.5 to 214.9, and 2.4 to 65.8 mg C m-2 d-1 during March, June, September, and December, respectively in Bohai Sea. The PPSyn, PPEuk, and PPPico were higher in June and September than that in March and December (Figure 6). Though the abundance of picoeukaryotes was lower than Synechococcus (Figure 5), since picoeukaryotes have higher CCF and growth rate as compared with Synechococcus (Buitenhuis et al., 2012; Chen et al., 2014), the PPEuk was comparable with the PPSyn (Figure 6), which is in accordance with the results in the Atlantic Ocean (Worden et al., 2004; Jardillier et al., 2010). In future, the simultaneously measurement of the abundance, PP and growth rates of the picophytoplankton during the field campaigns could give more information and opportunity for the improvement of the PPPico model.
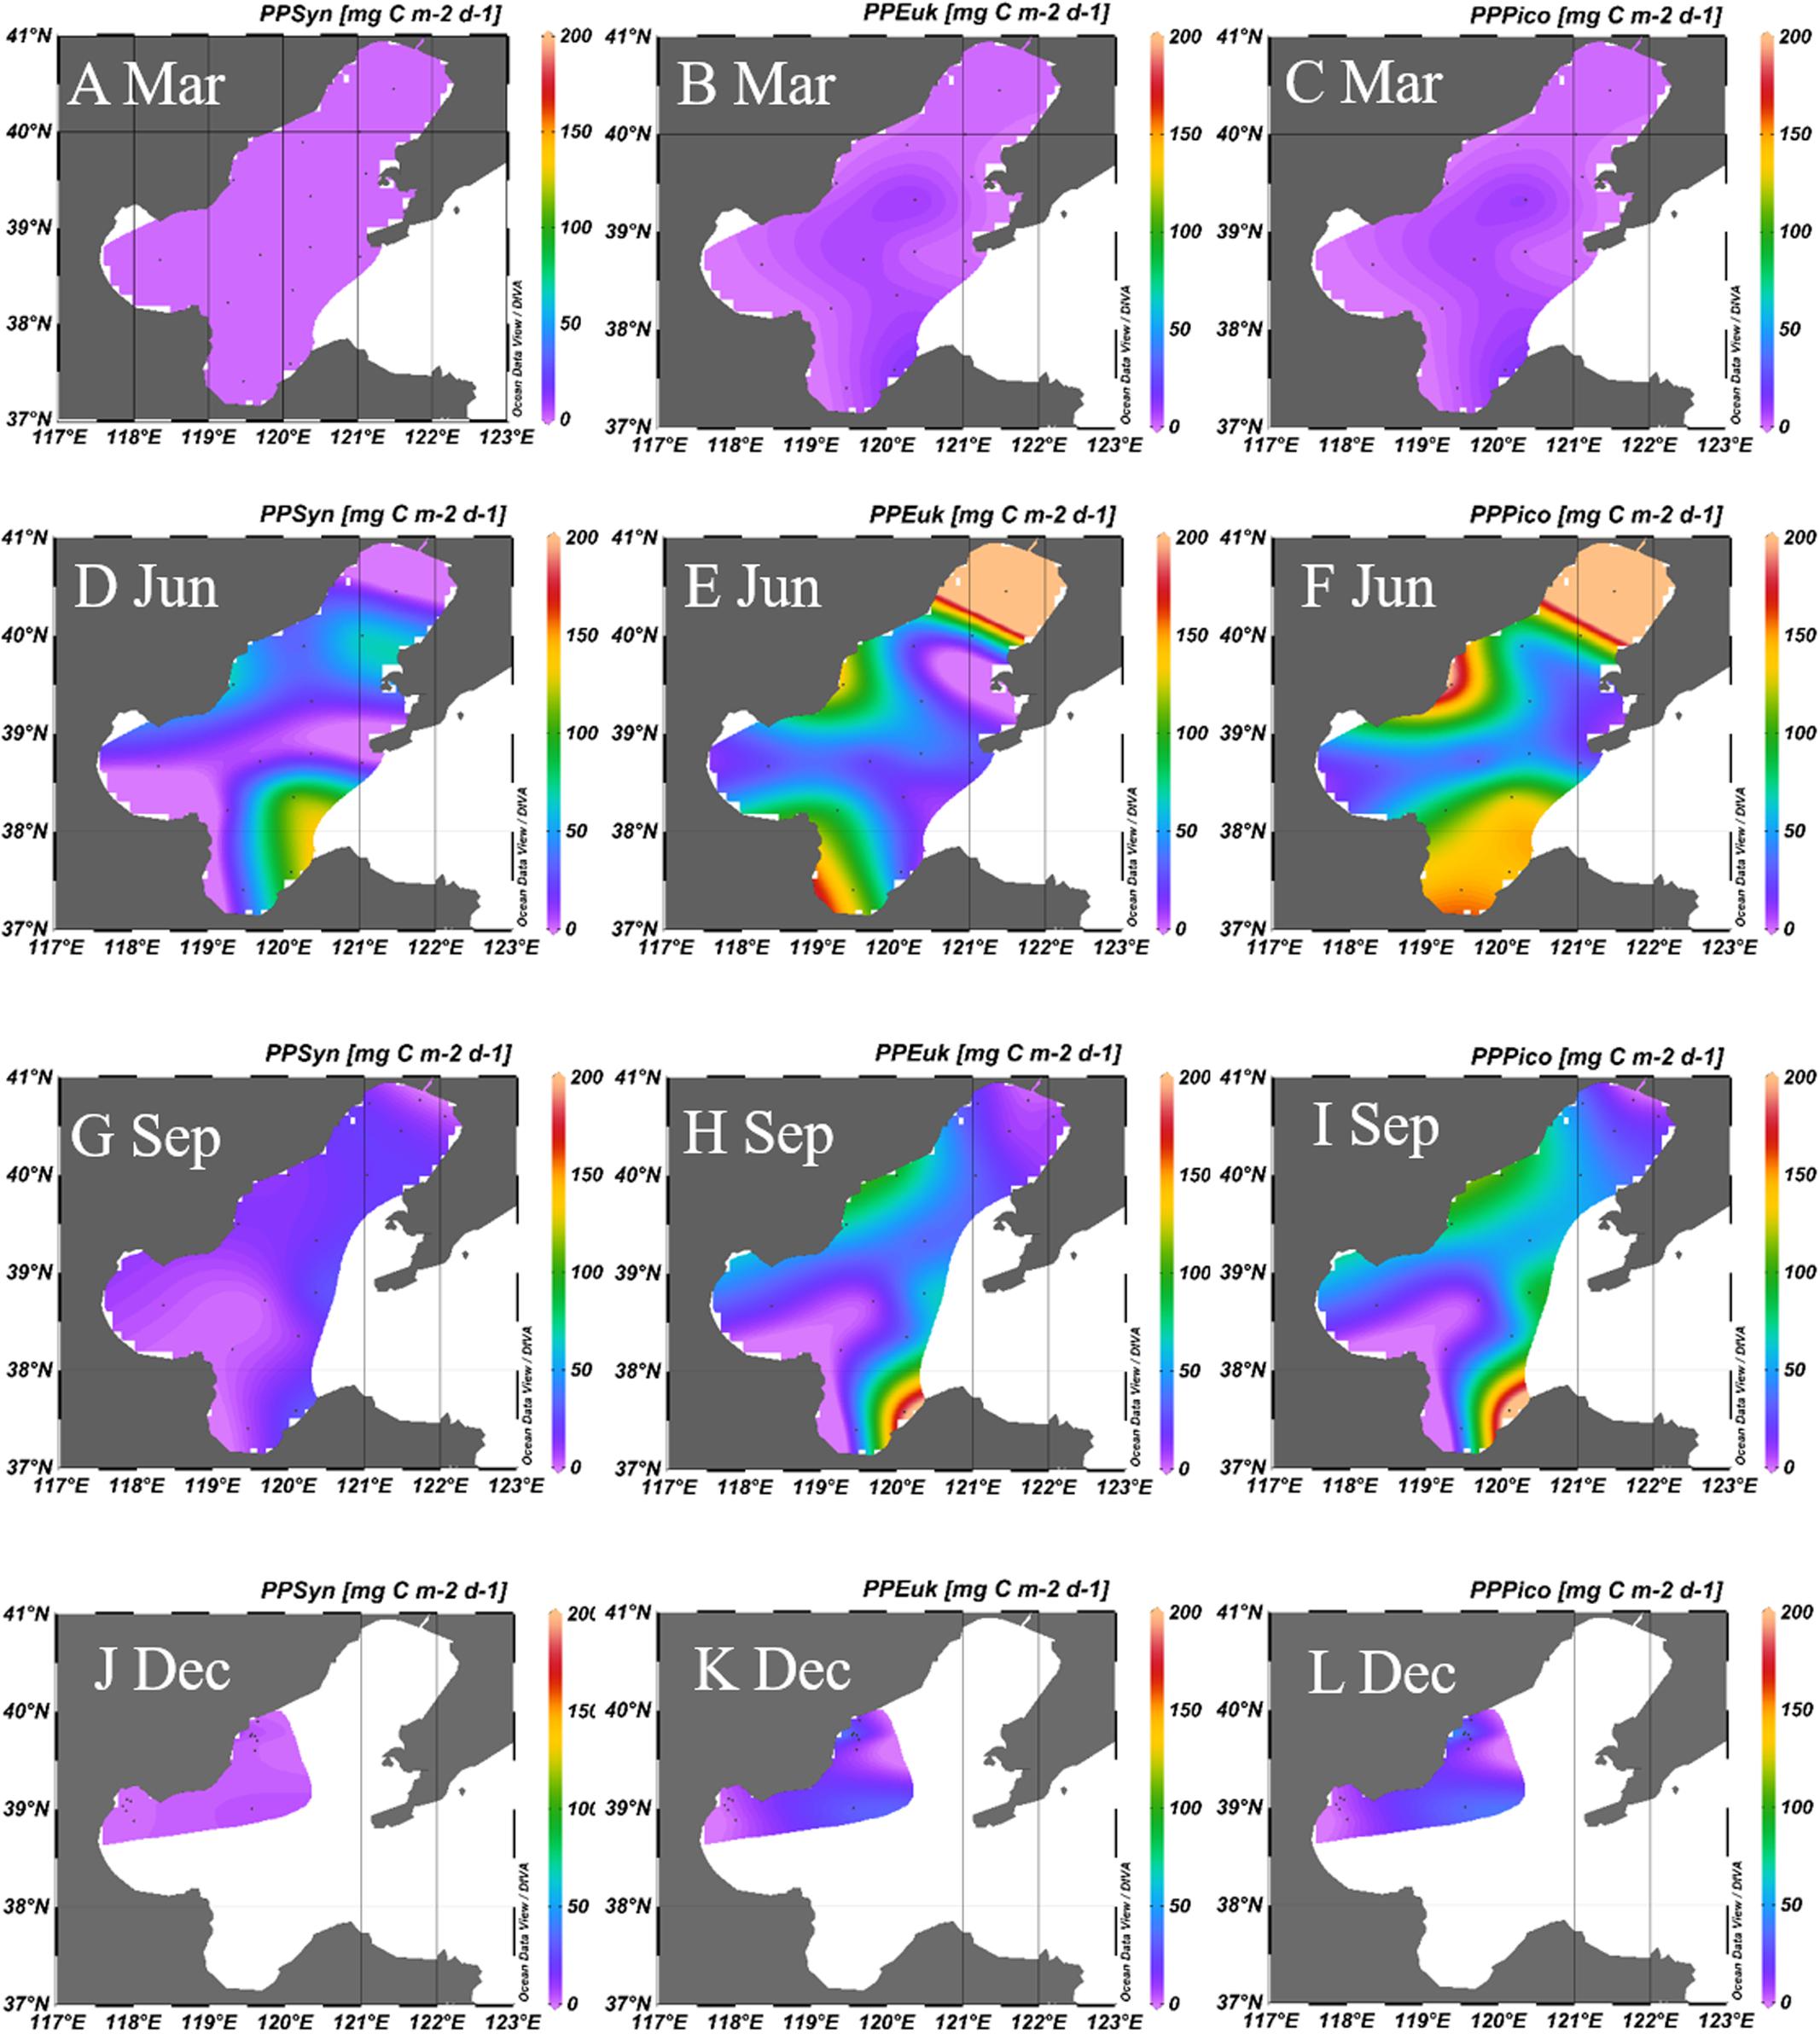
FIGURE 6. Primary production of Synechococcus (A,D,G,J), picoeukaryotes (B,E,H,K), and picophytoplankton (C,F,I,L) in the Bohai Sea in March, June, September, and December, respectively. Unit: mg C m-2 d-1. The carbon biomass were calculated from the average conversion factors for Synechococcus (255 fg C cell-1) and picoeukaryotes (2590 fg C cell-1; Buitenhuis et al., 2012). PPSyn, primary production of Synechococcus; PPEuk, primary production of picoeukaryotes; PPPico, primary production of picophytoplankton; Mar, March; Jun, June; Sep, September; Dec, December.
Concluding Remarks
In this study, a carbon-based PP model was employed to calculate the PPPico from the abundance and growth rates of picoplankton. The data set on global picophytoplankton abundance (Buitenhuis et al., 2012; Flombaum et al., 2013) and group-specific growth rate (Johnson et al., 2006; Chen et al., 2014; Pittera et al., 2014) could provide useful and novel information for estimating the contribution of picophytoplankton to oceanic PP. Though the modified CbPM can likely become a promising substitute method for large-scale PPPico estimation, the interpretations of the data are subject to some constraints. For example, the growth rate of a natural phytoplankton community is a function of light, nutrients, and temperature (Behrenfeld et al., 2005). In this study, the estimation of the growth rate of picophytoplankton did not consider the effects of light and nutrients. The integration of light and nutrients into the estimation of growth rate of picophytoplankton would increase the accuracy of the estimation of PPPico. Moreover, in this study the available field data set of PPPico which was obtained by using 14C method for the verification of the model is relatively small (n = 171). Larger field data set of PPPico is quite necessary for a better verification of the CbPM’s practical applicability in the future. In addition, the carbon biomass was calculated basing on the cell abundance and only one same CCF for each picophytoplankton group (e.g., Prochlorococcus, Synechococcus, and picoeukaryotes) and the relationship between the temperature and growth rate of picoeukaryotes showed large variability (r2 = 0.41), which also introduced uncertainty of the model. In the future, routine measurement of calibrated cell size and content of particular picophytoplankton group and better fitting the relationship between growth rate and temperature would be helpful to improve the accuracy of carbon biomass estimation of picophytoplankton. Meanwhile, the integration of light and nutrients into the modeling of growth rates of Prochlorococcus, Synechococcus, and picoeukaryotes, and further collection of field data of growth rate and PPPico would improve the predictive accuracy of estimating growth rate and PPPico. In consideration of the abundances of Prochlorococcus and Synechococcus are projected to increase 29 and 14%, respectively by the end of the 21st century (Flombaum et al., 2013), the approach reported here would shed light on the prediction of how picophytoplankton productivity respond to ocean warming in the future.
Author Contributions
YL and YyZ designed research. YL, NW, TL, YZ, and RR performed research and analyzed data. YL, YyZ, and RR wrote the paper.
Funding
This work was supported by the National Key Research and Development Program of China (2016YFA0601402), the open task of Qingdao National Laboratory for Marine Science and Technology (QNLM2016ORP0311), the CNOOC Tianjin project (CNOOC-KJ 125 FZDXM 00TJ 001-2014), a Key R&D projects in Shandong Province (2015GSF115036), the National Programme on Global Change and Air-Sea Interaction (GASI–03–01–02–05), NSFC projects (41606153 and 41422603), and the MEL Visiting Fellowship Program (MELRS1511). Funds from the Natural Sciences and Engineering Research Council of Canada and the President’s International Fellowship Initiative of the Chinese Academy of Sciences (CAS PIFI 2016VTA038) partially supported the participation of RR. This study is a contribution to the international IMBER project.
Conflict of Interest Statement
The authors declare that the research was conducted in the absence of any commercial or financial relationships that could be construed as a potential conflict of interest.
Acknowledgments
We thank Dr. Louis Legendre for his instructive suggestions about the improvement of the primary production model of picophytoplankton. We are grateful to Drs. Emilio Marañón, Mikhail V. Zubkov, and Yuyuan Xie for the contribution of field dataset of PP and abundance of picophytoplankton from Atlantic Meridional Transect and South China Sea. Ning Hong, Anyi Hu, Hong Deng, and Zaiqing Peng were acknowledged for their valuable help during the sampling collection of picophytoplankton in the Bohai Sea.
Supplementary Material
The Supplementary Material for this article can be found online at: https://www.frontiersin.org/articles/10.3389/fmicb.2017.01926/full#supplementary-material
DATA SHEET 1 | The field datasets of primary production and abundance of picophytoplankton.
FIGURE S1 | Vertical profiles of picophytoplankton abundance during arch (A), June (B), and September (C) 2005 in the Bohai Sea.
FIGURE S2 | Sea surface temperature during March (A), June (B), September (C), and December (D) 2005 in the Bohai Sea (from MODIS/Aqua).
FIGURE S3 | Vertical profiles of temperature during March (A), June (B), September (C), and December (D) 2005 in the Bohai Sea. The data was collected from the monthly data of World Ocean Atlas 2013 with a resolution of 0.25° × 0.25°.
Footnotes
- ^ https://oceandata.sci.gsfc.nasa.gov/MODIS-Aqua/Mapped/Monthly/4km/
- ^ https://www.nodc.noaa.gov/OC5/woa13/woa13data.html
References
Bai, X., Wang, M., Liang, Y., Zhang, Z., Wang, F., and Jiang, X. (2012). Distribution of microbial populations and their relationship with environmental variables in the North Yellow Sea, China. J. Ocean Univ. China 11, 75–85. doi: 10.1007/s11802-012-1799-8
Bec, B., Collos, Y., Vaquer, A., Mouillot, D., and Souchu, P. (2008). Growth rate peaks at intermediate cell size in marine photosynthetic picoeukaryotes. Limnol. Oceanogr. 53, 863–867. doi: 10.4319/lo.2008.53.2.0863
Behrenfeld, M. J., Boss, E., Siegel, D. A., and Shea, D. M. (2005). Carbon-based ocean productivity and phytoplankton physiology from space. Glob. Biogeochem. Cycles 19, GB1006. doi: 10.1029/2004gb002299
Behrenfeld, M. J., and Falkowski, P. G. (1997). Photosynthetic rates derived from satellite-based chlorophyll concentration. Limnol. Oceanogr. 42, 1–20. doi: 10.4319/lo.1997.42.1.0001
Biller, S. J., Berube, P. M., Lindell, D., and Chisholm, S. W. (2015). Prochlorococcus: the structure and function of collective diversity. Nat. Rev. Microbiol. 13, 13–27. doi: 10.1038/nrmicro3378
Blackburn, T. M., and Gaston, K. J. (1998). Some methodological issues in macroecology. Am. Nat. 151, 68–83. doi: 10.1086/286103
Boyd, P. W., Lennartz, S. T., Glover, D. M., and Doney, S. C. (2015). Biological ramifications of climate-change-mediated oceanic multi-stressors. Nat. Clim. Change 5, 71–79. doi: 10.1038/nclimate2441
Brown, J. H., Gillooly, J. F., Allen, A. P., Savage, V. M., and West, G. B. (2004). Toward a metabolic theory of ecology. Ecology 85, 1771–1789. doi: 10.1890/03-9000
Buitenhuis, E. T., Li, W. K. W., Vaulot, D., Lomas, M. W., Landry, M. R., Partensky, F., et al. (2012). Picophytoplankton biomass distribution in the global ocean. Earth Syst. Sci. Data 4, 37–46. doi: 10.5194/essd-4-37-2012
Campbell, L., Nolla, H. A., and Vaulot, D. (1994). The importance of Prochlorococcus to community structure in the central North Pacific-Ocean. Limnol. Oceanogr. 39, 954–961. doi: 10.4319/lo.1994.39.4.0954
Charpy, L., and Blanchot, J. (1998). Photosynthetic picoplankton in French Polynesian atoll lagoons: estimation of taxa contribution to biomass and production by flow cytometry. Mar. Ecol. Prog. Ser. 162, 57–70. doi: 10.3354/meps162057
Chen, B. Z., Liu, H. B., Huang, B. Q., and Wang, J. (2014). Temperature effects on the growth rate of marine picoplankton. Mar. Ecol. Prog. Ser. 505, 37–47. doi: 10.3354/meps10773
Cottrell, M. T., and Kirchman, D. L. (2009). Photoheterotrophic microbes in the Arctic Ocean in summer and winter. Appl. Environ. Microbiol. 75, 4958–4966. doi: 10.1128/AEM.00117-09
de Vargas, C., Audic, S., Henry, N., Decelle, J., Mahe, F., Logares, R., et al. (2015). Ocean plankton. Eukaryotic plankton diversity in the sunlit ocean. Science 348:1261605. doi: 10.1126/science.1261605
Falkowski, P. G., and La Roche, J. (1991). Acclimation to spectral irradiance in algae. J. Phycol. 27, 8–14. doi: 10.1111/j.0022-3646.1991.00008.x
Field, C. B., Behrenfeld, M. J., Randerson, J. T., and Falkowski, P. (1998). Primary production of the biosphere: integrating terrestrial and oceanic components. Science 281, 237–240. doi: 10.1126/science.281.5374.237
Flombaum, P., Gallegos, J. L., Gordillo, R. A., Rincon, J., Zabala, L. L., Jiao, N., et al. (2013). Present and future global distributions of the marine Cyanobacteria Prochlorococcus and Synechococcus. Proc. Natl. Acad. Sci. U.S.A. 110, 9824–9829. doi: 10.1073/pnas.1307701110
Garrison, D. L., Gowing, M. M., Hughes, M. P., Campbell, L., Caron, D. A., Dennett, M. R., et al. (2000). Microbial food web structure in the Arabian Sea: a US JGOFS study. Deep Sea Res. Pt. II 47, 1387–1422. doi: 10.1016/S0967-0645(99)00148-4
Geider, R. J. (1987). Light and temperature dependence of the carbon to chlorophyll ration in microalgae and cyanobacteria: implications for physiology and growth of phytoplankton. New Phytol. 106, 1–34. doi: 10.1111/j.1469-8137.1987.tb04788.x
Grossowicz, M., Marques, G. M., and van Voorn, G. A. K. (2017). A dynamic energy budget (DEB) model to describe population dynamics of the marine cyanobacterium Prochlorococcus marinus. Ecol. Model. 359, 320–332. doi: 10.1016/j.ecolmodel.2017.06.011
Guo, C., Liu, H., Zheng, L., Song, S., Chen, B., and Huang, B. (2014). Seasonal and spatial patterns of picophytoplankton growth, grazing and distribution in the East China Sea. Biogeosciences 11, 1847–1862. doi: 10.5194/bg-11-1847-2014
Hartmann, M., Gomez-Pereira, P., Grob, C., Ostrowski, M., Scanlan, D. J., and Zubkov, M. V. (2014). Efficient CO2 fixation by surface Prochlorococcus in the Atlantic Ocean. ISME J. 8, 2280–2289. doi: 10.1038/ismej.2014.56
Hynes, A. M., Blythe, B. J., and Binder, B. J. (2015). An individual-based model for the analysis of Prochlorococcus diel cycle behavior. Ecol. Model. 301, 1–15. doi: 10.1016/j.ecolmodel.2015.01.011
Jardillier, L., Zubkov, M. V., Pearman, J., and Scanlan, D. J. (2010). Significant CO2 fixation by small prymnesiophytes in the subtropical and tropical northeast Atlantic Ocean. ISME J. 4, 1180–1192. doi: 10.1038/ismej.2010.36
Jiao, N., Herndl, G. J., Hansell, D. A., Benner, R., Kattner, G., Wilhelm, S. W., et al. (2010). Microbial production of recalcitrant dissolved organic matter: long-term carbon storage in the global ocean. Nat. Rev. Microbiol. 8, 593–599.
Jiao, N., Yang, Y., Koshikawa, H., and Watanabe, M. (2002). Influence of hydrographie conditions on picoplankton distribution in the East China Sea. Aquat. Microb. Ecol. 30, 37–48. doi: 10.3354/ame030037
Jiao, N. Z., and Yang, Y. H. (2002). Ecological studies on Prochlorococcus in China seas. Chin. Sci. Bull. 47, 1243–1250. doi: 10.1360/02tb9276
Jiao, N. Z., Yang, Y. H., Hong, N., Ma, Y., Harada, S., Koshikawa, H., et al. (2005). Dynamics of autotrophic picoplankton and heterotrophic bacteria in the East China Sea. Cont. Shelf Res. 25, 1265–1279. doi: 10.1016/j.csr.2005.01.002
Johnson, Z. I., Zinser, E. R., Coe, A., McNulty, N. P., Woodward, E. M., and Chisholm, S. W. (2006). Niche partitioning among Prochlorococcus ecotypes along ocean-scale environmental gradients. Science 311, 1737–1740. doi: 10.1126/science.1118052
Kheireddine, M., Ouhssain, M., Claustre, H., Uitz, J., Gentili, B., and Jones, B. H. (2017). Assessing pigment-based phytoplankton community distributions in the Red Sea. Front. Mar. Sci. 4:132. doi: 10.3389/fmars.2017.00132
Klawonn, I., Nahar, N., Walve, J., Andersson, B., Olofsson, M., Svedén, J., et al. (2016). Cell-specific nitrogen-and carbon-fixation of cyanobacteria in a temperate marine system (Baltic Sea). Environ. Microbiol. 18, 4596–4609. doi: 10.1111/1462-2920.13557
Landry, M. R., Selph, K. E., Taylor, A. G., Decima, M., Balch, W. M., and Bidigare, R. R. (2011). Phytoplankton growth, grazing and production balances in the HNLC equatorial Pacific. Deep Sea Res. Pt. II 58, 524–535. doi: 10.1016/j.dsr2.2010.08.011
Laws, E. A. (2013). Evaluation of in situ phytoplankton growth rates: a synthesis of data from varied approaches. Annu. Rev. Mar. Sci. 5, 247–268. doi: 10.1146/annurev-marine-121211-172258
Lee, Z., Du, K. P., Arnone, R., Liew, S.C., and Penta, B. (2005). Penetration of solar radiation in the upper ocean: a numerical model for oceanic and coastal waters. J. Geophys. Res. Oceans 110:C09019. doi: 10.1029/2004jc002780
Lee, Z., Weidemann, A., Kindle, J., Arnone, R., Carder, K. L., and Davis, C. (2007). Euphotic zone depth: its derivation and implication to ocean-color remote sensing. J. Geophys. Res. Oceans 112:C03009. doi: 10.1029/2006jc003802
Li, W. K. W. (1994). Primary production of prochlorophytes, cyanobacteria, and eucaryotic ultraphytoplankton: measurements from flow cytometric sorting. Limnol. Oceanogr. 39, 169–175. doi: 10.4319/lo.1994.39.1.0169
Marañón, E., Behrenfeld, M. J., Gonzalez, N., Mourino, B., and Zubkov, M. V. (2003). High variability of primary production in oligotrophic waters of the Atlantic Ocean: uncoupling from phytoplankton biomass and size structure. Mar. Ecol. Prog. Ser. 257, 1–11. doi: 10.3354/meps257001
Partensky, F., Blanchot, J., and Vaulot, D. (1999). “Differential distribution and ecology of Prochlorococcus and Synechococcus in oceanic waters: a review,” in Marine Cyanobacteria. No. NS 19. Bulletin de l’Institut Oceanographique Monaco, Vol. 19, eds L. Charpy and A. W. D. Larkum (Monaco: Musee oceanographique), 457–475.
Partensky, F., and Garczarek, L. (2010). Prochlorococcus: advantages and limits of minimalism. Annu. Rev. Mar. Sci. 2, 305–331. doi: 10.1146/annurev-marine-120308-081034
Pittera, J., Humily, F., Thorel, M., Grulois, D., Garczarek, L., and Six, C. (2014). Connecting thermal physiology and latitudinal niche partitioning in marine Synechococcus. ISME J. 8, 1221–1236. doi: 10.1038/ismej.2013.228
Ploug, H., Musat, N., Adam, B., Moraru, C. L., Lavik, G., Vagner, T., et al. (2010). Carbon and nitrogen fluxes associated with the cyanobacterium Aphanizomenon sp. in the Baltic Sea. ISME J. 4, 1215–1223. doi: 10.1038/ismej.2010.53
Popa, R., Weber, P. K., Pett-Ridge, J., Finzi, J. A., Fallon, S. J., Hutcheon, I. D., et al. (2007). Carbon and nitrogen fixation and metabolite exchange in and between individual cells of Anabaena oscillarioides. ISME J. 1, 354–360. doi: 10.1038/ismej.2007.44
Ricker, W. E. (1973). Linear regressions in fishery research. J. Fish. Res. Board Can. 30, 409–434. doi: 10.1139/f73-072
Riou, V., Periot, M., and Biegala, I. C. (2017). Specificity re-evaluation of oligonucleotide probes for the detection of marine picoplankton by tyramide signal amplification-fluorescent in situ hybridization. Front. Microbiol. 8:854. doi: 10.3389/fmicb.2017.00854
Scanlan, D. J., Ostrowski, M., Mazard, S., Dufresne, A., Garczarek, L., Hess, W. R., et al. (2009). Ecological genomics of marine picocyanobacteria. Microbiol. Mol. Biol. Rev. 73, 249–299. doi: 10.1128/MMBR.00035-08
Shang, S., Lee, Z., and Wei, G. (2011). Characterization of MODIS-derived euphotic zone depth: results for the China sea. Remote Sens. Environ. 115, 180–186. doi: 10.1016/j.rse.2010.08.016
Smetacek, V., De Baar, H. J. W., Bathmann, U. V., Lochte, K., and Rutgers Van Der Loeff, M. M. (1997). Ecology and biogeochemistry of the antarctic circumpolar current during austral spring: a summary of southern ocean JGOFS cruise ANT X/6 of R.V. Polarstern. Deep Sea Res. Pt. II 44, 1–21. doi: 10.1016/S0967-0645(96)00100-2
Stawiarski, B., Buitenhuis, E. T., and Le Quéré, C. (2016). The physiological response of picophytoplankton to temperature and its model representation. Front. Mar. Sci. 3:164. doi: 10.3389/fmars.2016.00164
Sun, J., Liu, D., Chai, X., and Zhang, C. (2002). The chlorophyll a concentration and estimating of primary productivity in the Bohai Sea in 1998 1999. Acta Ecol. Sin. 23, 517–526.
Tang, Q. (2003). “The Yellow Sea LME and mitigation action,” in Large Marine Ecosystem of the World: Trends in Exploitation, Protection and Research, eds G. Hempel and K. Sherman (Amsterdam: Elsevier), 121–144.
Thompson, A. W., and van den Engh, G. (2016). A multi-laser flow cytometry method to measure single cell and population-level relative fluorescence action spectra for the targeted study and isolation of phytoplankton in complex assemblages. Limnol. Oceanogr. 14, 39–49. doi: 10.1002/lom3.10068
Tilstone, G. H., Taylor, B. H., Blondeau-Patissier, D., Powell, T., Groom, S. B., Rees, A. P., et al. (2015). Comparison of new and primary production models using SeaWiFS data in contrasting hydrographic zones of the northern North Atlantic. Remote Sens. Environ. 156, 473–489. doi: 10.1016/j.rse.2014.10.013
Tripathy, S. C., Ishizaka, J., Siswanto, E., Shibata, T., and Mino, Y. (2012). Modification of the vertically generalized production model for the turbid waters of Ariake Bay, southwestern Japan. Estuar. Coast. Shelf Sci. 97, 66–77. doi: 10.1016/j.ecss.2011.11.025
Uitz, J., Claustre, H., Gentili, B., and Stramski, D. (2010). Phytoplankton class-specific primary production in the world’s oceans: seasonal and interannual variability from satellite observations. Glob. Biogeochem. Cycles 24, GB3016. doi: 10.1029/2009gb003680
Uitz, J., Huot, Y., Bruyant, F., Babin, M., and Claustre, H. (2008). Relating phytoplankton photophysiological properties to community structure on large scales. Limnol. Oceanogr. 53, 614–630. doi: 10.4319/lo.2008.53.2.0614
Uitz, J., Stramski, D., Gentili, B., D’Ortenzio, F., and Claustre, H. (2012). Estimates of phytoplankton class-specific and total primary production in the Mediterranean Sea from satellite ocean color observations. Glob. Biogeochem. Cycles 26, GB2024. doi: 10.1029/2011gb004055
Vaulot, D., Eikrem, W., Viprey, M., and Moreau, H. (2008). The diversity of small eukaryotic phytoplankton (< or =3 microm) in marine ecosystems. FEMS Microbiol. Rev. 32, 795–820. doi: 10.1111/j.1574-6976.2008.00121.x
Wei, H., Sun, J., Moll, A., and Zhao, L. (2004). Phytoplankton dynamics in the Bohai Sea - observations and modelling. J. Mar. Syst. 44, 233–251. doi: 10.1016/j.jmarsys.2003.09.012
Westberry, T., Behrenfeld, M. J., Siegel, D. A., and Boss, E. (2008). Carbon-based primary productivity modeling with vertically resolved photoacclimation. Glob. Biogeochem. Cycles 22, GB2024. doi: 10.1029/2007gb003078
Worden, A. Z., Follows, M. J., Giovannoni, S. J., Wilken, S., Zimmerman, A. E., and Keeling, P. J. (2015). Environmental science. Rethinking the marine carbon cycle: factoring in the multifarious lifestyles of microbes. Science 347:1257594. doi: 10.1126/science.1257594
Worden, A. Z., Nolan, J. K., and Palenik, B. (2004). Assessing the dynamics and ecology of marine picophytoplankton: the importance of the eukaryotic component. Limnol. Oceanogr. 49, 168–179. doi: 10.4319/lo.2004.49.1.0168
Zhang, J., Yu, Z. G., Raabe, T., Liu, S. M., Starke, A., Zou, L., et al. (2004). Dynamics of inorganic nutrient species in the Bohai seawaters. J. Mar. Syst. 44, 189–212. doi: 10.1016/j.jmarseys.2003.09.010
Keywords: carbon-based production model, abundance, growth rate, primary production, picophytoplankton
Citation: Liang Y, Zhang Y, Wang N, Luo T, Zhang Y and Rivkin RB (2017) Estimating Primary Production of Picophytoplankton Using the Carbon-Based Ocean Productivity Model: A Preliminary Study. Front. Microbiol. 8:1926. doi: 10.3389/fmicb.2017.01926
Received: 22 June 2017; Accepted: 21 September 2017;
Published: 05 October 2017.
Edited by:
Sophie Rabouille, UMR7093 Laboratoire d’Océanographie de Villefranche (LOV), FranceCopyright © 2017 Liang, Zhang, Wang, Luo, Zhang and Rivkin. This is an open-access article distributed under the terms of the Creative Commons Attribution License (CC BY). The use, distribution or reproduction in other forums is permitted, provided the original author(s) or licensor are credited and that the original publication in this journal is cited, in accordance with accepted academic practice. No use, distribution or reproduction is permitted which does not comply with these terms.
*Correspondence: Yongyu Zhang, zhangyy@qibebt.ac.cn