 Sheila Okoth1*
 Marthe De Boevre2
 Arnau Vidal2
 José Diana Di Mavungu2
 Sofie Landschoot3
 Martina Kyallo4
 Joyce Njuguna4
 Jagger Harvey5Sarah De Saeger2
- 1School of Biological Sciences, University of Nairobi, Nairobi, Kenya
- 2Department of Bioanalysis, Faculty of Pharmaceutical Sciences, Ghent University, Ghent, Belgium
- 3Department of Applied Bioscience Engineering, Faculty of Bioscience Engineering, Ghent University, Ghent, Belgium
- 4Biosciences Eastern and Central Africa, International Livestock Research Institute, Nairobi, Kenya
- 5Feed the Future Innovation Lab, Kansas State University, Manhattan, KS, United States
Aspergillus flavus is the main producer of carcinogenic aflatoxins in agricultural commodities such as maize. This fungus occurs naturally on crops, and produces aflatoxins when environmental conditions are favorable. The aim of this study is to analyse the genetic variability among 109 A. flavus isolates previously recovered from maize sampled from a known aflatoxin-hotspot (Eastern region, Kenya) and the major maize-growing area in the Rift Valley (Kenya), and to determine their toxigenic potential. DNA analyses of internal transcribed spacer (ITS) regions of ribosomal DNA, partial β-tubulin gene (benA) and calmodulin gene (CaM) sequences were used. The strains were further analyzed for the presence of four aflatoxin-biosynthesis genes in relation to their capability to produce aflatoxins and other metabolites, targeting the regulatory gene aflR and the structural genes aflP, aflD, and aflQ. In addition, the metabolic profile of the fungal strains was unraveled using state-of-the-art LC-MS/MS instrumentation. The three gene-sequence data grouped the isolates into two major clades, A. minisclerotigenes and A. flavus. A. minisclerotigenes was most prevalent in Eastern Kenya, while A. flavus was common in both regions. A. parasiticus was represented by a single isolate collected from Rift Valley. Diversity existed within the A. flavus population, which formed several subclades. An inconsistency in identification of some isolates using the three markers was observed. The calmodulin gene sequences showed wider variation of polymorphisms. The aflatoxin production pattern was not consistent with the presence of aflatoxigenic genes, suggesting an inability of the primers to always detect the genes or presence of genetic mutations. Significant variation was observed in toxin profiles of the isolates. This is the first time that a profound metabolic profiling of A. flavus isolates was done in Kenya. Positive associations were evident for some metabolites, while for others no associations were found and for a few metabolite-pairs negative associations were seen. Additionally, the growth medium influenced the mycotoxin metabolite production. These results confirm the wide variation that exists among the group A. flavus and the need for more insight in clustering the group.
Introduction
The filamentous fungus Aspergillus flavus is a cosmopolitan soil-born saprophytic organism with opportunistic parasitic behaviors to plants, animals and humans. A. flavus is the most common causal agent of aflatoxin (AF) contamination in food and feed, and the main producer of carcinogenic aflatoxin B1 (AFB1), (International Agency for Research on Cancer (IARC), 2002). A. flavus is known as the second cause of human invasive aspergillosis after A. fumigatus (Denning, 1988; Latge, 1999; Hedayati et al., 2007). Variability in the A. flavus phenotype exists, for example, in sclerotia formation, culture characteristics, and ability to produce aflatoxins. Reports illustrate that other metabolites can be produced with an unraveled toxicological profile (Pildain et al., 2008; Nicholson et al., 2009; Ehrlich and Brian, 2014). Culture and molecular methods have been used to group isolates into aflatoxigenic and non-aflatoxigenic strains (Zarrin and Erfaninejad, 2016), and to investigate the variability in fungal species and subspecies (Geiser et al., 1998a,b, 2000; Frisvad et al., 2007; Jurjević et al., 2015). Frisvad et al. (2005) raised A. flavus var. parvisclerotigenus to another species level, based on its atypical S-type sclerotia, profile of excreted metabolites and difference in rDNA-sequence. Geiser et al. (2000) subdivided A. flavus into Group 1 and Group 11 on the basis of sclerotia type and aflatoxin profile. Several authors have given evidence that A. flavus sensu lato may consist of several species (Geiser et al., 1998a,b, 2000; Pildain et al., 2008). The variation within the A. flavus isolates suggests the need for an extended taxonomic delineation for the benefit of the development of effective and safe biocontrol application technologies.
Among the mycotoxins produced by A. flavus, the production of aflatoxins have been studied more with the objective of understanding the diversity of the fungus, management of aflatoxin production by applying biocontrol technique and flow of genes involved in aflatoxin synthesis within a population. The aflatoxin biosynthetic pathway in A. flavus and A. parasiticus, involves approximately 30 genes clustered together in a 70-kb DNA region of the fungal genome on chromosome 111 roughly 80-kb away from telomere (Yu, 2012). The order of genes within the cluster is reported to be highly conserved wihin Aspergillus section Flavi. Among the 30 genes identified the functions of 19 have been assigned (Yu and Ehrlich, 2011). PCR detection of aflatoxin biosynthetic gene presence or expression has been used as diagnostic tool for aflatoxigenic fungi in selected commodities (Geisen, 2007). Sequence variability and deletions in various genes/regions of the aflatoxin biosynthetic cluster have also been used to determine the polyphyletic assemblages of A. flavus genotypes (Chang et al., 2005, 2006; Mohankumar et al., 2010; Gonçalves et al., 2012; Al-Wadai et al., 2013). Gene deletions and presence of single nucleotide polymorphisms (SNPs) in aflatoxin biosynthetic genes have been associated with A. flavus inability to produce aflatoxins. (Solorzano et al., 2014) observed genetic diversity among a population of A. flavus in a field in Mississipi over years and reported mutations among toxigenic isolates resulting into loss of ability to produce aflatoxins. Horizontal transfer of this gene cluster has also been documented (Susca et al., 2017). In this study the presence of the structural genes aflD (nor-1) which encodes the ketoreductase needed for the conversion of the 1'-keto group in norsolorinic acid (the first stable aflatoxin precursor) to the 1′-hydroxyl group of averantin; aflP (omtA) involved in the conversion of sterigmatocystin (ST) to O-methylsterigmatocystin (OMST) and demethylsterigmatocystin (DMST) to dihydro-O-methylsterigmatocystin (DHOMST); aflQ (ordA) involved in the conversion of OMST to AFB1 and AFG1 and of DHOMST to AFB2 and AFG2; and the regulatory gene (aflR) are determined in A. flavus strains collected from Eastern and Rift valley regions of Kenya.
Kenya has experienced several fatal acute aflatoxicosis outbreaks following consumption of contaminated food and feed (Okoth, 2016). Most of these outbreaks have occurred in the Eastern part of the country, after consumption of home-grown maize. This region is reported to harbor a large population of the S-strain of A. flavus (Okoth et al., 2012). This study sought to establish the variability patterns of A. flavus strains previously isolated from the Eastern and Rift Valley regions of Kenya using sequence analysis of the ITS region, and parts of the β-tubulin and calmodulin genes and metabolite profiles (Okoth et al., 2012). The Rift Valley is the major commercial maize-growing area of Kenya, and no aflatoxicosis outbreaks have been reported there. Such information is important given that aflatoxin production is a polygenic variable trait that may experience outcrossing between two strains during reproduction. Reproduction in A. flavus is mostly asexual, however sexual reproduction is also known to occur together with non-sexual recombination among isolates that are highly similar. The mechanisms are not clear, and can only be deduced by population studies to unravel the diversity of the fungus. This is the first comprehensive analysis of A. flavus isolates in Kenya using molecular analysis and metabolic profiling. The possible variations within A. flavus isolates is explained here using the sequence analysis of the conserved ITS region of the rDNA gene cluster and parts of the calmodium and β-tubulin genes, presence of four genes in the aflatoxin biosynthetic pathway and metabolite profile.
Materials and Methods
Source of Aspergillus Flavus Isolates
The isolates used in this study were previously recovered from maize collected from farmers in the Rift valley (n = 255) and the Eastern regions of Kenya (n = 258) in 2010, from a larger study carried out by Okoth et al. (2012) and Nyongesa et al. (2015). The isolates were identified as A. flavus using morphological and cultural characteristics. The isolates were preserved on silica gel at the University of Nairobi. From this collection, 109 isolates [n = 53 (Eastern Kenya), n = 56 (Rift Valley)] were randomly selected, and grown at 28°C on potato dextrose agar (PDA).
Multi-Analysis of Aspergillus Metabolites
Reagents and Chemicals
The individual mycotoxin solid calibration standards (1 mg) of aflatoxin B1(AFB1), aflatoxin B2 (AFB2), aflatoxin G1 (AFG1), aflatoxin G2 (AFG2), and zearalanone (ZAN) (internal standard) were obtained from Sigma Aldrich (Bornem, Belgium) Zearalanone was used as internal standard to quantify the AFs, but also to feature as identification criterium for the other metabolites. One of the identification criterium is the relative retention time. The retention time of the internal standard is compared to the retention time of the metabolites, and should remain constant.
All mycotoxin solid standards were dissolved in methanol (1 mg/mL) and were storable for a minimum of 1 year at −18°C (Spanjer et al., 2008). The working solutions of AFB1, AFB2, AFG1, AFG2, and ZAN (10 ng/μl) were prepared in methanol, and stored at −18°C and renewed monthly. Water was obtained from a Milli-Q® SP Reagent water system from Millipore Corp. (Brussels, Belgium). Disinfectol® (denaturated ethanol with 5% ether) was supplied by Chem-Lab (Zedelgem, Belgium). Methanol (LC-MS grade) was purchased from BioSolve (Valkenswaard, the Netherlands), while acetonitrile (Analar Normapur) and ammonium acetate were obtained from VWR International (Zaventem, Belgium). Acetic acid (glacial, 100%) was supplied by Merck (Darmstadt, Germany).
Sample Preparation, Treatment, and Extraction
Aspergillus flavus isolates analyzed in this study were grown on Czapek yeast extract agar (CYA) and aflatoxin-inducing yeast extract sucrose agar (YESA) to determine their metabolites profile. A loop of mycelia and spores of the isolates scraped from 9 mm PDA plugs were inoculated on 9 cm diameter Petri plates, and incubated at 28°C for 7 days in the dark. Using a 9 mm diameter sterile cork borer, 9 plugs were harvested uniformly from the plates into 50 mL propylene tubes. The agar was submitted to acetonitrile maceration (5 mL) overnight (15 h). Then, metabolites were extracted from the matrix with 10 mL of water and 20 mL of dichloromethane while shaking for 30 min. The mixture was centrifuged (3,000 g, 15 min), 10 mL from the bottom face was evaporated and resuspended with 1 mL of methanol/acetonitrile/water (30/30/40, v/v/v).
LC-MS/MS Methodology
An LC-MS/MS method was developed and validated for the analysis of 32 analytes (Table 1). A Waters Acquity UPLC system coupled to a Xevo TQS mass spectrometer (Waters, Milford, MA, USA) was used to analyse the samples, equipped with MassLynx® (version 4.1) and QuanLynx® (version 4.1) software (Waters, Manchester, UK) for data acquisition and processing. A ZORBAX Eclipse XDB C18-column (1.8 μm, 100 × 2.1 mm) was applied (Agilent Technologies, Diegem, Belgium). The mobile phase consisted of water/methanol (95/5, v/v (A)) and methanol/water (95/5, v/v (B)), both adjusted with 5 mM ammonium acetate and 0.1% formic acid, at a flow rate of 0.4 mL/min. The gradient elution programme started at 100% mobile phase A for 0.5 min. Then, the mobile phase B increased with a linear increase to 99% in the 20 min. The mobile phase B was kept at 99% for 5 min. The mobile phase linearly decreased till 0% for 1 min. Mobile phase A (100%) was running for 4 min. The duration of each LC run was 30 min, including re-equilibration. The capillary voltage was 3 kV, and nitrogen was applied as spray gas. Source and desolvation temperatures were set at 120° and 400°C, respectively. The argon collision gas pressure was 9 × 10⁻⁶ bar, the cone gas flow 35 L/h and the desolvation gas flow 800 L/h. For increased sensitivity and selectivity, the instrument was operated in the selected reaction monitoring (SRM) mode, and two SRM transitions were monitored for each analyte. The SRM-transitions for every analyte are described in Table 1. Matrix-matched calibration plots were constructed for the determination of the AFB1, AFB2, AFG1, and AFG2. ZAN was used as internal standard in the multi-mycotoxin analysis. The limit of detection (LOD) was calculated as three times the standard error of the intercept, divided by the slope of the standard curve; the limit of quantification (LOQ) was computed in a similar way, except for the standard error, which was by a factor of six. The calculated LOD and LOQ were verified by the signal-to-noise ratio (s/n), which was more than 3 and 10, respectively, in accordance with the IUPAC guidelines (IUPAC, 1995).
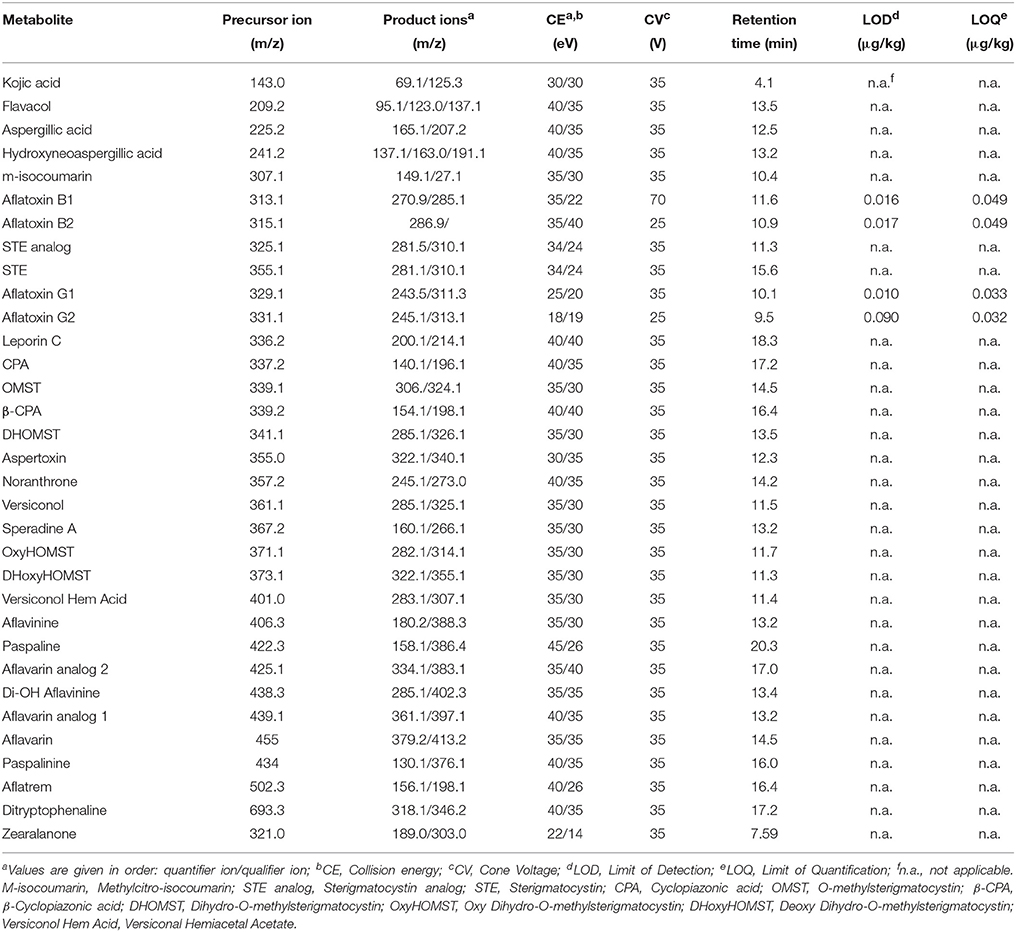
Table 1. Optimized ESI-MS/MS parameters for the confirmation and quantification of analyzed metabolites.
Genotypic Analysis
DNA Extraction
Conidia of the A. flavus isolates grown on PDA for 5 days were inoculated into 250 mL Erlenmeyer flasks containing 100 mL of Wickerham medium (40 g/L glucose, 5 g/L peptone, 3 g/L yeast extract, 3 g/L malt extract). Incubation was carried out at 25°C under shaking conditions (150 rpm) for 2 days. Then, mycelia were harvested by filtration and washed with 0.5 M ethylenediamine tetra-acetic acid (EDTA) & sterile distilled water (dH2O), and freeze-dried at -70°C for DNA extraction. The mycelia were ground into a fine powder using a pestle and mortar. The powder (~100 mg) was transferred into a 2 mL sterile eppendorf tube containing 2 mm diameter glass beads. Then, 650 μL of lysis CTAB (cetyltrimethylammonium bromide) buffer was added and the mixture was ground in a tissue miller at a frequency of 30/s for 3 min after which the samples were incubated at 65°C for 1 h. Proteins were precipitated by adding 600 μL phenol, inverted gently and centrifuged at 14000 rpm for 20 min. The top aqueous layer was pipetted into a new tube. Afterwards, 600 μL phenol/chloroform (25/24, v/v) was added, inverted gently and centrifuged at 14000 rpm for 20 min. This procedure was repeated twice with 600 μL of chloroform. The clean supernatant was transferred to a new 1.5 mL eppendorf tube to which 60 μL 3M sodium acetate (pH 8) & 800 μL isopropanol were added, and incubated overnight at 4°C for precipitation. The samples were centrifuged at 14000 rpm for 10 min at 4°C. The supernatant was discarded, after which the DNA pellet was washed twice with 1 mL 70% ethanol, and centrifuged again at 14000 rpm for 5 min at 4°C. The DNA pellet was dried in an oven with the eppendorf tube lid open at 55°C for 30 min. The pellet was re-suspended in 80 μL low salt TE buffer, and 5 μL of RNase (10 mg/mL) was added to remove any RNA contamination. Depending on the yield 1 μL on the 1% agarose gel was transferred, and stored at −20°C. 50–100 ng of DNA was checked for intactness on 1% agarose. The ratio 260/280 = 1.6–1.8 and 260/230 = 1.8–2.2 obtained showed that the DNA was of food quality, and this was stored at −20°C.
PCR Amplification and Sequencing
PCR analysis of the internal transcribed spacers (ITS1–5.8S-ITS2 cluster) regions of the ribosomal DNA gene cluster, and parts of the B-tubulin and calmodulin genes was done for each isolate using the primer pairs shown in Table 2. PCR amplifications were performed on 25 μL of a reaction mixture containing MgCl2-free reaction buffer, 50 mM MgCl2, 10 mM dNTP mix, 10 μM of each primer, 5 U/μL Taq DNA polymerase and 5 ng/μL of template DNA. The AccuPower® Taq PCR PreMix (Bioneer, Korea) was preferred as the Taq in the premix is not a high fidelity enzyme.
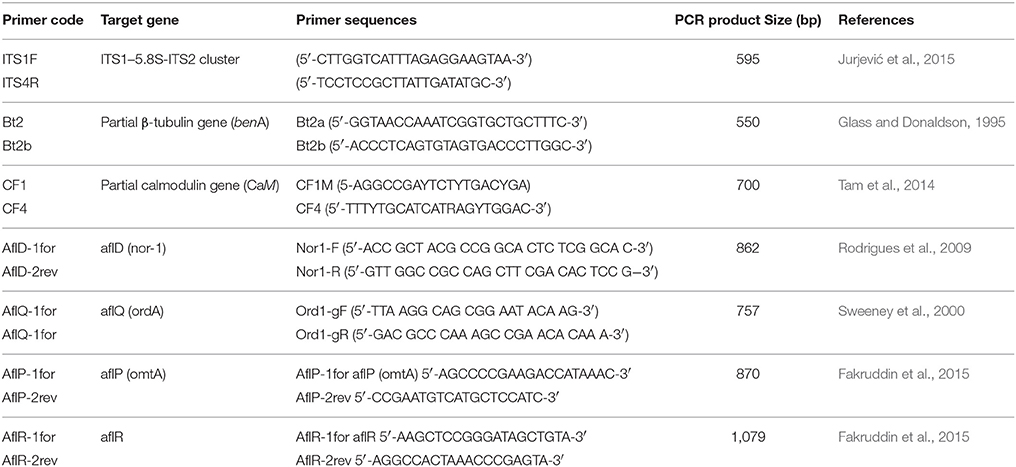
Table 2. Sequences of the nucleotide primers used in the study.
PCR was carried out as follows: (1) one step at 94°C for 3 min; (2) 30 cycles of the following three steps: 1 min at 94°C, 1 min at 57°C, 1 min at 72°C, and (3) one final 10-min step at 72°C. The PCR products were separated by 1.2% agarose gel electrophoresis in a Tris-base, acetic acid and EDTA buffer, and stained with ethidium bromide. PCR product purification was done using QIAquick PCR Purification Kit (Qiagen) and sequencing performed at Inqaba Ltd (Cape Town, Republic of South Africa). The obtained DNA sequences were assembled and edited using CLC Main Workbench 7.7.3 (https://www.qiagenbioinformatics.com/), and then compared with the sequences that are deposited in the GenBank (http://www.ncbi.nlm.nih.gov/). The sequences of each of the three genes were aligned separately with references in the NCBI database, and the SNPs/Indels were observed. Phylogenetic trees were constructed using maximum likelihood with 1000 bootstraps replicates using MEGA v 6. Sequences were deposited at GenBank under accession numbers indicated on Supplementary Tables 1–3.
Detection of Aflatoxin Genes
All A. flavus isolates were tested for the presence of structural genes aflD, aflQ, aflP, and regulatory genes aflR, using some of the primers described by Gallo et al. (2012), listed in Table 2, and optimized in the laboratory conditions. The aflD gene encodes an enzyme that catalyzes the conversion of the first stable aflatoxin biosynthesis intermediate, norsolorinic acid to averantin in both A. flavus and A. parasiticus (Bennett, 1981; Papa, 1982). Both aflP and aflQ are involved in the late steps of the AF pathway. However, aflP is involved in the conversion of sterigmatocystin to O-methylsterigmatocystin (omst) and dihydro-sterigmatocystin (dhst) to dihydro-O-methylsterigmatocystin (dhomst). The aflQ gene is involved in the conversion of O-methylsterigmatocystin (omst) to AFB1 & AFG1, and dihydro-O-methylsterigmatocystin (dhomst) to AFB2 & AFG2 in both A. parasiticus (Cleveland, 1989) and in A. flavus (Yu et al., 1998).
Data Analysis
For statistical evaluation, the R software package (R core Team, 2014) version 2.15.3 was used. To cluster the isolates based on their toxin profile and to cluster the toxins, a hierarchical clustering, based on the simple matching distance, which is a measure for the dissimilarity between binary sample sets, was used. The data are represented as heatmaps, where to color codes indicate the presence (green) or absence of a certain metabolite or toxin. Furthermore, based on the expected and observed co-occurrence of the toxin, pairwise associations were classified as negative, positive or random. To verify whether the clustering of the isolates based on the toxin profile on CYA and YES was similar, correlation analysis was performed applying the Mantel test.
Results
Multi-Analysis of Aspergillus Metabolites
To cluster the isolates based on their toxin profile and to cluster the toxins, a hierarchical clustering, based on the simple matching distance, which is a measure for the dissimilarity between binary sample sets, was used. The data are represented as heatmaps, where color codes indicate the presence (green) or absence of a certain metabolite or toxin. Furthermore, based on the expected and observed co-occurrence of the toxin, pairwise associations were classified as negative, positive or random. In Figure 1 the row dendrogram shows the clustering of the different isolates grown on either CYA or YESA medium. Isolates with a similar toxin profile were grouped together in the dendrogam. The dendrogram shows the associations between metabolites, metabolites with a similar occurrence pattern for the different isolates cluster together. To verify whether there was a correlation between the distances between isolates based on their toxin profile produced on CYA and the distance between isolates based on their toxin profile on YESA, a Mantel test with 1000 permutations was used (Figure 2). This test checks for significant correlations between distance matrices by a permutation procedure. The mantel correlation was 0.31, which was significant at α = 0.05. This means that the clustering of the isolates based on their toxin profile on CYA is correlated with the clustering of the species based on their toxin profile on YESA.
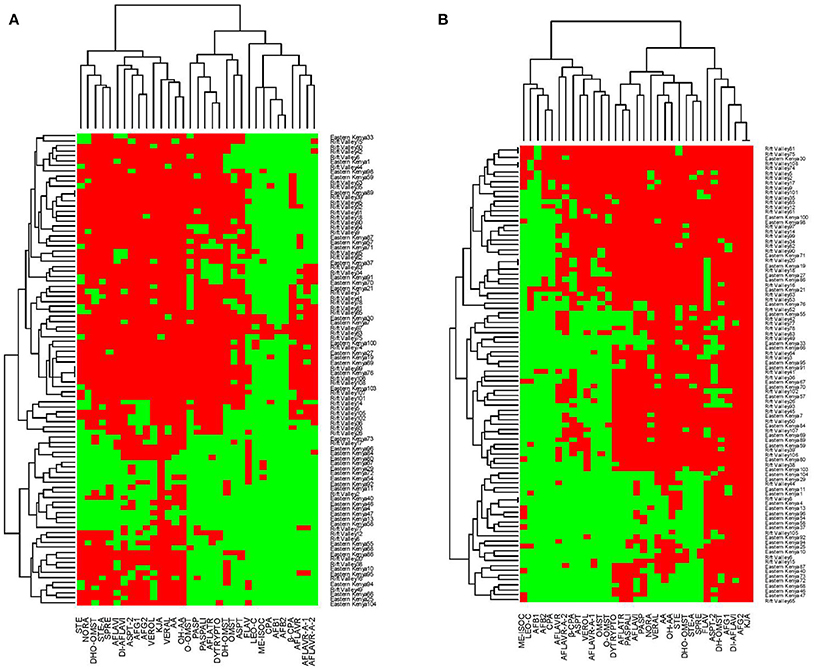
Figure 1. Hierarchical clustering of the isolates and toxins grown on either CYA (A) or YESA (B) medium.
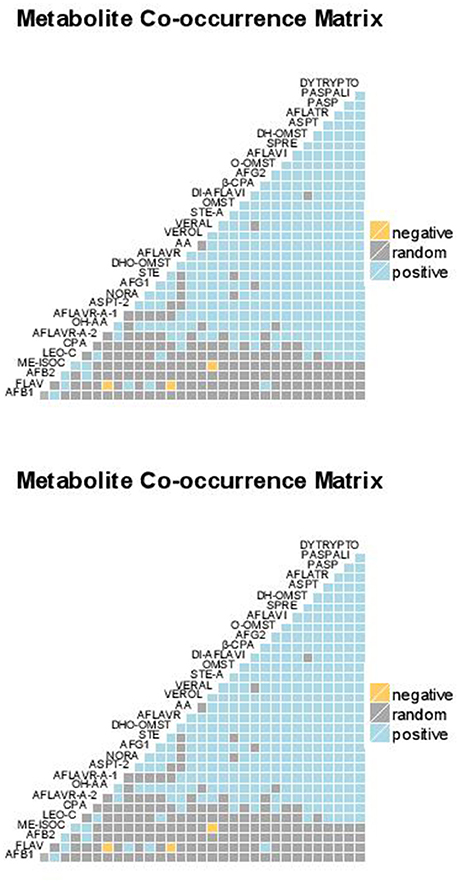
Figure 2. Co-occurrence of the observed metabolites (A CYA and B YESA). A positive association means that in case one metabolite is observed it is very likely that also the other metabolite will be present. A negative association means that in case one metabolite is observed it is very unlikely that also the other metabolite will occur. A random association means that nothing can be said concerning the co-occurrence of both metabolites.
High positive correlations (r > 0.5) were observed between the following mycotoxin-pairs on the CYA-medium: AFB1-AFB2 (0.87); AFB1-STE (0.53); AFB1-CPA (0.67); AFB2-CPA (0.5); AFB1- OxyHOMST (0.69); AFB2- OxyHOMST (0.52); AFB1-β-CPA (0.59); AFB2-β-CPA (0.55); AFB1-aspertoxin (0.66); AFB2-aspertoxin (0.65); AFB1-noranthrone (0.88); AFB2-noranthrone (0.91); AFB1-versiconol (0.86) and AFB2-noranthrone (0.92). For the YESA-medium following positive correlations could be quantified: AFB1-AFB2 (0.88); STE-AFG1 (0.77); AFB1- OxyHOMST (0.52); AFB1-versiconol (0.52); AFB1-noranthrone (0.58) and AFB2- DHOMST (0.77). All the 109 isolates produced both AFB1 and AFB2 on CYA except genotypes 63 (did not produced both toxins) and 97 (produced only AFB1). On YESA, isolates 21, 41, 74, 108, and 109 did not produce aflatoxins while 13 isolates produced only AFB1. The remaining 91 isolates produced both AFB1 and AFB2. For the other metabolites, a great variability was observed in the profiles of the isolates represented by the many subclades in Figure 1.
DNA Analysis of A. flavus Isolates
Identification and Analysis of Polymorphism in A. flavus b-Tubulin Gene
During analysis of the β-tubulin gene, 386 characters were analyzed among which 11 sites were found to be informative with confirmed polymorphism. Isolate 28 and 67 showed heterozygosity at nucleotide position 218 and 344, respectively. Single nucleotide polymorphism (SNP) and indels were observed as shown in Table 3. Most isolates were 100% identical to A. flavus sequences with an exception of isolates 1, 4, 10, 30, 37, 42, 54, 67, and 84, which have 100% identity to A. minisclerotigenes. All these isolates are from Eastern region of Kenya, except for isolate 42 which is non-sclerotia-forming (Rift Valley). The Eastern Kenya isolates are S-strain except for 84, which did not produce any sclerotia. Isolate 90 was 99% identical to A. parasiticus sequences deposited in the NCBI database. The neighbor joining (NJ) tree based on β-tubulin genes sequences indicates that A. flavus with A. parasiticus are closely related forming a clade distinct from A. minisclerotigenes (Figure 3).
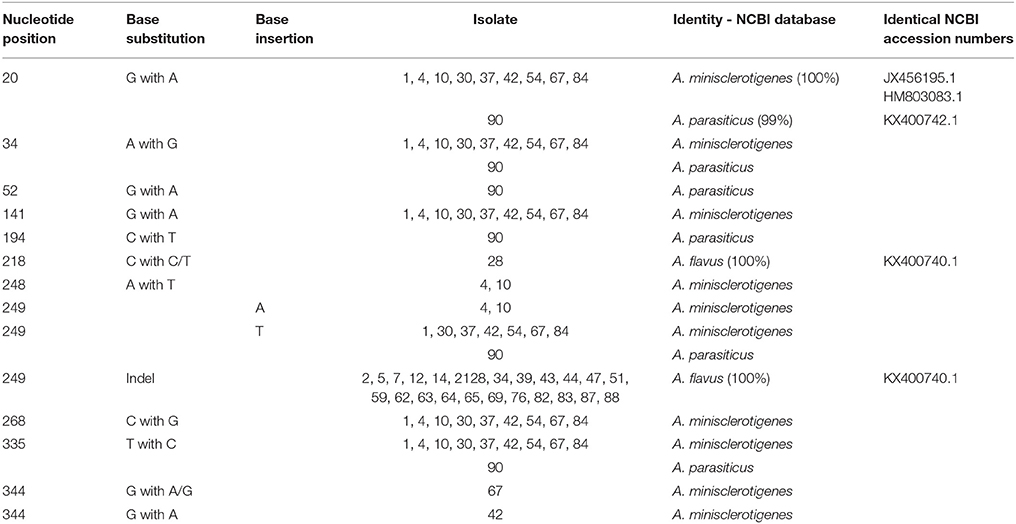
Table 3. Nucleotide deletions and insertions in b-tubulin gene sequences from isolates of Aspergillus sp.
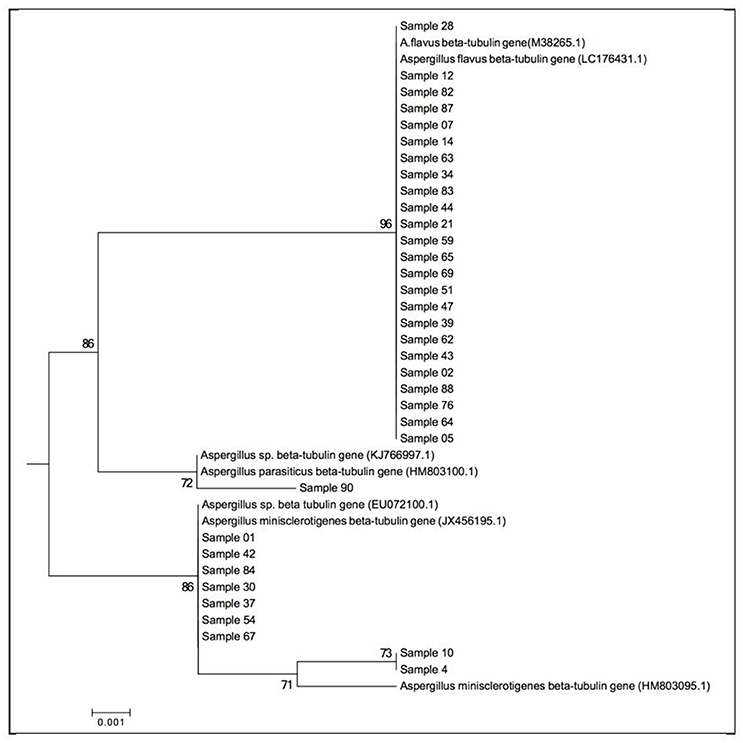
Figure 3. Molecular Phylogenetic analysis of the β-tubulin gene by the Maximum Likelihood method based on the Juke Cantors model (Nei and Kumar, 2000) at 1000 bootstraps. The tree is drawn to scale, with branch lengths measured in the number of substitutions per site. Representative isolates are used. Evolutionary analyses were conducted in MEGA6 (Tamura et al., 2013).
Identification and Analysis of Polymorphism in A. flavus Calmodulin Gene
During the analysis of calmodulin gene sequences, 563 characters were used, 17 of which were informative. Of the three genes used, calmodulin gene had the most SNPs and indels (Table 4). Among the isolates that amplified for this gene, 1, 30 and 37, all from Eastern Kenya, were identified as A. minisclerotigenis in agreement with the results in section Identification and analysis of polymorphism in A.flavus b-tubulin gene above. The remaining isolates were 100% identical to A. flavus sequences in NBCI with exception of isolate 90, which was 100% identical to A. parasiticus sequences in the genebank. Phylogenetic tree-based on calmodulin gene data indicates 2 major clades, namely A. parasiticus—forming one clade while A. flavus and A. minisclerotigenis forming a second clade. Several sub-clades for A. flavus are observed indicating a wide variation among A. flavus species (Figure 4).
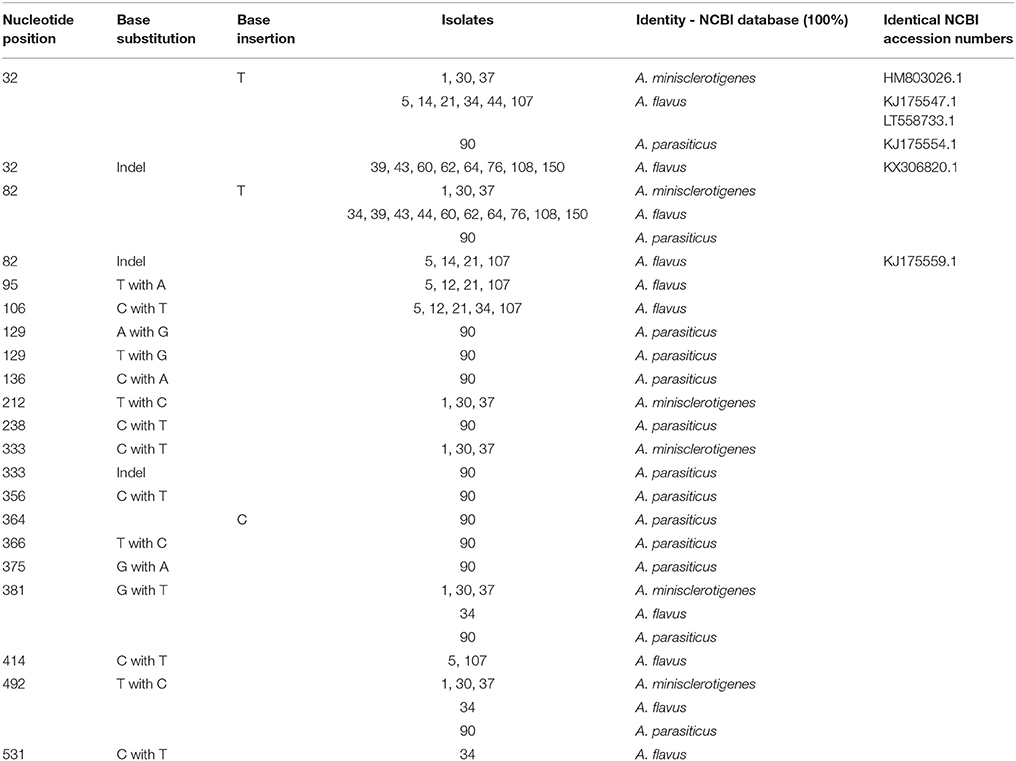
Table 4. Aspergillus sp. isolates showing nucleotide deletions and insertions on calmodulin gene.
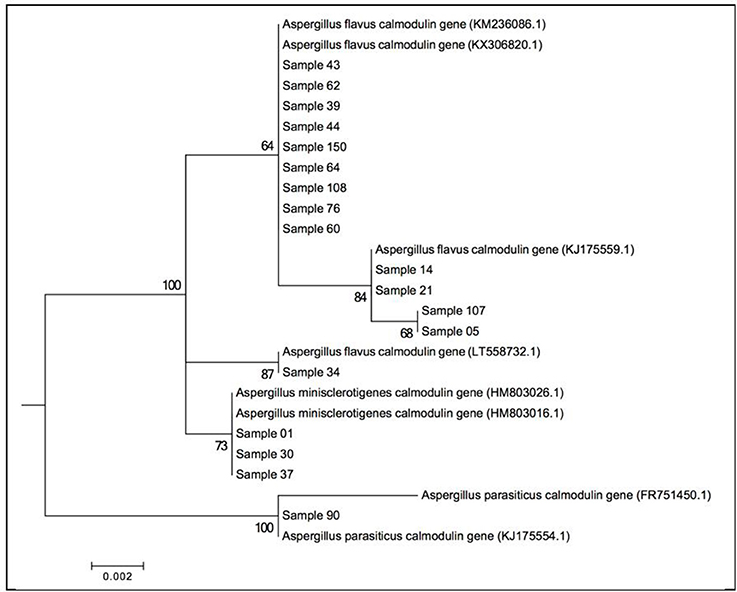
Figure 4. Molecular Phylogenetic analysis of the calmodulin gene by Maximum Likelihood method based on the Kimura 2-parameter model at (Jukes and Cantor, 1969) 1000 bootstraps. The tree is drawn to scale, with branch lengths measured in the number of substitutions per site. Representative isolates are used. Evolutionary analyses were conducted in MEGA6.
Identification and Analysis of Polymorphism in A. flavus ITS Region
Four hundred and sixty characters were used in the analysis of ITS gene sequences. The ITS region was conserved in most regions for these isolates. Five SNPs were observed (Table 5). All isolates were identified as A. flavus with identical similarity (100%), excepted strains 1 and 28 which possessed a heterozygous loci, and matched (99%) to A. flavus. Isolate 90 was 100% identical to A. transmontanensis and A. parasiticus sequences in the NCBI genebank. Phylogenetic analysis of the sequence data of the ITS region shows isolates 1 and 28 formed a clade with a closer relationship with A. parasiticus (Figure 5). Variation exists among A. flavus isolates; those with SNPs (1, 28, 90) are closer in relationship.
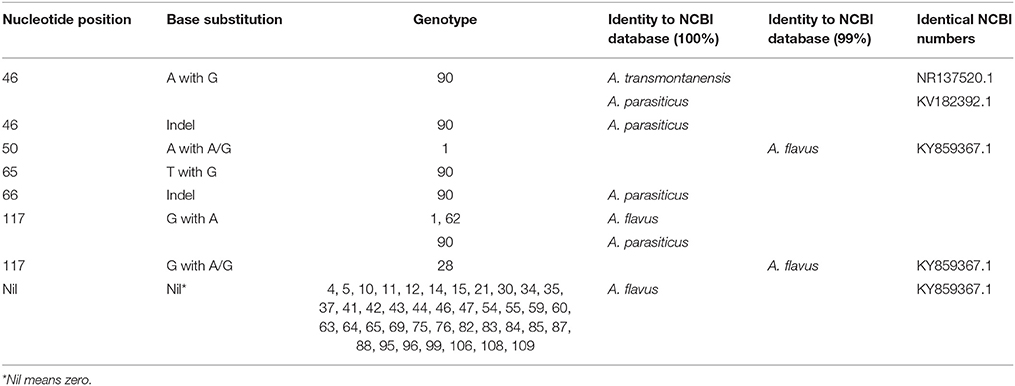
Table 5. Aspergillus flavus isolates showing nucleotide deletions and insertions on ITS region.
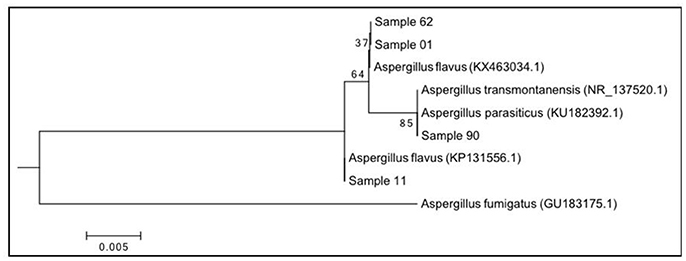
Figure 5. Molecular phylogenetic analysis of the ITS region by Maximum Likelihood method based on the Tamura 3-parameter model at 1000 bootstraps. The tree is drawn to scale, with branch lengths measured in the number of substitutions per site. Representative isolates are used. Evolutionary analyses were conducted in MEGA6.
Aflatoxin Gene Profile
The PCR results placed the isolates into four groups based on their patterns of amplification products: group I (28 strains) characterized by presence of all four amplicons; group II (2 strains) and III (3 strains), showing two (aflD, aflP) and one of the three (aflD, aflP, aflQ) amplicons, respectively; and group IV (51 strains) are characterized by a total absence of PCR products (Table 6). Strains belonging to all groups produced AFB1 and AFB2 on CYA, except for 63 and 97 in Group 1. CYA favored AF production compared with YESA. Only 5 (6%) isolates belonging to Group IV, gave consistent results for the absence of the four AF genes, and proved an inability to produce both AFB1 and AFB2 on YESA. Table 7 shows the isolates and aflatoxin production. Some A.miniscleotigenes isolates produced AFB's only while some A. flavus isolates produced both AFB's and AFG's inconsistent with the conventional chemotypes of the corresponding species.
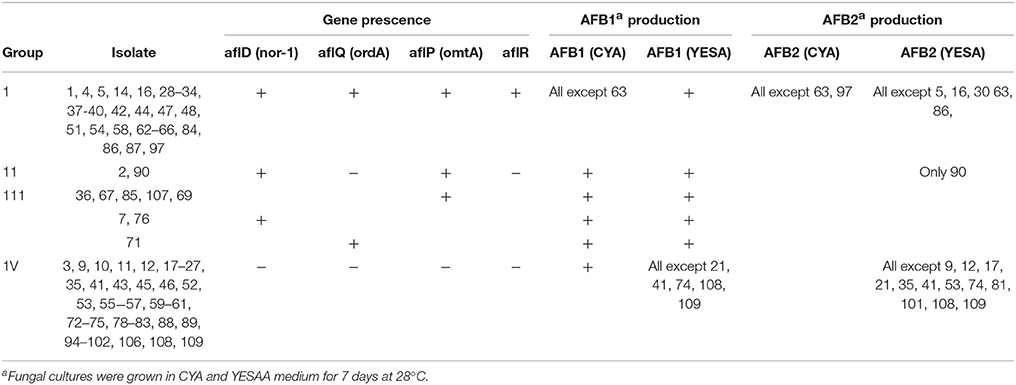
Table 6. Aflatoxigenic gene profile of Aspergillus flavus isolates and aflatoxin production.
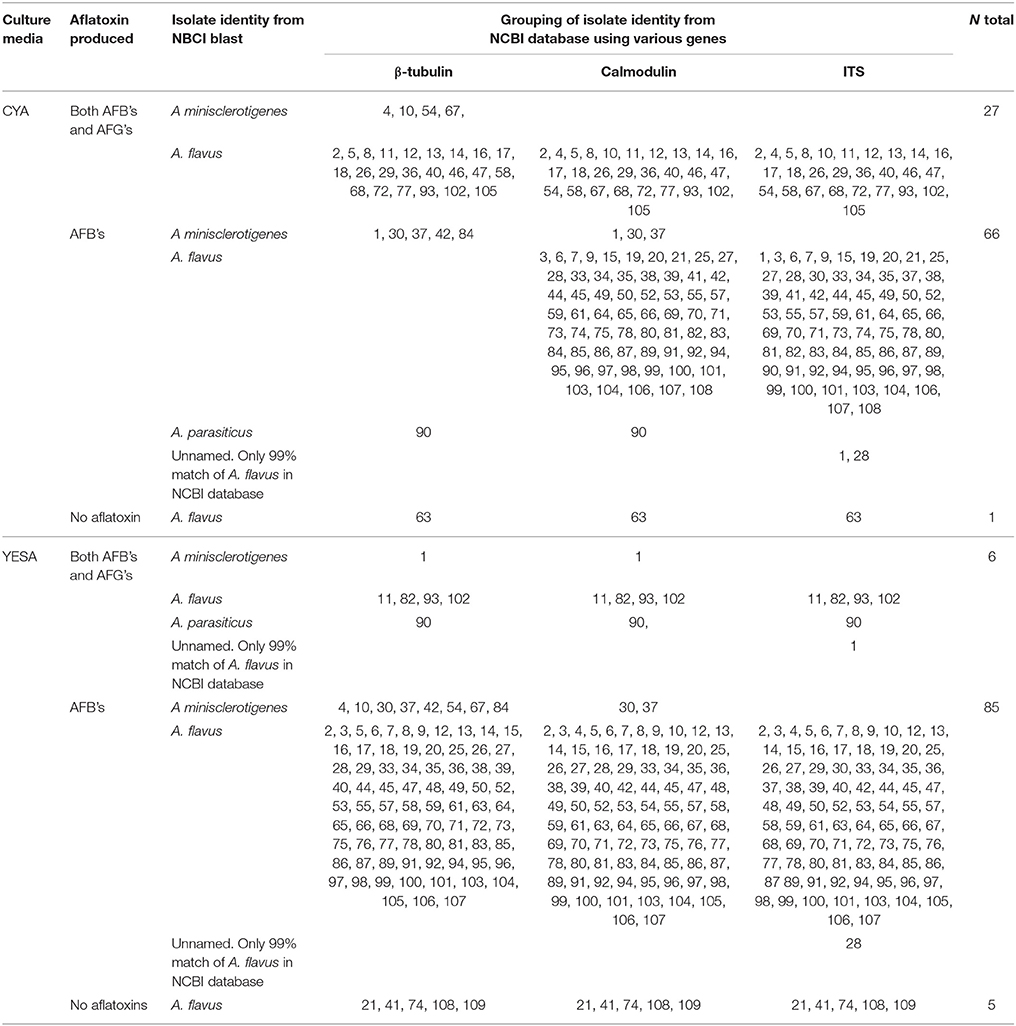
Table 7. Aspergillus isolates identity using three genes and aflatoxin production.
Discussion
Use of molecular markers in this study separates a population initially named as A. flavus using morphological and cultural (AFPA) characteristics into two species, namely A. flavus, A. minisclerotigenes. A. minisclerotigenes was common in Eastern Kenya while only one isolate of the species was identified from the Rift Valley using the β-tubulin gene marker. A. flavus was common in both regions. The single isolate that was close in identity to A. parasiticus was from the Rift Valley. Further, the NJ tree based on β-tubulin gene sequences indicates that A. flavus with A. parasiticus are closely related forming a clade distinct from A. minisclerotigenes. Nyongesa et al. (2015), reported that A. parasiticus was frequently isolated from Rift Valley compared to Eastern Kenya. These results show spatial distribution between A. flavus and A. minisclerotigenes and could suggest different evolutionary origins of the two species. Chang et al. (2009) observed that A. flavus descended from the ancestor of A. parasiticus, while A. minisclerotigenes descended from a different ancestor. Calmodulin gene sequences showed a wider variation among the A. flavus isolates separating few as A. minisclerotigenes compared with β-tubulin gene sequences, and none for ITS gene sequences. Analysis of the ITS region also showed variation among the A. flavus isolates.
The mycotoxin metabolic profile of the Aspergillus strains was highly variable suggesting possible high levels of genetic recombination among members of this species (Taylor et al., 1999). For example, isolate 90, which was identified as A. parasiticus produced CPA, which is not a known characteristic for this species. The same applied to some isolates of A. minisclerotigenes producing only AFB's, while some isolates of A. flavus produced both AFB's and AFG's. A. minisclerotigenes is known to produce both AFB's and AFG's while some isoltes of A. flavus have been classified as producing only AFBs (Pildain et al., 2008) while others produce both (Okoth et al., 2012). Similarly, Olarte et al. (2012) demonstrated high AF heritability, genetic variability and recombination in the AF gene cluster, analogous to spontaneous recombination during sexual reproduction in natural populations.
Knowledge of relative stability of characters among isolates of this species is important in the selection and use of non-toxigenic strains for the biological control of toxigenic ones. Further, A. flavus is an important taxa in food safety and as human pathogen. However, information of the relative phylogenetic distances at which these characters are acquired and lost, is yet to be established.
It was not always possible to distinguish aflatoxigenic species from non-aflatoxigenic species using PCR detection of AF biosynthesis genes, as some of the results were conflicting with the mycotoxin metabolite analysis. Both Gallo et al. (2012) and Levin (2012) reported similar observation and attributed this to inter- and intra-specific genetic mutations within the primers' targeted binding site. Fakruddin et al. (2015) tested 15 isolates of A. flavus for aflatoxigenic genes (aflD, aflM, aflP, aflQ, aflS, aflO, and aflR), and only one isolate possessed all of the 7 genes tested. The remaining isolates varied widely in terms of which genes among the 7 they possessed. The authors explained this to the inability of the primers used to amplify the genes. A few studies have reported a correlation between AF gene expression and AF production using RT-PCR and real time PCR targeting aflD, aflQ, aflO, aflP, aflR, and aflS genes (Sweeney et al., 2000; Jamali et al., 2013; Davari et al., 2015; Fakruddin et al., 2015; Baquiao et al., 2016). Mahmoud (2015) reported a correlation between PCR amplification of four aflatoxin biosynthetic pathway genes (aflD, aflM, aflP, and aflQ) with the AF production capability of A. flavus isolates from stored peanuts in Egypt. The same authors, however, noted that the expression of aflD and aflQ was a good marker for differentiating toxigenic from atoxigenic isolates. Accinelli et al. (2008) and Lourenco et al. (2007) did not find any correlation between profiles of aflatoxigenic A. flavus isolates and AFB1 concentrations in the soil. Jamali et al. (2013) recorded a correlation with AF produced. This study confirms the lack of correlation between the presence of the aflD, aflQ, aflP, aflR genes & AFB1 and AFB2 production, and promotes the usefulness of using both molecular and mycotoxin metabolite profiles in identification of the isolates. Though microbial and immunological methods are considered costly, time-consuming and may produce false-positives and/or false-negative results, a combination of these techniques together with molecular methods yields reliable results. Molecular biology methods combined with morphology and physiology reveal the diversity within the A. flavus species, and the need for further studies to enable identification of varieties. To date, the only clear morphological variation is the size of sclerotia. Small sclerotial A. flavus and A. minisclerotigenes are known to produce large amounts of aflatoxins, and these are most frequent in aflatoxin-hot spot Eastern region of Kenya.
Author Contributions
SO: Conceived and designed the experiments; SO, MD, AV, JD, SL, SD, MK, and JH: Generated data; JN, MD, and SO: Analyzed data; MD, SO, and SD: Wrote the manuscript.
Conflict of Interest Statement
The authors declare that the research was conducted in the absence of any commercial or financial relationships that could be construed as a potential conflict of interest.
Acknowledgments
The project was supported by the National Council for Science and Technology (NACOSTI) and the BecA-ILRI Hub through the Africa Biosciences Challenge Fund (ABCF) program. The ABCF Program is funded by the Australian Department for Foreign Affairs and Trade (DFAT) through the BecA-CSIRO partnership; the Syngenta Foundation for Sustainable Agriculture (SFSA); the Bill & Melinda Gates Foundation (BMGF); the UK Department for International Development (DFID) and; the Swedish International Development Cooperation Agency (SIDA). The authors also acknowledge the Hercules infrastructure funding AUGE/13/13 and the Special Research Fund of Ghent University.
Supplementary Material
The Supplementary Material for this article can be found online at: https://www.frontiersin.org/articles/10.3389/fmicb.2018.00057/full#supplementary-material
References
Accinelli, C., Abbas, H. K., Zablotowicz, R. M., and Wilkinson, J. R. (2008). Aspergillus flavus aflatoxin occurrence and expression of aflatoxin biosynthesis genes in soil. Can. J. Microbiol. 54, 371–379. doi: 10.1139/W08-018
Al-Wadai, A. S., Al-Othman, M. R., Mahmoud, M. A., and Abd El-Aziz, A. R. (2013). Molecular characterization of Aspergillus flavus and aflatoxin contamination of wheat grains from Saudi Arabia. Genet. Mol. Res. 12, 3335–3352. doi: 10.4238/2013.September.3.10
Baquiao, A. C., Rodriges, A. G., Lopes, E. L., Tralamazza, S. M., Zorzete, P., and Correa, B. (2016). Expression of genes by aflatoxigenic and nonaflatoxigenic strains of Aspergillus flavus isolated from brazil Nuts. Foodborne Pathog. Dis.13, 434–440. doi: 10.1089/fpd.2015.2111
Bennett, J. W. (1981). Loss of norsolorinic acid and aflatoxin production by a mutant of Aspergillus parasiticus. J. Gen. Microbiol. 124, 429–432. doi: 10.1099/00221287-124-2-429
Chang, P. K., Ehrlich, K. C., and Hua, S. S. T. (2006). Cladal relatedness among Aspergillus oryzae isolates and Aspergillus flavus S and L morphotype isolates. Int. J. Food Microbiol. 108, 172–177. doi: 10.1016/j.ijfoodmicro.2005.11.008
Chang, P. K., Horn, B. W., and Dorner, J. W. (2005). Sequence breakpoints in the aflatoxin biosynthesis gene cluster and flanking regions in nonaflatoxigenic Aspergillus flavus isolates. Fungal Gene.t Biol. 42, 914–923. doi: 10.1016/j.fgb.2005.07.004
Chang, P. K., Horn, B. W., and Dorner, J. W. (2009). Clustered genes involved in cyclopiazonic acid production are next to the aflatoxin biosynthesis gene cluster in Aspergillus flavus. Fungal Genet. Biol. 46, 176–182. doi: 10.1016/j.fgb.2008.11.002
Cleveland, T. E. (1989). Conversion of dihydro-o-methylsterigmatocystin to aflatoxin-b2 by Aspergillus parasiticus. Arch. Environ. Contam. Toxicol. 18, 429–433. doi: 10.1007/BF01062369
Davari, E., Mohsenzadeh, M., Mohammadi, G., and Rezaeian-Doloei, R. (2015). Characterization of aflatoxigenic Aspergillus flavus and A. parasiticus strain isolates from animal feedstuffs in northeastern Iran. Iran. J. Vet. Res. 16, 150–155.
Ehrlich, K. C., and Brian, M. M. (2014). Comparison of Expression of Secondary Metabolite Biosynthesis Cluster Genes in Aspergillus Flavus, A. Parasiticus, and A. Oryzae. Toxins 6, 1916–1928. doi: 10.3390/toxins6061916
Fakruddin, M., Chowdhury, A., Hossain, M. N., and Ahmed, M. M. (2015). Characterization of aflatoxin producing Aspergillus flavus from food and feed samples. Springerplus 4:159. doi: 10.1186/s40064-015-0947-1
Frisvad, J. C., Larsen, T. O., de Vries, R., Meijer, M., Houbraken, J., Cabañes, F. J., et al. (2007). Secondary metabolite profiling, growth profiles and other tools for species recognition and important Aspergillus mycotoxins. Stud. Mycol. 59, 31–37. doi: 10.3114/sim.2007.59.04
Frisvad, J. C., Skouboe, P., and Samson, R. A. (2005). Taxonomic comparison of three different groups of aflatoxin producers and a new efficient producer of aflatoxin B-1, sterigmatocystin and 3-O-methylsterigmatocystin, Aspergillus rambellii sp nov. Syst. Appl. Microbiol. 28, 442–453. doi: 10.1016/j.syapm.2005.02.012
Gallo, A., Stea, G., Battilani, P., Logrieco, A. F., and Perrone, G. (2012). Molecular characterization of an Aspergillus flavus population isolated from maize during the first outbreak of aflatoxin contamination in Italy. Phytopathol. Mediterr. 51, 198–206. doi: 10.14601/Phytopathol_Mediterr-9461
Geisen, R. (2007). “Molecular detection and monitoring of fungi,” in Food Mycology: a Multifaceted Approach to Fungi and Food, eds J. Dijksterhuis and R. A. Samson (Boca Raton, FL: CRC Press), 255–278.
Geiser, D. M., Dorner, J. W., Horn, B. W., and Taylor, J. W. (2000). The phylogenetics of mycotoxin and sclerotium production in Aspergillus flavus and Aspergillus oryzae. Fungal Genet. Biol. 31, 169–179. doi: 10.1006/fgbi.2000.1215
Geiser, D. M., Frisvad, J. C., and Taylor, J. W. (1998a). Evolutionary relationships in Aspergillus section Fumigata inferred from partial beta-tubulin and hydrophobin DNA sequences. Mycologia 90, 831–845. doi: 10.2307/3761325
Geiser, D. M., Pitt, J. I., and Taylor, J. W. (1998b). Cryptic speciation and recombination in the aflatoxin-producing fungus Aspergillus flavus. Proc. Natl. Acad. Sci. U.S.A. 95, 388–393. doi: 10.1073/pnas.95.1.388
Glass, N. L., and Donaldson, G. C. (1995). Development of primer sets designed for use with the pcr to amplify conserved genes from filamentous ascomycetes. Appl. Environ. Microbiol. 61, 1323–1330.
Gonçalves, S. S., Cano, J. F., Stchigel, A. M., Melo, A. S., Godoy-Martinez, P. C., Correa, B., et al. (2012). Molecular phylogeny and phenotypic variability of clinical and environmental strains of Aspergillus flavus. Fungal Biol. 116, 1146–1155. doi: 10.1016/j.funbio.2012.08.006
Hedayati, M. T., Pasqualotto, A. C., Warn, P. A., Bowyer, P., and Denning, D. W. (2007). Aspergillus flavus: human pathogen, allergen and mycotoxin producer. Microbiol. Sgm. 153, 1677–1692. doi: 10.1099/mic.0.2007/007641-0
International Agency for Research on Cancer (IARC) (2002). IARC SUMMARIES AND EVALUATIONS. Aflatoxins 82:171.
Jamali, M., Karimipour, M., Shams-Ghahfarokhi, M., Amani, A., and Razzaghi-Abyaneh, M. (2013). Expression of aflatoxin genes aflO (omtB) and aflQ (ordA) differentiates levels of aflatoxin production by Aspergillus flavus strains from soils of pistachio orchards. Res. Microbiol. 164, 293–299. doi: 10.1016/j.resmic.2012.12.008
Jukes, T. H., and Cantor, C. R. (1969). “Evolution of protein molecules,” in Mammalian Protein Metabolism, ed H. N. Munro (New York, NY: Academic Press), 21–132.
Jurjević, Z., Kubatova, A., Kolarik, M., and Hubka, V. (2015). Taxonomy of Aspergillus section Petersonii sect. nov encompassing indoor and soil-borne species with predominant tropical distribution. Plant Syst. Evolution. 301, 2441–2462. doi: 10.1007/s00606-015-1248-4
Levin, R. E. (2012). PCR detection of aflatoxin producing fungi and its limitations. Int. J. Food Microbiol. 156, 1–6. doi: 10.1016/j.ijfoodmicro.2012.03.001
Lourenco, A., Durigon, E. L., Zanotto, P., Madeira, J., De Almeida, A. P., and Correa, B. (2007). Genetic diversity of environmental Aspergillus flavus strains in the state of Sao Paulo, Brazil by random amplified polymorphic DNA Memorias Do Instituto Oswaldo Cruz. 102, 687–692. doi: 10.1590/S0074-02762007000600005
Mahmoud, M. A. (2015). Detection of Aspergillus flavus in stored peanuts using real-time PCR and the expression of aflatoxin genes in toxigenic and atoxigenic A. flavus Isolates. Foodborne Pathogens Dis. 12, 289–296. doi: 10.1089/fpd.2014.1854
Mohankumar, M., Vijayasamundeeswari, A., Karthikeyan, M., Mathiyazhagan, S., Paranidharan, V., and Velazhahan, R. (2010). Analysis of molecular variability among isolates of Aspergillus flavus by PCR-RFLP of the ITS regions of rDNA. J. Plant Protect. Res. 50, 446–451. doi: 10.2478/v10045-010-0075-4
Nei, M., and Kumar, S. (2000). Molecular Evolution and Phylogenetics. New York, NY: Oxford University Press.
Nicholson, M. J., Koulman, A., Monahan, B. J., Pritchard, B. L., Payne, G. A., and Scott, B. (2009). Identification of two aflatrem biosynthesis gene loci in Aspergillus flavus and metabolic engineering of Penicillium paxilli to elucidate their function. Appl. Environ. Microbiol. 75, 7469–7481. doi: 10.1128/AEM.02146-08
Nyongesa, B., Okoth, S., and Ayugi, V. (2015). Identification key for aspergillus species isolated from maize and soil of nandi county, Kenya. Adv. Microbiol. 5:10. doi: 10.4236/aim.2015.54020
Okoth, S. (2016). Improving the Evidence Base on Aflatoxin Contamination and Exposure in Africa. CTA Working Paper 16/13, 128.
Okoth, S., Nyongesa, B., Ayugi, V., Kang'ethe, E., Korhonen, H., and Joutsjoki, V. (2012). Toxigenic potential of Aspergillus species occurring on maize kernels from two agro-ecological zones in Kenya. Toxins 4, 991–1007. doi: 10.3390/toxins4110991
Olarte, R. A., Bruce, W. H., Joe, W. D., James, T. M., Rakhi, S., Eric, A. S., et al. (2012). Effect of sexual recombination on population diversity in aflatoxin production by Aspergillus flavus and evidence for cryptic heterokaryosis. Mol. Ecol. 21, 1453–1476. doi: 10.1111/j.1365-294X.2011.05398.x
Papa, K. E. (1982). Norsolorinic acid mutant of Aspergillus flavus. J. Gen. Microbiol. 128, 1345–1348. doi: 10.1099/00221287-128-6-1345
Pildain, M. B., Frisvad, J. C., Vaamonde, G., Cabral, D., Varga, J., and Samson, R. A. (2008). Two novel aflatoxin-producing Aspergillus species from Argentinean peanuts. Int. J. Syst. Evol. Microbiol. 58, 725–735. doi: 10.1099/ijs.0.65123-0
R core Team (2014). R: A Language and Environment for Statistical Computing. Vienna: R Foundation for Statistical Computing.
Rodrigues, P., Venâncio, A., Kozakiewicz, Z., and Lima, N. (2009). A polyphasic approach to the identification of aflatoxigenic and non-aflatoxigenic strains of Aspergillus section Flavi isolated from portuguese almonds. Int. J. Food Microbiol. 129, 187–193. doi: 10.1016/j.ijfoodmicro.2008.11.023
Solorzano, C. D., Abbas, H. K., Zablotowicz, R. M., Chang, P. K., and Jones, W. A. (2014). Genetic variability of Aspergillus flavus isolates from a Mississippi corn field. Sci. World J. 2014:356059. doi: 10.1155/2014/356059
Spanjer, M. C., Rensen, P. M., and Scholten, J. M. (2008). LC-MS/MS multi-method for mycotoxins after single extraction, with validation data for peanut, pistachio, wheat, maize, cornflakes, raisins and figs. Food Addit. Contam. 25, 472–489. doi: 10.1080/02652030701552964
Susca, A., Moretti, A., and Logrieco, A. F. (2017). “Mycotoxin biosynthetic pathways: a window on the evolutionary relationships among toxigenic fungi,” in Modern Tools and Techniques to Understand Microbes, eds A. Varma and A. Sharma (Cham: Springer International Publishing), 135–148.
Sweeney, M. J., Pàmies, P., and Dobson, A. D. W. (2000). The use of reverse transcription-polymerase chain reaction (RT-PCR) for monitoring aflatoxin production in Aspergillus parasiticus 439. Int. J. Food Microbiol. 56, 97–103. doi: 10.1016/S0168-1605(00)00277-4
Tam, E. W., Chen, J. H., Lau, E. C., Ngan, A. H., Fung, K. S., Lee, K. C., et al. (2014). Misidentification of Aspergillus nomius and Aspergillus tamarii as Aspergillus flavus: characterization by internal transcribed spacer, beta-tubulin, and calmodulin gene sequencing, metabolic fingerprinting, and matrix-assisted laser desorption ionization-time of flight mass spectrometry. J. Clin. Microbiol. 52, 1153–1160. doi: 10.1128/JCM.03258-13
Tamura, K., Stecher, G., Peterson, D., Filipski, A., and Kumar, S. (2013). MEGA6: molecular evolutionary genetics analysis version 6.0. Mol. Biol. Evol. 30, 2725–2729. doi: 10.1093/molbev/mst197
Taylor, J. W., Geiser, D. M., Burt, A., and Koufopanou, V. (1999). The evolutionary biology and population genetics underlying fungal strain typing. Clin. Microbiol. Rev. 12:126.
Yu, J. (2012). Current understanding on aflatoxin biosynthesis and future perspective in reducing aflatoxin contamination. Toxins 4, 1024–1057. doi: 10.3390/toxins4111024
Yu, J., Chang, P. K., Ehrlich, K. C., Cary, J. W., Montalbano, B., Dyer, J. M., Cleveland, T. E., et al. (1998). Characterization of the critical amino acids of an Aspergillus parasiticus Cytochrome P-450 Monooxygenase Encoded by ordA That Is Involved in the Biosynthesis of Aflatoxins B1, G1, B2, and G2. Appl. Environ. Microbiol. 64, 4834–4841.
Yu, J., and Ehrlich, K. C. (2011). “Aflatoxin Biosynthetic Pathway and Pathway Genes,” in Aflatoxins - Biochemistry and Molecular Biology ed R. G. Guevara-Gonzalez (Rijeka: InTech), 1–28.
Keywords: Aspergillus flavus, ITS, β-tubulin gene, calmodulin, aflatoxin biosynthesis genes, screening, metabolites, maize
Citation: Okoth S, De Boevre M, Vidal A, Diana Di Mavungu J, Landschoot S, Kyallo M, Njuguna J, Harvey J and De Saeger S (2018) Genetic and Toxigenic Variability within Aspergillus flavus Population Isolated from Maize in Two Diverse Environments in Kenya. Front. Microbiol. 9:57. doi: 10.3389/fmicb.2018.00057
Received: 14 November 2017; Accepted: 10 January 2018;
Published: 26 January 2018.
Edited by:
Mohamed Hijri, Université de Montréal, CanadaReviewed by:
Carol Verheecke, Laboratoire de Génie Chimique, INP-ENSAT, Université Paul Sabatier, FranceBelén Patiño, Complutense University of Madrid, Spain
Copyright © 2018 Okoth, De Boevre, Vidal, Diana Di Mavungu, Landschoot, Kyallo, Njuguna, Harvey and De Saeger. This is an open-access article distributed under the terms of the Creative Commons Attribution License (CC BY). The use, distribution or reproduction in other forums is permitted, provided the original author(s) and the copyright owner are credited and that the original publication in this journal is cited, in accordance with accepted academic practice. No use, distribution or reproduction is permitted which does not comply with these terms.
*Correspondence: Sheila Okoth, dorisokoth@yahoo.com