 Neha Thakre
 Priyanka Fernandes
 Ann-Kristin Mueller
 Frederik Graw
- 1Centre for Modeling and Simulation in the Biosciences, BioQuant-Center, Heidelberg University, Heidelberg, Germany
- 2Parasitology Unit, Centre for Infectious Diseases, University Hospital, Heidelberg, Germany
- 3German Center for Infectious Diseases (DZIF), Heidelberg, Germany
The blood-stage of the Plasmodium parasite is one of the key phases within its life cycle that influences disease progression during a malaria infection. The efficiency of the parasite in infecting red blood cells (RBC) determines parasite load and parasite-induced hemolysis that is responsible for the development of anemia and potentially drives severe disease progression. However, the molecular factors defining the infectivity of Plasmodium parasites have not been completely identified so far. Using the Plasmodium berghei mouse model for malaria, we characterized and compared the blood-stage infection dynamics of PbANKA WT and a mutant parasite strain lacking a novel Plasmodium antigen, PbmaLS_05, that is well conserved in both human and animal Plasmodium parasite strains. Infection of mice with parasites lacking PbmaLS_05 leads to lower parasitemia levels and less severe disease progression in contrast to mice infected with the wildtype PbANKA strain. To specifically determine the effect of deleting PbmaLS_05 on parasite infectivity we developed a mathematical model describing erythropoiesis and malarial infection of RBC. By applying our model to experimental data studying infection dynamics under normal and drug-induced altered erythropoietic conditions, we found that both PbANKA and PbmaLS_05 (-) parasite strains differed in their infectivity potential during the early intra-erythrocytic stage of infection. Parasites lacking PbmaLS_05 showed a decreased ability to infect RBC, and immature reticulocytes in particular that are usually a preferential target of the parasite. These altered infectivity characteristics limit parasite burden and affect disease progression. Our integrative analysis combining mathematical models and experimental data suggests that deletion of PbmaLS_05 affects productive infection of reticulocytes, which makes this antigen a useful target to analyze the actual processes relating RBC preferences to the development of severe disease outcomes in malaria.
Introduction
Malaria caused by the Plasmodium parasite is one of the most serious tropical diseases with a major impact on global health. In 2015, malaria was responsible for 212 million clinical cases and an estimated number of 429,000 deaths worldwide (World Health Organization, 2016).
Within the host, Plasmodium parasites follow a complex life cycle involving parasite replication and differentiation in liver and blood (Portugal et al., 2011). Disease progression is mainly associated with the blood-stage of the parasite, as parasite-induced infection and lysis of red blood cells (RBC) leads to the development of anemia (Dondorp et al., 1999), one of the main symptoms characterizing a malaria infection.
Many Plasmodium parasite strains have been found to differ in their infectivity during the blood-stage infection phase by targeting RBC of different ages (McQueen and McKenzie, 2004). Several parasite species express a preference for immature RBC (reticulocytes) compared to mature RBC (erythrocytes/normocytes). Estimates indicate a 34- to 180-fold higher preference in Plasmodium vivax (Mons et al., 1988; Mons, 1990) and a 1.6- to 14-fold preference in Plasmodium falciparum in humans (Wilson et al., 1977; Pasvol et al., 1980; Clough et al., 1998), with the latter one being responsible for cerebral malaria, a severe neuropathy resulting in death or severe neurological sequelae in survivors (Seydel et al., 2015; Gupta et al., 2017). In rodents, strains of Plasmodium chabaudi show such age-specific targeting of RBC during the acute infection phase (Antia et al., 2008), while Plasmodium berghei (Singer et al., 1955; McNally et al., 1992; Sexton et al., 2004; Cromer et al., 2006, 2009) has an estimated ~150-fold preference for reticulocytes during the late stages of infection (Cromer et al., 2006). It has been suggested that high reticulocyte preference is responsible for the highest parasite densities which in turn induce severe anemia (McQueen and McKenzie, 2004), i.e., with anemia-induced production of novel reticulocytes conversely fueling parasite replication. However, which factors govern and influence the infectivity of parasites and to which extent elevated parasite densities might also influence faster disease progression have not been determined so far (Beeson et al., 2016).
In this context, PbmaLS_05 was identified as a novel Plasmodium antigen that plays an important role in the development of experimental cerebral malaria (ECM) (Fernandes et al., submitted manuscript), a neuropathology that is characteristically similar to human cerebral malaria (de Souza et al., 2010; Hoffmann et al., 2016). The gene is well conserved in human and rodent Plasmodium strains and as it is expressed during both late intra-hepatic and intra-erythrocytic stages of the parasite, this cross-stage antigen represents a potential vaccine target. The protein localizes to the apicoplast organelle—an endosymbiotic relict of the parasite that is important for intra-erythrocytic survival. Deletion of PbmaLS_05 was suggested to influence parasite replication or viability in the blood (Fernandes et al., submitted manuscript), but the effects on infectivity and potential cell preferences are not known.
Determining a parasite's infectivity potential during the intra-erythrocytic stage requires the disentangling of parasite replication dynamics and infection-induced changes to erythropoiesis. Mathematical modeling has been an essential tool to analyze these processes. In addition to detecting target cell preferences and differences in infection profiles of various pathogens, mathematical models allow us to specifically account for the processes of erythropoiesis, parasite infection and turnover, as well as disease-induced anemia (McQueen and McKenzie, 2004; Cromer et al., 2006, 2009; Antia et al., 2008; Fonseca and Voit, 2015). There have been various modeling approaches describing the blood-stage infection dynamics of different Plasmodium parasite strains in various levels of detail (Antia et al., 2008; Mideo et al., 2008; Cromer et al., 2009; Li et al., 2011).
In this study, we used a combination of different experimental protocols and mathematical models to investigate parasite blood-stage infection dynamics under physiological and drug-induced altered erythropoietic conditions to elucidate the effects of deletion of PbmaLS_05 (KO) on parasite infectivity. We concentrated on the acute phase of infection, analyzing the first 4 days after infection with parasitized RBC until the time when mice infected by the PbANKA (WT) strain showed first signs of ECM. Our age-structured model explicitly accounts for RBC development and erythropoiesis and is thereby able to determine possible target cell preferences for both parasite strains. Our results indicate dynamic malaria-induced changes to erythropoiesis during disease progression and suggest that deletion of PbmaLS_05 has an effect on the productive infection of reticulocytes.
Materials and Methods
Ethics Statement
All animal experiments were performed according to European regulations concerning FELASA category B and GV-SOLAS standard guidelines. Animal experiments were approved by German authorities (Regierungspräsidium Karlsruhe, Germany), § 8 Abs. 1 Tierschutzgesetz (TierSchG) under the license G-260/12 and were performed according to National and European regulations. For all experiments, female C57BL/6 mice (6- to 8-week-old) were purchased from Janvier laboratories, France. All mice were kept under specified pathogen-free (SPF) conditions within the animal facility at Heidelberg University (IBF).
Experimental Protocol and Data
In the first set of experiments, C57BL/6 mice were intravenously infected with 106 infected red blood cells (iRBC) taken from mice infected either with wild-type PbGFP Luccon (P. berghei line 676m1c11) (WT), a GFP-luciferase transgenic derivative of P. berghei ANKA (Franke-Fayard et al., 2005), or the mutant PbmaLS_05 (–) parasites (KO) generated in the wild-type PbGFP Luccon strain (Fernandes et al., submitted manuscript). An additional group of age-matched mice was left uninfected and treated as naïve controls. Daily blood samples of 10 μl were taken from all mice from the day of infection until day 4 post infection (p.i.). The total red blood cell count and reticulocyte percentage were measured using a Coulter counter and FACS analysis of CD71 (CD71-PE, eBioscience, Clone R17217) labeled reticulocytes, respectively. Parasitemia was determined by FACS analysis of GFP positive infected red blood cells. A sketch of the experimental protocol is shown in Figure 1A. Mice were sacrificed at day 5 p.i., when mice infected with WT parasites showed first symptoms of ECM.
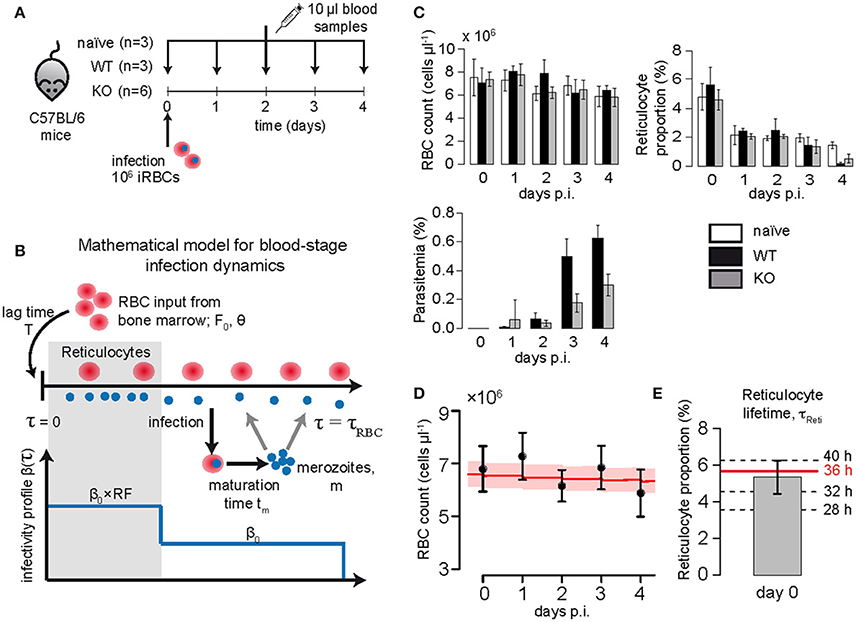
Figure 1. (A) Experimental protocol: C57BL/6 mice were infected with 106 iRBC of PbANKA (WT), PbmaLS_05 (-) (KO) or left uninfected. Daily samples of 10 μl blood were drawn to measure the concentration of RBC (cells/μl), reticulocyte proportion and parasitemia (in % of RBC). (B) Sketch of the mathematical model describing erythropoiesis and blood-stage infection dynamics of the parasite. For a detailed description of the model see section Materials and Methods. (C) Measured concentration of RBC (cells/μl), reticulocyte proportion (in % of RBC) and parasitemia (in % of RBC) for each of the different groups analyzed. (D) The plot shows the measured concentration of red blood cells for naïve mice (mean + SD, n = 3), as well as the dynamics predicted by our model (best fit-red solid line, 95%-confidence interval- shaded area) using parameter estimates for RBC turnover and reticulocyte production as given in Table 1. (E) Based on model predictions and the measured proportion of reticulocytes on day 0, we consider a maturation time for reticulocytes of τReti = 36 h.
A second set of mice were pretreated with two doses of phenylhydrazine (PHZ, 40 mg/kg), on two consecutive days prior to infection with 106 iRBC using the same groups of mice as before. Again, daily blood samples of 10 μl were taken from each mouse and analyzed up to day 5 p.i. before sacrificing the mice on day 6 p.i.
Mathematical Model for Erythropoiesis and Blood-Stage Infection Dynamics
To describe the blood stage-infection dynamics of the murine malaria parasite accounting for RBC age, we used a mathematical model for erythropoiesis as described before (Mackey, 1997). The age-structured model follows the population density of RBCs of age τ at time t based on a system of coupled ordinary differential equations that breaks the age ranges of RBC into n = τRBC/h different compartments with h being the compartment size and τRBC the maximal lifespan of RBCs. The concentration of RBCs within each compartment is denoted by xi(t), i = 1,… n. New RBCs are constantly produced by the bone marrow that enter the population of RBCs after a delay T, with the actual influx at each time point determined by a Hill-function dependent on the maximal production rate of RBCs in the bone marrow, F0, and the concentration of RBCs at time t-T, X(t-T). Mathematically, the model is then described by the following system of ordinary differential equations:
Hereby, the parameter θ describes the concentration of RBC where the production rate is half of the maximum and k the Hill-coefficient (Mackey, 1997). In addition, we also assumed that in each compartment xi RBCs are lost by an age-independent loss-rate 1/τRBC to have at least 85% of RBC lost until their assumed maximal lifespan τRBC. Equations (1–3) represent a mean-field approximation of the originally developed system relying on partial differential equations, thereby transforming assumed fixed, constant lifespans of RBC into gamma-distributed lifetimes (Mackey, 1997; Antia et al., 2008).
This basic model for erythropoiesis is then extended to account for malaria blood-stage infection as done previously (McQueen and McKenzie, 2004; Antia et al., 2008; Figure 1B). Uninfected RBCs can get infected by free merozoites, z, at a rate β(τ), which is dependent on the age-preference of the infecting parasite strain. Each infected RBC releases a number of merozoites, m, by bursting after having reached an infection maturation time, tm. In addition, free merozoites are assumed to have an average lifetime of 1/dm. As for uninfected RBC, the concentration of infected cells, Y(t), is broken down into g = tm/h different age compartments, yi(t), i = 1,…,g leading to a system of coupled ordinary differential equations with a gamma-distributed maturation time with mean tm. The basic model for erythropoiesis (Equations 1–3) is then extended to:
Hereby, z(t) describes the concentration of merozoites at time t and RF the so called reticulocyte factor, i.e., the fold-change in infectivity of the parasite for reticulocytes compared to the general infection rate assumed for normocytes, β0 (see Cromer et al., 2006). The parameter τReti defines the maturation time of reticulocytes into normocytes.
Calculating the Average Infectivity and Reticulocyte Preference
In order to compare parasite strains with possible different values for the infection rate, β0, and the reticulocyte factor RF, we calculated an average infectivity β, which is defined as the infection rate of a single merozoite when placed into the erythropoietic system at the initiation of infection. In a naïve mouse, on average 5.8% of the RBC are reticulocytes, thus the average infectivity is calculated by β = β0(0.058RF + 0.942).
Besides the reticulocyte factor, RF, the reticulocyte preference, RP, is calculated based on the ratio between the percentage of infected reticulocytes (relative to all reticulocytes) and the percentage of infected normocytes (relative to all normocytes). Thus, if R and IR define the concentration of reticulocytes and infected reticulocytes, respectively, and N and IN the corresponding concentrations for normocytes, the reticulocyte preference is calculated by RP = (IR/R)/(IN/N). In contrast to the reticulocyte factor, the reticulocyte preference can be directly calculated from experimental measurements.
Modeling the Effect of Phenylhydrazine Treatment on Erythropoiesis
Treatment with Phenylhydrazine (PHZ) is used for experimental induction of anemia in animal models to study hemolytic anemia or anemia caused by destruction or removal of RBCs from the bloodstream (Berger, 2007). Previous studies developed mathematical models to determine and quantify the effect of PHZ on the RBC age distribution and altered erythropoiesis (Savill et al., 2009). However, these models were inadequate to describe our experimental data suggesting that they incompletely addressed the effects of PHZ. To this end, we tested several different known hypotheses for the effect of PHZ on erythropoiesis (Jain and Hochstein, 1980; Berger, 2007; Savill et al., 2009; Moreau et al., 2012) by fitting them to the data of the PHZ-control group (see Supplementary Material Text S3). The models best explaining the experimental data included the following drug effects: (i) Treatment by PHZ leads to instantaneous lyses of a fraction ρ(τ) of RBCs at the time of treatment, tp. Hereby, the effect of lysis depends on the age of the RBC, τ, with normocytes being more strongly affected than reticulocytes (Jain and Hochstein, 1980). (ii) An additional influx of reticulocytes from extra medullary sites is considered at a constant rate Np with a time-delay Tp after the initiation of treatment to account for stress-induced erythropoiesis. Under severe anemia, such as that induced by PHZ-treatment, extra-medullary sites of erythropoiesis such as the spleen and liver are observed to show an increased contribution of RBCs to circulation (Spivak et al., 1973; Ploemacher et al., 1977; Kim, 2010). Thus, under PHZ-treatment, Equations (1, 2) describing RBC turnover are changed as follows:
Hereby, ρ0 defines the fraction of normocytes lysed by PHZ and γ represents the relative comparison of this fraction for reticulocytes. In addition, I(t = Tp) defines the Indicator function, i.e., with I(t = Tp) = 1 if t = Tp and 0 otherwise. A sketch of the effects of PHZ treatment on erythropoiesis is shown in Figure 4A. A detailed derivation of the model can be found in the Supplementary Material. During infection, we assume that malaria induced changes to RBC production affects both sources of novel reticulocytes, i.e., bone marrow and extra medullary sites alike.
Model Evaluation and Fitting Procedures
The mathematical models described above were implemented and analyzed using the R language of statistical computing (R Development Core Team, 2017). As indicated, the age of uninfected and infected RBC was compartmentalized leading to a tractable system of coupled ordinary differential equations with gamma-distributed lifetimes and maturation times for RBC and infected cells, respectively (Antia et al., 2008). In the following we used a compartment size of 4 h.
The differential equations were solved using the deSolve package and models were fitted to the experimental data using the optim-fitting routine in R. In cases where a strong correlation between parameters hindered convergence of fitting algorithms, a parameter sweep was performed to find combinations of parameters that fit the data. Proportion data (parasitemia levels and proportion of reticulocytes) were logit- transformed to allow for normally distributed residuals. Model performance was assessed based on simultaneous fitting for all obtained measurements including RBC concentration, reticulocyte proportion and, where applicable, parasitemia. Blood stage infection dynamics of parasites were determined in a stepwise approach: Parameters describing erythropoiesis were fixed to the indicated values obtained from the naïve control group before analyzing infection dynamics (Table 1). Therefore, measurements for the infection groups, i.e., reticulocyte proportion and RBC count, were scaled relative to the naïve group data when estimating parasite infectivity. To evaluate model performance, the average residual sum of squares (aRSS) was used which is the residual sum of squares divided by the number of data points.
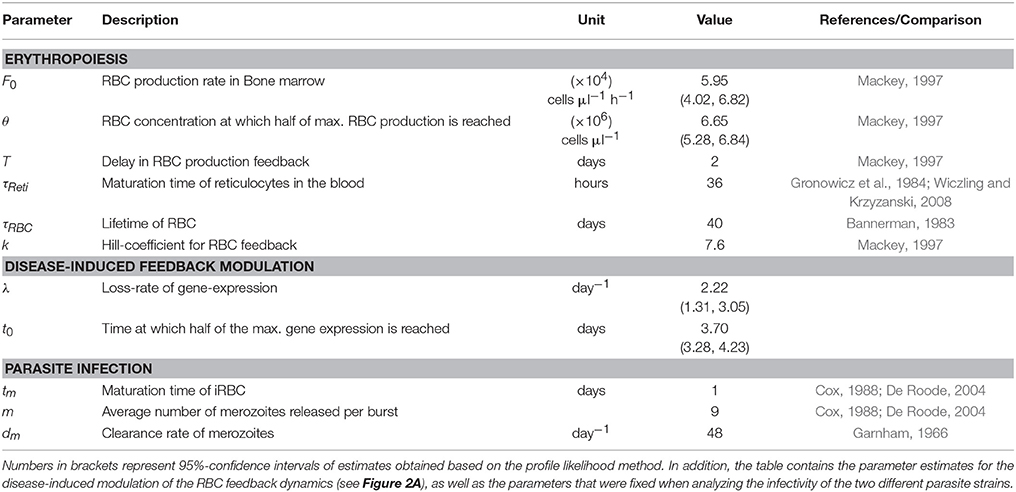
Table 1. Estimated parameter values describing erythropoiesis in mice based on the model as described in Equations (1–3) in section Materials and Methods.
The 95%-confidence intervals, as well as identifiability of parameter estimates were assessed by profile likelihood analysis (Raue et al., 2009). For the measured data, we report mean and standard error.
Results
Characterizing the Dynamics of Erythropoiesis and Determining Reticulocyte Maturation Times in the Blood
To determine the dynamics of erythropoiesis in our experimental system, we fitted a mathematical model describing RBC production and subsequent aging (see Equations 1–3 in Materials and Methods; Mary et al., 1980; Mackey, 1997) to the observed progression of RBC concentration in uninfected mice that were sampled daily for 10 μl of blood (see Materials and Methods and Figures 1A–C). In general, bleeding leads to a decrease in the RBC concentration triggering the production of novel RBCs in the bone marrow that will enter the blood circulation after a time delay T. Thereby, the magnitude of the feedback depends on the severity of the anemia, i.e., the larger the loss of blood the larger the subsequent RBC production, which is accounted for in our model by a Hill-type function (Mackey, 1997). Assuming a maximal lifespan for RBC of τRBC = 40 days (Bannerman, 1983) and a Hill-coefficient of k = 7.6 (Mackey, 1997), we estimated a maximal RBC production rate in the bone marrow of F0 = 5.95 × 10⁴ cells μl−1 h−1 [4.02, 6.82] with half of the maximal production rate reached at a RBC concentration of θ = 6.65 × 10⁶ cells μl−1[5.28, 6.84], which is approximately 95% of the RBC concentration at steady state. Newly produced red blood cells are estimated to appear in the circulation after a lag-time of T = 2 days, testing different possible lag-times including T = 0, 1, 2, and 2.5 days. All our estimates are in agreement to parameters that have been determined previously for erythropoiesis in mice (Mary et al., 1980; Mackey, 1997; Figure 1D and Table 1).
As we were especially interested in the dynamics of reticulocytes, i.e., immature red blood cells, we compared model predictions for the proportion of different RBC age classes to the measured proportion of reticulocytes in order to determine the time these cells spend in the blood. We found that a maturation time for reticulocytes into normocytes in the blood of τReti = 36 h best described our measured proportion of reticulocytes (Figure 1E), which is in agreement to previous calculations determining a maturation time for reticulocytes between 1 and 3 days (Ganzoni et al., 1969; Gronowicz et al., 1984; Wiczling and Krzyzanski, 2008). Thus, for the following analyses we assume that after appearance in the blood, a reticulocyte will take on average 1.5 days to develop into a normocyte.
Parasite-Induced Cell Death Cannot Explain the Observed Loss in Reticulocyte Proportion
In order to compare the blood-stage infection dynamics of the two Plasmodium berghei strains investigated, mice were either infected with PbANKA (WT) or PbmaLS_05 (-) (KO) infected red blood cells and sampled daily for 10 μl of blood. For both strains, we observe a substantial loss in the proportion of reticulocytes around day 3 post infection (p.i.) coinciding with an increase in parasitemia (Figure 1C). At day 4 p.i., when mice infected with WT show first signs of ECM, the parasitemia was approximately twice as high as the one measured for mice infected with the KO (0.63 ±0.05% WT compared to 0.29 ±0.03% KO) (Figure 1C).
To determine systematic differences in the infection dynamics between the two parasite strains, we extended our mathematical model describing erythropoiesis to include malaria blood-stage infection dynamics (see Equations 4–9). Hereby, RBCs get infected by merozoites at an infection rate β and infected RBC (iRBC) will release new merozoites m after a certain maturation time tm (see Figure 1B and Materials and Methods for a detailed explanation of the extended model). Assuming the average lifespan of a merozoite of 1/dm = 30 min (Garnham, 1966), a maturation time of an iRBC of tm = 24 h (Cox, 1988; De Roode, 2004) and that an infected RBC releases on average m = 9 merozoites after bursting (Cox, 1988; De Roode, 2004; Reilly et al., 2007) we find that the observed loss in the proportion of reticulocytes around day 3 p.i. cannot be explained by the increased parasitemia when using the standard parameterization for erythropoiesis (Table 1). This observation is independent of the assumed infectivity of the parasite strain (Supplementary Figure S1) and is also the case if we assume that the infectivity for reticulocytes is substantially higher than for normocytes. This indicates that the reason for the observed decrease in reticulocyte proportion is not mainly due to reticulocytes being parasitized.
It is known that malarial-induced anemia causes erythropoietic suppression, starting during the early stages of infection (Villeval et al., 1990; Sexton et al., 2004; Thawani et al., 2014). By analyzing the expression levels of previously studied genes (Sexton et al., 2004), we found that the fold change in the expression of the genes most strongly associated with erythropoiesis, i.e., α-globin, β-globin major and β-1-globin, can be described by a logistic-loss function given by
where λ defines the loss-rate of gene-expression, i.e., the loss of RBC production and t0 the time point at which half of the maximal gene expression is reached. We estimate λ = 2.22 d−1 (95%-CI [1.31, 3.05]) and t0 = 3.70 d [3.28, 4.23] (Figure 2A, Table 1). This parameterization is then used to account for malaria-induced modulation of RBC production during the analyses of blood stage infection dynamics in WT and KO infected mice.
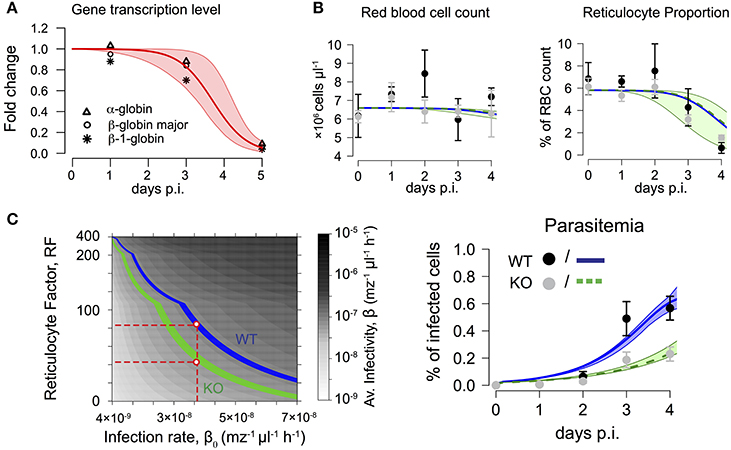
Figure 2. (A) Fold change in expression levels of genes associated with erythropoiesis during malaria infection. Symbols represent gene-expression levels of α-globin (Δ), β-globin major (°) and β−1-globin (*) as measured in Sexton et al. (2004). Dynamics can be described by a logistic-loss function with F(t) = (1-exp(-λt0))/(1+exp(-λ(t-t0))) (see main text). Red solid line indicates best fit with λ = 2.22 d−1 and t0 = 3.70 days based on 104 bootstrap replicates simulated from the distribution given by the gene expression levels at each time point (shaded area – 95% confidence interval). (B) Dynamics of red blood cell concentration, reticulocyte proportion and parasitemia for mice infected by either WT, n = 3 or KO, n = 6. The mean and standard deviation for each group (WT- black, KO- gray) are shown. Model results simultaneously predicting the dynamics of all 3 measurements indicate a lower average infectivity for the WT (blue line) compared to KO (green line). Shaded areas indicate 95%-confidence intervals. Corresponding parameter estimates are shown in Table 2. (C) Obtained parameter combinations for reticulocyte factor RF and infection rate β0 indicate a lower average infectivity β per merozoite per hour for the KO parasite compared to the WT. KO parasites have lower reticulocyte factors than the WT if similar infection rates β0 for both parasites are assumed (red dashed lines).
PbmaLS_05 (–) Merozoites Express a Reduced Infectivity Compared to PbANKA WT
To analyze the infectivity of both parasite strains, we fitted our extended mathematical model (Equations 4–9 with Equation 14) to the experimental data on RBC count, reticulocyte proportion and parasitemia. Additionally accounting for a modulation of RBC production due to infection (i.e., replacing F0 by F0F(t) with λ = 2.22 d−1 and t0 = 3.70 d in Equation 3) improves model predictions, especially regarding the substantial loss in the proportion of reticulocytes starting 3 days p.i. (compare Figure 2B and Supplementary Figure S1A).
By estimating the infectivity for each parasite strain characterized by the rate of infection (β0) and the reticulocyte factor (RF), our analysis indicates that the WT parasites have a higher preference for infecting reticulocytes than normocytes (Figure 2B and Table 2). During this early infection phase, we estimate a more than 22-fold higher infectivity for reticulocytes than for normocytes i.e., RF > 22 (Table 2). In contrast, a similar preference for reticulocytes could not be found explicitly for the KO parasite. Here, a model assuming equal infectivities for reticulocytes and normocytes, i.e., RF = 1, performs equally well as a model that assumes a reticulocyte preference (AIC 40.7 vs. AIC 42.7). However, our time courses are too short to clearly identify such a reticulocyte preference for both parasite strains. As a high infection rate β0 can be compensated by a small value of RF and vice versa, several combinations of β0 and RF can explain the observed dynamics (Supplementary Figure S2).
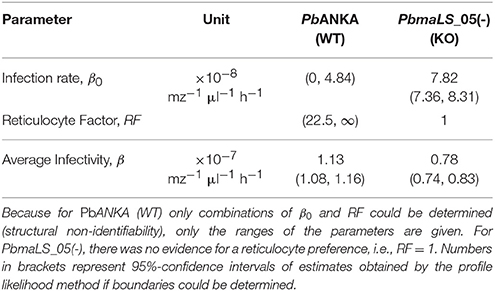
Table 2. Parameter estimates for parasite infectivity comparing PbANKA (WT) and PbmaLS_05(-) (KO).
To compare the infectivity of WT and KO parasites, we calculated an average infectivity β based on the estimates of β0 and RF, which is defined as the infection rate of a single merozoite when placed into the erythropoietic system at the start of infection (see Materials and Methods for a detailed calculation). We find that KO parasites have a reduced average infectivity compared to WT parasites leading to less productive infections (β = 1.13 × 10⁻⁷ mz−1μl−1 h−1 [1.08, 1.16] for WT vs. β = 0.78 × 10⁻⁷ mz−1μl−1 h−1 [0.74, 0.83] for KO, numbers in brackets represent 95%-confidence intervals; Table 2). This reduced average infectivity can explain the slower increase in the parasitemia observed for the KO strain (Figure 2B).
If we assume that the infection rate β0 does not differ between the two parasite strains, we find a consistently lower reticulocyte factor for the KO compared to the WT (Figure 2C and Supplementary Figure S2). Thus, our analysis indicates that KO parasites might have a particularly impaired ability to productively infect reticulocytes in comparison to the WT during the early erythrocytic stage of infection.
Parasite Infection Dynamics under Altered Erythropoietic Conditions
To elicit possible differences in reticulocyte preferences between the two parasite strains we pre-treated mice with the drug Phenylhydrazine (PHZ) before infecting them with either WT or KO parasites (Figure 3A). PHZ artificially induces anemia in mice causing peroxidation of RBC lipids leading to hemolysis and a change in RBC age distributions (Savill et al., 2009). In uninfected mice that were pre-treated with two doses of 40 mg/kg of PHZ on two consecutive days, we observe a substantial loss in the concentration of red blood cells to roughly ~1/3 of the concentration under homeostatic conditions 2 days after the last treatment with PHZ (2.5 × 10⁶ cells/μl vs. 7.6 × 10⁶ cells/μl, mean values; Figure 3B). There was a corresponding increase in the proportion of reticulocytes to up to 50% of the total RBC count at 5–6 days after the last treatment with PHZ (Figure 3B). Changes in RBC count and reticulocyte proportion of WT or KO infected mice that were pre-treated with PHZ are visible on day 5 p.i. with RBC counts reaching 4.0 ± 0.32 and 3.6 ± 0.15 × 10⁶ cells/μl for WT and KO, respectively, compared to 6.0 ± 0.29 × 10⁶ cells/μl in uninfected animals (Figure 3C). In addition, the proportion of reticulocytes in infected animals is substantially reduced compared to naïve mice; with KO infected mice still having ~3-fold higher levels than WT infected mice [42.6 ± 2.6% (naïve), 4.8 ± 1.2% (WT), 15.6 ± 1.0% (KO); Figures 3B,C]. While parasitemia levels are comparable between both infection groups (22.5 ± 1.2% vs. 21.0 ± 2.0%), the percentage of infected reticulocytes is slightly higher for WT compared to KO (24.3 ± 4.6% vs. 16.3 ± 0.8%; Figure 3C). Given these measurements, the average reticulocyte preference RP, calculated by the proportion of infected reticulocytes among reticulocytes divided by the proportion of infected normocytes among normocytes, is determined by RPWT = 1.46 and RPKO = 0.76, respectively. In accordance with our previous results (Figure 2C), these observations suggest that deletion of PbmaLS_05 has a potential effect on the parasite's ability to productively infect reticulocytes.
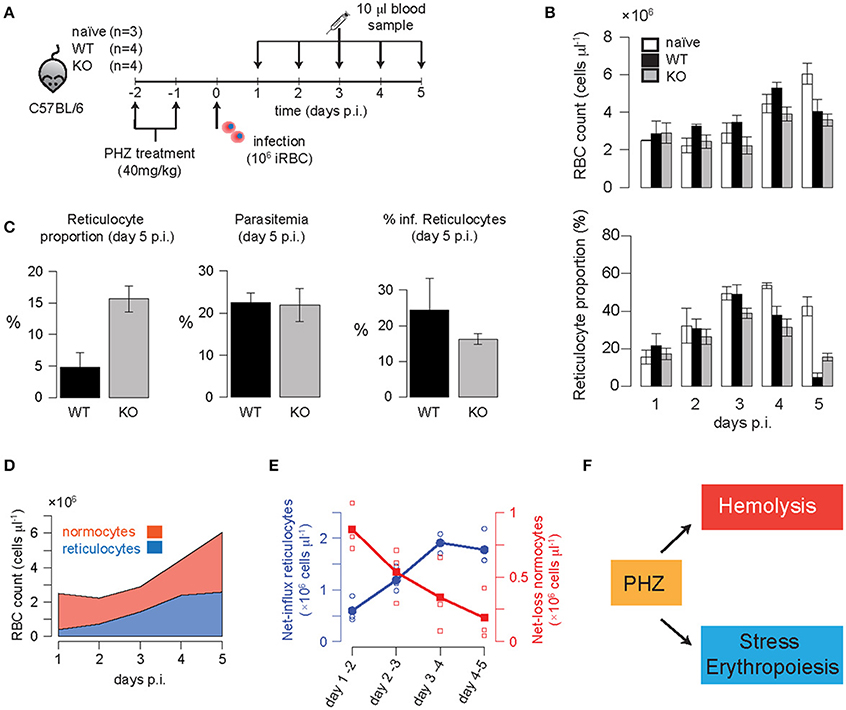
Figure 3. (A) Experimental protocol: Mice were pre-treated with two doses of 40 mg/kg PHZ on two consecutive days before infection with 106 iRBC of WT or KO parasites on the following day. Blood samples (10 μl) were taken daily and analyzed. (B) Measured concentration of RBC (cells/μl) and reticulocyte proportion for each of the different groups. (C) Parasitemia (in % of RBC) above background was detected at day 5 post infection indicating equal levels between WT and KO-infected mice despite a roughly 3-fold higher reticulocyte proportion in KO- compared to WT-infected mice. The percentage of infected reticulocytes was determined as well. (D) The measured progression of normocytes and reticulocytes in PHZ-treated but uninfected animals (naïve) indicated an increasing net-influx of reticulocytes (blue line) and a decreasing net-loss of normocytes (red line) up to 5 days post PHZ treatment (E). This corresponds to the assumed effects of PHZ leading to hemolysis and stress-induced erythropoiesis (F).
Modeling the Effects of PHZ on Erythropoiesis and Predicting Infection Dynamics
To determine if the calculated infection characteristics for WT and KO during normal erythropoietic conditions also apply after PHZ treatment, we extended our previous model to account for drug-induced changes to erythropoiesis. The exact mechanisms by which PHZ induces hemolysis and changes in the RBC age distribution have not been determined so far. Several hypotheses including faster aging of RBCs or direct lysis have been suggested and corresponding mathematical models have been proposed (Savill et al., 2009). However, these models fail to fit our experimental data, partly because they are limited to a particular PHZ treatment protocol (Savill et al., 2009). Therefore, we performed a rigorous analysis, testing several different assumptions for the effect of PHZ on erythropoiesis and their ability to explain the observed changes in total RBC count and reticulocyte dynamics in our data (see Materials and Methods and Supplementary Material Text S3 for a detailed description of the different models tested).
Our data indicate an increasing influx of reticulocytes, as well as a decreasing net-loss in normocytes after the last PHZ-treatment (Figures 3D,E). Thereby, the increased production of reticulocytes cannot solely be explained by the anemia-induced production from the bone marrow. We found that the best models explaining the effect of PHZ treatment on erythropoiesis assume (i) instantaneous hemolysis with ~35–50% of the RBC being lysed upon PHZ administration, and (ii) stress-induced erythropoiesis with an additional production of reticulocytes from different sources than the bone marrow (Figure 3F). Thereby, this additional production starts around 4.5 days after the last PHZ-treatment has been given (Table 3 and Text S3). In addition, our analysis indicates that PHZ leads to an increased death rate of RBC, reducing the average lifetime of RBC from τRBC~40 days to τRBC~8 days (see Figure 3E and Table 3). Besides a constant death rate, a linear decreasing death rate, as indicated by our calculation of the observed net-loss in normocytes (Figure 3E), could also be possible as it shows similar explanatory power for the data (Table 3). By incorporating these effects within our model, we are able to provide a modeling framework that describes PHZ-induced changes on erythropoiesis in our experimental system (Figures 4A,B).
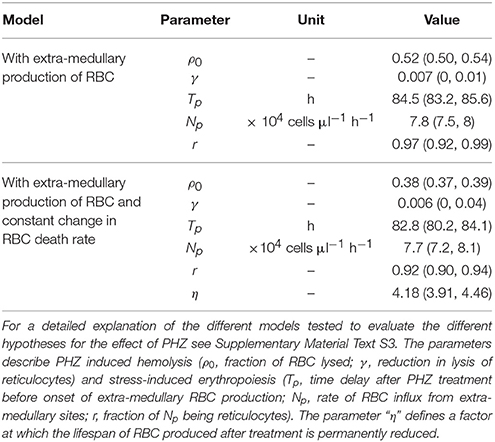
Table 3. Parameters describing the effect of PHZ treatment on erythropoiesis.
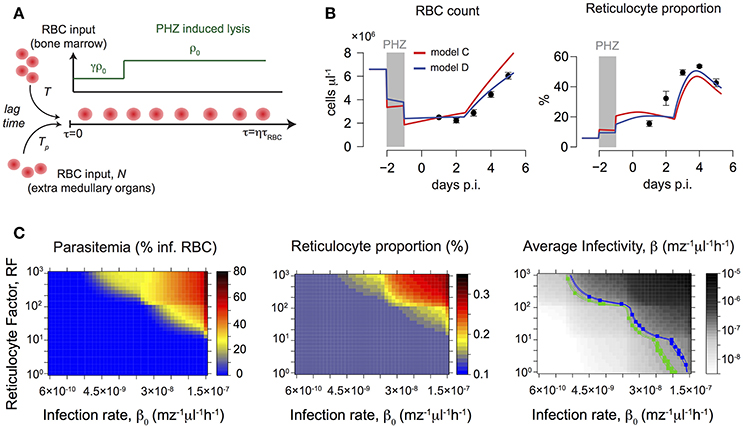
Figure 4. (A) Sketch of the mathematical model describing the main effects of PHZ treatment on erythropoiesis. For a detailed description see section Materials and Methods. (B) Predictions of the best fit-mathematical model for the dynamics of RBC count and reticulocyte proportion under PHZ-induced changes to erythropoiesis. Gray areas indicate time of PHZ treatment. A model assuming an increased death rate of RBC, 1/τ = 0.125 d−1, i.e., due to hemolysis, (blue line) performs better than a model with unchanged RBC lifetimes, 1/τ = 0.025 d−1 (red line). (C) Predicted parasitemia and reticulocyte proportions after PHZ treatment on day 5 post infection for different combinations of reticulocyte factors, RF, and parasite infectivity, β0. The right heat-map shows the relevant combinations for WT (blue) and KO (green) leading to the average infectivity as determined during untreated infection (see Figure 2B and Table 1). While for the KO-group relevant parameter combinations lead to matching reticulocyte proportions (~13%) as in the experimental data (compare to Figure 3C), combinations of RF and β0 for the WT-group predict reticulocyte proportions roughly twice as high as seen in the data.
We then simulated the pre-treatment of mice with PHZ and subsequent infection using different assumptions for parasite infectivity, β0, and reticulocyte preference, RF, and predicted the expected levels of parasitemia and reticulocyte proportion on day 5 post infection (Figure 4C). For the KO strain, relevant parameter combinations as determined previously (Table 2) lead to reticulocyte proportions (~13%) comparable to the ones observed in the experimental data, but result in parasitemia levels of less than 1%. In contrast, combinations of RF and β0 within the determined ranges for the WT parasite predict reticulocyte proportions that are twice as high as seen in the data (Figure 3C), and parasitemia levels that are only one-tenth of the observed level. However, neglecting previous knowledge and directly estimating RF and β0 based on the observed parasitemia and reticulocyte proportion under PHZ treatment, both groups expect that nearly all reticulocytes are infected (80–100%), which does not agree with our data (Figure 3C). These findings indicate that there could be disease-induced changes to PHZ treatment effects that cannot be explained by a simple combination of separately determined processes of blood-stage infection kinetics, erythropoiesis and PHZ dynamics.
Discussion
Parasite replication and invasion of red blood cells during the pathological blood-stage of the Plasmodium life cycle is a critical determinant of the severity of disease progression in a malaria infection (Beeson et al., 2016). Determining the precise processes and host factors regulating parasite's infectivity is essential for the identification of appropriate therapeutic targets. Mathematical models have been widely used to understand within-host infection dynamics of the Plasmodium parasite through analysis of the complex life cycle and host-parasite interactions in various levels of details (Cromer et al., 2006; Mideo et al., 2008; Li et al., 2011; Kerlin and Gatton, 2013). In this study, we used an age-structured model based on partial differential equations similar to previous approaches (Antia et al., 2008) to specifically determine differences between PbANKA (WT) and PbmaLS_05 (-) (KO) parasite strains in terms of age-preferences for RBC, and in particular reticulocytes.
We focused our analysis on the early erythrocytic stage of the parasite, i.e., studying the first 4 days post infection of mice with iRBC. We found that malarial-induced changes to erythropoiesis already play a role at this stage of infection. The observed decrease in reticulocyte proportions could not be explained solely by parasite-induced lysis of RBC (Supplementary Figure S1; Chang et al., 2004), similar to observations for Plasmodium berghei at later erythrocytic stages (Cromer et al., 2006). Several factors, including bystander destruction of uninfected RBC during infection (Cromer et al., 2006; Evans et al., 2006; Fonseca et al., 2016) might contribute to the substantial loss in reticulocytes. However, as total RBC counts are rather stable (Figure 2), an age-independent loss of RBC seemed to be insufficient to explain the observed decrease in reticulocyte proportion. Therefore, the mathematical model by Antia et al. (2008) used to describe blood-stage infection dynamics of Plasmodium parasites was extended in order to account for altered RBC production dynamics during infection (Sexton et al., 2004; Thawani et al., 2014).
By applying our extended model that disentangles erythropoietic and parasite infection dynamics to the experimental data, we found that PbANKA prefers to infect reticulocytes. This preference has been observed for various Plasmodium strains to different extents (Wilson et al., 1977; Mons et al., 1988; Mons, 1990; Cromer et al., 2006; Antia et al., 2008). We estimate a minimum 22-fold higher preference for reticulocytes compared to normocytes in PbANKA parasites relying on the early blood-stage of the parasite (Table 2). However, a maximal limit for the RF could not be determined (Table 2). As large values of RF can be compensated by lower values of the infection rate β0, we can only identify combinations of both parameters that would lead to similar levels of parasitemia and reticulocyte proportion (structural non-identifiability) (Raue et al., 2009). Thus, even substantially higher values of RF could be possible for the WT if the age-independent infection rate β0 is accordingly lower (Figure 2C). Cromer et al. (2006) estimated a value of RF ~ 150 based on data from later stages of infection with Plasmodium berghei, for which a particular reticulocyte preference was found at later times (Singer et al., 1955). With a RF ~ 150 as estimated by Cromer et al. (Cromer et al., 2006) our model would predict that infected reticulocytes account for ~65% of the parasitemia at day 4 p.i. (Figure 5). Although this is a slightly larger value than for previous observations in rats infected with Plasmodium berghei (Singer et al., 1955), which showed that reticulocytes represent ~50% of the infected RBC on day 4 p.i., such a high reticulocyte factor cannot be excluded based on our analysis.
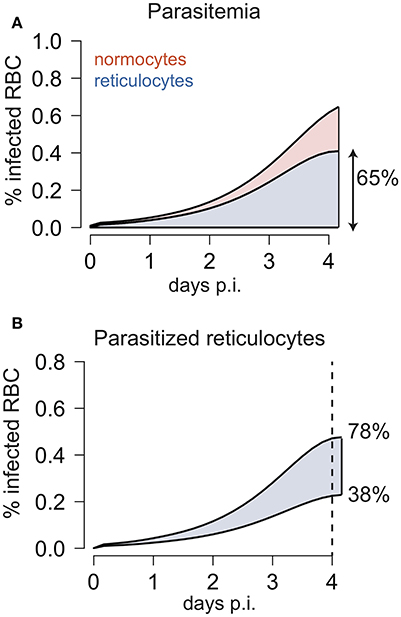
Figure 5. (A) Development of infected normocytes and reticulocytes during infection with WT parasites as predicted by the model using a reticulocyte factor of RF = 150 as estimated by Cromer et al. (2006). The model predicts that 4 days after infection around 65% of the infected red blood cells are reticulocytes. (B) Using the estimated parameter combinations of the infection rate β0 and RF for PbANKA (Table 2), the model predicts that 4 days after infection in between 38 and 78% of the infected red blood cells are reticulocytes.
We also find different combinations of the infection rate β0 and the reticulocyte factor RF that could explain the observed dynamics for the KO-parasite (Figure 2C). However, we estimate that PbANKA parasites have a roughly 1.5-fold higher average infectivity than parasites lacking the PbmaLS_05 gene (Table 2). Although quite small, this difference is sufficient to explain the observed reduced peripheral parasite load of KO compared to WT infected mice on day 4 p.i. Moreover, the differences between both parasite strains might even be larger than currently estimated. Since WT-infected mice were sacrificed after showing signs of ECM, we were restricted in our analysis to the early exponential growth phase of the parasite in the blood. This could affect the identification of differing parasite infectivities for several reasons: Firstly, parasite levels are still low during this early phase (Figure 1B) and, hence, more prone to measurement noise. Therefore, differences between strains could be masked by the variation in the measurements. Secondly, by using our model to simulate blood-stage infection dynamics assuming various infectivity profiles, we find that differences between infectivity profiles only start to become visible in the measured parasitemia and reticulocyte proportion after 4–5 days p.i. (Supplementary Figure S2). However, comparison of long-term infection dynamics between both strains is hampered as mice infected by PbANKA WT develop ECM around day 5 p.i.
Based on our analysis, the lower average infectivity for KO compared to PbANKA WT can be explained by two alternative hypotheses. On the one hand, KO-parasites could have a comparable or larger reticulocyte factor RF than the WT, but substantially lower infection rates β0 (Figure 2C and Supplementary Figure S2). This would argue for a restriction of the parasite's infectivity to reticulocytes due to deletion of PbmaLS_05 (Hopp et al., 2017). In this case, we would expect that such a reticulocyte restriction is particularly visible in mice pre-treated with PHZ, a drug that artificially induces anemia and leads to an increased proportion of reticulocytes. However, we observe a 3-fold higher proportion of reticulocytes in KO- than WT-infected mice 5 days p.i. (Figure 3C). Given comparable levels of parasitemia and total RBC counts, this indicates enhanced reticulocyte survival during infection with the KO-parasite.
Therefore, our analysis rather suggests that deletion of PbmaLS_05 impairs the ability of the parasite to productively infect reticulocytes during the early infection phase. The estimated reticulocyte factor RF for the WT is around ~1.4 times higher than the one estimated for the KO when assuming similar infection rates (Figure 2C). Furthermore, the calculated reticulocyte preference for KO-infected mice after treatment with PHZ is roughly half the size of the one determined for WT-infected mice. As reticulocytes are usually the preferential targets of parasites (Mons et al., 1988; Mons, 1990), this impaired ability to infect reticulocytes would explain the observed slower increase in parasite burden in mice infected by the KO parasite. In fact, several studies have characterized the need for parasites to infect reticulocytes in order to spread infection. As shown through metabolomic analysis of RBC, reticulocytes possess a higher content of carbon sources and essential nutrients, both of which have been proposed to contribute to the higher reticulocyte preference of WT parasites during the early intra-erythrocytic stages of development (Srivastava et al., 2015). Furthermore, increased expression of CD47 on reticulocytes was shown to prevent phagocytosis and clearance of infected cells (Banerjee et al., 2015), thus allowing unchecked multiplication and infection of new red blood cells. It is therefore plausible that the reduced infectivity of PbmaLS_05 (-) parasites reflected by the parasite's inability to develop within reticulocytes is a major contributing factor to the slower multiplication rates in the blood. Moreover, PbmaLS_05 (-) infected mice do not develop experimental cerebral malaria but only late stage anemia (Fernandes et al., submitted manuscript), which is in line with previous studies that have proposed a link between severe disease progression and cell preference (McQueen and McKenzie, 2004; Iyer et al., 2007).
In addition to parasite infectivity, we also investigated if the reduced parasitemia in KO infected mice can be explained by impaired merozoite production or altered maturation times for infected RBCs. Assuming similar parasite infectivity for both strains, we do not find evidence for a reduced production of merozoites in KO infection compared to WT (Supplementary Figure S4). However, a roughly 2-fold longer maturation time for iRBC infected by the KO could provide an alternative explanation for the observed differing dynamics (Supplementary Figure S4). This supports the conclusion that deletion of PbmaLS_05 particularly leads to impaired parasite development and less successful infections in reticulocytes during the initial blood-stage phase.
To fully determine the impact of PbmaLS_05 deletion on parasite infectivity during the intra-erythrocytic stage and, thus, on disease progression, it remains to be investigated how infection affects erythropoiesis during later phases. Since mice infected with the KO-parasite do not develop ECM, they can be observed for longer time periods. During progression of infection, we observed a substantial increase in the proportion of reticulocytes before mice develop severe anemia and die ~21 days p.i., (Supplementary Figure S5). However, assuming continuous malarial-induced reduction of RBC production, our model is not able to explain the observed dynamics in reticulocytes and parasitemia (Supplementary Figure S5). These observations point toward a recovery of erythropoiesis at later time points, and potentially altered infectivity profiles of the parasite as has been observed for other Plasmodium strains. In fact, for the Plasmodium chabaudi strain it has been shown that reticulocyte production increases quickly after reaching a minimal production around 9 days after infection with 106 iRBC (Chang and Stevenson, 2004; Chang et al., 2004). In addition, Plasmodium berghei has been observed to alter its targeted age range during the progression of infection (Singer et al., 1955; Sexton et al., 2004). Understanding the changes in the erythropoietic processes in the time course of malaria infection remains critical to analyze long-term infection data and to further elucidate the effect of deleting maLS_05 on parasite infectivity and its importance for reticulocyte invasion. This also includes the understanding of the dynamics of infection and reticulocyte development under PHZ treatment. Our analysis revealed that these dynamics are more complex than a simple combination of altered erythropoiesis and infection processes that were parameterized independently.
In summary, our analysis based on a combination of mathematical modeling and experimental data suggests that deletion of PbmaLS_05 affects productive infection of reticulocytes during the early blood-stage of the parasite's asexual development. Furthermore, our analysis supports previous findings on malarial-induced changes to erythropoiesis that also affect early blood-stage infection dynamics. Given the suggested outcome of PbmaLS_05 on the productive infection of reticulocytes, we propose that the PbmaLS_05 (-) mutant parasite strain can serve as a tool to study how the preference of parasites to infect particular RBC influences both disease progression and the development of experimental cerebral malaria. This will ultimately aid in revealing the factors that influence the activation of immune responses and that might enable efficient parasite control.
Author Contributions
Conceived and designed the study: A-KM and FG; Performed the experiments: PF; Developed the mathematical models and analysis methods: NT and FG; Analyzed the experimental data: NT, PF, A-KM, and FG; Wrote the manuscript: NT, PF, A-KM, and FG.
Funding
This work was supported by a grant from the FRONTIER-program of Heidelberg University (ZUK 49/2 5.2.107) and by a grant from the Ministry of Science, Research and the Arts of Baden-Württemberg (Az: 0077.3.5.2.107) to FG and A-KM. NT and FG were additionally funded by the Center for Modeling and Simulation in the Biosciences (BIOMS). A-KM is a recipient of a maternity leave stipend through the Deutsche Zentrum für Infektionsforschung (DZIF). We acknowledge financial support by Deutsche Forschungsgemeinschaft within the funding programme Open Access Publishing, by the Baden-Württemberg Ministry of Science, Research and the Arts and by Ruprecht-Karls-Universität Heidelberg.
Conflict of Interest Statement
The authors declare that the research was conducted in the absence of any commercial or financial relationships that could be construed as a potential conflict of interest.
Acknowledgments
We thank Annika Schneider and Sophia Eijkman for helpful contributions to the data analysis.
Supplementary Material
The Supplementary Material for this article can be found online at: https://www.frontiersin.org/articles/10.3389/fmicb.2018.00166/full#supplementary-material
References
Antia, R., Yates, A., and de Roode, J. C. (2008). The dynamics of acute malaria infections. I. Effect of the parasite's red blood cell preference. Proc. Biol. Sci. 275, 1449–1458. doi: 10.1098/rspb.2008.0198
Banerjee, R., Khandelwal, S., Kozakai, Y., Sahu, B., and Kumar, S. (2015). CD47 regulates the phagocytic clearance and replication of the Plasmodium yoelii malaria parasite. Proc. Natl. Acad. Sci. U.S.A. 112, 3062–3067. doi: 10.1073/pnas.1418144112
Beeson, J. G., Drew, D. R., Boyle, M. J., Feng, G., Fowkes, F. J., and Richards, J. S. (2016). Merozoite surface proteins in red blood cell invasion, immunity and vaccines against malaria. FEMS Microbiol. Rev. 40, 343–372. doi: 10.1093/femsre/fuw001
Chang, K. H., and Stevenson, M. M. (2004). Malarial anaemia: mechanisms and implications of insufficient erythropoiesis during blood-stage malaria. Int. J. Parasitol. 34, 1501–1516. doi: 10.1016/j.ijpara.2004.10.008
Chang, K. H., Tam, M., and Stevenson, M. M. (2004). Modulation of the course and outcome of blood-stage malaria by erythropoietin-induced reticulocytosis. J. Infect. Dis. 189, 735–743. doi: 10.1086/381458
Clough, B., Atilola, F. A., Black, J., and Pasvol, G. (1998). Plasmodium falciparum: the importance of IgM in the rosetting of parasite-infected erythrocytes. Exp. Parasitol. 89, 129–132. doi: 10.1006/expr.1998.4275
Cox, F. E. G. (1988). Major Animal Models in Malaria Research: Rodents. New York, NY: Churchill Livingstone.
Cromer, D., Evans, K. J., Schofield, L., and Davenport, M. P. (2006). Preferential invasion of reticulocytes during late-stage Plasmodium berghei infection accounts for reduced circulating reticulocyte levels. Int. J. Parasitol. 36, 1389–1397. doi: 10.1016/j.ijpara.2006.07.009
Cromer, D., Stark, J., and Davenport, M. P. (2009). Low red cell production may protect against severe anemia during a malaria infection–insights from modeling. J. Theor. Biol. 257, 533–542. doi: 10.1016/j.jtbi.2008.12.019
De Roode, J. C. (2004). Within-Host Competition and the Evolution of Malaria Parasites. Ph.D. thesis, University of Edinburgh.
de Souza, J. B., Hafalla, J. C., Riley, E. M., and Couper, K. N. (2010). Cerebral malaria: why experimental murine models are required to understand the pathogenesis of disease. Parasitology 137, 755–772. doi: 10.1017/S0031182009991715
Dondorp, A. M., Angus, B. J., Chotivanich, K., Silamut, K., Ruangveerayuth, R., Hardeman, M. R., et al. (1999). Red blood cell deformability as a predictor of anemia in severe falciparum malaria. Am. J. Trop. Med. Hyg. 60, 733–737. doi: 10.4269/ajtmh.1999.60.733
Evans, K. J., Hansen, D. S., van Rooijen, N., Buckingham, L. A., and Schofield, L. (2006). Severe malarial anemia of low parasite burden in rodent models results from accelerated clearance of uninfected erythrocytes. Blood 107, 1192–1199. doi: 10.1182/blood-2005-08-3460
Fonseca, L. L., Alezi, H. S., Moreno, A., Barnwell, J. W., Galinski, M. R., and Voit, E. O. (2016). Quantifying the removal of red blood cells in Macaca mulatta during a Plasmodium coatneyi infection. Malar. J. 15:410. doi: 10.1186/s12936-016-1465-5
Fonseca, L. L., and Voit, E. O. (2015). Comparison of mathematical frameworks for modeling erythropoiesis in the context of malaria infection. Math. Biosci. 270(Pt B), 224–236. doi: 10.1016/j.mbs.2015.08.020
Franke-Fayard, B., Janse, C. J., Cunha-Rodrigues, M., Ramesar, J., Büscher, P., Que, I., et al. (2005). Murine malaria parasite sequestration: CD36 is the major receptor, but cerebral pathology is unlinked to sequestration. Proc. Natl. Acad. Sci. U.S.A. 102, 11468–11473. doi: 10.1073/pnas.0503386102
Ganzoni, A., Hillman, R. S., and Finch, C. A. (1969). Maturation of the macroreticulocyte. Br. J. Haematol. 16, 119–135. doi: 10.1111/j.1365-2141.1969.tb00384.x
Garnham, P. C. C. (1966). Malaria Parasites and other Haemosporidia. London: Blackwell Scientific Publishers.
Gronowicz, G., Swift, H., and Steck, T. L. (1984). Maturation of the reticulocyte in vitro. J. Cell Sci. 71, 177–197.
Gupta, S., Seydel, K., Miranda-Roman, M. A., Feintuch, C. M., Saidi, A., Kim, R. S., et al. (2017). Extensive alterations of blood metabolites in pediatric cerebral malaria. PLoS ONE 12:e0175686. doi: 10.1371/journal.pone.0175686
Hoffmann, A., Pfeil, J., Alfonso, J., Kurz, F. T., Sahm, F., Heiland, S., et al. (2016). Experimental cerebral malaria spreads along the rostral migratory stream. PLoS Pathog. 12:e1005470. doi: 10.1371/journal.ppat.1005470
Hopp, C. S., Bennett, B. L., Mishra, S., Lehmann, C., Hanson, K. K., Lin, J. W., et al. (2017). Deletion of the rodent malaria ortholog for falcipain-1 highlights differences between hepatic and blood stage merozoites. PLoS Pathog. 13:e1006586. doi: 10.1371/journal.ppat.1006586
Iyer, J., Grüner, A. C., Rénia, L., Snounou, G., and Preiser, P. R. (2007). Invasion of host cells by malaria parasites: a tale of two protein families. Mol. Microbiol. 65, 231–249. doi: 10.1111/j.1365-2958.2007.05791.x
Jain, S. K., and Hochstein, P. (1980). Membrane alterations in phenylhydrazine-induced reticulocytes. Arch. Biochem. Biophys. 201, 683–687. doi: 10.1016/0003-9861(80)90560-3
Kerlin, D. H., and Gatton, M. L. (2013). Preferential invasion by Plasmodium merozoites and the self-regulation of parasite burden. PLoS ONE 8:e57434. doi: 10.1371/journal.pone.0057434
Kim, C. H. (2010). Homeostatic and pathogenic extramedullary hematopoiesis. J. Blood Med. 1, 13–19. doi: 10.2147/JBM.S7224
Li, Y., Ruan, S., and Xiao, D. (2011). The within-host dynamics of malaria infection with immune response. Math. Biosci. Eng. 8, 999–1018. doi: 10.3934/mbe.2011.8.999
Mackey, M. C. (1997). “Mathematical models of hematopoietic cell replication and control,” in Case Studies in Mathematical Modeling - Ecology, Physiology, and Cell Biology, eds H. G. Othmer, F. R. Adler, M. A. Lewis, and J. C. Dallon (New York, NY: Prentice-Hall), 151–181.
Mary, J. Y., Valleron, A. J., Croizat, H., and Frindel, E. (1980). Mathematical analysis of bone marrow erythropoiesis: application to C3H mouse data. Blood Cells 6, 241–262.
McNally, J., O'Donovan, S. M., and Dalton, J. P. (1992). Plasmodium berghei and Plasmodium chabaudi chabaudi: development of simple in vitro erythrocyte invasion assays. Parasitology 105(Pt 3), 355–362. doi: 10.1017/S0031182000074527
McQueen, P. G., and McKenzie, F. E. (2004). Age-structured red blood cell susceptibility and the dynamics of malaria infections. Proc. Natl. Acad. Sci. U.S.A. 101, 9161–9166. doi: 10.1073/pnas.0308256101
Mideo, N., Barclay, V. C., Chan, B. H., Savill, N. J., Read, A. F., and Day, T. (2008). Understanding and predicting strain-specific patterns of pathogenesis in the rodent malaria Plasmodium chabaudi. Am. Nat. 172, 214–238. doi: 10.1086/591684
Mons, B. (1990). Preferential invasion of malarial merozoites into young red blood cells. Blood Cells 16, 299–312.
Mons, B., Croon, J. J., van der Star, W., and van der Kaay, H. J. (1988). Erythrocytic schizogony and invasion of Plasmodium vivax in vitro. Int. J. Parasitol. 18, 307–311. doi: 10.1016/0020-7519(88)90138-5
Moreau, R., Tshikudi Malu, D., Dumais, M., Dalko, E., Gaudreault, V., Roméro, H., et al. (2012). Alterations in bone and erythropoiesis in hemolytic anemia: comparative study in bled, phenylhydrazine-treated and Plasmodium-infected mice. PLoS ONE 7:e46101. doi: 10.1371/journal.pone.0046101
Pasvol, G., Weatherall, D. J., and Wilson, R. J. (1980). The increased susceptibility of young red cells to invasion by the malarial parasite Plasmodium falciparum. Br. J. Haematol. 45, 285–295. doi: 10.1111/j.1365-2141.1980.tb07148.x
Ploemacher, R. E., van Soest, P. L., and Vos, O. (1977). Kinetics of erythropoiesis in the liver induced in adult mice by phenylhydrazine. Scand. J. Haematol. 19, 424–434. doi: 10.1111/j.1600-0609.1977.tb01497.x
Portugal, S., Drakesmith, H., and Mota, M. M. (2011). Superinfection in malaria: Plasmodium shows its iron will. EMBO Rep. 12, 1233–1242. doi: 10.1038/embor.2011.213
Raue, A., Kreutz, C., Maiwald, T., Bachmann, J., Schilling, M., Klingmüller, U., et al. (2009). Structural and practical identifiability analysis of partially observed dynamical models by exploiting the profile likelihood. Bioinformatics 25, 1923–1929. doi: 10.1093/bioinformatics/btp358
R Development Core Team (2017). R: A Language and Environment for Statistical Computing and Graphics. R-Project for Statistical Computing. Available online at: http://www.r-project.org
Reilly, H. B., Wang, H., Steuter, J. A., Marx, A. M., and Ferdig, M. T. (2007). Quantitative dissection of clone-specific growth rates in cultured malaria parasites. Int. J. Parasitol. 37, 1599–1607. doi: 10.1016/j.ijpara.2007.05.003
Savill, N. J., Chadwick, W., and Reece, S. E. (2009). Quantitative analysis of mechanisms that govern red blood cell age structure and dynamics during anaemia. PLoS Comput. Biol. 5:e1000416. doi: 10.1371/journal.pcbi.1000416
Sexton, A. C., Good, R. T., Hansen, D. S., D'Ombrain, M. C., Buckingham, L., Simpson, K., et al. (2004). Transcriptional profiling reveals suppressed erythropoiesis, up-regulated glycolysis, and interferon-associated responses in murine malaria. J. Infect. Dis. 189, 1245–1256. doi: 10.1086/382596
Seydel, K. B., Kampondeni, S. D., Valim, C., Potchen, M. J., Milner, D. A., Muwalo, F. W., et al. (2015). Brain swelling and death in children with cerebral malaria. N. Engl. J. Med. 372, 1126–1137. doi: 10.1056/NEJMoa1400116
Singer, I., Hadfield, R., and Lakonen, M. (1955). The influence of age on the intensity of infection with Plasmodium berghei in the rat. J. Infect. Dis. 97, 15–21. doi: 10.1093/infdis/97.1.15
Spivak, J. L., Toretti, D., and Dickerman, H. W. (1973). Effect of phenylhydrazine-induced hemolytic anemia on nuclear RNA polymerase activity of the mouse spleen. Blood 42, 257–266.
Srivastava, A., Creek, D. J., Evans, K. J., De Souza, D., Schofield, L., Müller, S., et al. (2015). Host reticulocytes provide metabolic reservoirs that can be exploited by malaria parasites. PLoS Pathog. 11:e1004882. doi: 10.1371/journal.ppat.1004882
Thawani, N., Tam, M., Bellemare, M. J., Bohle, D. S., Olivier, M., de Souza, J. B., et al. (2014). Plasmodium products contribute to severe malarial anemia by inhibiting erythropoietin-induced proliferation of erythroid precursors. J. Infect. Dis. 209, 140–149. doi: 10.1093/infdis/jit417
Villeval, J. L., Lew, A., and Metcalf, D. (1990). Changes in hemopoietic and regulator levels in mice during fatal or nonfatal malarial infections. I. Erythropoietic populations. Exp. Parasitol. 71, 364–374. doi: 10.1016/0014-4894(90)90062-H
Wiczling, P., and Krzyzanski, W. (2008). Flow cytometric assessment of homeostatic aging of reticulocytes in rats. Exp. Hematol. 36, 119–127. doi: 10.1016/j.exphem.2007.09.002
Wilson, R. J., Pasvol, G., and Weatherall, D. J. (1977). Invasion and growth of Plasmodium falciparum in different types of human erythrocyte. Bull. World Health Organ. 55, 179–186.
Keywords: Malaria, Plasmodium, mathematical modeling, infection dynamics, parasite infectivity, erythropoiesis
Citation: Thakre N, Fernandes P, Mueller A-K and Graw F (2018) Examining the Reticulocyte Preference of Two Plasmodium berghei Strains during Blood-Stage Malaria Infection. Front. Microbiol. 9:166. doi: 10.3389/fmicb.2018.00166
Received: 03 October 2017; Accepted: 24 January 2018;
Published: 20 February 2018.
Edited by:
Ruy Ribeiro, Los Alamos National Laboratory (DOE), United StatesReviewed by:
Luis L. Fonseca, Georgia Institute of Technology, United StatesEberhard Otto Voit, Georgia Institute of Technology, United States
Copyright © 2018 Thakre, Fernandes, Mueller and Graw. This is an open-access article distributed under the terms of the Creative Commons Attribution License (CC BY). The use, distribution or reproduction in other forums is permitted, provided the original author(s) and the copyright owner are credited and that the original publication in this journal is cited, in accordance with accepted academic practice. No use, distribution or reproduction is permitted which does not comply with these terms.
*Correspondence: Ann-Kristin Mueller, ann-kristin.mueller@uni-heidelberg.de
Frederik Graw, frederik.graw@bioquant.uni-heidelberg.de
†Present Address: Priyanka Fernandes, CIMI-Paris, National Institute for Health and Medical Research U1135, Faculté de Médecine Pierre et Marie Curie, Site Pitié Salpêtrière 5éme ètage, Paris, France
‡These authors have contributed equally to this work.