 Késia S. Lourenço1,2,3
 Noriko A. Cassman1,3Agata S. Pijl1Johannes A. van Veen1,3
 Heitor Cantarella2
 Eiko E. Kuramae1*
- 1Department of Microbial Ecology, Netherlands Institute of Ecology, Wageningen, Netherlands
- 2Soils and Environmental Resources Center, Agronomic Institute of Campinas, Campinas, Brazil
- 3Institute of Biology Leiden, Leiden University, Leiden, Netherlands
Organic vinasse, a residue produced during bioethanol production, increases nitrous oxide (N2O) emissions when applied with inorganic nitrogen (N) fertilizer in soil. The present study investigated the role of the ammonia-oxidizing bacteria (AOB) community on the N2O emissions in soils amended with organic vinasse (CV: concentrated and V: non-concentrated) plus inorganic N fertilizer. Soil samples and N2O emissions were evaluated at 11, 19, and 45 days after fertilizer application, and the bacterial and archaea gene (amoA) encoding the ammonia monooxygenase enzyme, bacterial denitrifier (nirK, nirS, and nosZ) genes and total bacteria were quantified by real time PCR. We also employed a deep amoA amplicon sequencing approach to evaluate the effect of treatment on the community structure and diversity of the soil AOB community. Both vinasse types applied with inorganic N application increased the total N2O emissions and the abundance of AOB. Nitrosospira sp. was the dominant AOB in the soil and was correlated with N2O emissions. However, the diversity and the community structure of AOB did not change with vinasse and inorganic N fertilizer amendment. The results highlight the importance of residues and fertilizer management in sustainable agriculture and can be used as a reference and an input tool to determine good management practices for organic fertilization.
Introduction
Brazil is the world’s largest producer of sugarcane, with about 685 million tons of sugarcane produced from an area of 9 million hectares in 2016/2017 (CONAB, 2017). Roughly 53% of sugarcane production is directed toward bioethanol production, which is considered a sustainable biofuel (CONAB, 2017). Studies conducted by Macedo et al. (2008) and Seabra et al. (2011) indicated that ethanol production from sugarcane emits about 80% less greenhouse (GHG) gasses than the production of fossil fuels. These benefits are reduced during the practice of recycling sugarcane straw and bioethanol production residues (Galdos et al., 2010; De Figueiredo and La Scala, 2011; Carmo et al., 2013; Pitombo et al., 2015; Siqueira Neto et al., 2016; Soares et al., 2016). For each liter of ethanol produced, 10–15 liters of the liquid waste, called vinasse, are generated, which totals roughly 360 billion liters of vinasse per year. Vinasse is the major residue generated during the production of ethanol from sugarcane. Vinasse is rich in organic content, carbon (10,000–20,000 mg C L–1), nitrogen (357 mg N L–1), and especially potassium (2056 mg L–1) (Elia-Neto and Nakahodo, 1995; Macedo et al., 2008; Christofoletti et al., 2013; Fuess and Garcia, 2014). To recycle these nutrients, vinasse is directly applied on sugarcane fields as a fertilizer. Recently the use of concentrated vinasse fertilizer, made by reducing the water volume of vinasse, has become popular due to the overall reduced cost associated with transporting the fertilizer to the field. Thus, both types concentrated and non-concentrated vinasse are currently used as organic fertilizer (Rodrigues Reis and Hu, 2017). However, when vinasse is applied with N fertilizer in the soil, high nitrous oxide (N2O) emission occur (Carmo et al., 2013; Paredes et al., 2014, 2015; Pitombo et al., 2015).
Nitrous oxide is one of the molecules of the nitrogen (N) cycle with major environmental and ecological impacts. N2O is both an ozone-depletion substance (Ravishankara et al., 2009) and a GHG with global warming potential 298 times higher than carbon dioxide (CO2) (IPCC, 2013). Agricultural soils account for an estimated 65% of global N2O emissions (IPCC, 2013). N2O is produced in soil via biotic and abiotic processes. Chemodenitrification is an abiotic process and it is carried out in low pH (<4.5) by the chemical decomposition of hydroxylamine (NH2OH), nitroxyl hydride (HNO) or NO2– with organic and inorganic compounds. Biotic N2O production processes are widely distributed over the soil microbiota and have been observed in more than 60 bacterial and archaeal genera (Philippot et al., 2007; Canfield et al., 2010; Nelson et al., 2016). N2O can be emitted as a byproduct of nitrification or denitrification, which are the main biotic processes contributing to N2O emissions in soil (Goreau et al., 1980; Wrage et al., 2001; Bakken and Frostegård, 2017). Denitrification is widely responsible for soil N2O emissions at high water contents while nitrification has often been assumed to be the principal source of N2O in soil under aerobic conditions (Mathieu et al., 2006; Soares et al., 2016).
Nitrification is the aerobic oxidation of ammonia (NH3) to nitrate (NO3–), which occurs in two phases mediated mainly by autotrophic microorganisms. In the first phase, ammonia-oxidizing bacteria (AOB) or archaea (AOA) oxidize NH3 to nitrite (NO2–); in the second phase, nitrite-oxidizing bacteria (NOB) oxidize NO2– to NO3–. The ammonia oxidation phase (NH3 → NH2OH/HNO → NO2–) is catalyzed by the ammonia monooxygenase enzyme encoded by the amoA gene, which is carried by β- or γ-proteobacteria (AOB) and the newly described Thaumarchaeota phylum (AOA). The nxrB gene encodes the enzyme nitrite oxidoreductase and regulates the second phase of nitrification. The N2O production by AOB is the result of incomplete oxidation of NH2OH to either nitroxyl (HNO) or NO (Smith and Hein, 1960; Hu et al., 2015) which occurs under aerobic conditions. The second N2O– yielding route related to nitrifiers is termed nitrifier denitrification and occurs under both high and low oxygen concentrations. In this process, AOB possess machinery that reduces NO2– to N2O via a nitric oxide (NO) intermediate (Ritchie and Nicholas, 1972; Shaw et al., 2006). Shi et al. (2017) showed that nitrifier denitrification is an important pathway leading to high N2O production (10.5–54.5%) in alkaline cropping soils (pH 7.2); however, heterotrophic denitrification accounted for a the largest proportion of total N2O production (∼83%) in acid soils (pH 4.9). Recently, Caranto et al. (2016) demonstrated another direct enzymatic pathway from NH2OH to N2O under anaerobic conditions, which is mediated by cytochrome P460. Furthermore, nitrification can also occur during a single step as performed by bacteria of the genus Nitrospira sp. (Daims et al., 2015; van Kessel et al., 2015); however, it is not yet known if N2O emissions occur during this process.
Denitrification is a multistep reaction performed by a variety of bacteria and fungi. During denitrification, oxidized mineral forms of N (NO3– and NO2–) are reduced to the gaseous products NO, N2O, and N2 under oxygen-limited conditions (NO3– → NO2– → NO → N2O → N2). The sequential processes of bacterial denitrification are regulated by divergent reductases encoded by distinct functional genes: the narG or napA genes encode nitrate reductase, the nirK or nirS genes encode two entirely different types of nitrite reductase, the norB encode nitric oxide reductase and the nosZ gene encodes N2O reductase (Philippot et al., 2007; Jones et al., 2013).
In a recent study conducted in sugarcane fields in Brazil, AOB rather than AOA or denitrifier bacteria were associated with N2O emissions (Soares et al., 2016), suggesting that nitrification is the dominant N2O-producing process in these soils. While it is known that using vinasse plus inorganic N fertilizers increases N2O emissions, there are no studies to date on the effects of these treatments on the AOB communities in these soils. Therefore, the aim of the current study was to evaluate the effects of vinasse plus inorganic nitrogen fertilization on the ammonia-oxidizing bacterial community abundance, structure, and diversity of the AOB in a tropical soil planted with sugarcane. We hypothesized that the abundance and community structure of the AOB would respond to organic and inorganic, i.e., vinasse and fertilization.
Materials and Methods
Experimental Setup and Soil Sampling
The field experiment was situated in Piracicaba, Brazil at APTA (Paulista Agency for Agribusiness Technology). The mean annual air temperature and precipitation of the region are 21°C and 1,390 mm, respectively. Precipitation and daily temperature measurements during the experiment were obtained from a meteorological station located nearby the experimental field. The soil was classified as Ferrasol (FAO, 2015) with pH of 5.0, organic matter of 21.1 g dm–3, P of 14.6 mg dm–3, K+ of 0.7 mmolc dm–3, Ca+2 of 17.4 mmolc dm–3, Mg+2 of 11.9 mmolc dm–3, H+ + Al+3 of 34.9 mmolc dm–3, CEC of 65.1 mmolc dm–3, and soil bulk density of 1.49 g cm–3. The experiment was carried out in a field planted with the sugarcane variety RB86-7515. The sugarcane was mechanically harvested and the straw was left on top of the soil (16 Mg ha–1). The experiment was conducted in a randomized block design with three replicate blocks. The treatments were: (1) Control: plot without inorganic N fertilization or vinasse; (2) N: inorganic N fertilizer only; (3) CV+N: concentrated vinasse plus inorganic N fertilizer; and (4) V+N: non-concentrated vinasse plus inorganic N fertilizer.
The inorganic fertilizers and concentrated vinasse (CV) were surface-applied in a 0.2-m wide row, close to the plant (0.1 m) in agreement with common practices in commercial sugarcane production. The N fertilizer rate was 100 kg N ha–1 of ammonium nitrate (NH4NO3). Volumes of 1.0 × 10⁵ l ha–1 of non-concentrated vinasse (V) were sprayed over the experimental plots using a motorized pump fit with a flow regulator. This amount of V corresponded with recommended average application rates to sugarcane plantations in Sao Paulo. Concentrated vinasse was applied in fertilization rows at rate of 1.7 × 10⁵ l ha–1. CV was produced by concentrating vinasse by a factor of 5.8, which is the average of sugar mill vinasse concentration processes. The chemical characteristics of the vinasses are listed in Supplementary Table S1.
The experiment started on August 15, 2014 and 6 soil samplings per plot were carried out on three time points: 11, 19, and 45 days after inorganic N and vinasse applications. For each treatment, soil samples were collected from the 0–10 cm layer for measurements of moisture content, concentrations of NO3–-N and NH4+-N, and pH. Soil subsamples (30 g) were stored at –80°C for molecular analyses. In parallel, for each soil sample air and soil temperatures were measured. Soil temperatures were collected from the 0–10 cm layer with a digital thermometer. Soil moisture was determined gravimetrically by drying the soil at 105°C for 24 h and the water-filled pore space (WFPS) was calculated considering soil moisture and bulk density. Soil mineral N (NH4+-N, NO3–-N) was measured with a continuous flow analytical system (FIAlab-2500 System) (Kamphake et al., 1967; Krom, 1980).
Nitrous Oxide Measurements
Fluxes of N2O were measured using PVC static chambers with 20 cm height and 30 cm diameter, according to the method described in Pitombo et al. (2015) and Soares et al. (2016). The gases were sampled with plastic syringes (60 mL) at three time intervals (1, 15, and 30 min) after the chambers were closed (Soares et al., 2016). The samples were transferred and stored in pre-evacuated 12 mL glass vials and analyzed in a gas chromatograph with an electron capture detector for N2O and with flame ionization detector for CO2 determination (model GC-2014, Shimadzu Co.). Gas and soil samples were collected in the morning between 7:00 and 12:00 AM GMT-3. Overall N2O flux was calculated by linear interpolation over the three sampling times.
DNA Extraction and Real-Time PCR
Total soil DNA was extracted using the MoBio PowerSoil DNA Isolation Kit (MoBio, Solana Beach, CA, United States). Of each soil sample, 0.30 g was used for DNA extraction according to the manufacturer’s instructions. The quantity and quality of DNA were quantified and checked using a Qubit 2.0 Fluorometer (Life Technologies, Carlsbad, CA, United States), as well as visualized on 1% (w/v) agarose gel under UV light. The abundance of the amoA-AOB gene and total bacterial community was quantified by real-time PCR with a BIO-RAD CFX96 TouchTM Real-Time PCR Detection System. Amplification of the amoA-AOB gene was performed in total volume of 12 μL, containing 6 μL SYBR Green Bioline SensiFAST SYBR® No-ROX mix, 0.125 μL of each primer (10 pmol) and 4 μL of DNA (40 ng); the primer used was amoA1F (5′-GGGGTTTCTACTGGTGGT-3′) and amoA2R (5′-CCCCTCKGSAAAGCCTTCTTC-3′) (Rotthauwe et al., 1997). The thermal cycler conditions were 95°C-10 min; 40 times 95°C-10 s, 65°C-25 s; last, acquisition was done at 65°C. The qPCR amplicon products (491 bp) were checked by melting curve analysis and agarose gel electrophoresis. The efficiency of the amoA-AOB qPCR was 87% (R2 = 0.99). Assessment of the abundance of the total bacterial community was based on 16S rRNA gene qPCR was performed in total volume of 12 μL, containing 6 μL SYBR Green iQTM SYBR® Green Supermix (Bio-Rad), 0.125 μL of each primer (10 pmol), 0.30 μL of bovine serum albumin (BSA), and 4 μL of DNA (5 ng); the primer sets were Eub338 (5′-ACTCCTACGGGAGGCAGCAG-3′) and Eub518 (5′-ATTACCGCGGCTGCTGG-3′) (Fierer et al., 2005). The thermal cycler conditions were 95°C-3 min; 40 times 95°C-30 s, 59°C-35 s; 72°C-20 s, and acquisition was done at 59°C. The qPCR amplicon products (200 bp) were checked by melting curve analysis and agarose gel electrophoresis. The efficiency of the 16S rDNA qPCR was 96% (R2 = 0.99). Plasmid DNA containing fragments of bacterial amoA and 16S rRNA genes were used as standards. Each qPCR run, in triplicate, included a DNA template, the standard positive control, and a negative control. The primers used for the archaea amoA and bacteria nirS, nirK, and nosZ and the, PCR conditions are described in the Supplementary Table S2.
Sequencing of amoA Amplicons for Ammonia-Oxidizing Bacteria
Primer sets amoA-1F/amoA-2R (Rotthauwe et al., 1997) for AOB (same primers used in the qPCR) were used to amplify the amoA gene fragment for sequencing with Illumina MiSeq sequencing platform. The PCR was carried out in 20 μl reaction containing each 2 μl of deoxynucleoside triphosphate at a concentration of 2.0 mM, 0.25 μl of forward and reverse primers (10 pmol), 0.1 μl of FastStart Taq DNA Polymerase, 2 μl of MgCl2 buffer, and 0.5 μl of BSA (4 mg ml–1). Each reaction mix received 1 μl of genomic DNA as a template. The PCR conditions for the amplicons were: preheating at 95°C for 5 min, then 35 cycles (95°C for 30 s, 53°C for 30 s, and 72°C for 30 s), with a final extension at 72°C for 10 min. Triplicate reaction mixtures per sample were pooled together, purified with the Agarose Gel DNA purification kit (TaKaRa), and quantified using the NanoDrop ND-1000 spectrophotometer (NanoDrop Technologies, Montchanin, DE, United States). The bar-coded PCR products from all samples were normalized in equimolar amounts before sequencing. The amplicon library was prepared by adaptor ligation and PCR using the TruSeq Nano DNA Library Prep Kit (Illumina, CatFC-121-4001) according to the TruSeq nano protocol (Illumina, FC-121-4003). Paired-end MiSeq sequencing was carried out by BGI Inc. (China). The raw amoA sequence data are available at the European Nucleotide Archive (ENA)1 under the study accession number PRJEB25428.
Clustering and Taxonomic Classification of amoA OTUs
The raw data of amoA sequences were preprocessed using MOTHUR v 1.3.3 (Schloss et al., 2009). Raw sequences were merged (make.contigs command), then trimmed and sorted simultaneously (trim.seqs). Sequences were filtered out if average read quality was less than 25, there were more than two N’s or if the read length was less than 150 bp; remaining sequences were filtered based on primer quality (≤ 2 errors), spacers (≤2 errors), and barcodes (≤1 error). Barcodes and primers were removed. Further, the sequences were processed using the UCLUST pipeline implemented in a Snakemake workflow which is available upon request (Edgar, 2010). In summary, the amoA-AOB sequences were truncated to 480 bp, clustered into 90% OTUs and singletons and chimeras were removed (Norton et al., 2002). An OTU table was created at the 90% cutoff level. The OTUs were checked by comparison to the March 17, 2014 KEGG database using UProC version 1.2.0 with the uproc-dna command (Meinicke, 2015); those OTUs that did not match the pmoA-amoA (Particulate methane monooxygenase-ammonia monooxygenase) pathway K10944 were removed (5 of 236 OTUs). To further validate the OTUs, centroids were compared to the October 04, 2016 NCBI-nr database using Diamond version 0.8.20 with the command blastx (Buchfink et al., 2015). The OTUs that were classified by the Last Common Ancestor algorithm from MEGAN version 6.5.8 as Eukaryote were removed (3 of 236 OTUs) (Huson and Weber, 2013). The centroid OTUs were finally classified using BLASTN (evalue cutoff of 0.02) against a custom amoA FunGene database described below which comprised 136 records (Fish et al., 2013). Last, the classification was added to the OTU table using a custom Perl script.
Due to poor classification results from blastx classification against the NCBI-nr database, a custom amoA database was created from FunGene amoA sequences as follows. High-quality amoA sequences with score above 350, size greater than 200 amino acids in length, HMM coverage of more than 85% and defined organism name were downloaded. The NCBI taxonomy of each unique record was obtained using a custom Perl script. The custom amoA sequences were aligned using ClustalW in MEGA7 (Kumar et al., 2016). A neighbor-joining tree (Saitou and Nei, 1987) was created to examine the phylogenetic relationships between the 138 records using as outgroup a Nitrosococcus oceani amoA sequence as shown in Supplementary Figure S2. Distances were computed using the Maximum Composite Likelihood method and a bootstrap test with 1000 replicates was conducted (Felsenstein, 1985). Because the amoA sequences clustered together at least at the Beta-proteobacteria level, the taxonomy of the records originally noted as unclassified Bacteria were updated as unclassified Beta-proteobacteria (see Supplementary Figure S2). We used the Interactive Tree of Life (iTOL) (Letunic and Bork, 2016) to visualize the tree containing the 30 most abundant amoA-AOB OTUs and their nearest neighbors in the custom FunGene amoA sequence database.
Statistical Analyses of Gas Fluxes, Gene Abundances, and amoA OTUs
All statistical analyses, except Spearman correlations, were carried out in RStudio version 1.0.136 running R version 3.3.1. Generalized linear models (Bolker et al., 2009) were used to test the effect of different treatments on N2O fluxes and amoA gene copy numbers using the multcomp package (Hothorn et al., 2008) in R. The differences between treatments were analyzed within each sampling event. Treatments were considered statically significant using p < 0.01 as the criterion. To account for the increasing variation with the increase in the mean, we used Gamma (N2O emission) and Poisson family (amoA and 16S gene copy number) distributions as criteria to the generalized linear models. Subsequently the glht function was used to evaluate the differences among treatments (Tukey p ≤ 0.01). The correlation between N2O flux and amoA-AOB gene abundances were calculated by Spearman correlation analysis in Sigma Plot, version 13.0 (Systatsoftware, 2014).
The phyloseq package was used to handle the amoA-AOB OTU abundance data (McMurdie and Holmes, 2013). The amoA data were rarified to the size of the smallest sample (12,978 sequences) prior to alpha and beta diversity analyses. To determine whether AOB bacterial community diversity differed by treatment or day, Renyi indexes were calculated using the BiodiversityR package and the values for average, normally distributed Shannon and Inverse Simpson indexes were compared between treatments (Tukey’s HSD test with alpha of 0.05) using the multcomp package (Simpson, 1949; Kindt and Kindt, 2015). To test the effect of treatments on AOB bacterial community compositions, the rarified AOB data was ordinated using PCoA using the Bray distance measure. The PERMANOVA test in the vegan package was used to ascertain group significance with 9999 permutations (Oksanen et al., 2015). In parallel, the data was ordinated using correspondence analysis and group significance was assessed with between-groups analysis applying a random permutation test (999 repetitions) from the ade4 package (Dray and Dufour, 2007). Last, a permutation test for homogeneity of multivariate dispersions was run using the “betadisp” function from the vegan package. Group tests were applied for treatment (Control, N, CV+N, and V+N) and day (11, 19, and 45) groups. We also used multivariate regression tree (MRT) analyses (De’ath, 2002) in the R ‘mvpart’ package (Therneau and Atkinson, 1997; De’ath, 2007) to identify the effect of the temporal variation (time) on AOB community composition (Ouellette et al., 2012). For the MRT analysis, the rarified AOB data was log-transformed, and the tree was plotted after 500 cross-validations (Breiman et al., 1984), avoiding overfitting. Subsequently, the function rpart.pca from the mvpart package was used to plot a PCoA of the MTR.
Results
Weather Conditions, Greenhouse Gas Emission, and Soil Analysis
The climatic conditions during the experimental period were shown in Supplementary Figure S1A. The lowest air temperature was 7°C in the beginning of the experiment and the highest 35°C. The mean temperature during the 45-day experiment was 22°C (Supplementary Figure S1A). A similar pattern was observed in soil temperature; the temperature increased throughout the experimental period from 17 to 22°C.
Treatments with inorganic N plus vinasse application (CV or V) had higher N2O emission rates than treatments with only inorganic N and control. At day 11 the emission rate was low due to lack of rain during the previous period, with consumption of N2O in the control treatment (Table 1). The CO2 emissions were similar to N2O emissions, with lower emission at day 11 than in days 19 and 45. The CO2 emissions were higher for treatments with inorganic N plus vinasse in comparison to the control and only N (Supplementary Figure S1B).
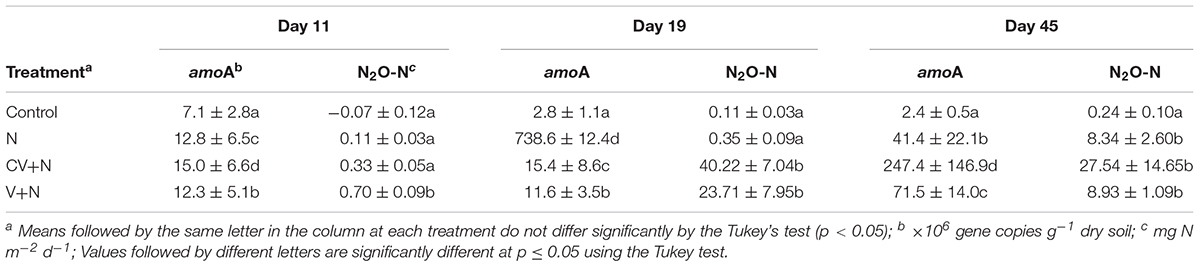
TABLE 1. Ammonia-oxidizing bacteria (amoA-AOB) gene copy numbers (g–1 dry soil) and nitrous oxide (N2O) fluxes (n = 3) for different treatments including Control; N, inorganic N fertilizer; CV+N, concentrated vinasse plus inorganic N fertilizer; V+N, non-concentrated vinasse plus inorganic N fertilizer.
Within treatments, the total NH4+-N content decreased through the time, while NO3–-N content increased (Supplementary Figures S3A,B). The soil pH had overall low variation across treatments; in the CV+N treatment the pH slightly increased while in the inorganic N and V+N treatments the pH decreased through the time (Supplementary Figure S3C). In field conditions where the spatial variation is high, the N2O emissions were correlated with CO2 emissions and other environmental parameters, including soil temperature, WFPS and NO3-N (R2 = 0.87; R2 = 0.37; R2 = 0.51; and R2 = 0.63, respectively) (Figure 1).
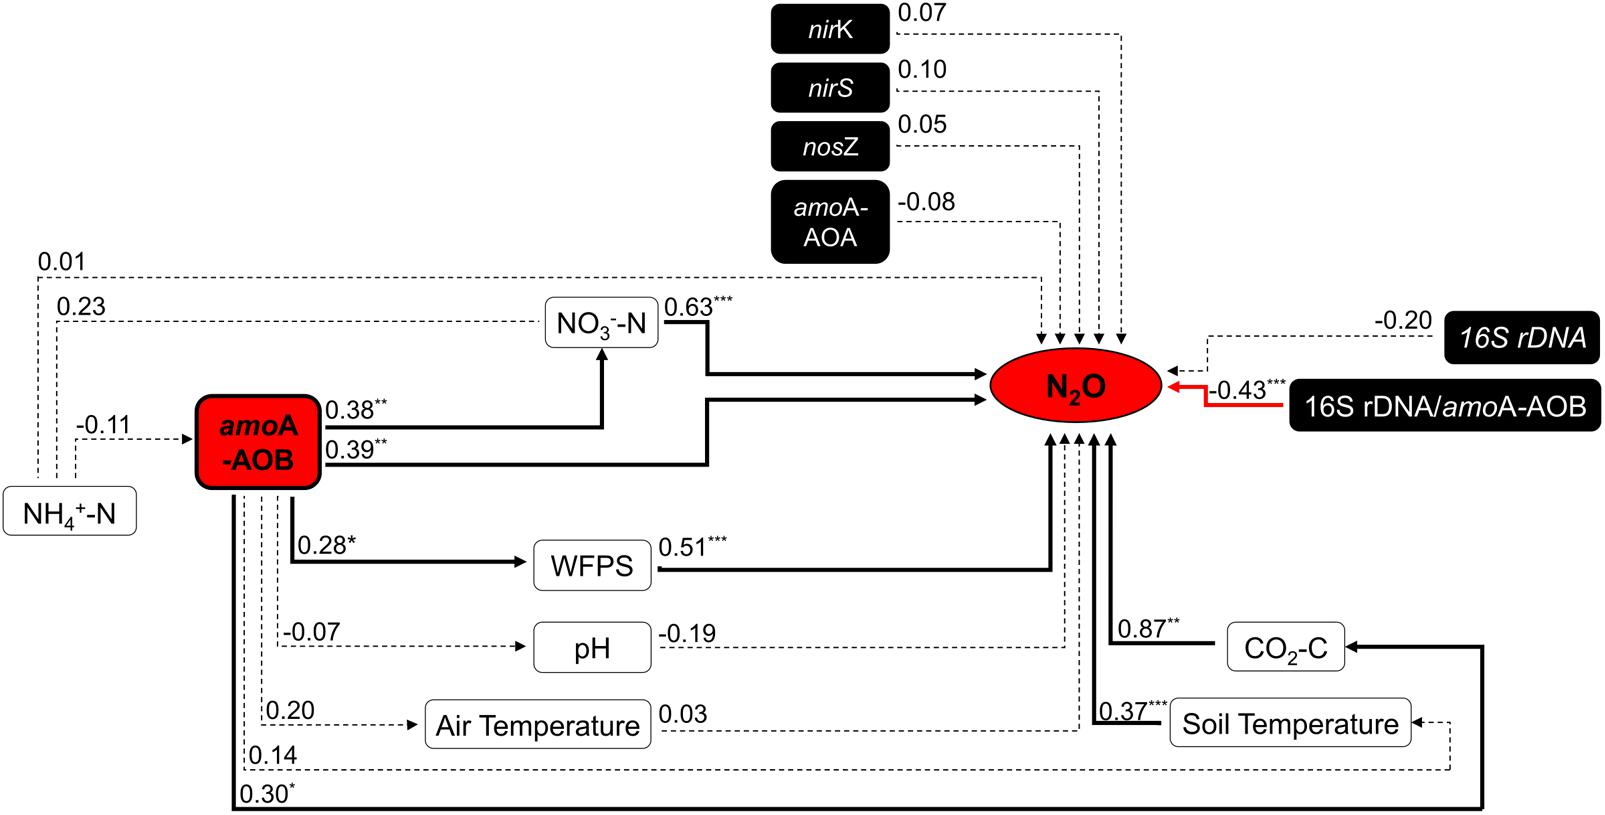
FIGURE 1. Summary of Spearman’s correlations between N2O emission flux (mg N m–2 d–1) and environmental variables, the abundance of bacterial amoA-AOB gene (gene copy g–1 dry soil) and the 16S rDNA/amoA ratio (n = 36). Black bold lines mean significant correlation, red bold lines significant negative correlation, and dotted lines no correlation between variables (n = 36). Significant difference: ∗p ≤ 0.10, ∗∗ p ≤ 0.05, and ∗∗∗p ≤ 0.01. Abbreviations: WFPS, Water-filled pore space; AOB, amoA belonging to ammonia-oxidizing bacteria (AOB).
Gene Abundance and AOB Community Composition Over Time
Inorganic N plus organic vinasse (CV and V) significantly increased AOB amoA gene copy numbers by more than 2, 8, and 51-fold at days 11, 19, and 45, respectively, compared to the control (Table 1). In contrast, the total bacteria (16S rDNA) gene copy number was similar for all treatments. The ratio between the abundance of the total bacteria and the amoA-AOB differed between treatments, and treatments with V or CV had the lowest ratio (Table 2). This suggested that vinasse (CV and V) plus inorganic N treatment increased the amoA gene copies compared with total bacteria. Furthermore, the abundance of amoA genes was significantly correlated with N2O (R2 = 0.39) and CO2 (R2 = 0.30) emissions; in addition, amoA gene abundances increased significantly with WFPS (R2 = 0.28) and soil NO3–-N (R2 = 0.38) values (Figure 1). However, no correlation was found between N2O emission and amoA-AOA and bacterial denitrifier (nirS, nirK, and nosZ) genes copy numbers (Figure 1).
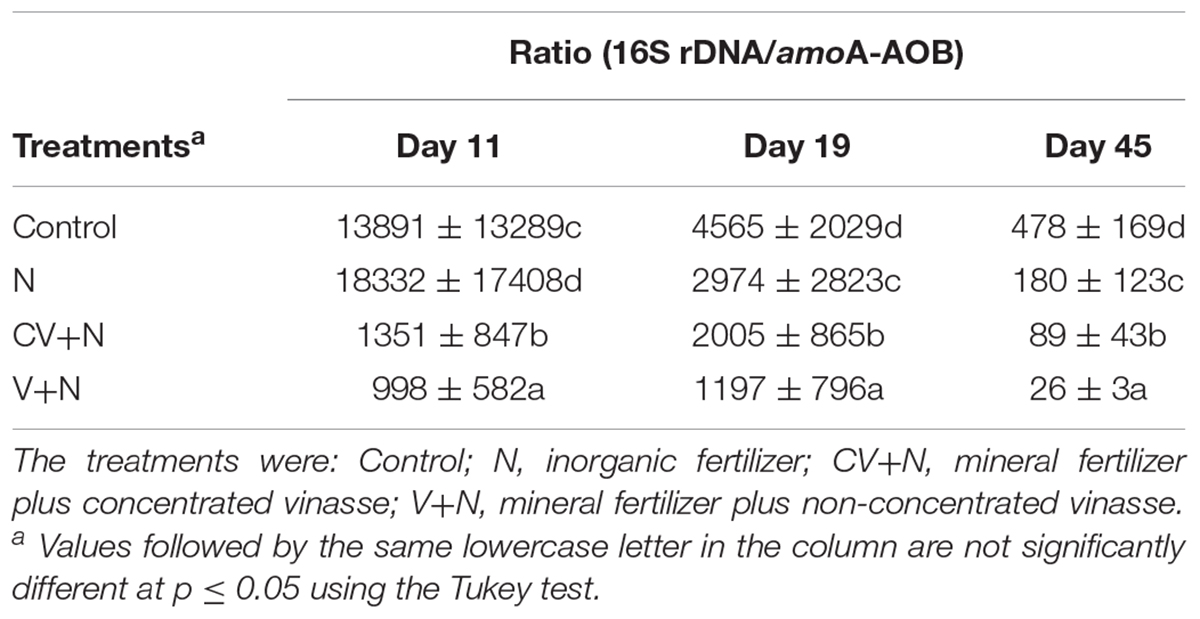
TABLE 2. Ratios between the gene copy numbers (per gram of dry soil) of ammonia-oxidizing bacteria (amoA-AOB) and total bacteria 16S rDNA (n = 3).
Due to positive correlation between amoA-AOB gene copy numbers and N2O emissions, the AOB community was sequenced. A total of 1,661,482 high quality amoA-AOB sequences from 36 samples (4 treatments × 3 time points × 3 replicates) with an average of 46,152 reads (13,213–202,908 reads) per sample were clustered into 236 OTUs for amoA-AOB community analysis. Rarefaction curves indicated that the community diversity was well captured with our sequencing depth (Supplementary Figure S4).
In order to assess the effects of the treatments or day on the amoA-AOB community structure, the taxonomic profiles were compared at different time points using a combination of ordination techniques and dissimilarity tests. Comparative analysis of the AOB community structure revealed no clear separation at the OTU level by treatment. The PERMANOVA and correspondence analysis-between class analysis revealed no differences between treatments based on OTU-level abundances (PERMANOVA: p = 0.54); furthermore, the interaction between treatment and time was not significant (PERMANOVA: p = 0.32) (Supplementary Table S3 and Supplementary Figure S5). To further explore temporal effects, we used a multivariate regression tree (MRT) approach and PCA ordination of the by MRT analysis which further showed that the microbial community composition did not change over time (Error = 0.92) (Supplementary Figure S6). Moreover, the factors treatment or time did not affect alpha-diversity of the AOB communities (OTU richness, Chao1, Simpson, and Shannon) (Supplementary Table S4).
The AOB community present in the soil was composed mainly of the β-Proteobacteria phylum and the Nitrosomonadaceae family, of which 20.8 % belonged to the genus Nitrosospira and 79.2% to unclassified β-proteobacteria (Figure 2). Based on these results, the phylogenetic tree was constructed and all OTUs clustered with Nitrosospira and Nitrosovibrio (now included in the Nitrosospira genus) genus, except 2 OTUs (OTU 23 and OTU165) which clustered with the Nitrosomonas genus (Figure 3). Nitrosospira sp. PJA1 and Nitrosovibrio sp. RY3C were significantly positively correlated (p ≤ 0.10) with N2O-N, NO3-N and the number of amoA gene copies (Table 3). Surprisingly, Nitrosospira multiformis abundances showed significant negative correlations with N2O-N, NO3-N and the amoA gene copy number (p ≤ 0.10).
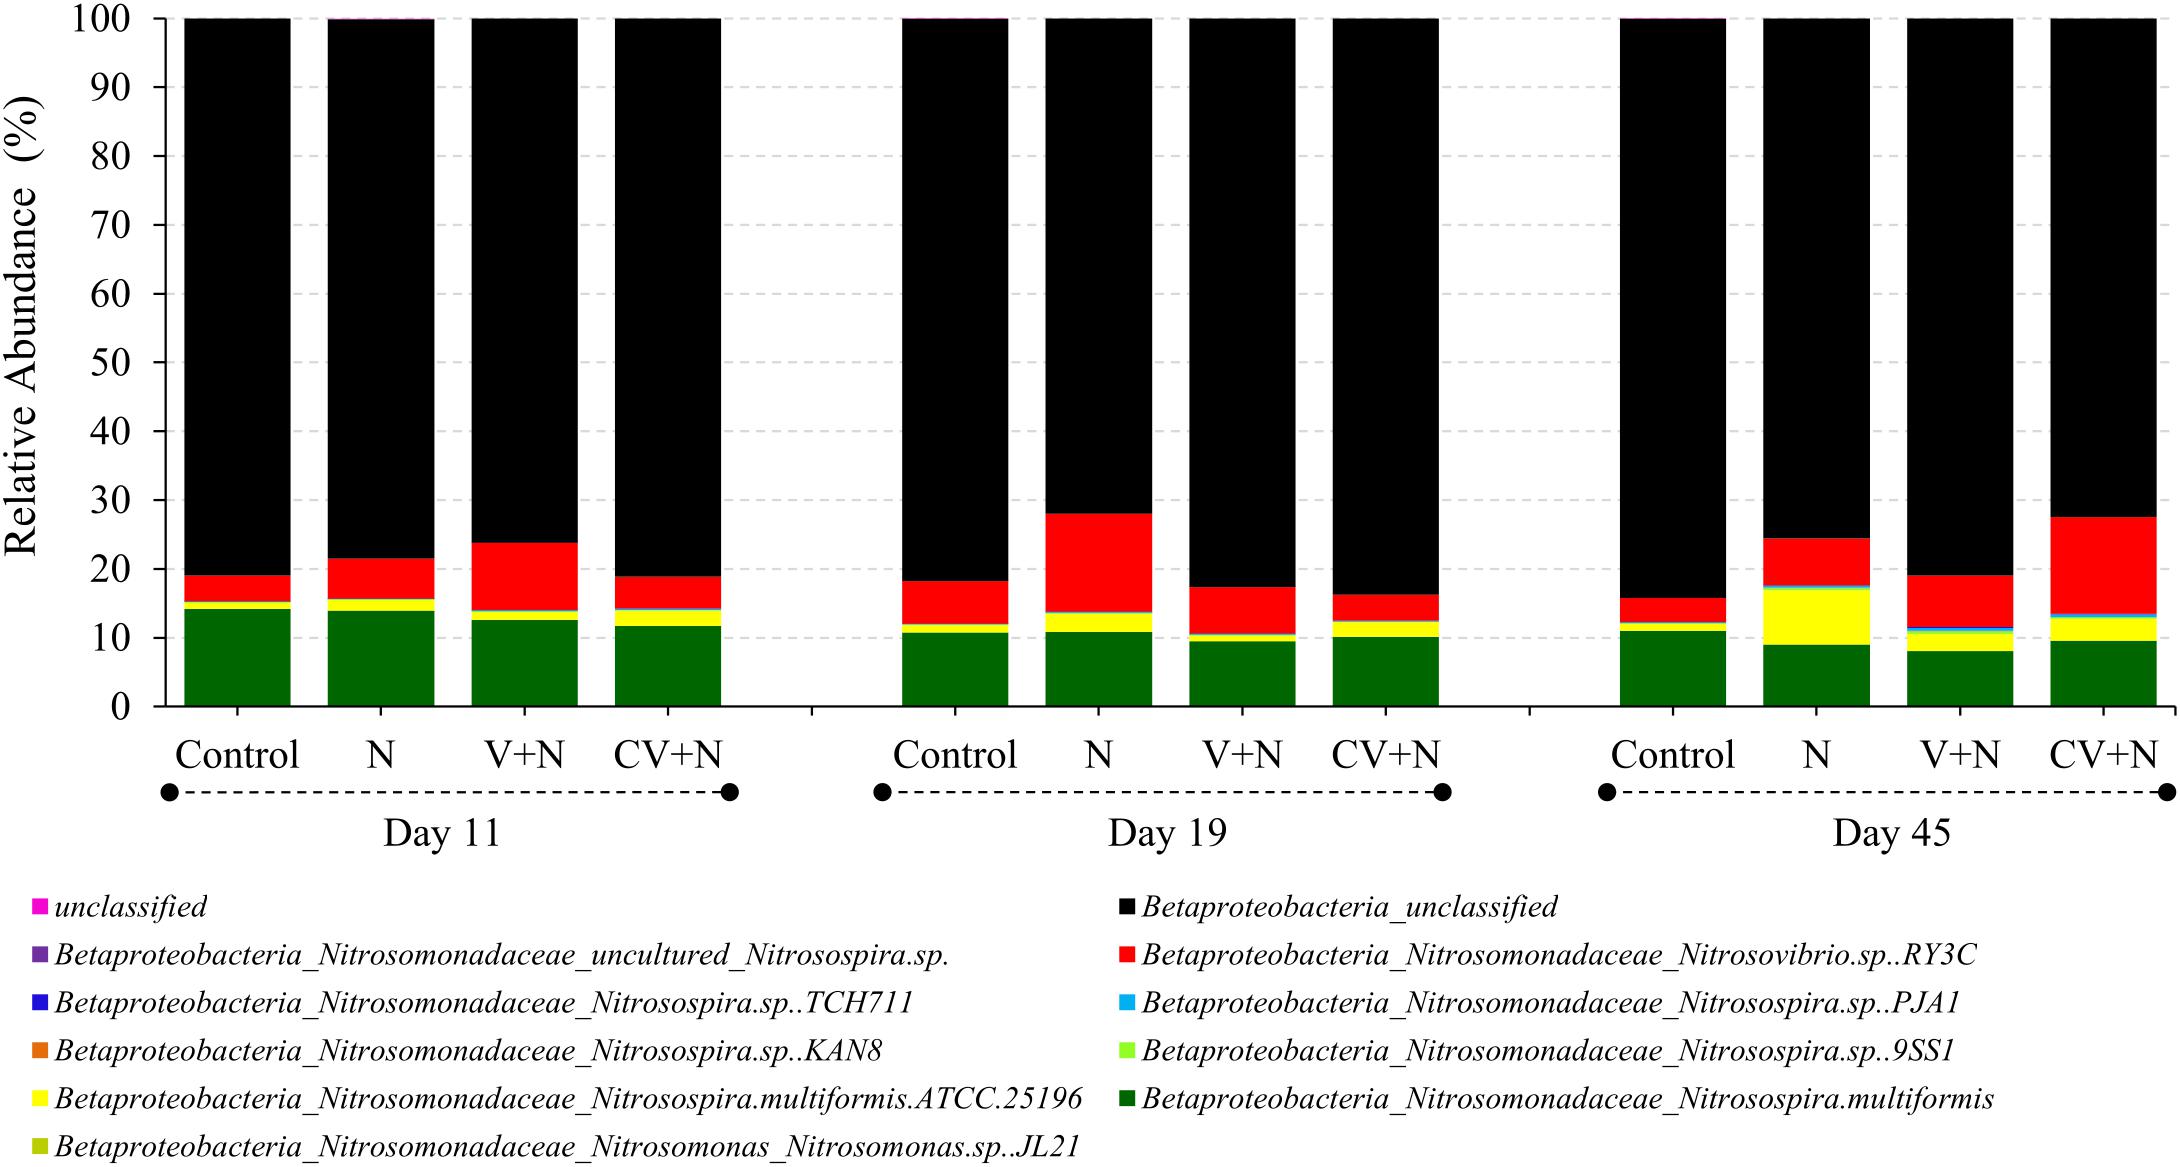
FIGURE 2. Average relative abundances of the AOB community (n = 36) at the level of species. The sequencing reads of amoA-AOB genes were assigned to their taxonomic affiliations of nitrifying bacteria that oxidize ammonia, by comparison to the amoA database in FunGene.
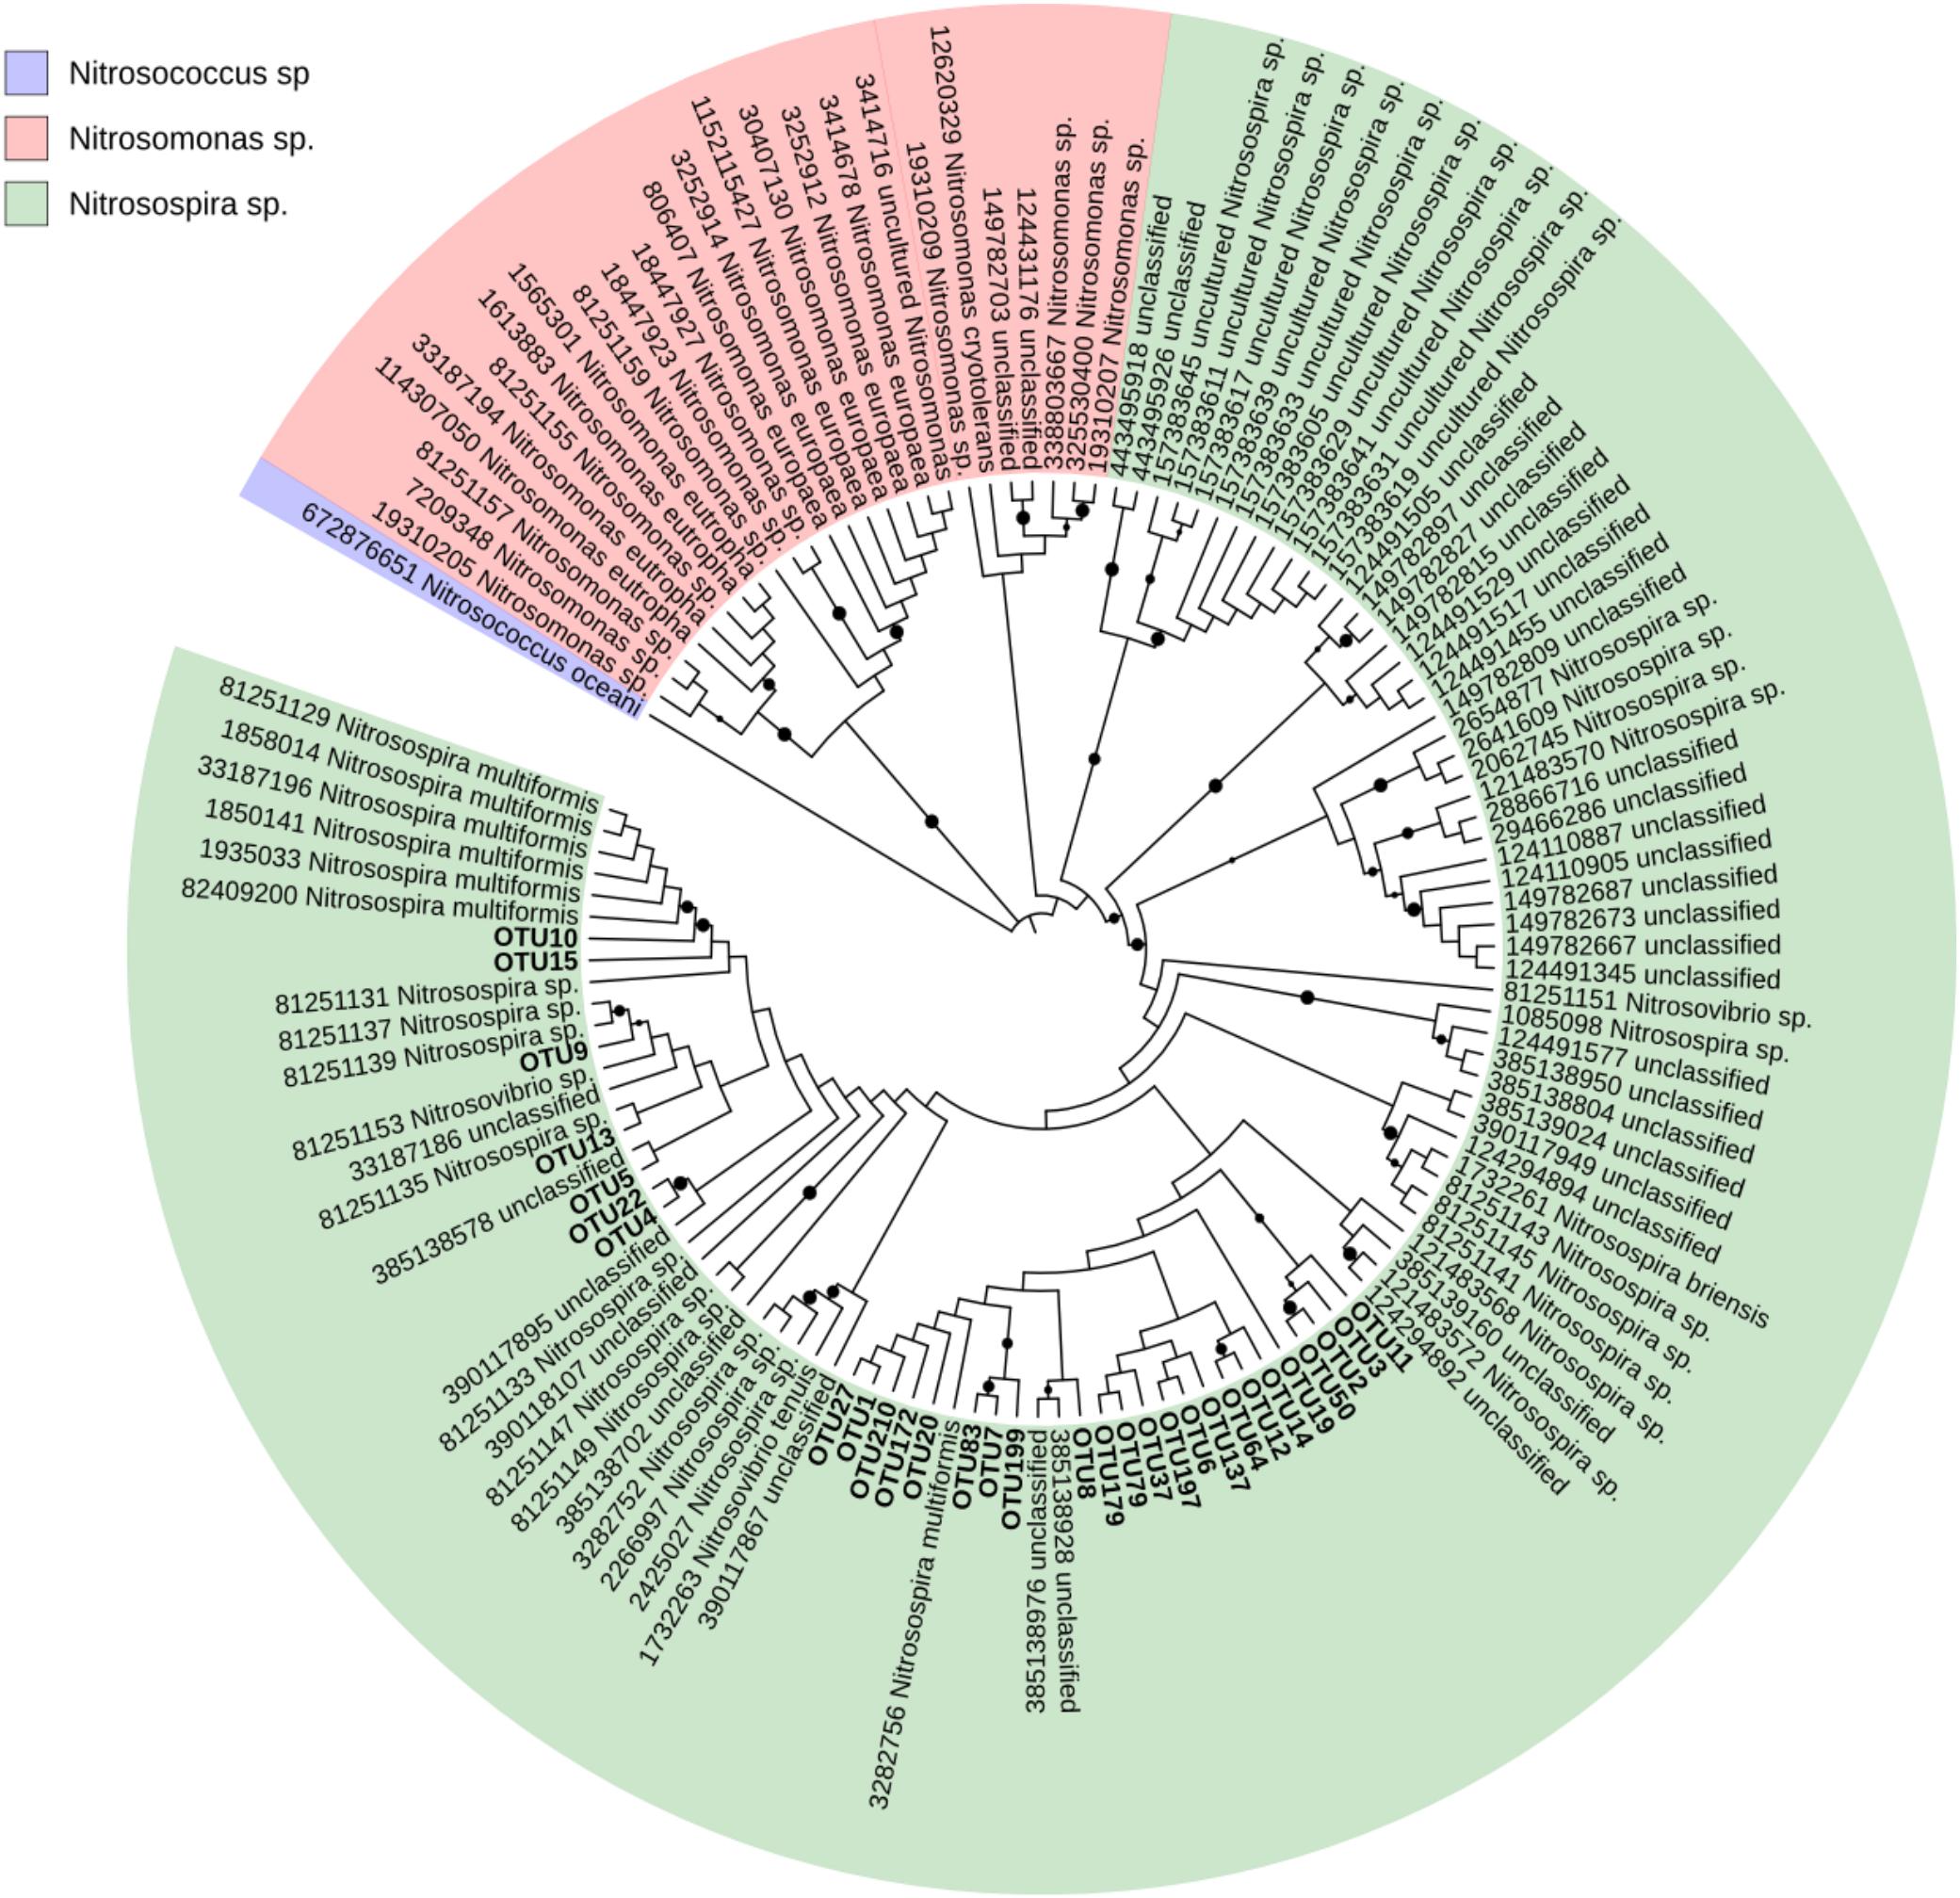
FIGURE 3. Neighbor-joining tree of the 30 most abundant sample amoA-AOB OTUs and their nearest neighbors in the custom FunGene amoA sequence database. The NCBI taxonomic classification of the database entries is included. The outgroup is Nitrosococcus oceani. The percentage of replicate trees in which the associated taxa clustered together in the bootstrap test (1000 replicates) are shown next to the branches (black points mean bootstrap value >75%). Evolutionary distances were computed using the Maximum Composite Likelihood method. The analysis involved 131 sequences and 305 positions and was conducted in MEGA7.
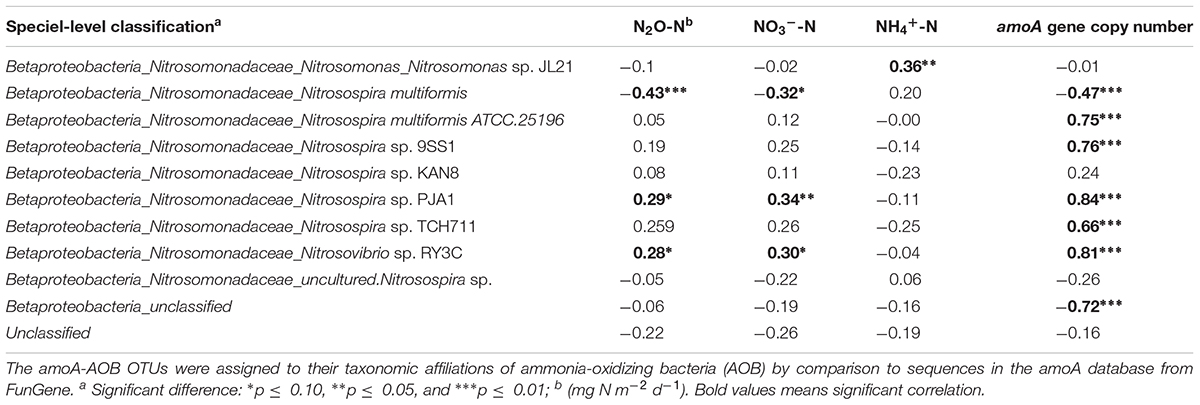
TABLE 3. Spearman’s correlation coefficients between the amoA OTUs (classified at the species level) and amoA gene copy number (determined by qPCR), N2O emission flux and mineral N (NH4+-N and NO3–-N) values.
Discussion
Here we investigated the effect of bioenergy residues (CV and V) plus inorganic N on the abundance of bacteria and nitrifier and denitrifier genes related with N2O emissions, and the structure, composition and diversity of the AOB community in a tropical soil under sugarcane. Nitrification by AOB was previously determined to be the major process contributing to higher N2O emissions in similar tropical soil (Soares et al., 2016) planted with sugarcane due to high drainage capacity. Soares et al. (2016) showed that a NO3– - based fertilizers had similar emission to the control treatment but neither vinasse nor straw were applied in the soil, however, the application of nitrification inhibitor together with urea decreased the N2O emission in 94%. The results showed that denitrification by heterotrophic microbes are not relevant in that condition. In the current study, which was carried out on the same soil type, the addition of inorganic N plus vinasse application (CV and V) boosted high N2O emissions. Vinasse is an organic residue rich in organic compounds with high biological oxygen demand (Fuess and Garcia, 2014). The input of labeled carbon from vinasse in the soils increases soil microbial activities including intense oxygen consumption (Renault et al., 2009) and it creates microoxic or anoxic conditions, resulting in anaerobic microsites (Torbert and Wood, 1992). Both conditions could favor denitrification, including nitrifier denitrification; however, the anaerobic conditions may prevail only for a short time, since the soil drains well and dries in a few hours. This then favors N2O emission by nitrification. Here, the high N2O emissions from treatments with inorganic N plus vinasse application (CV and V) might arise from the fertilizer N in combination with organic N and the organic carbon of vinasse.
In our study the addition of inorganic N plus vinasse application (CV and V) increased the N2O emissions. The high emissions were related with only AOB abundances rather than AOA or heterotrophic denitrifiers abundances. The correlation values between N2O and abundance of AOB is not a strong correlation, however, it is an indication that the AOB community is responsible for the N2O emissions. We have to emphasize that the experiment was in field conditions where the spatial variation is expected to be higher than in laboratory conditions. The AOB are considered aerobic microorganisms, which obtain energy by the oxidation of inorganic N compounds, allowing for N2O emissions from the soil during aerobic conditions. While nitrification by AOB is usually associated with aerobic conditions, N2O production by AOB is also possible via nitrification under suboxic or anoxic conditions, although these situations are still relatively unstudied in soil field conditions (Caranto et al., 2016). Furthermore, nitrifier denitrification by AOB could also play a role in N2O emissions in treatments with organic vinasse, under low oxygen and high concentration of nitrite (Joo et al., 2005; Spott et al., 2011; Zhao et al., 2012; Zhu et al., 2013; Bakken and Frostegård, 2017). The positive correlation between amoA abundance and WFPS due to rain events and vinasse application suggested that nitrification and nitrifier-denitrification processes were occurring during anaerobic conditions (Di et al., 2014). Further research is needed to explore the contribution of nitrifier nitrification versus nitrifier denitrification to N2O emissions under these conditions and the relevant time scales.
The application of different vinasses and inorganic N did not change the AOB community compositions, nor diversity, but did increase the abundance of AOB in the soil. Thus, it is fair to conclude that, in the short time of the experiment, the AOB community structure was resistant to the organic and inorganic fertilization, with no changes in the alpha and beta diversity. Contrasting results were found in the literature, where studies have reported changes in AOB community composition in response to N fertilizers (Glaser et al., 2010; Ouyang et al., 2016; Xiang et al., 2017). Other studies have also reported changes in AOB abundance without a corresponding change in composition with N additions (Phillips et al., 2000; He et al., 2007). Verhamme et al. (2011) found that the abundance and community structure of AOB changed only in the soil treatment with the highest ammonia concentration (200 mg N g–1). In our experiment, we used the N rate recommended for sugarcane fields in Brazil, which is a relatively small input rate of 0.75 mg N g–1. Therefore, we suggest that the community structure of AOB in soils with sugarcane was found to be unchanged after N fertilization due to the low application rate. Moreover, the AOB community in these fields may have already been adapted to the straw and annual application of inorganic fertilizer since sugarcane has been cultivated in this area for more the 20 years. Interestingly, the AOB community is composed globally of only a few species of bacteria in soils. The AOB found in soils generally belong to the β-Proteobacteria Phylum and the Nitrosomonas and mainly Nitrosospira genera (Prosser et al., 2014). There is no reported evidence of γ- Proteobacteria ammonia oxidizers (Nitrosococcus sp.) in soil.
Here, the AOB phylogenetic tree revealed that Nitrosospira was the dominant genus (99.5% of the total AOB community) in the soils under sugarcane. Recently, 16S rRNA and amoA gene sequencing studies have provided evidence that Nitrosospira spp. dominate most natural soil populations (Stephen et al., 1996; Pommerening-Röser and Koops, 2005). Surprisingly, we found only two OTUs with low abundance of Nitrosomonas spp. in this soil. Usually, they are prevalent in soils that have received high inputs of inorganic N (Hastings et al., 1997; Oved et al., 2001) and organic residues (Oved et al., 2001; Taylor and Bottomley, 2006; Habteselassie et al., 2013). Oved et al. (2001) and Habteselassie et al. (2013) showed that Nitrosomonas were not detected in soils that received inorganic fertilizer but were in soils that received liquid dairy waste and wastewater effluent. The low abundance of Nitrosomonas spp. in our study suggested that soil with sugarcane select for Nitrosospira. Even in treatments with the organic vinasse application, Nitrosomonas OTU abundances did not increase. On the other hand, this was the first time that vinasse was applied in the field experiment area.
The dominance of Nitrosospira sp. could be explained by specific conditions such as soil pH, which may have been consistent over the long period of over 20 years that this soil had been for sugarcane production. It has been postulated that pH may select for the presence of Nitrosospira group in acid soil (Pommerening-Röser and Koops, 2005) whereas strains of Nitrosomonas are not common in acidic environments (pH 4–5). The AOB isolated from acidic soils are generally Nitrosospira with ureolytic characteristics. For instance, some of these AOB produced urease enzymes catalyzing the breakdown of urea to ammonia (De Boer and Kowalchuk, 2001). This advantage allows the ureolytic AOB to grow at low pH with urea source (Pommerening-Röser and Koops, 2005; Ma et al., 2008). Our results showed that inorganic N application decrease soil pH over time. Therefore, the continual application of inorganic fertilizers could select the Nitrosospira population by lowering the soil pH.
Contrary to our hypothesis, the AOB community structure did not change with vinasse and inorganic N fertilization. The long-time inorganic N fertilization may have resulted in an AOB community that is adapted to fluctuations in mineral N in the soil, thus resulting in a diminished response of the soil AOB community structure to changes in available mineral N, affecting only the growth of the whole AOB community. Furthermore, soils with sugarcane seem to be enriched in Nitrosospira over Nitrosomonas, and the former was responsible for the N2O emissions from soils fertilized with organic vinasse (CV and V) and inorganic N fertilizer. This study therefore expands the information available about the microbes responsible for the N2O emission to define better strategies for mitigating the N2O emissions in sugarcane agriculture.
Author Contributions
KL, HC, and EK designed the research. KL conducted the experiments and performed the statistical analyses. KL and AP conducted the qPCR and PCR analyses. NC performed the bioinformatic steps. KL, JvV, HC, and EK wrote the paper. All authors reviewed the manuscript.
Funding
This research was supported by FAPESP and The Netherlands Organization for Scientific Research (NWO) Grant Nos. 2013/50365-5 and 729.004.003, FAPESP 2014/24141-5, FAPESP 2013/12716-0, and CNPq 311.197/2013-2. Publication 6506 of the Netherlands Institute of Ecology (NIOO-KNAW).
Conflict of Interest Statement
The authors declare that the research was conducted in the absence of any commercial or financial relationships that could be construed as a potential conflict of interest.
Acknowledgments
The authors thank Dr. André C. Vitti (APTA), Dr. Raffaella Rossetto (APTA), MSc. Rafael M. Sousa, Dr. Zaqueu F. Montezano (IAC), and Dr. Mauricio R. Dimitrov for the technical assistance and MSc. Márcio F. A. Leite for the fitted generalized linear model applied to the data.
Supplementary Material
The Supplementary Material for this article can be found online at: https://www.frontiersin.org/articles/10.3389/fmicb.2018.00674/full#supplementary-material
Footnotes
References
Bakken, L. R., and Frostegård, Å., (2017). Sources and sinks for N2O, can microbiologist help to mitigate N2O emissions? Environ. Microbiol. 19, 4801–4805. doi: 10.1111/1462-2920.13978
Bolker, B. M., Brooks, M. E., Clark, C. J., Geange, S. W., Poulsen, J. R., Stevens, M. H. H., et al. (2009). Generalized linear mixed models: a practical guide for ecology and evolution. Trends Ecol. Evol. (Amst.) 24, 127–135. doi: 10.1016/j.tree.2008.10.008
Breiman, L., Friedman, J. H., Olshen, R. A., and Stone, C. J. (1984). Classification and Regression Trees. Belmont, CA: Wadsworth international group.
Buchfink, B., Xie, C., and Huson, D. H. (2015). Fast and sensitive protein alignment using DIAMOND. Nat. Methods 12, 59–60. doi: 10.1038/nmeth.3176
Canfield, D. E., Glazer, A. N., and Falkowski, P. G. (2010). The evolution and future of earth’s nitrogen cycle. Science 330, 192–196. doi: 10.1126/science.1186120
Caranto, J. D., Vilbert, A. C., and Lancaster, K. M. (2016). Nitrosomonas europaea cytochrome P460 is a direct link between nitrification and nitrous oxide emission. Proc. Natl. Acad. Sci. U.S.A. 113, 14704–14709. doi: 10.1073/pnas.1611051113
Carmo, J. B. D., Filoso, S., Zotelli, L. C., De Sousa Neto, E. R., Pitombo, L. M., Duarte-Neto, P. J., et al. (2013). Infield greenhouse gas emissions from sugarcane soils in Brazil: effects from synthetic and organic fertilizer application and crop trash accumulation. GCB Bioenergy 5, 267–280. doi: 10.1111/j.1757-1707.2012.01199.x
Christofoletti, C. A., Escher, J. P., Correia, J. E., Marinho, J. F. U., and Fontanetti, C. S. (2013). Sugarcane vinasse: environmental implications of its use. Waste Manag. 33, 2752–2761. doi: 10.1016/j.wasman.2013.09.005
CONAB (2017). Acompanhamento da Safra Brasileira de Cana-de-Açúcar: V. 3 - SAFRA 2016/17 N. 3. Available at: http://www.conab.gov.br [accessed October 15, 2017].
Daims, H., Lebedeva, E. V., Pjevac, P., Han, P., Herbold, C., Albertsen, M., et al. (2015). Complete nitrification by Nitrospira bacteria. Nature 528, 504–509. doi: 10.1038/nature16461
De Boer, W., and Kowalchuk, G. A. (2001). Nitrification in acid soils: micro-organisms and mechanisms. Soil Biol. Biochem. 33, 853–866. doi: 10.1016/S0038-0717(00)00247-9
De Figueiredo, E. B., and La Scala, N. Jr. (2011). Greenhouse gas balance due to the conversion of sugarcane areas from burned to green harvest in Brazil. Agric. Ecosyst. Environ. 141, 77–85. doi: 10.1016/j.agee.2011.02.014
De’ath, G. (2002). Multivariate regression trees: a new technique for modeling species–environment relationships. Ecology 83, 1105–1117. doi: 10.2307/3071917
De’ath, G. (2007). mvpart: Multivariate Partitioning, R Package Version 1.6–2. Available at: http://CRAN.R-project.org/package=mvpart
Di, H. J., Cameron, K. C., Podolyan, A., and Robinson, A. (2014). Effect of soil moisture status and a nitrification inhibitor, dicyandiamide, on ammonia oxidizer and denitrifier growth and nitrous oxide emissions in a grassland soil. Soil Biol. Biochem. 73, 59–68. doi: 10.1016/j.soilbio.2014.02.011
Dray, S., and Dufour, A. B. (2007). The ade4 package: implementing the duality diagram for ecologists. J. Stat. Softw. 22, 1–20. doi: 10.18637/jss.v022.i04
Edgar, R. C. (2010). Search and clustering orders of magnitude faster than BLAST. Bioinformatics 26, 2460–2461. doi: 10.1093/bioinformatics/btq461
Elia-Neto, A., and Nakahodo, T. (1995). Caracterização Físico-Química da Vinhaça Projeto - 9500278. Relatório Técnico da Seção de Tecnologia de Tratamento de Águas do Centro de Tecnologia. Piracicaba: Copersucar, 26.
FAO (2015). World Reference Base for Soil Resources 2014, update 2015. International Soil Classification System for Naming Soils and Creating Legends for Soil Maps. World Soil Resources Reports No. 106. Rome: Food and Agriculture Organization of the United Nations, 203.
Felsenstein, J. (1985). Confidence limits on phylogenies: an approach using the bootstrap. Evolution 39, 783–791. doi: 10.1111/j.1558-5646.1985.tb00420.x
Fierer, N., Jackson, J. A., Vilgalys, R., and Jackson, R. B. (2005). Assessment of soil microbial community structure by use of taxon-specific quantitative PCR assays. Appl. Environ. Microbiol. 71, 4117–4120. doi: 10.1128/aem.71.7.4117-4120.2005
Fish, J. A., Chai, B., Wang, Q., Sun, Y., Brown, C. T., Tiedje, J. M., et al. (2013). FunGene: the functional gene pipeline and repository. Front. Microbiol. 4:291. doi: 10.3389/fmicb.2013.00291
Fuess, L. T., and Garcia, M. L. (2014). Implications of stillage land disposal: a critical review on the impacts of fertigation. J. Environ. Manage. 145, 210–229. doi: 10.1016/j.jenvman.2014.07.003
Galdos, M. V., Cerri, C. C., Lal, R., Bernoux, M., Feigl, B., and Cerri, C. E. P. (2010). Net greenhouse gas fluxes in Brazilian ethanol production systems. GCB Bioenergy 2, 37–44. doi: 10.1111/j.1757-1707.2010.01037.x
Glaser, K., Hackl, E., Inselsbacher, E., Strauss, J., Wanek, W., Zechmeister-Boltenstern, S., et al. (2010). Dynamics of ammonia-oxidizing communities in barley-planted bulk soil and rhizosphere following nitrate and ammonium fertilizer amendment. FEMS Microbiol. Ecol. 74, 575–591. doi: 10.1111/j.1574-6941.2010.00970.x
Goreau, T. J., Kaplan, W. A., Wofsy, S. C., Mcelroy, M. B., Valois, F. W., and Watson, S. W. (1980). Production of NO2- and N2O by nitrifying bacteria at reduced concentrations of oxygen. Appl. Environ. Microbiol. 40, 526–532.
Habteselassie, M., Xu, L., and Norton, J. (2013). Ammonia-oxidizer communities in an agricultural soil treated with contrasting nitrogen sources. Front. Microbiol. 4:326. doi: 10.3389/fmicb.2013.00326
Hastings, R. C., Ceccherini, M. T., Miclaus, N., Saunders, J. R., Bazzicalupo, M., and Mccarthy, A. J. (1997). Direct molecular biological analysis of ammonia oxidising bacteria populations in cultivated soil plots treated with swine manure. FEMS Microbiol. Ecol. 23, 45–54. doi: 10.1111/j.1574-6941.1997.tb00390.x
He, J.-Z., Shen, J.-P., Zhang, L.-M., Zhu, Y.-G., Zheng, Y.-M., Xu, M.-G., et al. (2007). Quantitative analyses of the abundance and composition of ammonia-oxidizing bacteria and ammonia-oxidizing archaea of a Chinese upland red soil under long-term fertilization practices. Environ. Microbiol. 9, 2364–2374. doi: 10.1111/j.1462-2920.2007.01358.x
Hothorn, T. H., Hornik, K., Van De Wiel, M. A., and Zeileis, A. (2008). Implementing a class of permutation tests: the coin package. J. Stat. Softw. 28, 1–23. doi: 10.18637/jss.v028.i08
Hu, H.-W., Chen, D., and He, J.-Z. (2015). Microbial regulation of terrestrial nitrous oxide formation: understanding the biological pathways for prediction of emission rates. FEMS Microbiol. Rev. 39, 729–749. doi: 10.1093/femsre/fuv021
Huson, D. H., and Weber, N. (2013). “Chapter twenty-one - microbial community analysis using MEGAN,” in Methods in Enzymology, ed. E. F. Delong (Amsterdam: Elsevier), 465–485.
IPCC (2013). Anthropogenic and Natural Radiative Forcing. In: Climate Change 2013: The Physical Science Basis. Contribution of Working Group I to the Fifth Assessment Report of the Intergovernmental Panel on Climate Change [Online]. Available at: https://www.ipcc.ch/pdf/assessment-report/ar5/wg1/WG1AR5_Chapter08_FINAL.pdf
Jones, C. M., Graf, D. R. H., Bru, D., Philippot, L., and Hallin, S. (2013). The unaccounted yet abundant nitrous oxide-reducing microbial community: a potential nitrous oxide sink. ISME J. 7, 417–426. doi: 10.1038/ismej.2012.125
Joo, H.-S., Hirai, M., and Shoda, M. (2005). Characteristics of ammonium removal by heterotrophic nitrification-aerobic denitrification by Alcaligenes faecalis No. 4. J. Biosci. Bioeng. 100, 184–191. doi: 10.1263/jbb.100.184
Kamphake, L. J., Hannah, S. A., and Cohen, J. M. (1967). Automated analysis for nitrate by hydrazine reduction. Water Res. 1, 205–216. doi: 10.1016/0043-1354(67)90011-5
Kindt, R., and Kindt, M. R. (2015). Package ‘BiodiversityR’. Available at: https://CRAN.R-project.org/package=BiodiversityR.
Krom, M. D. (1980). Spectrophotometric determination of ammonia: a study of a modified Berthelot reaction using salicylate and dichloroisocyanurate. Analyst 105, 305–316. doi: 10.1039/AN9800500305
Kumar, S., Stecher, G., and Tamura, K. (2016). MEGA7: Molecular evolutionary genetics analysis version 7.0 for bigger datasets. Mol. Biol. Evol. 33, 1870–1874. doi: 10.1093/molbev/msw054
Letunic, I., and Bork, P. (2016). Interactive tree of life (iTOL) v3: an online tool for the display and annotation of phylogenetic and other trees. Nucleic Acids Res. 44, W242–W245. doi: 10.1093/nar/gkw290
Ma, W. K., Bedard-Haughn, A., Siciliano, S. D., and Farrell, R. E. (2008). Relationship between nitrifier and denitrifier community composition and abundance in predicting nitrous oxide emissions from ephemeral wetland soils. Soil Biol. Biochem. 40, 1114–1123. doi: 10.1016/j.soilbio.2007.12.004
Macedo, I. C., Seabra, J. E. A., and Silva, J. E. A. R. (2008). Greenhouse gases emissions in the production and use of ethanol from sugarcane in Brazil: the 2005/2006 averages and a prediction for 2020. Biomass Bioenergy 32, 582–595. doi: 10.1016/j.biombioe.2007.12.006
Mathieu, O., Hénault, C., Lévêque, J., Baujard, E., Milloux, M. J., and Andreux, F. (2006). Quantifying the contribution of nitrification and denitrification to the nitrous oxide flux using 15N tracers. Environ. Pollut. 144, 933–940. doi: 10.1016/j.envpol.2006.02.005
McMurdie, P. J., and Holmes, S. (2013). phyloseq: an R package for reproducible interactive analysis and graphics of microbiome census data. PLoS One 8:e61217. doi: 10.1371/journal.pone.0061217
Meinicke, P. (2015). UProC: tools for ultra-fast protein domain classification. Bioinformatics 31, 1382–1388. doi: 10.1093/bioinformatics/btu843
Nelson, M. B., Martiny, A. C., and Martiny, J. B. H. (2016). Global biogeography of microbial nitrogen-cycling traits in soil. Proc. Natl. Acad. Sci. U.S.A. 113, 8033–8040. doi: 10.1073/pnas.1601070113
Norton, J. M., Alzerreca, J. J., Suwa, Y., and Klotz, M. G. (2002). Diversity of ammonia monooxygenase operon in autotrophic ammonia-oxidizing bacteria. Arch. Microbiol. 177, 139–149. doi: 10.1007/s00203-001-0369-z
Oksanen, J., Blanchet, F. G., Kindt, R., Legendre, P., Minchin, P. R., O’hara, R., et al. (2015). Package ‘vegan’. Community Ecology Package, Version, 2.2–1. Available at: https://github.com/vegandevs/vegan
Ouellette, M.-H., Legendre, P., and Borcard, D. (2012). Cascade multivariate regression tree: a novel approach for modelling nested explanatory sets. Methods Ecol. Evol. 3, 234–244. doi: 10.1111/j.2041-210X.2011.00171.x
Ouyang, Y., Norton, J. M., Stark, J. M., Reeve, J. R., and Habteselassie, M. Y. (2016). Ammonia-oxidizing bacteria are more responsive than archaea to nitrogen source in an agricultural soil. Soil Biol. Biochem. 96, 4–15. doi: 10.1016/j.soilbio.2016.01.012
Oved, T., Shaviv, A., Goldrath, T., Mandelbaum, R. T., and Minz, D. (2001). Influence of effluent irrigation on community composition and function of ammonia-oxidizing bacteria in soil. Appl. Environ. Microbiol. 67, 3426–3433. doi: 10.1128/AEM.67.8.3426-3433.2001
Paredes, D. S., Alves, B. J. R., Dos Santos, M. A., Bolonhezi, D., Sant’Anna, S. A., Urquiaga, S., et al. (2015). Nitrous oxide and methane fluxes following ammonium sulfate and vinasse application on sugar cane soil. Environ. Sci. Technol. 49, 11209–11217. doi: 10.1021/acs.est.5b01504
Paredes, D. S., Lessa, A. C. R., de Sant’Anna, S. A. C., Boddey, R. M., Urquiaga, S., and Alves, B. J. R. (2014). Nitrous oxide emission and ammonia volatilization induced by vinasse and N fertilizer application in a sugarcane crop at Rio de Janeiro, Brazil. Nutr. Cycling Agroecosyst. 98, 41–55. doi: 10.1007/s10705-013-9594-5
Philippot, L., Hallin, S., and Schloter, M. (2007). Ecology of denitrifying prokaryotes in agricultural soil. Adv. Agron. 96, 249–305. doi: 10.1016/S0065-2113(07)96003-4
Phillips, C. J., Harris, D., Dollhopf, S. L., Gross, K. L., Prosser, J. I., and Paul, E. A. (2000). Effects of agronomic treatments on structure and function of ammonia-oxidizing communities. Appl. Environ. Microbiol. 66, 5410–5418. doi: 10.1128/AEM.66.12.5410-5418.2000
Pitombo, L. M., Do Carmo, J. B., De Hollander, M., Rossetto, R., López, M. V., Cantarella, H., et al. (2015). Exploring soil microbial 16S rRNA sequence data to increase carbon yield and nitrogen efficiency of a bioenergy crop. GCB Bioenergy 8, 867–879. doi: 10.1111/gcbb.12284
Pommerening-Röser, A., and Koops, H.-P. (2005). Environmental pH as an important factor for the distribution of urease positive ammonia-oxidizing bacteria. Microbiol. Res. 160, 27–35. doi: 10.1016/j.micres.2004.09.006
Prosser, J. I., Head, I. M., and Stein, L. Y. (2014). “The family Nitrosomonadaceae,” in The prokaryotes: Alphaproteobacteria and Betaproteobacteria, eds E. Rosenberg, E. F. Delong, S. Lory, E. Stackebrandt, and F. Thompson (Berlin: Springer), 901–918.
Ravishankara, A. R., Daniel, J. S., and Portmann, R. W. (2009). Nitrous Oxide (N2O): The dominant ozone-depleting substance emitted in the 21st century. Science 326, 123–125. doi: 10.1126/science.1176985
Renault, P., Cazevieille, P., Verdier, J., Lahlah, J., Clara, C., and Favre, F. (2009). Variations in the cation exchange capacity of a ferralsol supplied with vinasse, under changing aeration conditions. Geoderma 154, 101–110. doi: 10.1016/j.geoderma.2009.10.003
Ritchie, G. A. F., and Nicholas, D. J. D. (1972). Identification of the sources of nitrous oxide produced by oxidative and reductive processes in Nitrosomonas europaea. Biochem. J. 126, 1181–1191. doi: 10.1042/bj1261181
Rodrigues Reis, C. E., and Hu, B. (2017). Vinasse from sugarcane ethanol production: better treatment or better utilization? Front. Energy Res. 5:7. doi: 10.3389/fenrg.2017.00007
Rotthauwe, J. H., Witzel, K. P., and Liesack, W. (1997). The ammonia monooxygenase structural gene amoA as a functional marker: molecular fine-scale analysis of natural ammonia-oxidizing populations. Appl. Environ. Microbiol. 63, 4704–4712.
Saitou, N., and Nei, M. (1987). The neighbor-joining method: a new method for reconstructing phylogenetic trees. Mol. Biol. Evol. 4, 406–425. doi: 10.1093/oxfordjournals.molbev.a040454
Schloss, P. D., Westcott, S. L., Ryabin, T., Hall, J. R., Hartmann, M., Hollister, E. B., et al. (2009). Introducing mothur: open-source, platform-independent, community-supported software for describing and comparing microbial communities. Appl. Environ. Microbiol. 75, 7537–7541. doi: 10.1128/aem.01541-09
Seabra, J. E. A., Macedo, I. C., Chum, H. L., Faroni, C. E., and Sarto, C. A. (2011). Life cycle assessment of Brazilian sugarcane products: GHG emissions and energy use. Biofuels Bioproducts Biorefining 5, 519–532. doi: 10.1002/bbb.289
Shaw, L. J., Nicol, G. W., Smith, Z., Fear, J., Prosser, J. I., and Baggs, E. M. (2006). Nitrosospira spp. can produce nitrous oxide via a nitrifier denitrification pathway. Environ. Microbiol. 8, 214–222. doi: 10.1111/j.1462-2920.2005.00882.x
Shi, X., Hu, H.-W., Zhu-Barker, X., Hayden, H., Wang, J., Suter, H., et al. (2017). Nitrifier-induced denitrification is an important source of soil nitrous oxide and can be inhibited by a nitrification inhibitor 3,4-dimethylpyrazole phosphate. Environ. Microbiol. 19, 4851–4865. doi: 10.1111/1462-2920.13872
Siqueira Neto, M., Galdos, M. V., Feigl, B. J., Cerri, C. E. P., and Cerri, C. C. (2016). Direct N2O emission factors for synthetic N-fertilizer and organic residues applied on sugarcane for bioethanol production in Central-Southern Brazil. GCB Bioenergy 8, 269–280. doi: 10.1111/gcbb.12251
Smith, P. S., and Hein, G. E. (1960). The alleged role of nitroxyl in certain reactions of aldehydes and alkyl halides1. J. Am. Chem. Soc. 82, 5731–5740. doi: 10.1021/ja01506a043
Soares, J. R., Cassman, N. A., Kielak, A. M., Pijl, A., Carmo, J. B., Lourenço, K. S., et al. (2016). Nitrous oxide emission related to ammonia-oxidizing bacteria and mitigation options from N fertilization in a tropical soil. Sci. Rep. 6:30349. doi: 10.1038/srep30349
Spott, O., Russow, R., and Stange, C. F. (2011). Formation of hybrid N2O and hybrid N2 due to codenitrification: first review of a barely considered process of microbially mediated N-nitrosation. Soil Biol. Biochem. 43, 1995–2011. doi: 10.1016/j.soilbio.2011.06.014
Stephen, J. R., Mccaig, A. E., Smith, Z., Prosser, J. I., and Embley, T. M. (1996). Molecular diversity of soil and marine 16S rRNA gene sequences related to beta-subgroup ammonia-oxidizing bacteria. Appl. Environ. Microbiol. 62, 4147–4154.
Taylor, A. E., and Bottomley, P. J. (2006). Nitrite production by Nitrosomonas europaea and Nitrosospira sp. AV in soils at different solution concentrations of ammonium. Soil Biol. Biochem. 38, 828–836. doi: 10.1016/j.soilbio.2005.08.001
Therneau, T. M., and Atkinson, E. J. (1997). An Introduction to Recursive Partitioning using the RPART Routines. Technical Report. Rochester, MN: Mayo foundation.
Torbert, H. A., and Wood, C. W. (1992). Effects of soil compaction and water-filled pore space on soil microbial activity and N losses. Commun. Soil Sci. Plant Anal. 23, 1321–1331. doi: 10.1080/00103629209368668
van Kessel, M. A. H. J., Speth, D. R., Albertsen, M., Nielsen, P. H., Op den Camp, H. J. M., Kartal, B., et al. (2015). Complete nitrification by a single microorganism. Nature 528, 555–559. doi: 10.1038/nature16459
Verhamme, D. T., Prosser, J. I., and Nicol, G. W. (2011). Ammonia concentration determines differential growth of ammonia-oxidising archaea and bacteria in soil microcosms. ISME J. 5, 1067–1071. doi: 10.1038/ismej.2010.191
Wrage, N., Velthof, G. L., Van Beusichem, M. L., and Oenema, O. (2001). Role of nitrifier denitrification in the production of nitrous oxide. Soil Biol. Biochem. 33, 1723–1732. doi: 10.1016/S0038-0717(01)00096-7
Xiang, X., He, D., He, J.-S., Myrold, D. D., and Chu, H. (2017). Ammonia-oxidizing bacteria rather than archaea respond to short-term urea amendment in an alpine grassland. Soil Biol. Biochem. 107, 218–225. doi: 10.1016/j.soilbio.2017.01.012
Zhao, B., An, Q., He, Y. L., and Guo, J. S. (2012). N2O and N2 production during heterotrophic nitrification by Alcaligenes faecalis strain NR. Bioresour. Technol. 116, 379–385. doi: 10.1016/j.biortech.2012.03.113
Keywords: nitrogen and carbon biochemical cycles, recycling, vinasse, quantitative real time PCR, amoA gene, sugarcane
Citation: Lourenço KS, Cassman NA, Pijl AS, van Veen JA, Cantarella H and Kuramae EE (2018) Nitrosospira sp. Govern Nitrous Oxide Emissions in a Tropical Soil Amended With Residues of Bioenergy Crop. Front. Microbiol. 9:674. doi: 10.3389/fmicb.2018.00674
Received: 09 December 2017; Accepted: 22 March 2018;
Published: 10 April 2018.
Edited by:
Maria J. Delgado, Consejo Superior de Investigaciones Científicas (CSIC), SpainReviewed by:
Xuesong Luo, Huazhong Agricultural University, ChinaMuhammad Ali, King Abdullah University of Science and Technology, Saudi Arabia
Copyright © 2018 Lourenço, Cassman, Pijl, van Veen, Cantarella and Kuramae. This is an open-access article distributed under the terms of the Creative Commons Attribution License (CC BY). The use, distribution or reproduction in other forums is permitted, provided the original author(s) and the copyright owner are credited and that the original publication in this journal is cited, in accordance with accepted academic practice. No use, distribution or reproduction is permitted which does not comply with these terms.
*Correspondence: Eiko E. Kuramae, E.Kuramae@nioo.knaw.nl