 Yosep Ji
 Soyoung Park1
 Haryung Park
 Hyeunkil Shin
 Wilhelm H. Holzapfel
- 1Graduate School of Advanced Green Energy and Environment, Handong Global University, Pohang, South Korea
- 2School of Life Sciences, Handong Global University, Pohang, South Korea
- 3Research Group of Industrial Microbiology and Food Biotechnology, Department of Bioengineering Sciences, Vrije Universiteit Brussel, Brussels, Belgium
Gut microbiota play a key role in the development of metabolic disorders. Defining and correlating structural shifts in gut microbial assemblages with conditions related to metabolic syndrome have, however, been proven difficult. Results from 16S genomic DNA and 16S ribosomal RNA analyses of fecal samples may differ widely, leading to controversial information on the whole microbial community and metabolically active microbiota. Using a C57BL/6J murine model, we compared data from 16S genomic DNA and ribosomal RNA of the fecal microbiota. The study included three groups of experimental animals comprising two groups with high fat diet induced obesity (DIO) while a third group (control) received a low fat diet. One of the DIO groups was treated with the probiotic Lactobacillus rhamnosus GG (LGG). Compared to the data obtained by DNA analysis, a significantly higher abundance of OTUs was accounted for by RNA analysis. Moreover, rRNA based analysis showed a modulation of the active gut microbial population in the DIO group receiving LGG, thus reflecting a change in the induced obesity status of the host. As one of the most widely studied probiotics the functionality of LGG has been linked to the alleviation of metabolic syndrome, and, in some cases, to an impact on the microbiome. Yet, it appears that no study has reported thus far on modulation of the active microbiota by LGG treatment. It is postulated that the resulting impact on calorie consumption affects weight gain concomitantly with modulation of the functional structure of the gut microbial population. Using the 16S rRNA based approach therefore decisively increased the precision of gut microbiota metagenome analysis.
Introduction
Application of novel techniques such as those based on culturomics has revealed a hitherto unexpected complexity of the human gut microbiome; numerous microbial taxonomic units have only recently been detected, bringing the estimated number of microbial species to more than 1500 at present (Lagier et al., 2016; Utzschneider et al., 2016). The microbiome of the human gastrointestinal tract (GIT) varies among healthy individuals (Human Microbiome Project Consortium, 2012; Yatsunenko et al., 2012), but its overall balance will decisively influence the functioning of the metabolic, mental and immune systems of the host (Nicholson et al., 2012; Sanz et al., 2015; Ussar et al., 2015; Liu, 2017). Bäckhed et al. (2004) have shown earlier that gut microbiota serve as an environmental factor to regulate fat storage. While shifts or alterations in the autochthonous microbial population of people suffering from metabolic diseases have been reported frequently (Turnbaugh et al., 2006; Cani et al., 2008; Raoult, 2008; Armougom et al., 2009; Cani and Delzenne, 2009; Larsen et al., 2010; Zhang et al., 2013; Kasai et al., 2015; Ussar et al., 2015), this issue has, however, remained controversial, since an overwhelming part of the data has been acquired by microbial genomic DNA- and not ribosomal RNA-based gut microbiota analysis. The latter technology may reflect more reliably the metabolically active microbial communities more precisely (Baldrian et al., 2012; Pérez-Cobas et al., 2013).
Elucidating metabolically active microbial communities within the complexity of the total microbiota constitutes an essential yet intriguing challenge toward comprehending the role of commensal microbiota in health and disease. Peris-Bondia et al. (2011) applied flow cytometry to isolate the active bacterial fraction from human feces and found a huge part of the active microbiota to be statistically neglected or “overshadowed” by the enormous diversity of the total microbiota. Using both 16S rDNA and 16S rRNA analyses of fecal samples, Pérez-Cobas et al. (2013) found meaningful differences between the whole microbiota composition and the active fraction of the microbiota in an antibiotic treated patient. The paper suggested only a minor part of the microbial community plays a significant role in terms of their metabolic activity, independent of the complexity of the whole community. Moreover, the impact of sample processing procedures on the results has been confirmed by Walker et al. (2015) when using cell disruption methods for DNA extraction in 16S rRNA gene profiling of infant gut microbiota in conjunction with optimized ‘universal’ PCR primers. Using mock communities and mock community DNA, Fouhy et al. (2016) showed the importance on 16S rRNA sequencing results of the sequencing platform besides the DNA extraction method and the primer sequences used. Contradictory results of rRNA amplicon-based metagenome analysis have been reported by Blazewicz et al. (2013), showing no clear correlation of the rRNA of different groups of microorganisms with their growth and activity, potentially leading to exaggerated and/or underestimated expression of metabolic activeness of microbiota. Relative to the functional potential of an ecosystem, a dynamic interplay continues between growing, metabolically active and dormant cells. Studying the same rumen microbiota using RNA-seq and RNA/DNA amplicon-seq methods revealed differences in taxonomic profiles (Li et al., 2016), but suggested a higher robustness of RNA-based methods for detecting microbial phylotypes with potential metabolic activities. Similarly, compared to DNA amplicon-seq, RNA-based phylotypes revealed more interactions and a higher diversity (Li et al., 2016). Without any doubt, more reliable information may be obtained by duplicate parallel studies comparing control and test groups concomitantly with gDNA and rRNA information.
This study was conducted to compare DNA vs. RNA approaches for gut microbiota analysis in a C57BL/6J mouse model by modifying the gut ecosystem system with a specific high fat diet (control: low fat diet) and by the administration of the probiotic strain Lactobacillus rhamnosus GG (LGG).
Materials and Methods
Bacterial Strains and Culture Conditions
Lactobacillus rhamnosus GG (LGG) was grown in MRS broth (Difco Laboratories Inc., Franklin Lakes, NJ, United States) and prepared daily for feeding during the intervention period. LGG was grown for 8 h to reach the late log phase, collected (16,000 ×g, 5 min, 4°C) and washed two times with PBS. The approximate viable numbers were adjusted with PBS to 1 × 10⁷ CFU/ml using a standard curve (data not shown). Optical density was determined using a SPECTROstar Nano (BMG Labtech, Durham, NC, United States) spectrophotometer. The prepared sample was suspended in 200 μl of PBS for daily oral administration by gavage.
Study Design and Animals
The animal study was approved by the Handong Global University ethical committee in South Korea (Ethical Committee No. 20151022-009). Seven week old, specific pathogen free (SPF) male C57BL/6J mice were supplied by Hyochang Science, Daegu, South Korea. The animals were housed at 23°C and 55 ± 10% humidity, in a 12 h light/dark cycle. After 1 week of adaptation, 20 mice were separated into three different groups (6 for the low fat diet control and 7 for the other groups), receiving different treatments (Supplementary Figure S1 and Table 1). The high fat diet (Research Diets D12492, New Brunswick, NJ, United States) (HFD) and autoclaved tap water were provided ad libitum to induce obesity, while the low fat diet (Research Diets D12450, New Brunswick, NJ, United States) (LFD) was provided to a control group. For a period of 10 weeks the HFD mice were orally administered daily either phosphate buffered saline (PBS) or LGG suspended in PBS (1 × 10⁷ CFU/day). The weight of each animal and its feed consumption were measured once a week. Three representative mice from each group were further analyzed for their fat mass using Micro-PET/CT (Siemens Preclinical Solution, Knoxville, TN, United States), using Inveon software. Body fat content was measured using the micro-CT method 1 week prior to sacrifice. On the last day of the experiment, mice were sacrificed by cervical dislocation. After the study, the serum, small intestine, colon, liver, epididymal adipose tissue, and spleen of each experimental animal were collected, weighed and kept at -80°C until analysis. Fecal samples were collected within 6 h after changing the bedding of the cages and half of the fecal samples were immediately immersed into RNAlater (Thermo Scientific, Waltham, MA, United States) to avoid deterioration of microbial RNA. In a metagenomic approach, genomic DNA and ribosomal RNA, were extracted from faecal samples of each group, and used to compare the whole community (DNA) and the metabolically active community structure (RNA) of the fecal microbiota.
TABLE 1. Composition of experimental groups receiving high-fat (HFD) and low-fat diet (LFD), and high-fat diet with the probiotic strain L. rhamnosus GG.
Serum Analysis
Multiplex sandwich ELISAs were performed using the Magnetic Luminex Screening Assay (Koma Biotechnology, Seoul, South Korea) to monitor adiponectin, leptin, and interleukin 12 p70 (IL-12p70) from a single serum sample of each individual mouse.
RNA Extraction and Reverse Transcription of Organs
Extraction of mRNA from epididymal adipose tissue followed the RNeasy protocol of the RNA tissue miniprep system (Promega, United States). Briefly, each organ sample was homogenized by a hand-held homogeniser (IKA, Germany) in a lysis buffer and centrifuged. Supernatant was mixed with isopropanol and passed through a column provided with the kit. After several washing and DNase treatments, the purity and concentration of the eluted RNA was measured by a SPECTROstar (BMG LABTECH, Germany) spectrophotometer. 2–3 μg of complement DNA (cDNA) was prepared using the GoScriptTM Reverse Transcription System (Promega, United States) using a Verity 96-well thermal cycler (ABI research, United States) after 10 min of incubation with oligodT primer at 70°C.
Quantitative Real-Time PCR (qRT-PCR) Analysis
The ABI 7500 Real-Time PCR System (Applied Biosystems, Carlsbad, CA, United States) and SYBR Premix Ex Taq RR420 (TaKaRa, Japan) was used for qRT-PCR, following the protocols previously described (Ji et al., 2012). The Delta Delta C(t) method (Livak and Schmittgen, 2001) was used to calculate gene expression levels of different biomarkers; the primers are listed in Supplementary Table S1.
Extraction of Microbial Genomic DNA and Ribosomal RNA for Metagenomic Analysis
Genomic DNA (DNA) and ribosomal RNA (RNA) were extracted from individual faecal microbiota samples using the ReliPrep gDNA Tissue Miniprep System as well as the RNA Tissue Miniprep System (Promega, United States), after mechanical disruption of microbial cell walls. Briefly, for fecal rRNA extraction and preparation of cDNA, 50 mg of fecal sample were suspended in 500 μL of lysis buffer solution (490 μL of LBA buffer + 10 μL of 1-thioglycerol) in a screw cap micro-tube (Sarstedt, Germany) together with 0.3 g of 0.1 mm zirconium/silica beads (Biospec, United States), followed by disruption in a mini-beadbeater-16 (Biospec, United States) for 2 min and centrifuged at 14,000 ×g for 3 min at room temperature. The supernatant was mixed with 150 μL of isopropanol and transferred to ReliaPrep Minicolumn after vigorously mixing for 10 s. Subsequent clean up and DNase treatment procedures precisely followed the manufacturer’s instructions. RNA was finally eluted in a column using 30 μL of elution buffer, and further reverse transcribed to cDNA after measuring purity and concentration of the eluted RNA by SPECTROstar (BMG LABTECH, Germany); 1 μg of RNA was mixed with 1 μL of Random Primers (Promega, United States) and incubated at 70°C for 10 min and immediately cooled on ice for 10 min. Random Primer attached RNA was mixed with GoScript Reverse Transcription System master mix (Promega, United States) comprising 4 μL of GoScript 5X Reaction Buffer, 4 μL of MgCl2 (25 mM), 1 μL of PCR Nucleotide Mix, 1 μL of GoScript Reverse Transcriptase and 4 μL of Nuclease-Free Water. The PCR procedure was continued following the manufacturer’s instructions. For fecal bacterial gDNA extraction 50 mg of fecal sample were suspended in 720 μL of lysis buffer solution (320 μL of PBS + 400 μL of CLD) in a screw cap micro-tube (Sarstedt, Germany) together with 0.3 g of 0.1 mm zirconium/silica beads (Biospec, United States), followed by disruption in a mini-beadbeater-16 (Biospec, United States) for 2 min and centrifuged at 14,000 ×g for 3 min at room temperature. The supernatant was thoroughly mixed with 250 μL of Binding Buffer (BBA) and placed on a binding column. For the further cleaning and eluting process the manufacturer’s instructions were followed.
Gut Microbiota Analysis Using 454 GS FLX and Bioinformatics Analysis
Gut microbial metagenome analysis was performed with the Roche 454 GS FLX plus system (AtoGen, Daejeon, South Korea) using genomic DNA (gDNA) and cDNA templates produced from reverse transcription of ribosomal RNA of the microbiota. Briefly, forward and reverse primers were designed based on V1–V3 variable region of the 16S rDNA sequence (forward, 8f: 5′-AGAGTTTGATCMTGGCTCAG-3′; reverse 518r: 5′-ATTACCGCGGCTGCTGG-3′) and tagged with10 bp unique barcode labels (Supplementary Table S2).
Flow pattern B raw data from the 454 GS FLX plus system (Roche, Switzerland) was denoised and filtered using FlowClus (Gaspar and Thomas, 2015) and further analyzed using the MacQIIME (Caporaso et al., 2010) 1.8.0 pipeline. Briefly, chimeras were eliminated using Usearch 6.1 and sequences were clustered into operational taxonomic units (OTU) at 99% sequence similarity, and taxonomically assigned using the RDP database. A total of 276 199 raw reads were produced comprising an average of 15 344 reads per sample and an average read length of 456 nucleotides per sample. 209 859 of the reads were selected after excluding sequencing noise and possible chimeras, yielding 10 878 useable reads per sample on average (Supplementary Figure S2).
Composition and intra-/inter- community diversity (alpha and beta diversity) of taxonomically assigned microbiota were interpreted using two-dimensional (2D) and three-dimensional (3D) weighted principal coordinates analysis (PCoA) and 2D weighted pair group method averaging (WPGMA; the WPGMA dendrogram is presented in Figure 4C). Distance matrix was also performed to understand the degree of gut microbiota differences. Post analysis including alpha, beta diversity and taxonomic assignment of microbiota was conducted using a Qiime pipeline (Caporaso et al., 2010). Metagenome information is deposited in the Sequence Read Archive of the NCBI under accession number of PRJNA342544.
Short Chain Fatty Acid Analysis
Short chain fatty acids (SCFA) analysis was performed according to the method of Schwiertz et al. (2010). Briefly, 50 mg of deep-frozen caecum was mixed with 500 μL of extraction solution (comprising 100 mmol oxalic acid /l and 40 mmol sodium azide /l), incubated on a horizontal shaker for an hour at room temperature, and centrifuged at 16 000 ×g for 10 min. The supernatant was filtered through a 0.45 μm Minisart RC 4 syringe filter (Sartorius Stedim Biotech, Germany), transferred to a Clear gas chromatography vial (Shimadzu, United States) and tightly sealed using a Ribbed blue screw vial cap with bonded silicone (Shimadzu, United States) until analysis. A GC-2010 (Shimadzu, Japan) and HP-Innowax 30 m × 0.32 mm × 0.25 μm column (Agilent, United States) were used for detection; N2 gas served as carrier gas. 1 μL of each sample was injected by Shimadzu Auto-sampler AOC-20is (Shimadzu, Japan) at 260°C and detected by a flame ionized detector (FID). The column temperature was increased from 100°C up to 180°C at a rate of 25°C/min. A volatile free acid standard mix (Supelco, United States) was used as analytical standard of C2 through C5.
Statistical Analysis
All the graphs are presented as mean value and standard error (SD). GraphPad Prism 6.0 (GraphPad Software, United States) was used for non-parametric one-way and two-way analysis of variance (ANOVA) and post hoc multiple comparisons were followed using Bonferroni’s multiple comparison test. IBM SPSS statistics version 20 (IBM, United States) was used to calculate the Pearson correlation coefficient and the accepted significance level of correlation curves. All the significance was accepted at P < 0.05 and indicated as various symbols as ∗, $, and # (<0.05 = one symbol; <0.01 = two symbols and <0.001 = three symbols).
Results
Physiological Impact
Administration of a HFD for 10 weeks induced a significantly higher weight gain compared to the LFD control group (Figure 1A), and was associated with a significantly lower calorie uptake in this group (Figure 1B). Compared to the HFD PBS-treated group, weight gain was significantly lower in the probiotic LGG treatment group (HFD+LGG) (Figure 1A) while a minor reduction in calorie uptake was detected in the HFD+LGG group. Both the liver and epididymal adipose tissue (EAT) weight was significantly lower in the LFD group, while only the EAT weight was significantly reduced in the HFD+LGG group (Figure 1B). Both total body fat as well as subcutaneous adipose tissue (SAT) and visceral adipose tissue (VAT) were non-significantly reduced between lumbar one and six of three representative mice from each group (Figure 2). A significant decrease in weight of the small intestine was measured in the HFD+LGG group while the weight of the colon was significantly increased in the LFD group. The spleen weight of LFD animals was slightly lower than that of the HFD+LGG group but significantly lower than that of the HFD group (Figure 1C). Serum immune-metabolic biomarkers such as IL-12p70 and leptin were significantly reduced in the HFD+LGG group compared to the HFD group, while adiponectin was noticeably higher in the HFD+LGG group compared to the HFD group (Figure 3A). Sterol regulatory element-binding protein 1c (SREBP1c) was significantly down-regulated in the HFD+LGG group relative to the HFD group while lipid oxidation associated carnityl palmitoyltransferase 1 (CPT1) gene expression was only significantly up-regulated in the LFD group compared to the HFD group (Figure 3B). Among the SCFAs, significantly lower acetate and higher butyrate values were detected in fecal samples of the LFD group relative to the HFD and HFD+LGG groups (Figure 3C).
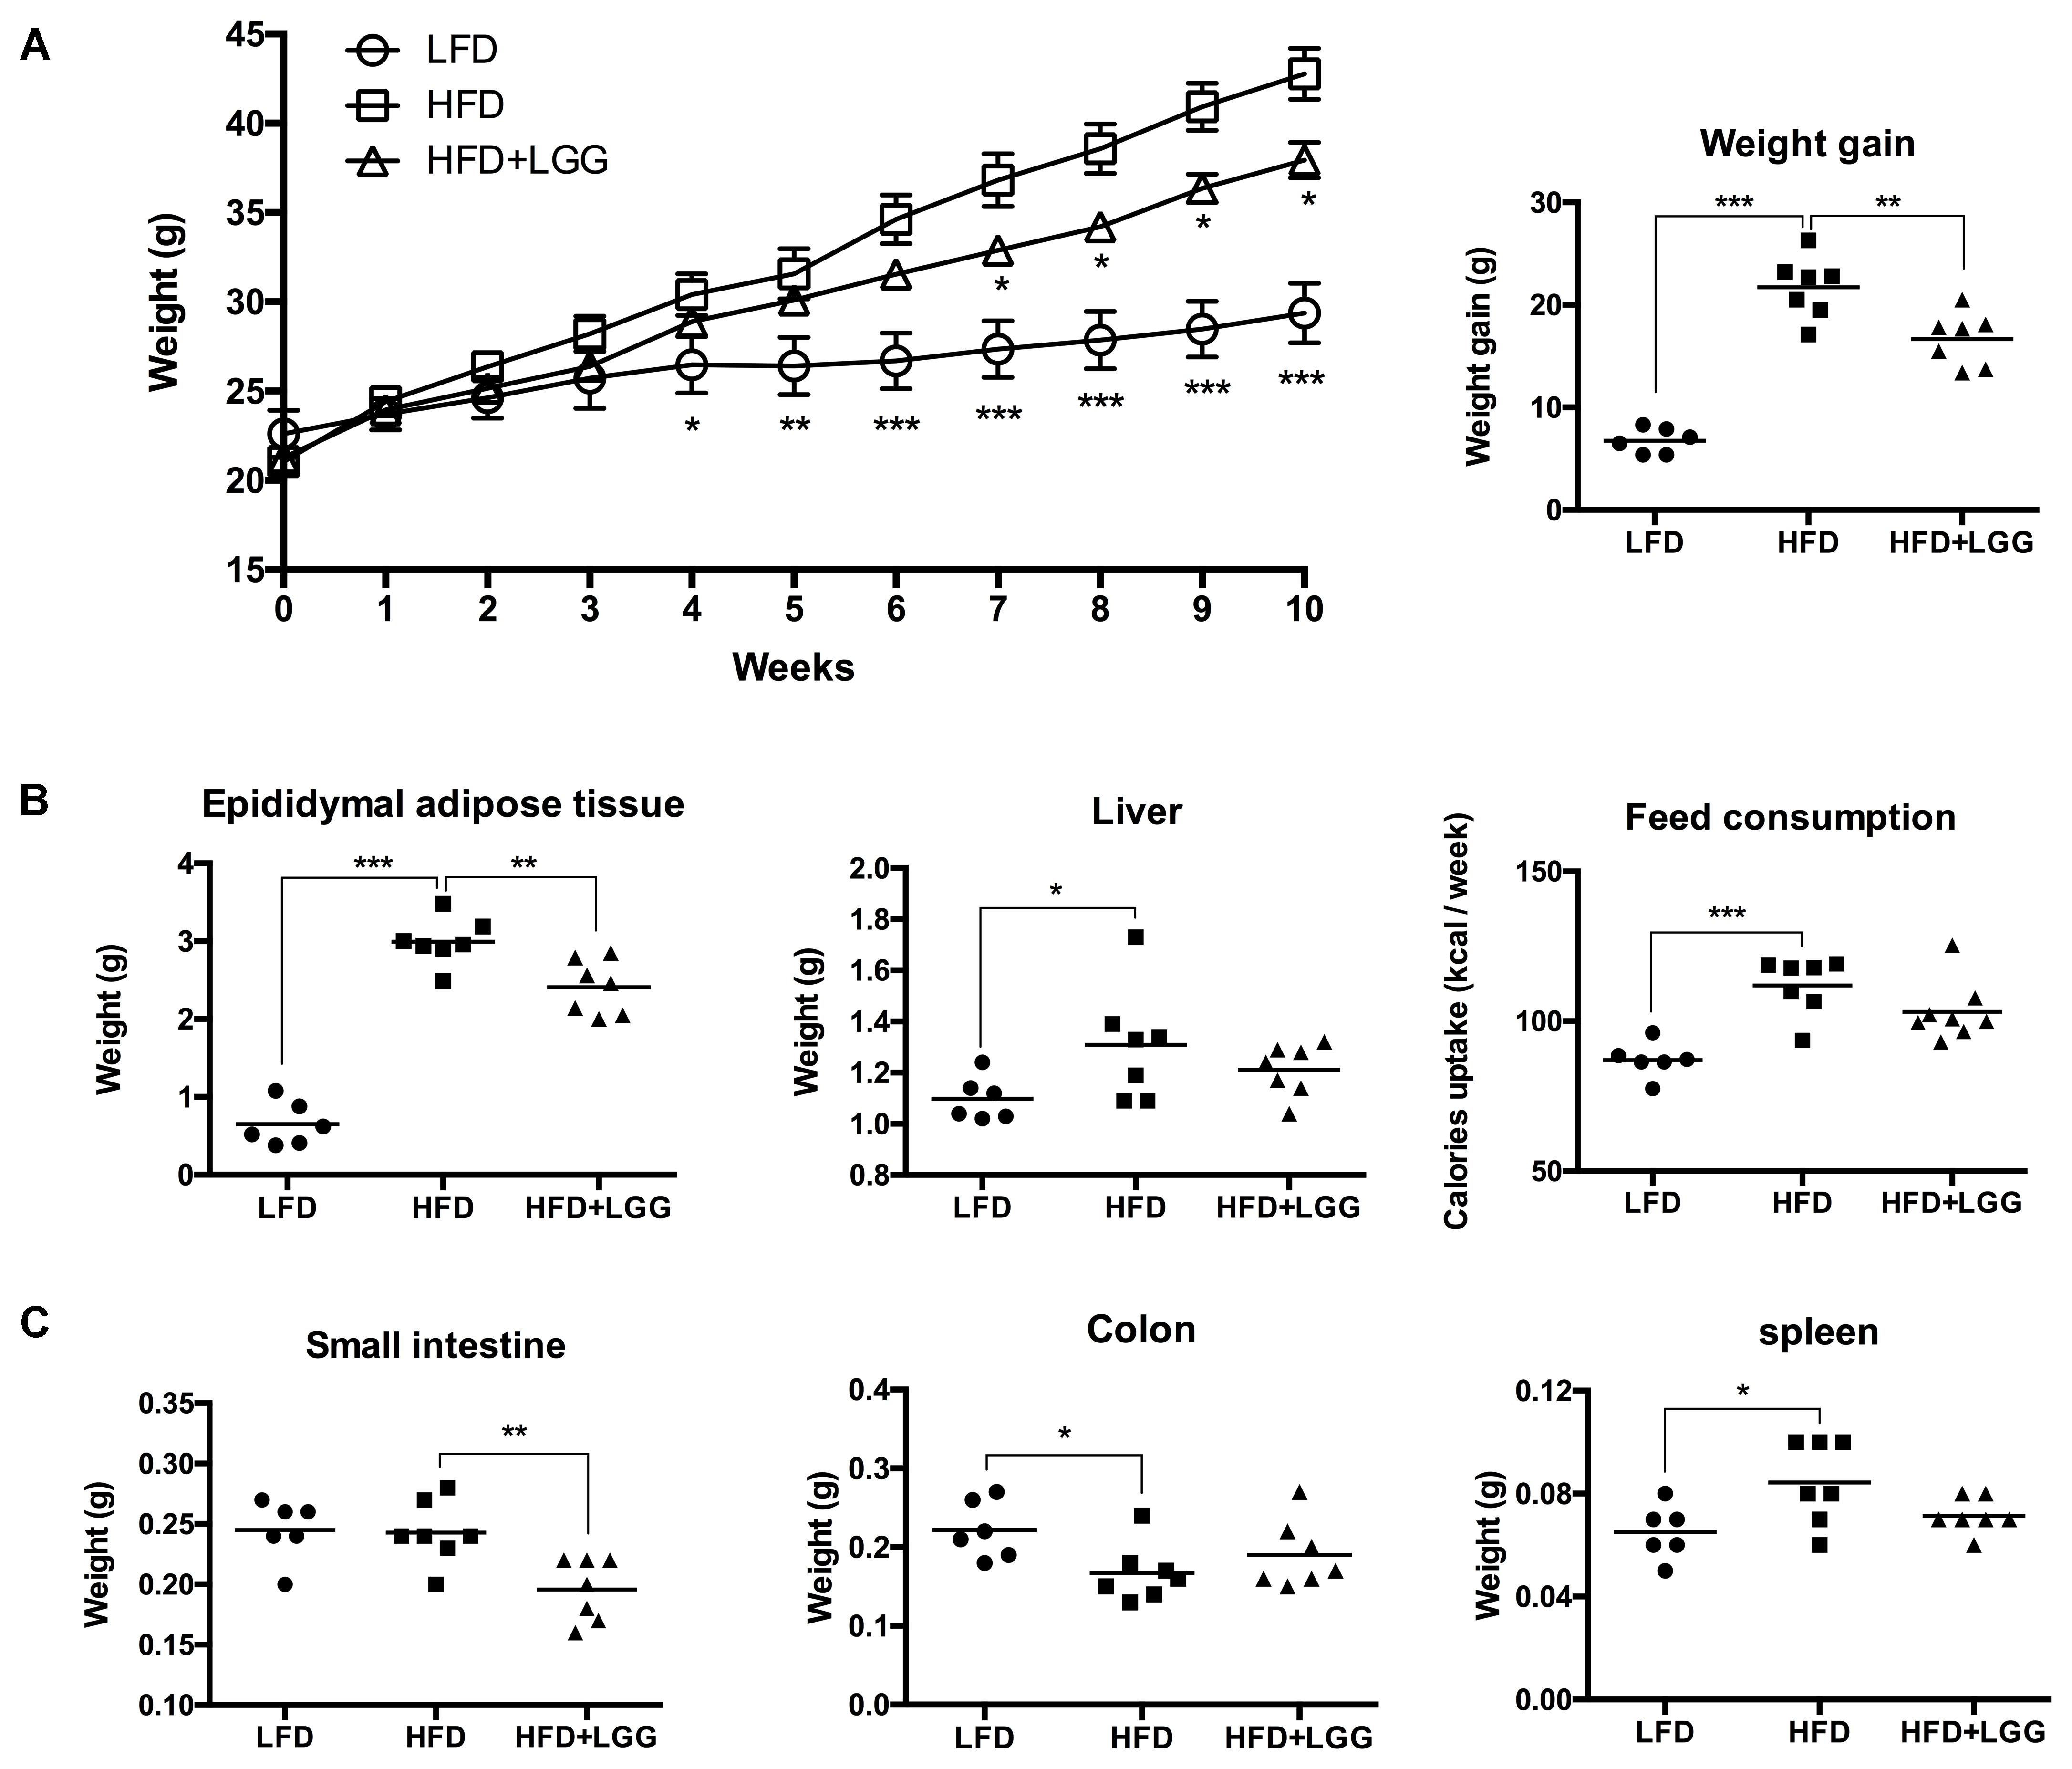
FIGURE 1. Impact on body and organ weight by HFD and LGG in a DIO murine model, showing (A) weekly weight changes and total weight gain. (B) EAT, liver and feed consumption. (C) Small intestine, colon and spleen weight. Significance level was calculated using ANOVA and Bonferroni’s multiple comparisons test. Results are illustrated as ∗p < 0.05, ∗∗p < 0.01, ∗∗∗p < 0.001.
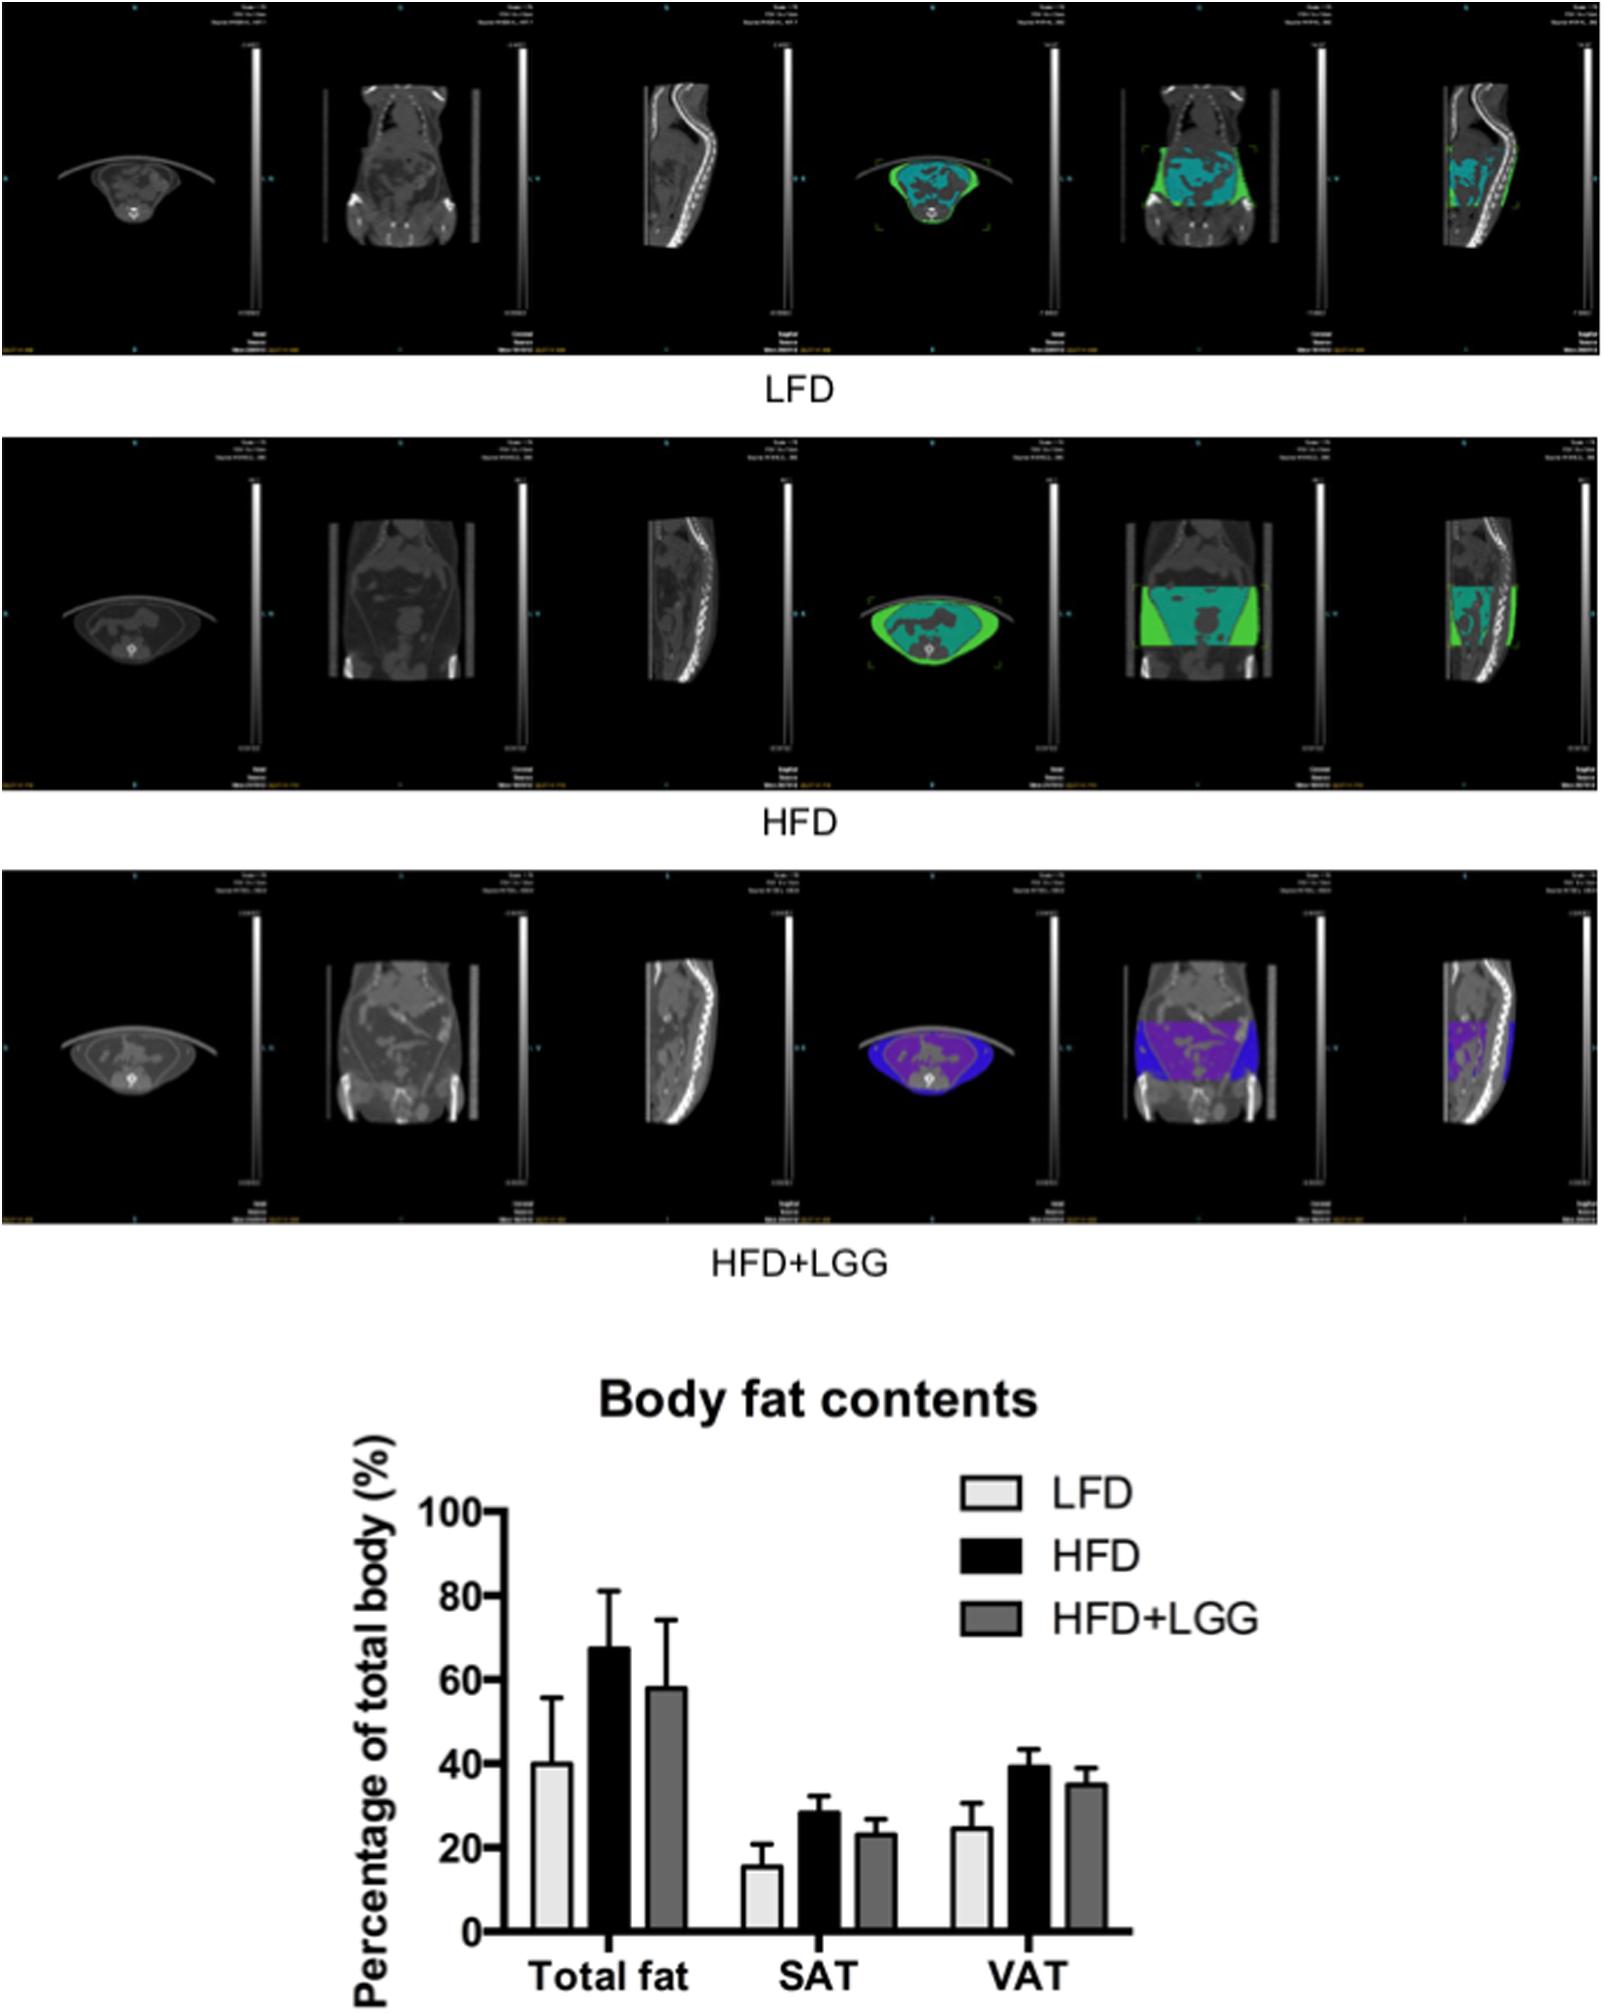
FIGURE 2. Pictures of micro-CT of each group. Fat mass was measured between lumbar numbers 1–6; visceral adipose tissue (VAT) and subcutaneous adipose tissue (SAT) were visualized and measured in different colors. Fat mass was first calculated in volume (mm3) to indicate its percentage out of total body volume using Inveon software.
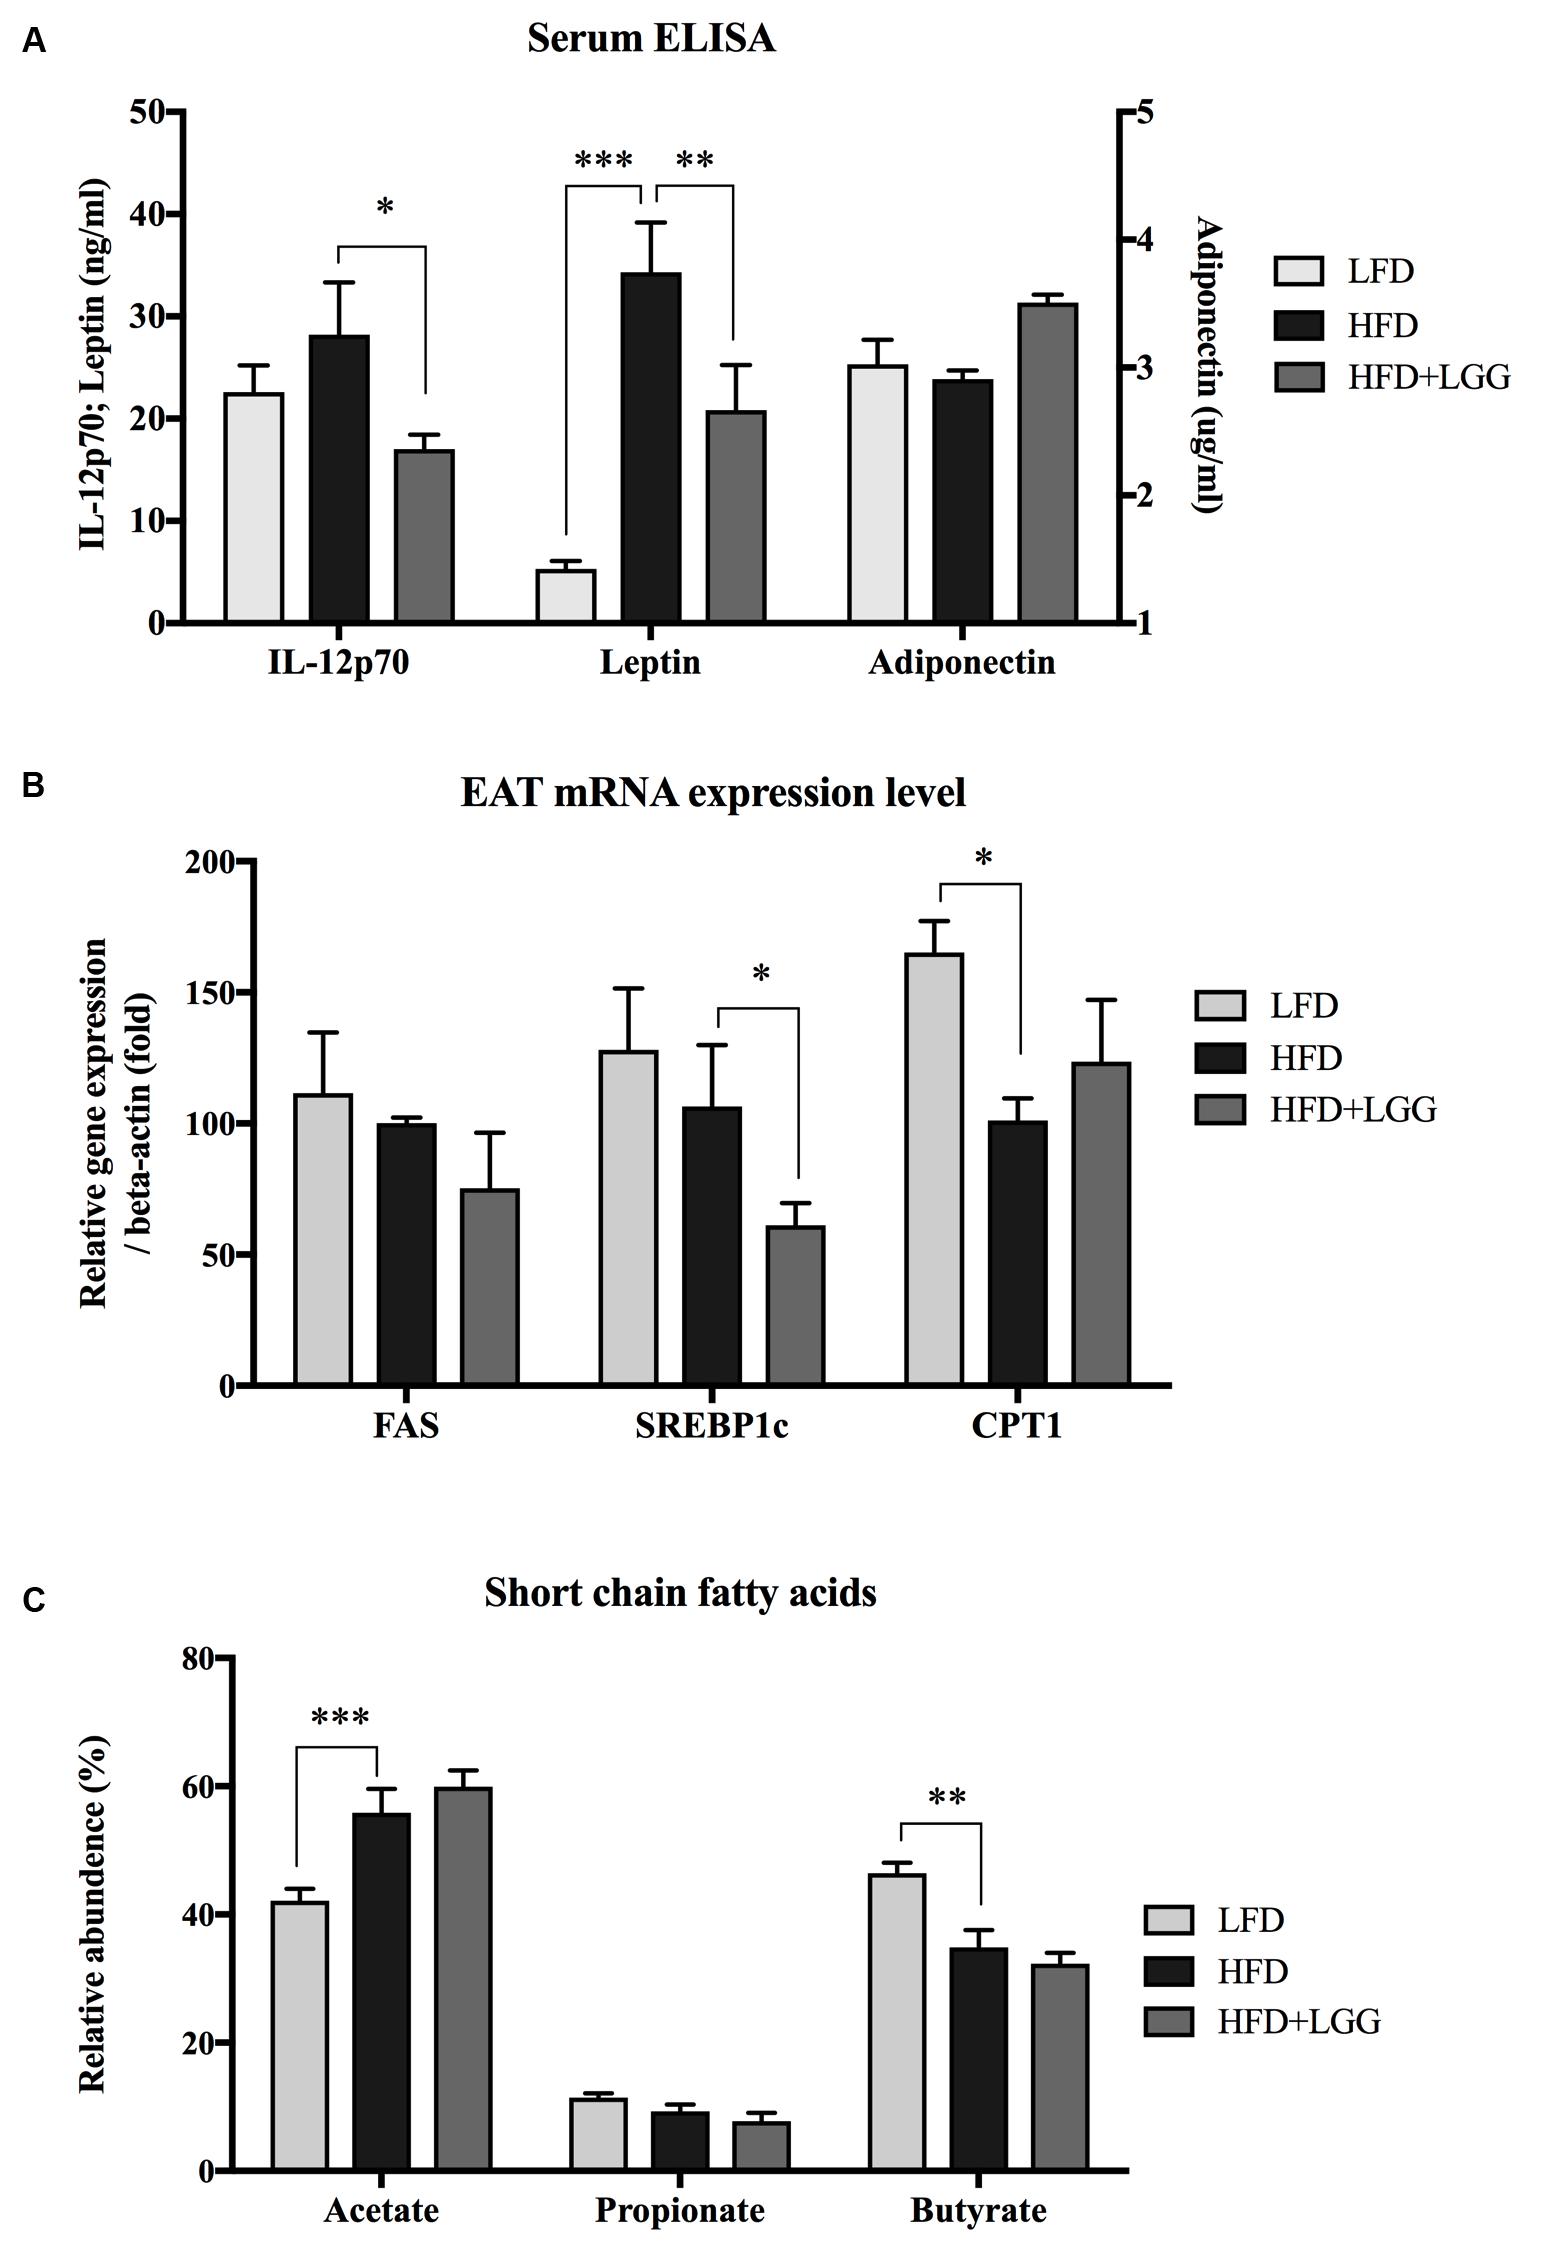
FIGURE 3. (A) Serum IL-12p70, leptin and adiponectin were measured using the ELISA method. (B) mRNA expression level of fatty acid synthase (FAS), sterol regulatory element-binding protein 1c (SREBP1c) and carnitine palmitoyltransferase 1 (CPT1) were measured from epididymal adipose tissue (EAT). (C) Short chain fatty acids from fecal samples of each group were measured by gas chromatography. Significance level was calculated by using ANOVA and Bonferroni’s multiple comparisons test; results are illustrated as ∗p < 0.05, ∗∗P < 0.01, ∗∗∗P < 0.001.
Alpha and Beta Diversity of the Murine Microbiota
PD whole-tree rarefaction analysis showed lower alpha diversity in both gDNA and rRNA analyses when LFD was applied as compared to the HFD group (Supplementary Figure S3). Beta diversity of weighted principal coordinates analysis (PCoA) indicated a major impact of the different diets (LFD and HFD) on the associated microbiota (Figure 4A). PC1 of PCoA significantly reflected microbiota differences under different diets regardless of whole community (DNA) or active community (RNA) analysis. On the other hand, PC2 showed a strong difference between DNA and RNA analysis in the LFD group, implying that the active microbial community under LFD feeding can be interpreted differently from a whole community structure of the microbiome. With regard to PC3 of PCoA, significantly different DNA and RNA results were obtained in the HFD and HFD+LGG groups, suggesting differences in the impact of feeding regimes on microbial groups (PC2 vs. PC3). Significantly shorter branch lengths were measured in the RNA analysis of the HFD and HFD+LGG groups (Figure 4B).
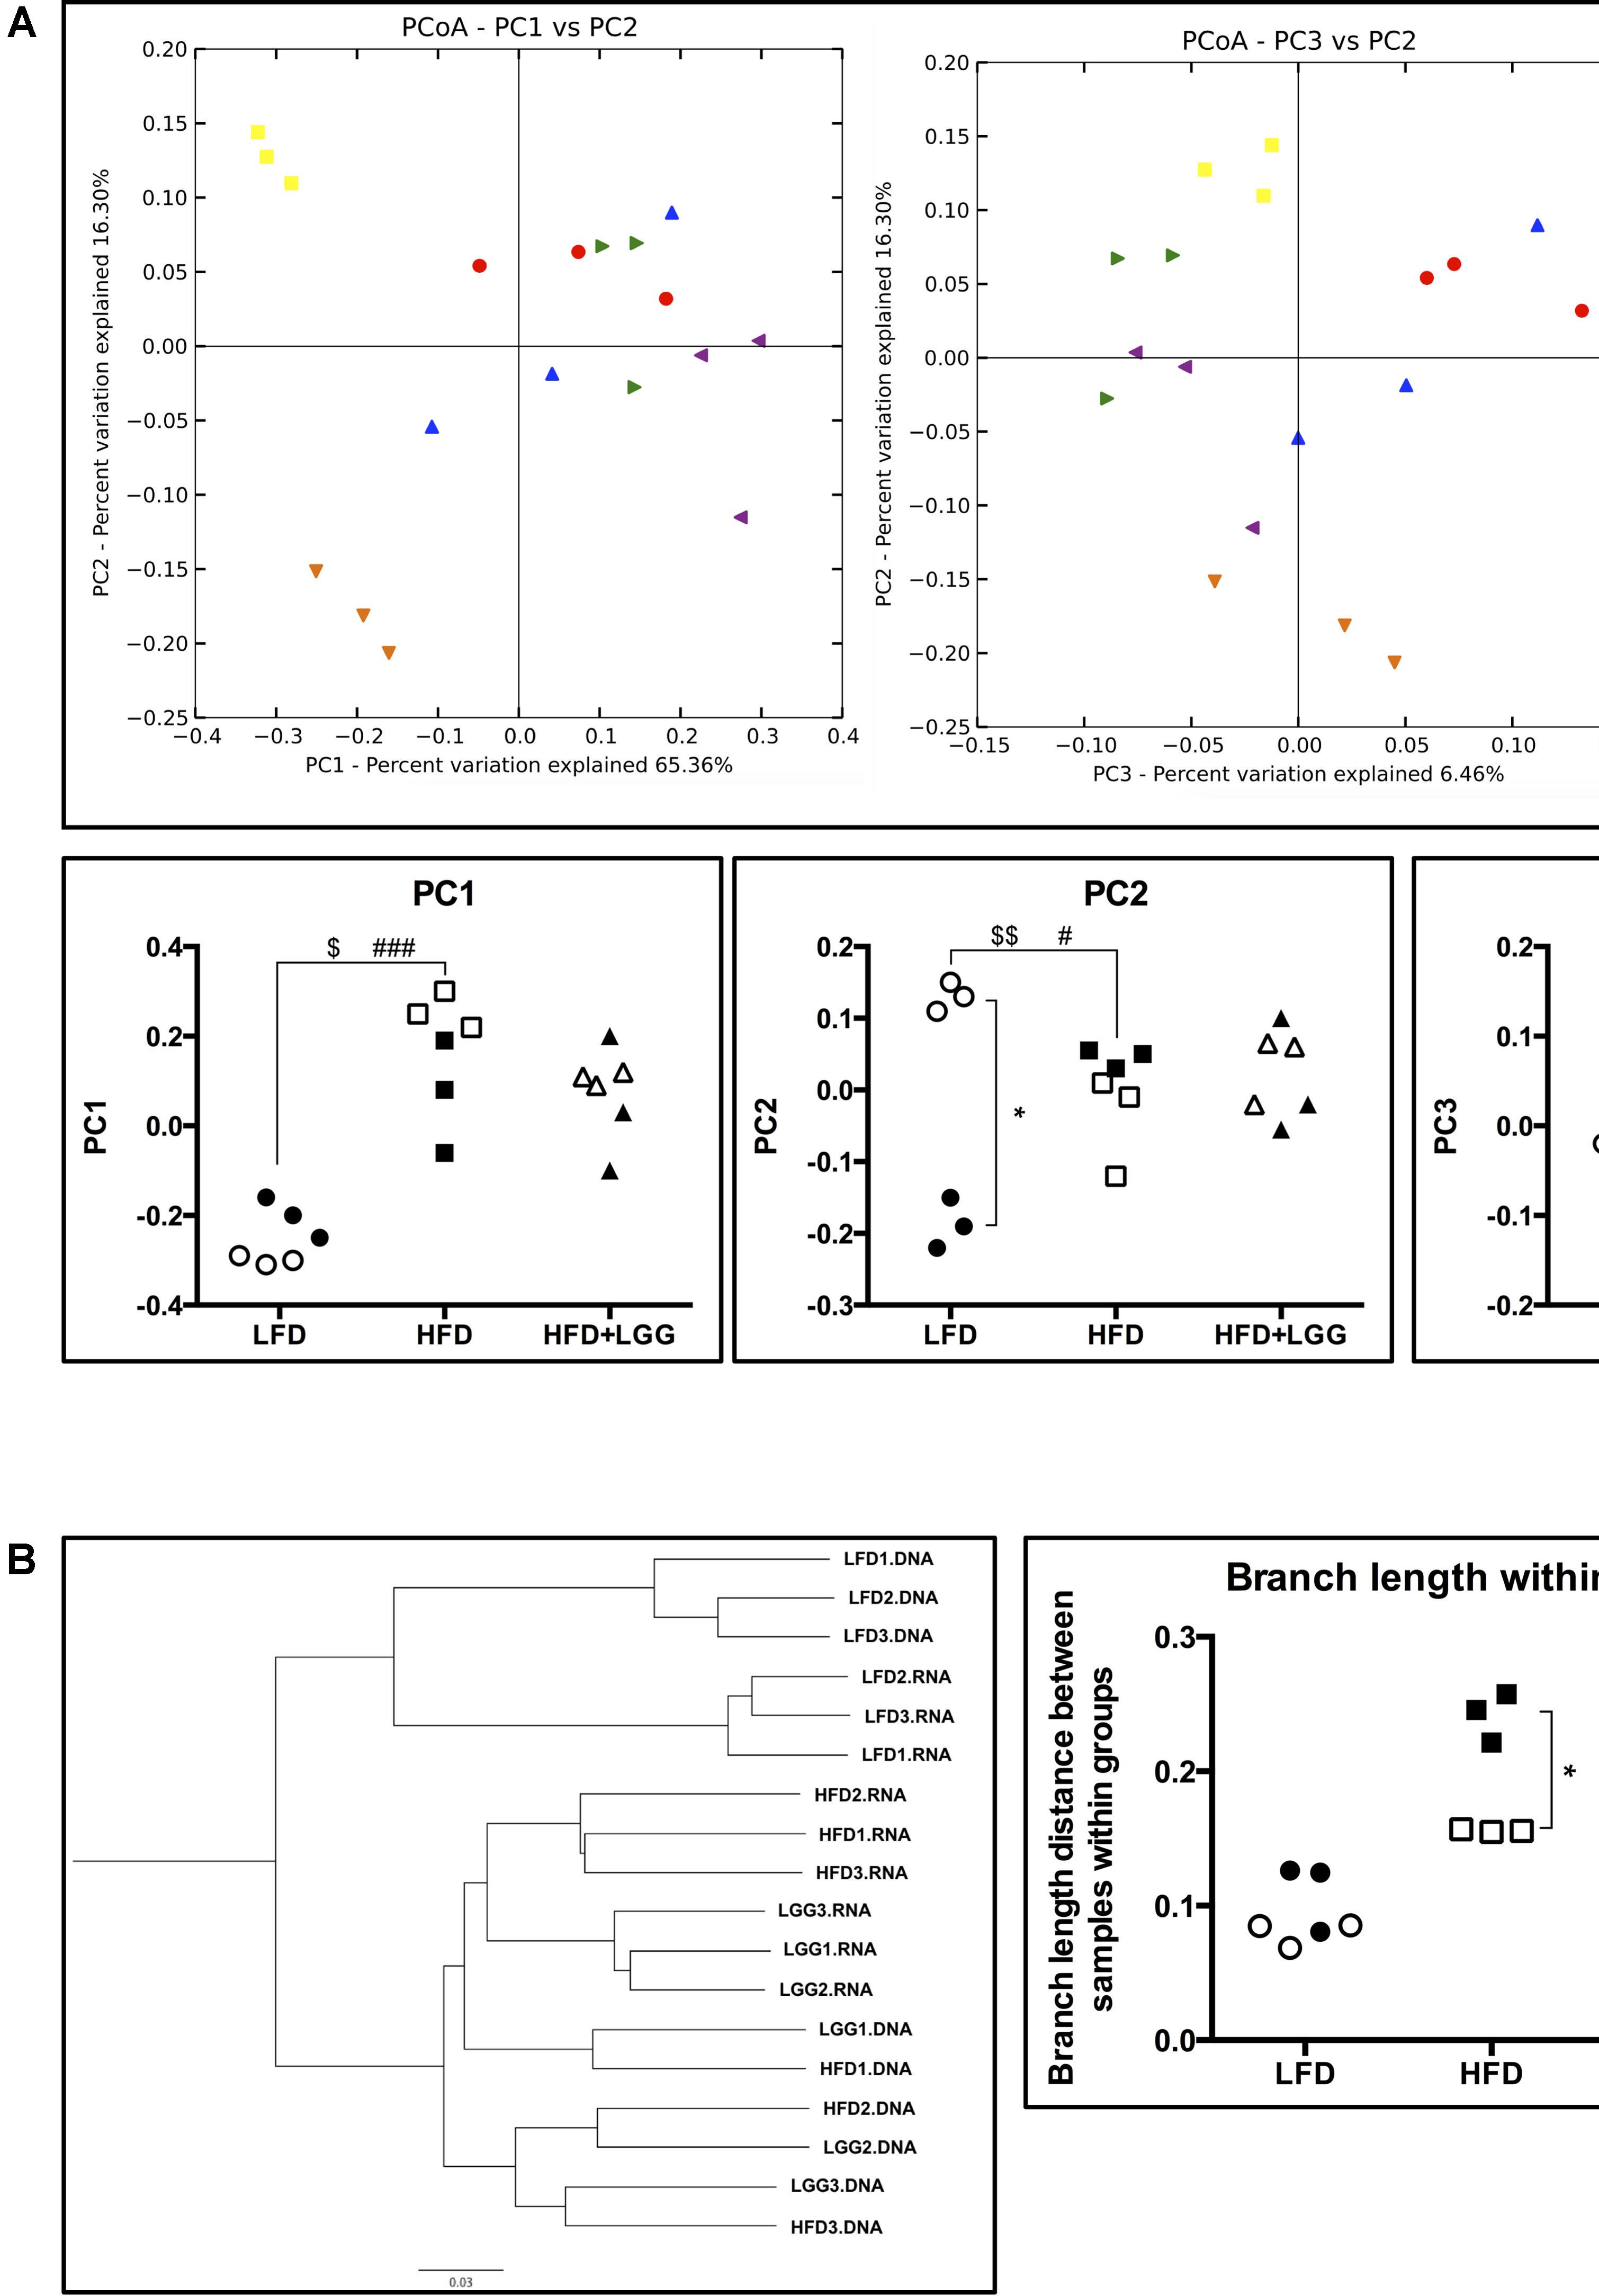
FIGURE 4. Alpha- and beta-diversity of fecal microbiota in a murine DIO model. (A) Weighted principal coordinates analysis and value of each principal component dimensions; (B) weighted pair group method with averaging and calculated branch length of samples within each group. Significance level was calculated using ANOVA and Bonferroni’s multiple comparisons test; ∗ shows significant difference between DNA and RNA analysis, $ shows significant difference of LFD and HFD+LGG compared to HFD according to DNA analysis, and # shows significant difference of LFD and HFD+LGG compared to HFD according to RNA analysis. The level of significance is expressed by the number of symbols (one = <0.05, two = <0.01, three = <0.001).
Taxonomic Summary of Microbiota
Fourteen major groups were identified at genus level, excluding minor groups representing <1% of the total microbiota. The Firmicutes and Bacteroidetes and their sub-groups comprised the major components of the microbiota. Bar graph based taxonomic summaries at phylum, class, family, and genus levels (Supplementary Figure S4) show major differences between LFD and HFD for Firmicutes and Bacteroidetes, depending on whether DNA or RNA analysis of microbiota has been applied. DNA analysis revealed a lower Firmicutes level in the LFD group compared to the HFD group while, by contrast, RNA analysis resulted in significantly higher Firmicutes levels mostly associated with OTU numbers of Clostridiales, Lachnospiraceae, and Allobaculum (Supplementary Figure S4). Based on DNA analysis Bacteroidetes levels were higher in the LFD group compared to the HFD group but significantly lower according to RNA analysis, resulting in a contradictory outcome for the Firmicutes: Bacteroidetes ratio (F/B) (Figure 5A). Allobaculum, Oscillospira, and Ruminococcus were found to be the major genera in the Firmicutes, with RNA analysis showing significantly higher Allobaculum and significantly lower Ruminococcus levels in the LFD group. Both DNA and RNA analyses showed significantly lower levels for Oscillospira in the LFD group while only RNA analysis could reveal a significant reduction of Oscillospira in the HFD+LGG group; this may be attributed to the significantly higher abundance of OTUs accounted for by RNA analysis (Figure 5B). Bacteroides, Rikenellaceae, and Prevotellaceae represented the major groups under the phylum Bacteroidetes. Both Bacteroides and Prevotellaceae showed significantly lower abundance of OTUs by RNA analysis as compared to DNA analysis in the LFD group. Significantly higher levels of Bacteroides and Rikenellaceae were detected in the HFD group compared to the LFD group, but only DNA analysis showed significantly higher abundance of Prevotellaceae in the LFD group (Figure 5C). The level of Lactobacillales was noticeably higher in the HFD+LGG group as compared to the HFD group, while the Lachnospiraceae and Desulfovibrionaceae were not significantly modulated (Supplementary Figure S3).
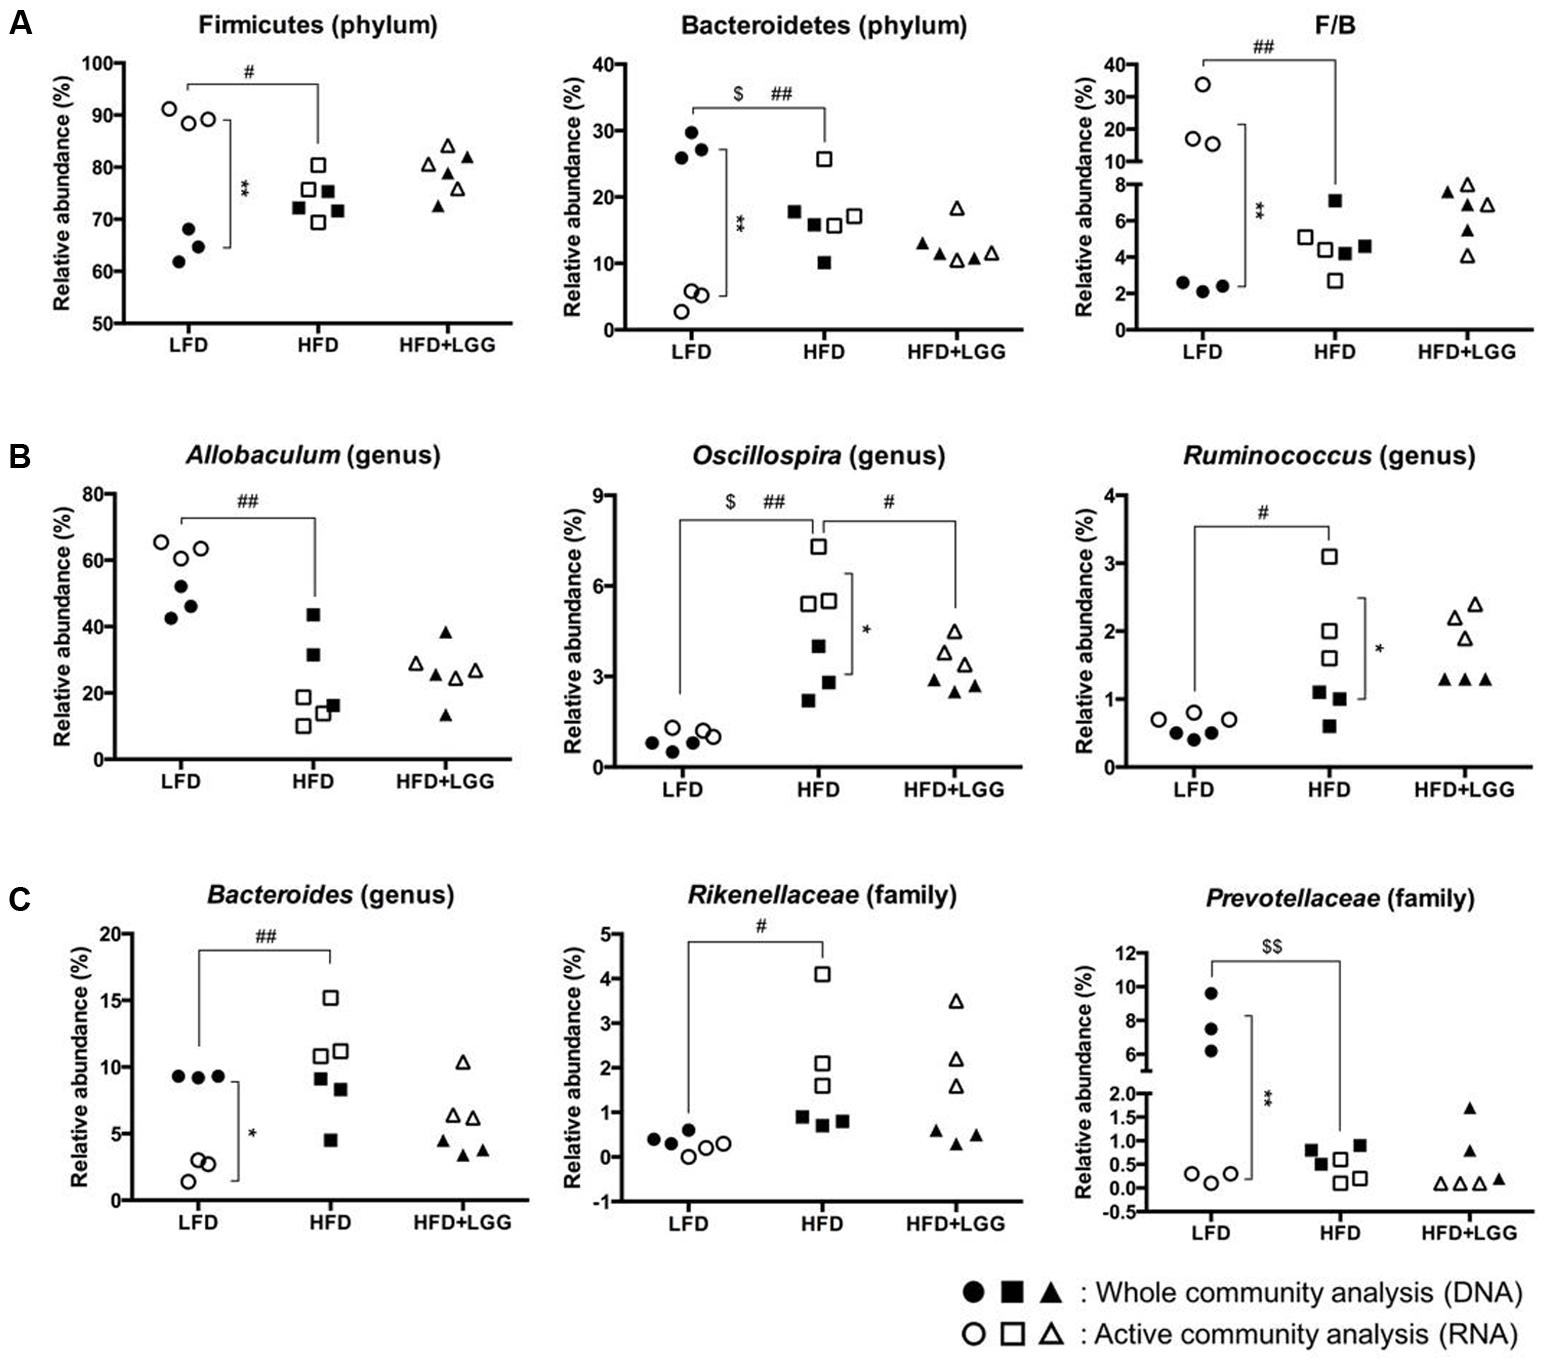
FIGURE 5. Fecal microbiota of LFD, HFD, and HFD+LGG groups. Black colored circle, rectangle, and triangle illustrate results of DNA analysis while empty symbols illustrate results of RNA analysis. (A) Firmicutes, Bacteroidetes, and Firmicutes over Bacteroidetes ratio (F/B); (B) major sub-groups of Firmicutes; (C) major sub-groups of Bacteroidetes. Significance level was calculated using ANOVA and Bonferroni’s multiple comparisons test and ∗ shows significant difference between DNA and RNA analysis, $ shows significant difference of LFD and HFD+LGG compared to HFD according to DNA analysis and # shows significant difference of LFD and HFD+LGG compared to HFD according to RNA analysis. The level of significance is expressed by the number of symbols (one = <0.05, two = <0.01, three = <0.001).
Active and Whole Community of Microbiota
The ratio of active and whole community microbiota was calculated among major groups and the LFD group was significantly correlated with a reduced ratio of Bacteroides species and an increase in Allobaculum species compared to the HFD group (Figure 6). The HFD+LGG group was associated with a reduced Clostridiales population compared to the HFD group. Correlation curves in Figures 7A–C show a significant relationship between weight gain (X-axis) and the genera Allobaculum, Bacteroides, and Oscillospira (Y-axis). R2 results and p-values obtained with the Pearson correlation coefficient indicate Allobaculum to be negatively and Oscillospira positively correlated with weight gain, implying a differential influence of diet on sub-groups within the Firmicutes and/or respective differences in the influence of such groups on the host physiological status. However, while DNA based data for Bacteroides suggest a non-significant correlation with weight gain, the RNA based data show a significantly positive correlation with weight gain (Figure 7B).
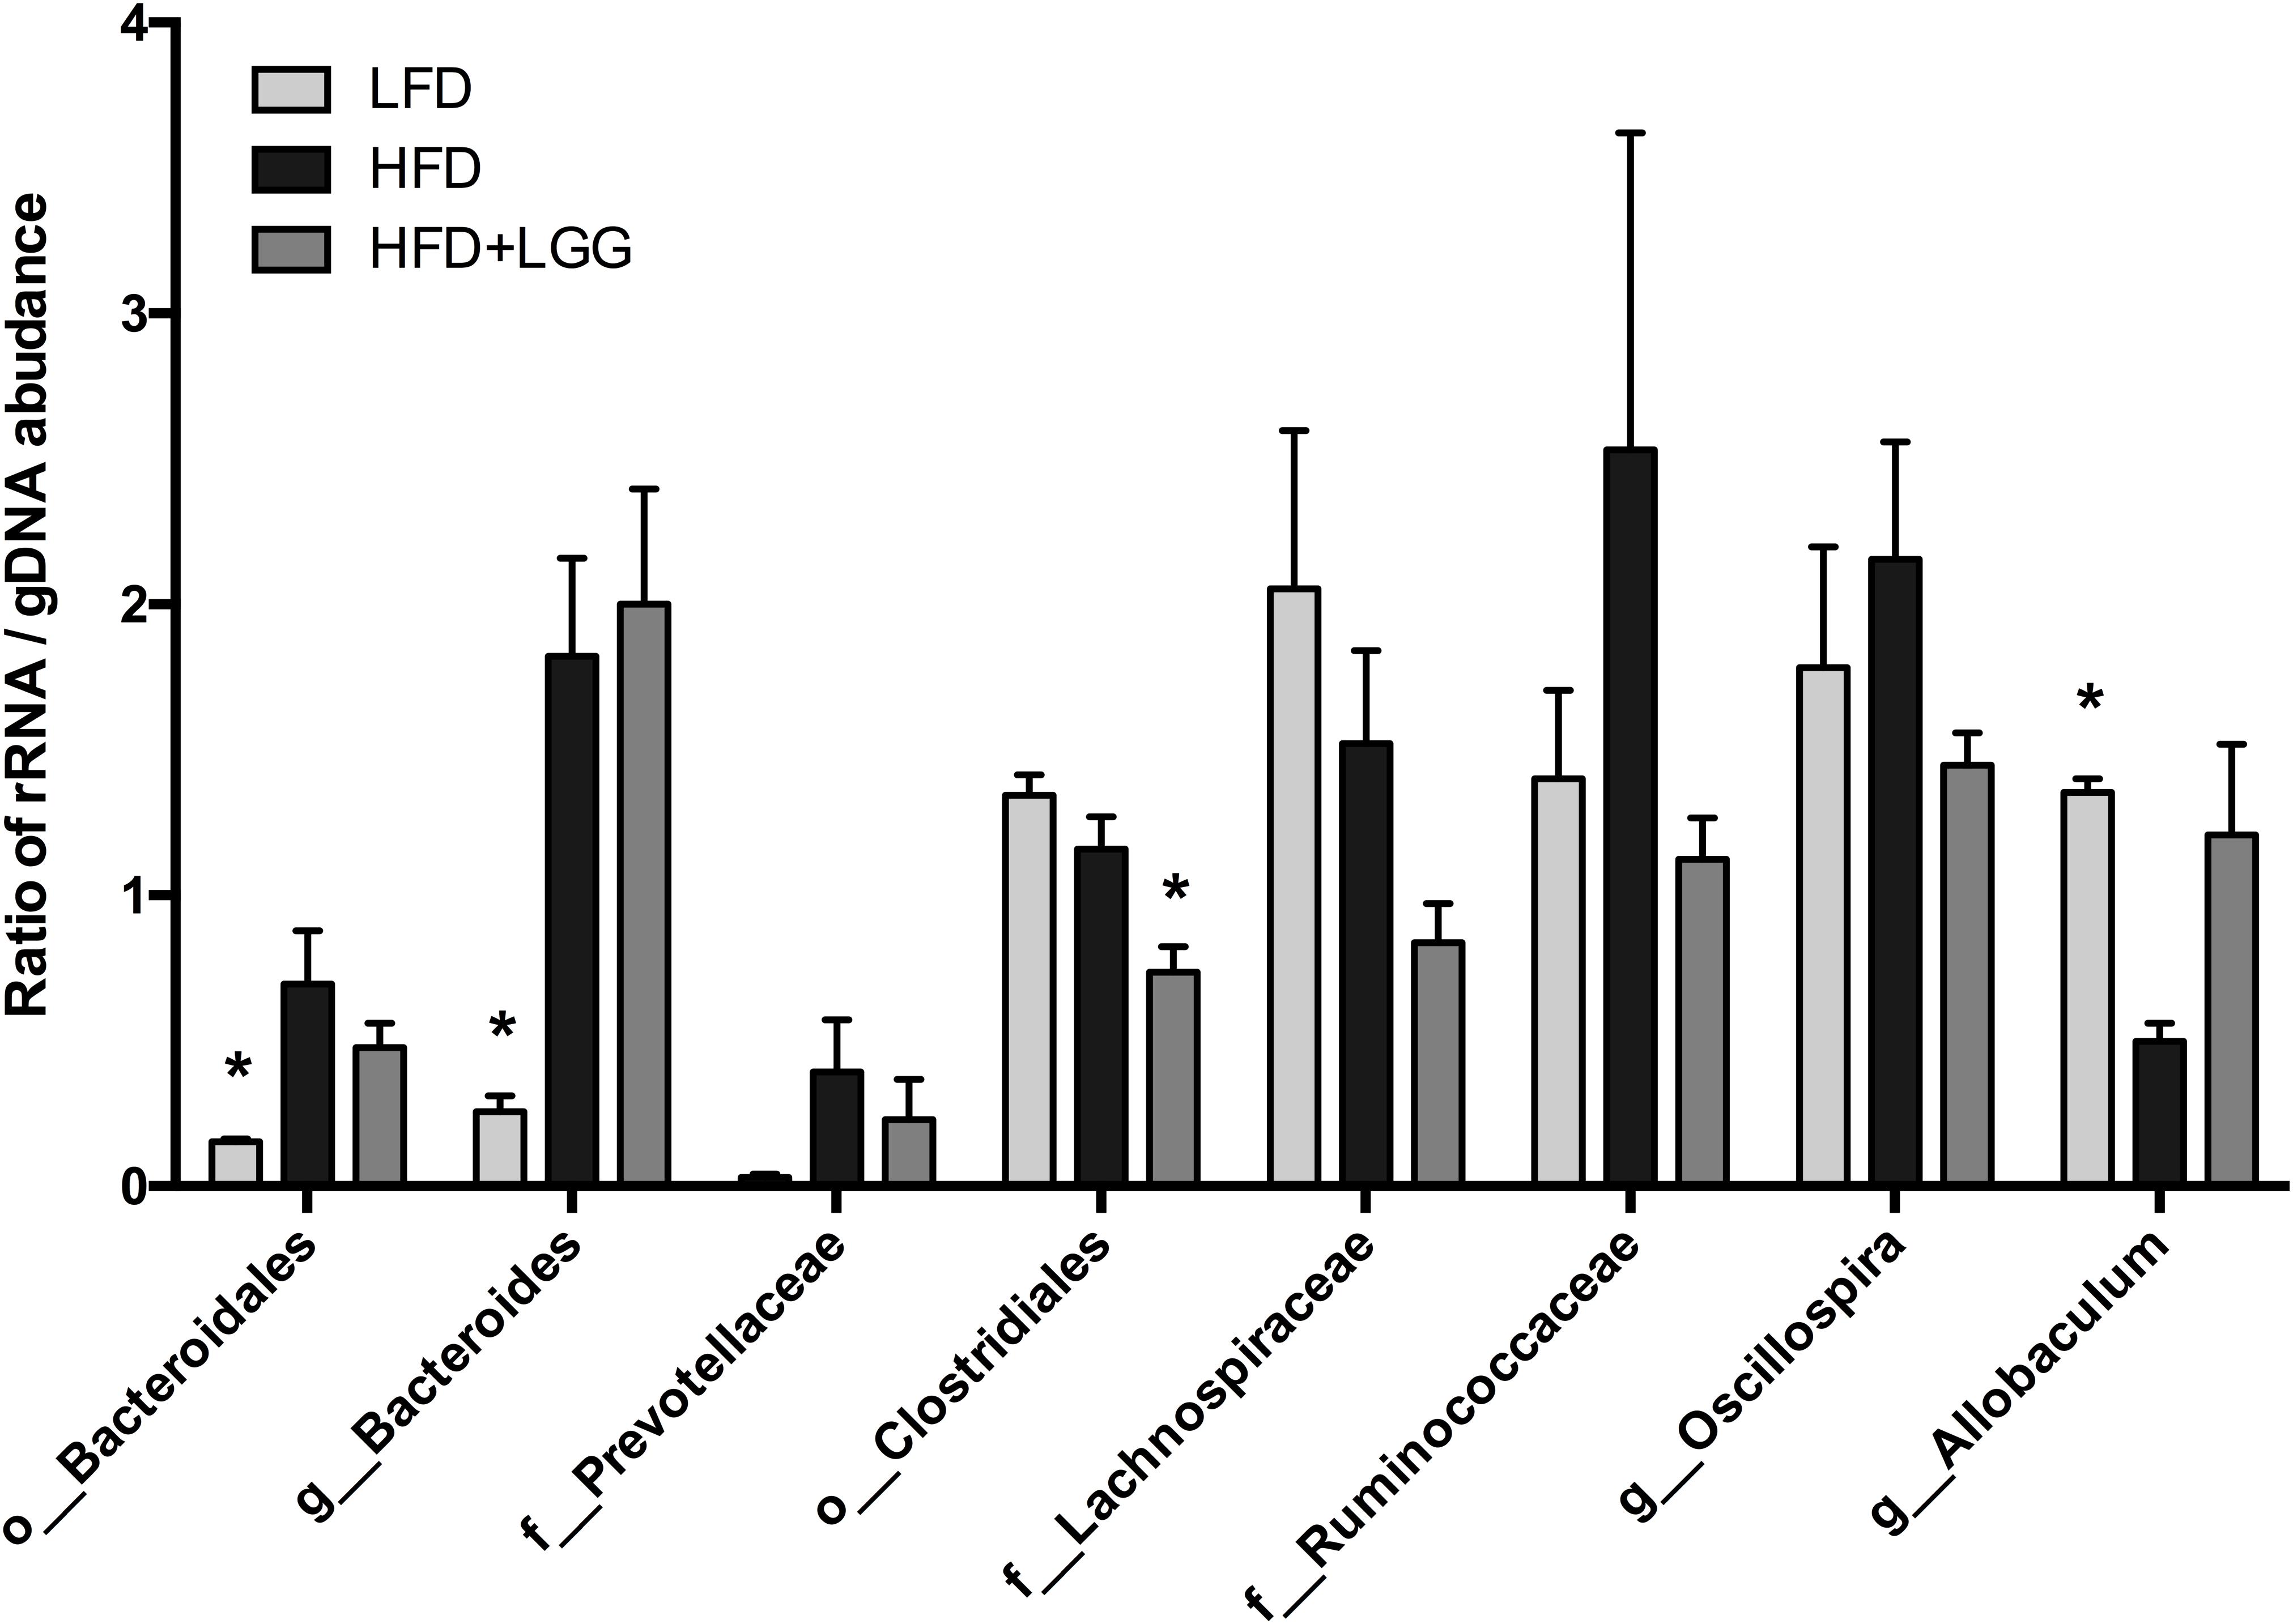
FIGURE 6. Ratio of rRNA/gDNA abundance in the microbiome of LFD, HFD, and HFD+LGG groups. Significance level was calculated by using ANOVA and Bonferroni’s multiple comparisons test; results are illustrated as ∗p < 0.05, ∗∗p < 0.01, ∗∗∗p < 0.001.
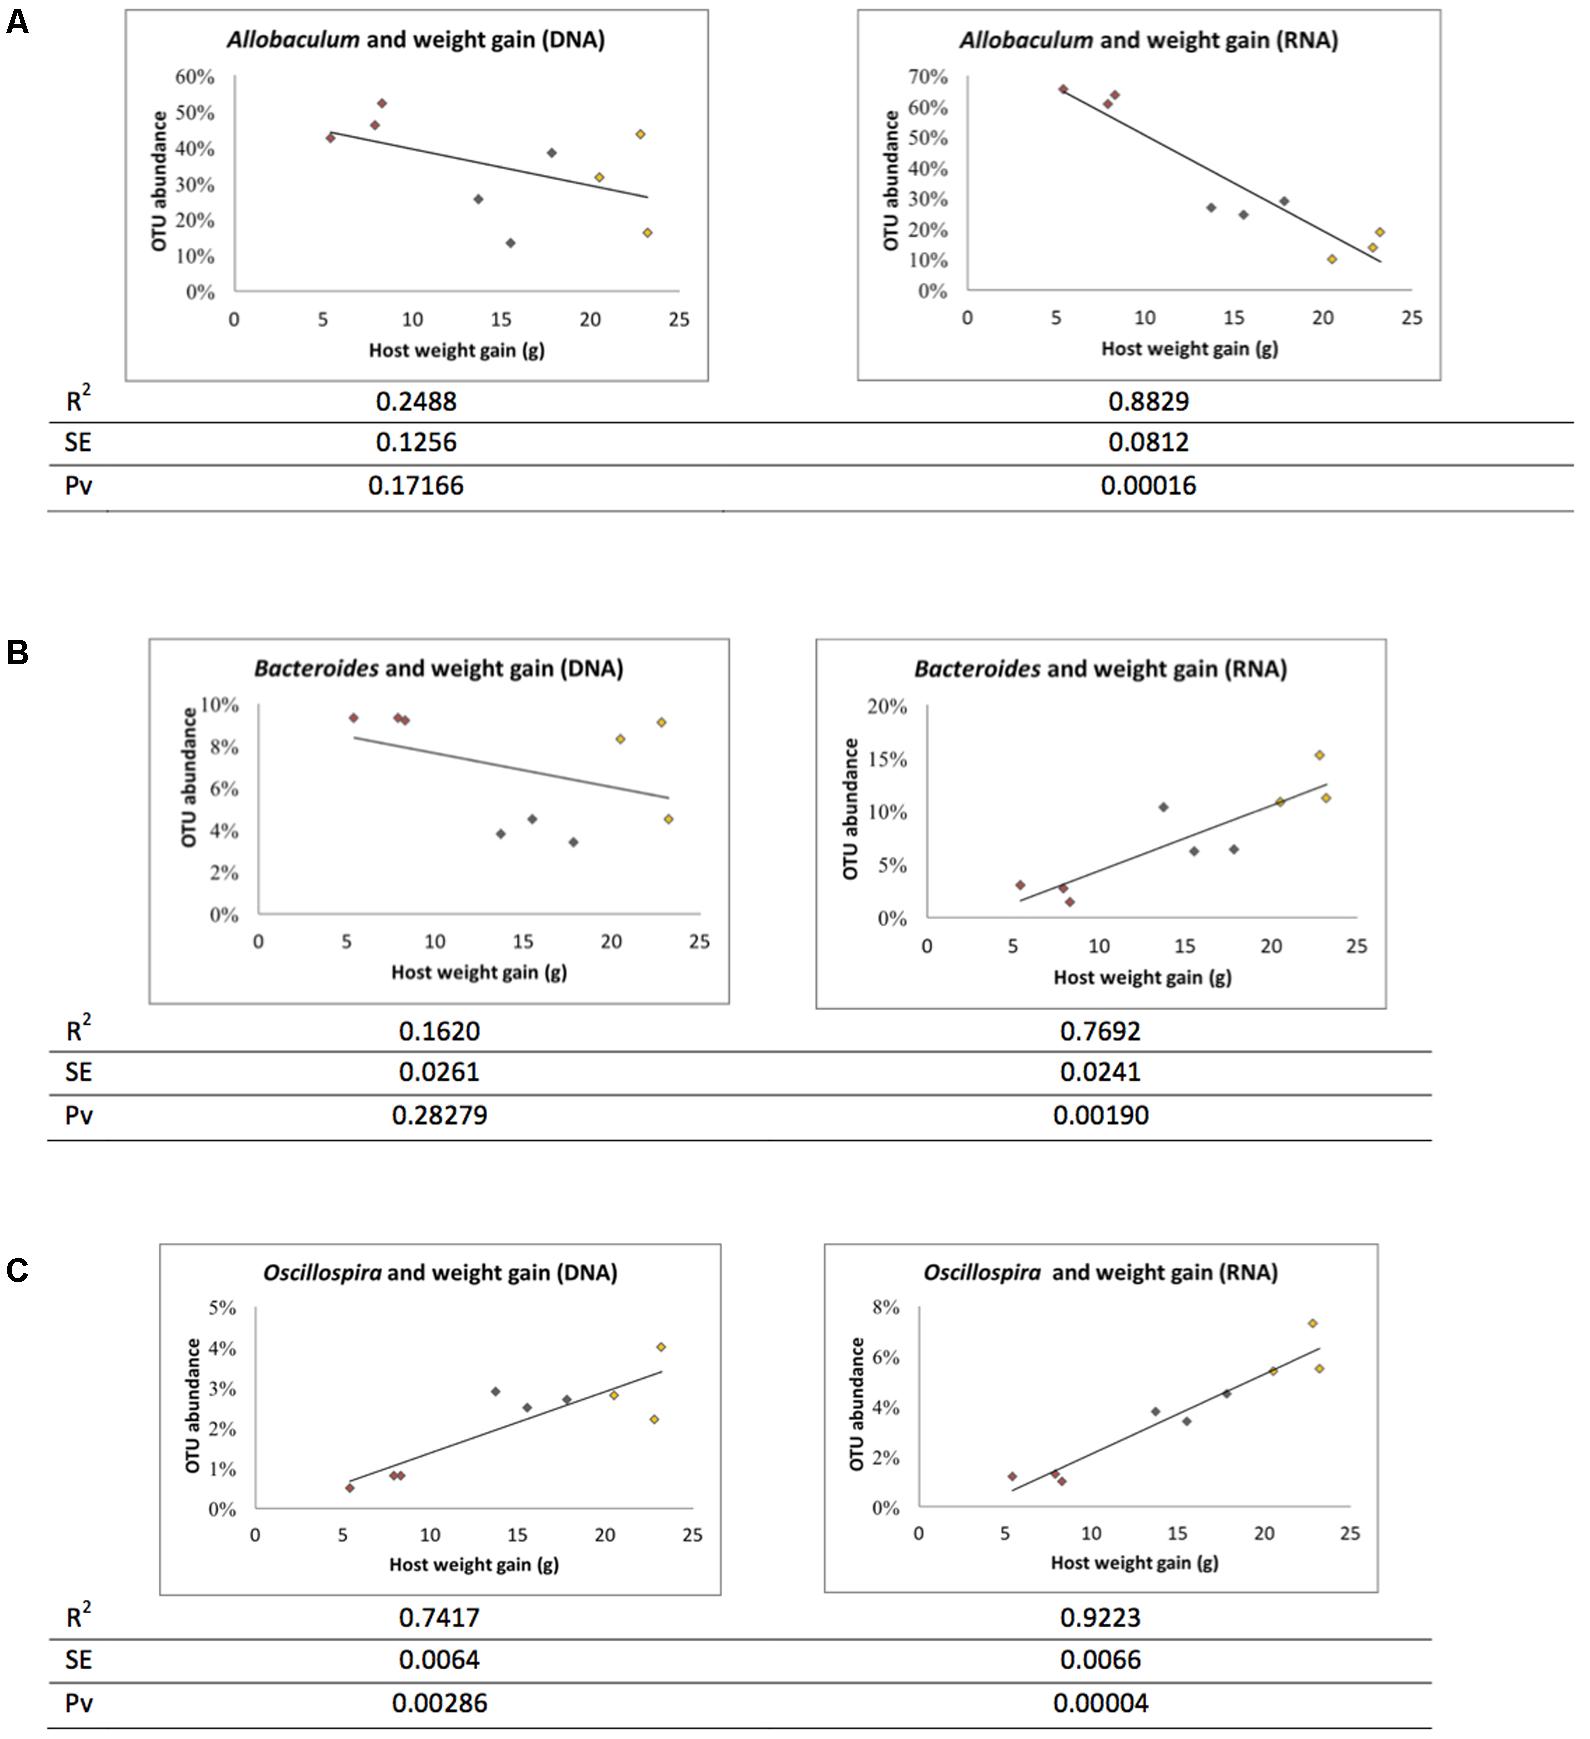
FIGURE 7. Correlation between microbiota and weight gain. Correlation graph and R square (R2), standard error (SE) and Pearson correlation coefficient p-value (Pv) were derived based on weight gain. (A) Allobaculum, (B) Bacteroidetes, and (C) Oscillospira. Red: LFD; orange: HFD; black: HFD+LGG.
Discussion
Microbiota plays an essential role in host energy metabolism and it constitutes a complex ecosystem averaging 70 different bacterial divisions that colonize the gut of an adult (Gérard, 2016). However, the specific number and activities of these microbes vary with regard to environmental factors; in fact, the metabolic status of these microbial groups may range from active to dormant, this being crucial in understanding and explaining the role of gut microbiota (Blazewicz et al., 2013). Our study compared the microbiome of high fat diet induced obese mice with or without probiotics using microbial rRNA and gDNA in order to gain a deeper understanding of those microbiota that are actively associated with a high fat diet and modulated by probiotic treatment. Ribosomal RNA comprises more than 80% of the total RNA with the overall amount of RNA correlating with growth and activity of microbes (Neidhardt and Magasanik, 1960; Kramer and Singleton, 1992; Tolker-Nielsen et al., 1997; Ramos et al., 2000). This basic principle was widely applied in various studies to define the existence of active microbiota in an environment (Wüst et al., 2011; Hunt et al., 2013; Männistö et al., 2013). Based on these considerations, we have designed our experiments to reveal specific information on metabolically active groups of the gut microbiome in a diet induced obesity (DIO) murine model and under application of the widely studied probiotic LGG.
The impact of GIT microbiota on host energy metabolism has been widely studied in recent years. However, a key, albeit a controversial issue, is to define core microbial assemblages associated with host weight gain and adipose tissue accumulation. This is underpinned by the rapid increase in body fat mass of germ-free mice colonized with gut microbiota from conventionally housed mice, in spite of decreased food consumption (Bäckhed et al., 2004). Even more interestingly, a greater weight increase in germ-free mice after colonization with microbiota from obese mice as compared to experimental animals colonized with microbiota from lean mice has also been reported (Turnbaugh et al., 2006). It appears indisputable that host gut microbiota exercise leverage over energy efficiency and adipose tissue accumulation, as has also been supported by gnotobiotic mice studies (Cani et al., 2008; Delzenne et al., 2011; Greiner and Bäckhed, 2011).
Recently, specific bacterial genera such as Akkermansia (Shin et al., 2014) and Faecalibacterium (Miquel et al., 2015) were reported as microbial groups important to host health, with e.g., Akkermansia muciniphila numbers found to be inversely correlated with inflammatory conditions and metabolic disorders in mice (Schneeberger et al., 2015). Based on findings showing Bacteroidetes not to be correlated with host weight gain, Ley et al. (2005) first proposed a possible correlation of the Firmicutes: Bacteroidetes ratio with propensity of host obesity. Yet, conflicting reports are increasingly pointing toward the role of the Bacteroidetes phylum, or its sub-groups, in influencing host energy efficiency (Larsen et al., 2010; Semova et al., 2012). DNA analysis in our study showed that the Bacteroidetes (in particular Bacteroides spp.) in the GIT was not correlated with host weight gain under a high fat diet (HFD) while, in contrast, a significantly positive correlation was found based on metabolic activity (RNA based data) of this phylum when compared with a low fat diet (LFD). The Firmicutes represents a vastly diverse phylum, comprising the three different classes Bacilli, Clostridia, and Erysipelotrichia (apart from the cell-wall-less Mollicutes). Our data show opposite roles for Clostridia (Oscillospira spp.) and Erysipelotrichia (Allobaculum spp.) associated with host weight. Erysipelotrichaceae and Allobaculum appear to represent the key family and genus, respectively, of the class Erysipelotrichia of relevance to host metabolic disorders. This issue is extensively discussed in various articles including a review article by Kaakoush (2015), who also refers to conflicting reports resulting in contradictions in the definition of the role of the Erysipelotrichia in host metabolic disorders. Briefly, Turnbaugh et al. (2008) and Zhang et al. (2009) reported increasing numbers of Erysipelotrichaceae in diet induced obese mice and in obese individuals, while Ravussin et al. (2012) and Everard et al. (2014) found Allobaculum to be negatively correlated with DIO. Our study suggests a negative correlation of Allobaculum activity with DIO, but not when considering the data obtained by whole community analysis. The Clostridia class comprising Ruminococcus and Oscillospira is closely associated with host energy efficiency and digestibility of carbohydrates (Tims et al., 2013; Salonen et al., 2014). In our study, RNA analysis showed a reduction of Oscillospira to be correlated with the lower weight of the HFD+LGG group. It is therefore hypothesized that an indirect reduction of host energy efficiency by LGG may result in a reduced metabolic activity of Oscillospira in the gut. Thus, the impact of LGG on calorie consumption apparently affects weight and gut microbiota. LGG is one of the most widely studied probiotics for its functionality, especially with regard to metabolic syndrome (Vajro et al., 2011; Ji et al., 2012; Bull-Otterson et al., 2013; Kim et al., 2013; Lahti et al., 2013; Canani et al., 2016). Kim et al. (2013), for example, reported that LGG improved insulin sensitivity and reduced adiposity in a DIO mice model, together with a significant reduction of SREBP1c in mesenteric adipose tissue as a key biomarker of anti-obesity effects. However, microbiome modulatory effects of LGG have only been rarely reported, and, as far as we know, no study has defined modulation of the active microbiota after LGG treatment.
Administration of probiotics is considered as a promising approach to modulate host microbiota in a beneficial way (Steer et al., 2000; Jia et al., 2008). Anti-obesity effects of probiotics have been reported in animal models (Ji et al., 2012; Park et al., 2013; Wang et al., 2015; Alard et al., 2016) and in clinical trials (Woodard et al., 2009; Kadooka et al., 2010; Kondo et al., 2010). Kadooka et al. (2010) investigated the anti-obesity effect of the probiotic strain L. gasseri SBT2055 by conducting a double-blind, randomized, placebo-controlled intervention trial with 87 overweight and obese subjects for 12 weeks. The data confirmed that abdominal visceral and subcutaneous fat, weight, BMI, waist and hip measurements were significantly reduced in the group consuming the probiotic. Larsen et al. (2013) reported fecal microbiota not to be significantly altered in obese adolescent groups after administration of the anti-inflammatory strain L. salivarius Ls-33, an observation confirmed in an HFD mouse model (Alard et al., 2016).
We compared metagenome results, respectively, obtained with gDNA and rRNA based analysis. Some of the major groups such as Bacteroides spp., Oscillospira spp., and Ruminococcus spp. were identified as metabolically active microorganisms and are probably responsible for the DIO status of the murine model. Hiergeist et al. (2015) have underlined the key role of the microbiome composition in developmental processes, in host metabolism and physiology, and in different diseases. They have emphasized the importance of experimental protocols and bioinformatics analysis that may have a major impact on the outcome and final interpretation of results. Our data suggest metabolically active Bacteroides to be positively correlated with weight gain.
Characterisation of microbial populations by rRNA data may provide deeper insight in complex ecosystem-related microbial interactions. Yet, extensive experimental data are required to correlate rRNA data both to growth related and non-growth metabolic activities (Blazewicz et al., 2013). This may particularly be applicable to the gut microbial ecosystem and its diverse compartments.
Author Contributions
YJ, SP, and WH designed the study, and, together with HP and EH, supported the animal trial work and SCFA analysis. YJ and SP prepared the microbiome DNA and RNA and generated 16S amplicons for sequencing and also conducted the bioinformatic analysis of the data. YJ and WH drafted and prepared the manuscript while BP and HS were involved in the editing of the manuscript. All authors approved the final version.
Funding
This study was supported by the Bio & Medical Technology Development Program of the National Research Foundation (NRF) funded by Korean Government (2016M3A9A5923160) and the Strategic Initiative for Microbiomes in Agriculture and Food (916002-02-1-CG000).
Conflict of Interest Statement
The authors declare that the research was conducted in the absence of any commercial or financial relationships that could be construed as a potential conflict of interest.
Acknowledgments
Support of the research by the National Research Foundation (NRF) and the Global Ph.D. Fellowship Program of the NRF of Korea is gratefully acknowledged.
Supplementary Material
The Supplementary Material for this article can be found online at: https://www.frontiersin.org/articles/10.3389/fmicb.2018.00710/full#supplementary-material
References
Alard, J., Lehrter, V., Rhimi, M., Mangin, I., Peucelle, V., Abraham, A. L., et al. (2016). Beneficial metabolic effects of selected probiotics on diet-induced obesity and insulin resistance in mice are associated with improvement of dysbiotic gut microbiota. Environ. Microbiol. 18, 1484–1497. doi: 10.1111/1462-2920.13181
Armougom, F., Henry, M., Vialettes, B., Raccah, D., and Raoult, D. (2009). Monitoring bacterial community of human gut microbiota reveals an increase in Lactobacillus in obese patients and Methanogens in anorexic patients. PLoS One 4:e7125. doi: 10.1371/journal.pone.0007125
Bäckhed, F., Ding, H., Wang, T., Hooper, L. V., Koh, G. Y., Nagy, A., et al. (2004). The gut microbiota as an environmental factor that regulates fat storage. Proc. Natl. Acad. Sci. U.S.A. 101, 15718–15723. doi: 10.1073/pnas.0407076101
Baldrian, P., Kolarik, M., Stursova, M., Kopecky, J., Valaskova, V., Vetrovsky, T., et al. (2012). Active and total microbial communities in forest soil are largely different and highly stratified during decomposition. ISME J. 6, 248–258. doi: 10.1038/ismej.2011.95
Blazewicz, S. J., Barnard, R. L., Daly, R. A., and Firestone, M. K. (2013). Evaluating rRNA as an indicator of microbial activity in environmental communities: limitations and uses. ISME J. 7, 2061–2068. doi: 10.1038/ismej.2013.102
Bull-Otterson, L., Feng, W., Kirpich, I., Wang, Y., Qin, X., Liu, Y., et al. (2013). Metagenomic analyses of alcohol induced pathogenic alterations in the intestinal microbiome and the effect of Lactobacillus rhamnosus GG treatment. PLoS One 8:e53028. doi: 10.1371/journal.pone.0053028
Canani, R. B., Sangwan, N., Stefka, A. T., Nocerino, R., Paparo, L., Aitoro, R., et al. (2016). Lactobacillus rhamnosus GG-supplemented formula expands butyrate-producing bacterial strains in food allergic infants. ISME J. 10, 742–750. doi: 10.1038/ismej.2015.151
Cani, P. D., Bibiloni, R., Knauf, C., Waget, A., Neyrinck, A. M., Delzenne, N. M., et al. (2008). Changes in gut microbiota control metabolic endotoxemia-induced inflammation in high-fat diet-induced obesity and diabetes in mice. Diabetes Metab. Res. Rev. 57, 1470–1481. doi: 10.2337/db07-1403
Cani, P. D., and Delzenne, N. M. (2009). Interplay between obesity and associated metabolic disorders: new insights into the gut microbiota. Curr. Opin. Pharmacol. 9, 737–743. doi: 10.1016/j.coph.2009.06.016
Caporaso, J. G., Kuczynski, J., Stombaugh, J., Bittinger, K., Bushman, F. D., Costello, E. K., et al. (2010). QIIME allows analysis of high-throughput community sequencing data. Nat. Methods 7, 335–336. doi: 10.1038/nmeth.f.303
Delzenne, N. M., Neyrinck, A. M., and Cani, P. D. (2011). Modulation of the gut microbiota by nutrients with prebiotic properties: consequences for host health in the context of obesity and metabolic syndrome. Microb. Cell Fact. 10(Suppl. 1):S10. doi: 10.1186/1475-2859-10-S1-S10
Everard, A., Lazarevic, V., Gaia, N., Johansson, M., Stahlman, M., Bäckhed, F., et al. (2014). Microbiome of prebiotic-treated mice reveals novel targets involved in host response during obesity. ISME J. 8, 2116–2130. doi: 10.1038/ismej.2014.45
Fouhy, F., Clooney, A. G., Stanton, C., Claesson, M. J., and Cotter, P. D. (2016). 16S rRNA gene sequencing of mock microbial populations- impact of DNA extraction method, primer choice and sequencing platform. BMC Microbiol. 16:123. doi: 10.1186/s12866-016-0738-z
Gaspar, J. M., and Thomas, W. K. (2015). FlowClus: efficiently filtering and denoising pyrosequenced amplicons. BMC Bioinformatics 16:105. doi: 10.1186/s12859-015-0532-1
Gérard, P. (2016). Gut microbiota and obesity. Cell. Mol. Life Sci. 73, 147–162. doi: 10.1007/s00018-015-2061-5
Greiner, T., and Bäckhed, F. (2011). Effects of the gut microbiota on obesity and glucose homeostasis. Trends Endocrinol. Metab. 22, 117–123. doi: 10.1016/j.tem.2011.01.002
Hiergeist, A., Gläsner, A., Reischl, U., and Gessner, A. (2015). Analyses of intestinal microbiota: culture versus sequencing. ILAR J. 56, 228–240. doi: 10.1093/ilar/ilv017
Human Microbiome Project Consortium. (2012). A framework for human microbiome research. Nature 486, 215–221. doi: 10.1038/nature11209
Hunt, D. E., Lin, Y., Church, M. J., Karl, D. M., Tringe, S. G., Izzo, L. K., et al. (2013). Relationship between abundance and specific activity of bacterioplankton in open ocean surface waters. Appl. Environ. Microbiol. 79, 177–184. doi: 10.1128/AEM.02155-12
Ji, Y. S., Kim, H. N., Park, H. J., Lee, J. E., Yeo, S. Y., Yang, J. S., et al. (2012). Modulation of the murine microbiome with a concomitant anti-obesity effect by Lactobacillus rhamnosus GG and Lactobacillus sakei NR28. Benef. Microbes 3, 13–22. doi: 10.3920/BM2011.0046
Jia, W., Li, H., Zhao, L., and Nicholson, J. K. (2008). Gut microbiota: a potential new territory for drug targeting. Nat. Rev. Drug Discov. 7, 123–129. doi: 10.1038/nrd2505
Kaakoush, N. O. (2015). Insights into the role of Erysipelotrichaceae in the human host. Front. Cell. Infect. Microbiol. 5:84. doi: 10.3389/fcimb.2015.00084
Kadooka, Y., Sato, M., Imaizumi, K., Ogawa, A., Ikuyama, K., Akai, Y., et al. (2010). Regulation of abdominal adiposity by probiotics (Lactobacillus gasseri SBT2055) in adults with obese tendencies in a randomized controlled trial. Eur. J. Clin. Nutr. 64, 636–643. doi: 10.1038/ejcn.2010.19
Kasai, C., Sugimoto, K., Moritani, I., Tanaka, J., Oya, Y., Inoue, H., et al. (2015). Comparison of the gut microbiota composition between obese and non-obese individuals in a Japanese population, as analyzed by terminal restriction fragment length polymorphism and next-generation sequencing. BMC Gastroenterol. 15:100. doi: 10.1186/s12876-015-0330-2
Kim, S.-W., Park, K.-Y., Kim, B., Kim, E., and Hyun, C.-K. (2013). Lactobacillus rhamnosus GG improves insulin sensitivity and reduces adiposity in high-fat diet-fed mice through enhancement of adiponectin production. Biochem. Biophys. Res. Commun. 431, 258–263. doi: 10.1016/j.bbrc.2012.12.121
Kondo, S., Xiao, J. Z., Satoh, T., Odamaki, T., Takahashi, S., Sugahara, H., et al. (2010). Antiobesity effects of Bifidobacterium breve strain B-3 supplementation in a mouse model with high-fat diet-induced obesity. Biosci. Biotechnol. Biochem. 74, 1656–1661. doi: 10.1271/bbb.100267
Kramer, J. G., and Singleton, F. L. (1992). Variations in rRNA content of marine Vibrio spp. during starvation-survival and recovery. Appl. Environ. Microbiol. 58, 201–207.
Lagier, J. C., Khelaifia, S., Alou, M. T., Ndongo, S., Dione, N., Hugon, P., et al. (2016). Culture of previously uncultured members of the human gut microbiota by culturomics. Nat. Microbiol. 1:16203. doi: 10.1038/NMICROBIOL.2016.203
Lahti, L., Salonen, A., Kekkonen, R. A., Salojärvi, J., Jalanka-Tuovinen, J., Palva, A., et al. (2013). Associations between the human intestinal microbiota, Lactobacillus rhamnosus GG and serum lipids indicated by integrated analysis of high-throughput profiling data. PeerJ 1:e32. doi: 10.7717/peerj.32
Larsen, N., Vogensen, F. K., Gobel, R. J., Michaelsen, K. F., Forssten, S. D., Lahtinen, S. J., et al. (2013). Effect of Lactobacillus salivarius Ls-33 on fecal microbiota in obese adolescents. Clin. Nutr. 32, 935–940. doi: 10.1016/j.clnu.2013.02.007
Larsen, N., Vogensen, F. K., van den Berg, F. W., Nielsen, D. S., Andreasen, A. S., Pedersen, B. K., et al. (2010). Gut microbiota in human adults with type 2 diabetes differs from non-diabetic adults. PLoS One 5:e9085. doi: 10.1371/journal.pone.0009085
Ley, R. E., Bäckhed, F., Turnbaugh, P., Lozupone, C. A., Knight, R. D., and Gordon, J. I. (2005). Obesity alters gut microbial ecology. Proc. Natl. Acad. Sci. U.S.A. 102, 11070–11075. doi: 10.1073/pnas.0504978102
Li, F., Henderson, G., Sun, X., Cox, F., Janssen, P. H., and Guan, L. L. (2016). Taxonomic assessment of rumen microbiota using total RNA and targeted amplicon sequencing approaches. Front. Microbiol. 7:987. doi: 10.3389/fmicb.2016.00987
Liu, R. T. (2017). The microbiome as a novel paradigm in studying stress and mental health. Am. Psychol. 72, 655–667. doi: 10.1037/amp0000058
Livak, K. J., and Schmittgen, T. D. (2001). Analysis of relative gene expression data using real-time quantitative PCR and the 2-ΔΔCT Method. Methods 25, 402–408. doi: 10.1006/meth.2001.1262
Männistö, M. K., Kurhela, E., Tiirola, M., and Häggblom, M. M. (2013). Acidobacteria dominate the active bacterial communities of Arctic tundra with widely divergent winter-time snow accumulation and soil temperatures. FEMS Microbiol. Ecol. 84, 47–59. doi: 10.1111/1574-6941.12035
Miquel, S., Leclerc, M., Martin, R., Chain, F., Lenoir, M., Raguideau, S., et al. (2015). Identification of metabolic signatures linked to anti-inflammatory effects of Faecalibacterium prausnitzii. MBio 6:e300-15. doi: 10.1128/mBio.00300-15
Neidhardt, F. C., and Magasanik, B. (1960). Studies on the role of ribonucleic acid in the growth of bacteria. Biochim. Biophys. Acta 42, 99–116. doi: 10.1016/0006-3002(60)90757-5
Nicholson, J. K., Holmes, E., Kinross, J., Burcelin, R., Gibson, G., Jia, W., et al. (2012). Host-gut microbiota metabolic interactions. Science 336, 1262–1267. doi: 10.1126/science.1223813
Park, D. Y., Ahn, Y. T., Park, S. H., Huh, C. S., Yoo, S. R., Yu, R., et al. (2013). Supplementation of Lactobacillus curvatus HY7601 and Lactobacillus plantarum KY1032 in diet-induced obese mice is associated with gut microbial changes and reduction in obesity. PLoS One 8:e59470. doi: 10.1371/journal.pone.0059470
Pérez-Cobas, A. E., Gosalbes, M. J., Friedrichs, A., Knecht, H., Artacho, A., Eismann, K., et al. (2013). Gut microbiota disturbance during antibiotic therapy: a multi-omic approach. Gut 62, 1591–1601. doi: 10.1136/gutjnl-2012-303184
Peris-Bondia, F., Latorre, A., Artacho, A., Moya, A., and D’Auria, G. (2011). The active human gut microbiota differs from the total microbiota. PLoS One 6:e22448. doi: 10.1371/journal.pone.0022448
Ramos, C., Mølbak, L., and Molin, S. (2000). Bacterial activity in the rhizosphere analyzed at the single-cell level by monitoring ribosome contents and synthesis rates. Appl. Environ. Microbiol. 66, 801–809. doi: 10.1128/AEM.66.2.801-809.2000
Raoult, D. (2008). Obesity pandemics and the modification of digestive bacterial flora. Eur. J. Clin. Microbiol. Infect. Dis. 27, 631–634. doi: 10.1007/s10096-008-0490-x
Ravussin, Y., Koren, O., Spor, A., LeDuc, C., Gutman, R., Stombaugh, J., et al. (2012). Responses of gut microbiota to diet composition and weight loss in lean and obese mice. Obesity 20, 738–747. doi: 10.1038/oby.2011.111
Salonen, A., Lahti, L., Salojarvi, J., Holtrop, G., Korpela, K., Duncan, S. H., et al. (2014). Impact of diet and individual variation on intestinal microbiota composition and fermentation products in obese men. ISME J. 8, 2218–2230. doi: 10.1038/ismej.2014.63
Sanz, Y., Olivares, M., Moya-Perez, A., and Agostoni, C. (2015). Understanding the role of gut microbiome in metabolic disease risk. Pediatr. Res. 77, 236–244. doi: 10.1038/pr.2014.170
Schneeberger, M., Everard, A., Gómez-Valadés, A. G., Matamoros, S., Ramírez, S., Delzenne, N. M., et al. (2015). Akkermansia muciniphila inversely correlates with the onset of inflammation, altered adipose tissue metabolism and metabolic disorders during obesity in mice. Sci. Rep. 5:16643. doi: 10.1038/srep16643
Schwiertz, A., Taras, D., Schafer, K., Beijer, S., Bos, N. A., Donus, C., et al. (2010). Microbiota and SCFA in lean and overweight healthy subjects. Obesity 18, 190–195. doi: 10.1038/oby.2009.167
Semova, I., Carten, J. D., Stombaugh, J., Mackey, L. C., Knight, R., Farber, S. A., et al. (2012). Microbiota regulate intestinal absorption and metabolism of fatty acids in the zebrafish. Cell Host Microbe 12, 277–288. doi: 10.1016/j.chom.2012.08.003
Shin, N. R., Lee, J. C., Lee, H. Y., Kim, M. S., Whon, T. W., Lee, M. S., et al. (2014). An increase in the Akkermansia spp. population induced by metformin treatment improves glucose homeostasis in diet-induced obese mice. Gut 63, 727–735. doi: 10.1136/gutjnl-2012-303839
Steer, T., Carpenter, H., Tuohy, K., and Gibson, G. R. (2000). Perspectives on the role of the human gut microbiota and its modulation by pro- and prebiotics. Nutr. Res. Rev. 13, 229–254. doi: 10.1079/095442200108729089
Tims, S., Derom, C., Jonkers, D. M., Vlietinck, R., Saris, W. H., Kleerebezem, M., et al. (2013). Microbiota conservation and BMI signatures in adult monozygotic twins. ISME J. 7, 707–717. doi: 10.1038/ismej.2012.146
Tolker-Nielsen, T., Larsen, M. H., Kyed, H., and Molin, S. (1997). Effects of stress treatments on the detection of Salmonella typhimurium by in situ hybridization. Int. J. Food Microbiol. 35, 251–258. doi: 10.1016/S0168-1605(97)01242-7
Turnbaugh, P. J., Bäckhed, F., Fulton, L., and Gordon, J. I. (2008). Diet-induced obesity is linked to marked but reversible alterations in the mouse distal gut microbiome. Cell Host Microbe 3, 213–223. doi: 10.1016/j.chom.2008.02.015
Turnbaugh, P. J., Ley, R. E., Mahowald, M. A., Magrini, V., Mardis, E. R., and Gordon, J. I. (2006). An obesity-associated gut microbiome with increased capacity for energy harvest. Nature 444, 1027–1031. doi: 10.1038/nature05414
Ussar, S., Griffin, N. W., Bezy, O., Fujisaka, S., Vienberg, S., Softic, S., et al. (2015). Interactions between gut microbiota, host genetics and diet modulate the predisposition to obesity and metabolic syndrome. Cell Metab. 22, 516–530. doi: 10.1016/j.cmet.2015.07.007
Utzschneider, K. M., Kratz, M., Damman, C. J., and Hullarg, M. (2016). Mechanisms linking the gut microbiome and glucose metabolism. J. Clin. Endocrinol. Metab. 101, 1445–1454. doi: 10.1210/jc.2015-4251
Vajro, P., Mandato, C., Licenziati, M. R., Franzese, A., Vitale, D. F., Lenta, S., et al. (2011). Effects of Lactobacillus rhamnosus strain GG in pediatric obesity-related liver disease. J. Pediatr. Gastroenterol. Nutr. 52, 740–743. doi: 10.1097/MPG.0b013e31821f9b85
Walker, A. W., Martin, J. C., Scott, P., Parkhill, J., Flint, H. J., and Scott, K. P. (2015). 16S rRNA gene-based profiling of the human infant gut microbiota is strongly influenced by sample processing and PCR primer choice. Microbiome 3:26. doi: 10.1186/s40168-015-0087-4
Wang, J., Tang, H., Zhang, C., Zhao, Y., Derrien, M., Rocher, E., et al. (2015). Modulation of gut microbiota during probiotic-mediated attenuation of metabolic syndrome in high fat diet-fed mice. ISME J. 9, 1–15. doi: 10.1038/ismej.2014.99
Woodard, G. A., Encarnacion, B., Downey, J. R., Peraza, J., Chong, K., Hernandez-Boussard, T., et al. (2009). Probiotics improve outcomes after Roux-en-Y gastric bypass surgery: a prospective randomized trial. J. Gastrointest. Surg. 13, 1198–1204. doi: 10.1007/s11605-009-0891-x
Wüst, P. K., Horn, M. A., and Drake, H. L. (2011). Clostridiaceae and Enterobacteriaceae as active fermenters in earthworm gut content. ISME J. 5, 92–106. doi: 10.1038/ismej.2010.99
Yatsunenko, T., Rey, F. E., Manary, M. J., Trehan, I., Dominguez-Bello, M. G., Contreras, M., et al. (2012). Human gut microbiome viewed across age and geography. Nature 486, 222–227. doi: 10.1038/nature11053
Zhang, H., DiBaise, J. K., Zuccolo, A., Kudrna, D., Braidotti, M., Yu, Y., et al. (2009). Human gut microbiota in obesity and after gastric bypass. Proc. Natl. Acad. Sci. U.S.A. 106, 2365–2370. doi: 10.1073/pnas.0812600106
Keywords: 16S rDNA analysis, 16S rRNA analysis, gut microbiota, obesity, LGG
Citation: Ji Y, Park S, Park H, Hwang E, Shin H, Pot B and Holzapfel WH (2018) Modulation of Active Gut Microbiota by Lactobacillus rhamnosus GG in a Diet Induced Obesity Murine Model. Front. Microbiol. 9:710. doi: 10.3389/fmicb.2018.00710
Received: 21 December 2017; Accepted: 27 March 2018;
Published: 10 April 2018.
Edited by:
Marina G. Kalyuzhanaya, San Diego State University, United StatesReviewed by:
Maria de los Angeles Serradell, Consejo Nacional de Investigaciones Científicas y Técnicas (CONICET), ArgentinaAlinne Castro, Universidade Católica Dom Bosco, Brazil
Copyright © 2018 Ji, Park, Park, Hwang, Shin, Pot and Holzapfel. This is an open-access article distributed under the terms of the Creative Commons Attribution License (CC BY). The use, distribution or reproduction in other forums is permitted, provided the original author(s) and the copyright owner are credited and that the original publication in this journal is cited, in accordance with accepted academic practice. No use, distribution or reproduction is permitted which does not comply with these terms.
*Correspondence: Wilhelm H. Holzapfel, wilhelm@woodapple.net