 Alfredo Pérez-de-Mora1,2†
 Anna Lacourt1Michaye L. McMaster3Xiaoming Liang1
 Sandra M. Dworatzek4
 Elizabeth A. Edwards1*
- 1Department of Chemical Engineering & Applied Chemistry, University of Toronto, Toronto, ON, Canada
- 2Research Unit Analytical Biogeochemistry, Department of Environmental Sciences, Helmholtz Zentrum München, Neuherberg, Germany
- 3Geosyntec Consultants, Guelph, ON, Canada
- 4SiREM, Guelph, ON, Canada
Dehalococcoides mccartyi (D. mccartyi) strains differ primarily from one another by the number and identity of the reductive dehalogenase homologous catalytic subunit A (rdhA) genes within their respective genomes. While multiple rdhA genes have been sequenced, the activity of the corresponding proteins has been identified in only a few cases. Examples include the enzymes whose substrates are groundwater contaminants such as trichloroethene (TCE), cis-dichloroethene (cDCE) and vinyl chloride (VC). The associated rdhA genes, namely tceA, bvcA, and vcrA, along with the D. mccartyi 16S rRNA gene are often used as biomarkers of growth in field samples. In this study, we monitored an additional 12 uncharacterized rdhA sequences identified in the metagenome in the mixed D. mccartyi-containing culture KB-1 to monitor population shifts in more detail. Quantitative PCR (qPCR) assays were developed for 15 D. mccartyi rdhA genes and used to measure population diversity in 11 different sub-cultures of KB-1, each enriched on different chlorinated ethenes and ethanes. The proportion of rdhA gene copies relative to D. mccartyi 16S rRNA gene copies revealed the presence of multiple distinct D. mccartyi strains in each culture, many more than the two strains inferred from 16S rRNA analysis. The specific electron acceptor amended to each culture had a major influence on the distribution of D. mccartyi strains and their associated rdhA genes. We also surveyed the abundance of rdhA genes in samples from two bioaugmented field sites (Canada and United Kingdom). Growth of the dominant D. mccartyi strain in KB-1 was detected at the United Kingdom site. At both field sites, the measurement of relative rdhA abundances revealed D. mccartyi population shifts over time as dechlorination progressed from TCE through cDCE to VC and ethene. These shifts indicate a selective pressure of the most abundant chlorinated electron acceptor, as was also observed in lab cultures. These results also suggest that reductive dechlorination at contaminated sites is brought about by multiple strains of D. mccartyi whether or not the site is bioaugmented. Understanding the driving forces behind D. mccartyi population selection and activity is improving predictability of remediation performance at chlorinated solvent contaminated sites.
Introduction
There are thousands of public and private sites with chlorinated solvent groundwater contamination problems (McCarty, 2010). Chlorinated volatile organic compounds (cVOCs) such as tetrachloroethene (PCE) and trichloroethene (TCE) as well as their daughter products including the isomers of dichloroethene (DCE) and vinyl chloride (VC) are highly toxic compounds and TCE and VC are recognized human carcinogens by the National Toxicology Program. Clean-up of groundwater contaminated with these compounds takes time and is costly. Biostimulation (electron donor addition) and bioaugmentation (addition of inoculum) have gained significant acceptance as viable approaches for treatment of chlorinated ethenes in the subsurface (Stroo et al., 2010). The primary biotransformation mechanism for chlorinated ethenes in groundwater is reductive dechlorination under anaerobic conditions, which involves a stepwise replacement of Cl atoms with H atoms following the sequence: PCE, TCE, DCE (mainly cDCE), VC and finally non-toxic ethene (Maymó-Gatell et al., 2001; Duhamel et al., 2002, 2004; Cupples et al., 2003).
Diverse anaerobic microorganisms (e.g., Dehalococcoides, Desulfitobacterium, Dehalobacter, Sulfurospirillum, Desulfuromonas, Geobacter, Dehalogenimonas) can couple reductive dechlorination of chlorinated ethenes with growth in a process called organohalide respiration (Gerritse et al., 1996; Krumholz, 1997; Holliger et al., 1998; Luijten et al., 2003; Sung et al., 2006a; Moe et al., 2009). Nonetheless, dechlorination beyond DCE and VC has only been shown so far for members of the Dehalococcoidales, namely Dehalococcoides and Dehalogenimonas (Maymó-Gatell et al., 1997; Cupples et al., 2003; He et al., 2003; Duhamel et al., 2004; Sung et al., 2006b; Manchester et al., 2012; Yang et al., 2017). In practice, owing to subsurface heterogeneity, natural reductive dechlorination is incomplete in some locations, resulting in the accumulation of the daughter products cDCE and the carcinogen VC (Henry, 2010). This is generally attributed to poor mixing, lack of appropriate Dehalococcoides mccartyi organisms or electron donor, or inhibition of terminal dechlorination steps (Stroo et al., 2010).
Biostimulation and bioaugmentation with mixed cultures containing D. mccartyi can overcome stalling at cDCE or VC and reduce the time to clean up (Ellis et al., 2000; Major et al., 2002; Lendvay et al., 2003; Hood et al., 2008; Stroo et al., 2010; Dugat-Bony et al., 2012; Pérez-de-Mora et al., 2014; Kocur et al., 2016). The abundance of D. mccartyi in groundwater is most often assessed via quantitative PCR (qPCR) of the 16S rRNA gene (Rahm et al., 2006a; Lee et al., 2008; Hatt and Löffler, 2012; Hatt et al., 2013). While the abundance of D. mccartyi is general strongly correlated with dechlorination, sometimes dechlorination is still incomplete even at high abundance. The dechlorinating abilities of D. mccartyi strains is determined by the its complement of reductive dehalogenase genes and their activity. Thus, D. mccartyi strains with identical 16S rRNA may differ in the chlorinated compounds that they can respire and dehalogenate. Reductive dehalogenase enzymes (RDases) catalyze the cleavage of the carbon-halogen bond, and thus are an additional biomarker for tracking D. mccartyi strains. RDases are heterodimeric, membrane-bound enzymes, consisting of a catalytic active A unit of about 500 amino acids (aa) anchored outside of the cytoplasmic membrane by a small (100 aa) predicted integral membrane B subunit. These subunits are encoded by the so-called rdhA and rdhB genes, respectively (Smidt and de Vos, 2004). Due to their hydrophobic nature, oxygen sensitivity and complex association, only a few RDases have been biochemically characterized to date. Among these are the enzymes catalyzing the conversion of PCE to cDCE (coded by the pceA gene) and TCE to VC (coded by the tceA gene), as well as the RDases catalyzing the conversion of cDCE to ethene (coded by the bvcA and vcrA genes) (Magnuson et al., 1998, 2000; Krajmalnik-Brown et al., 2004; Müller et al., 2004; Fung et al., 2007; Tang et al., 2016). Quantitative PCR methods that target these specific genes have been developed and are being increasingly used as prognostic and diagnostic tools in the field to overcome the limitations of the 16S rRNA gene (Rahm et al., 2006b; Ritalahti et al., 2006, 2010; Lee et al., 2012; Lu et al., 2015).
The genomes of more than 10 D. mccartyi isolates have now been sequenced. These genomes are highly streamlined (∼1.4 Mb) and striking in their similarity, differing primarily in two regions termed High Plasticity Regions (HPR) on either side of the origin of replication (ORI). Each genome harbors many distinct full-length rdhAB homologous genes per genome (e.g., 17 in strain 195, 32 in strain CBDB1 and 36 in strain VS) (Kube et al., 2005; McMurdie et al., 2009; Seshadri et al., 2005). Hundreds if not thousands more putative rdhAB genes have been identified from metagenome sequencing efforts. Owing to the lack of functional characterization for most of this protein family, a sequence identity-based classification of orthologs into groups based on >90% aa identity was developed (Hug et al., 2013). This sequence-based classification was adopted prior to having a crystal structure to identify active site and other key residues. Fortunately, the two crystal structures recently solved (Bommer et al., 2014; Payne et al., 2015) support the original classification. The database of sequences and new ortholog groups continues to expand (Hug et al., 2013; Hug, 2016).
In this study, we aimed to distinguish different D. mccartyi strains from each other in mixed cultures and groundwater, where multiple D. mccartyi strains coexist. We define strains as genetic variants of D. mccartyi (e.g., differing in their rdhA complement) that have not necessarily been isolated as pure cultures. Our final aim was to better understand the contribution of native vs. introduced D. mccartyi to overall remediation at two contaminated sites where mixed dechlorinating culture KB-1 was used for bioaugmentation.
As it is very difficult to find unique regions within the genomes to distinguish strains, we decided to focus on quantifying a broader suite of rdhA genes, including both characterized and uncharacterized rdhA genes. We first compared the rdhA complement in the metagenome of the mixed culture KB-1 with those of eleven isolated D. mccartyi strains to identify rdhA sequences (and their corresponding Ortholog Groups) that are less commonly shared between strains. Methods for qPCR were developed for the selected rdhA genes and these assays were first tested in subcultures of KB-1 enriched on different chlorinated ethenes. Here, we hypothesized that a larger number of D. mccartyi strains should be present in the TCE-amended subcultures compared to those amended with cDCE, VC, or 1,2-DCA, because the latter have fewer dechlorination steps. Finally, we used the selected suite of rdhA genes to explore strain dynamics in groundwater samples from two sites that had been bioaugmented with KB-1.
Materials and Methods
Cultures and Growth Conditions
The KB-1 consortium is a functionally-stable enrichment culture that originated from microcosms consisting of aquifer material from a TCE-contaminated site in southern Ontario (Duhamel et al., 2002). KB-1 is routinely maintained in batch mode with TCE as electron acceptor, and dechlorinates PCE through TCE, cDCE, and VC to ethene. A transfer from the original KB-1 culture has been grown and used commercially for more than a decade for bioaugmentation at cVOC-contaminated sites1. The main organisms in the KB-1 culture have been investigated over the years via clone libraries, qPCR and metagenome sequencing (Duhamel and Edwards, 2006, 2007; Chan et al., 2011; Hug, 2012; Hug et al., 2012; Waller et al., 2012). Two dechlorinating genera have been identified in the culture, namely Dehalococcoides and Geobacter, that are supported by many other organisms such as fermenters, acetogens, and methanogens (Hug et al., 2012; Waller, 2009). Many years ago, the original TCE-fed KB-1 enrichment culture was used to inoculate various sub-cultures maintained on different terminal electron acceptors (TCE, cDCE, VC and 1,2-dichloroethane [1,2-DCA]). These subcultures have been maintained with methanol (M), hydrogen (H2), or a mixture of methanol and ethanol (ME) as electron donor. Supplementary Table S1 summarizes the main features and growth conditions of all the different cultures studied with the name format indicating electron acceptor amended/donor used and year created. The commercial KB-1 culture (KB-1®) is referred to as TCE/ME_2001_SiREM in Supplementary Table S1. All cultures were grown anaerobically in a defined minimum mineral medium (Duhamel et al., 2002). Cultures maintained at the University of Toronto are grown either in 0.25 L bottles sealed with screw caps with mininert valves or in 1 or 2 L glass bottles sealed with black butyl stoppers. Typically, bottles contained 10% by volume of headspace flushed with a N2/CO2 80%/20% as needed. These cultures are kept in the dark in an anaerobic glovebox at room temperature (22–25°C). At SiREM, KB-1 is grown in 100 L stainless steel vessels at 22–25°C. At the University of Toronto, dechlorinating cultures were typically re-amended every 2–3 weeks. Cultures maintained at SiREM are re-amended more frequently, typically every 3 to 4 days, as substrate is depleted.
KB-1 Metagenome Data and rdh Sequences
The parent KB-1 culture has been maintained at the University of Toronto since 1998 with TCE as the electron acceptor and methanol as the electron donor. This culture is referred to as “TCE/M_1998_Parent” in Supplementary Table S1 and all other KB-1 enrichments originated from this parent culture. The partially assembled metagenome sequence of TCE/M_1998_Parent is publically available at the Joint Genome Institute (JGI)2. Details on the extraction of genomic DNA for sequencing and the assembly of the KB-1 metagenome and of a draft chimeric genome of D. mccartyi strains are provided elsewhere (Hug et al., 2012; Islam et al., 2014). As the core genome of all D. mccartyi strains is almost identical, the search for unique non-coding regions in the metagenome yielded no positive results. The only differences found during comparative metagenomics were associated with the coding regions of the rdhA genes of the HPR regions. A total of 31 distinct rdhA gene sequences have been identified in the KB-1 cultures from multiple investigations (Hug, 2012; Hug and Edwards, 2013). Thirty sequences are associated with D. mccartyi, whereas one sequence is from the Geobacter population present in KB-1. Supplementary Table S2 compiles all previously identified KB-1 rdhAB sequences, which include the original 14 sequences found by Waller et al. (2005) as well as those identified more recently from metagenome sequencing (Hug et al., 2012) where an additional 13 rdhAB full sequences and two rdhA partial sequences were annotated (Hug and Edwards, 2013; Hug et al., 2013). For ease of reference and consistency, these additional rdhAB sequences have been renamed and are now deposited to Genbank under the accession numbers KP085015- KP085029 to replace the previous JGI gene locus tags (Supplementary Table S2).
Phylogenetic Analysis of rdhA Sequences
A total of 249 D. mccartyi rdhA sequences from sequenced and characterized isolated strains were retrieved from NCBI for phylogenic comparisons. These sequences include available sequences from eleven isolated and sequenced D. mccartyi strains, an incomplete set of 3 rdhA sequences from strain MB (available at the time of retrieval), and the rdhA sequences found in KB-1. The number of rdhA sequences contributed by each strain was as follows: 195 (17), Bav1 (10), BTF08 (20), CBDB1 (32), DCMB5 (23), FL2 (14), GT (20), GY50 (26), JNA (19), MB (3), VS (37), and KB-1 (28 [Dhc]+1 [Geobacter]). Two of the KB-1 D. mccartyi rdhA sequences and sequence VS_1308 are only partial sequences (less than 850 nucleotides) and were therefore not included in phylogenetic comparisons. Files containing all amino acid and nucleotide sequences as well as matching of tree nomenclature with protein names can be found in a folder labeled rdhA_Dhc_seq150420 at the following address: https://docs.google.com/folder/d/0BwCzK8wzlz8ON1o2Z3FTbHFPYXc/edit.
Phylogenetic analysis of rdhA nucleotide sequences, including bootstrapping, was performed with the ClustalX free software (version 2.0.12; University College Dublin3). All sequences were compared to each other by separate pairwise comparisons using the dynamic programming method with a gap opening of 10 (range of 0–100) and a gap extension of 0.1 (range 0–100). Results were then computed into a DNA weight matrix that determines the similarity of non-identical bases. Based on the DNA weight matrix, a dendrogram was constructed which in turn serves as guide for the final multiple alignment. Settings for the final multiple alignment were as follows: a gap opening penalty of 10 (range 0–100), a gap extension penalty of 0.2 (range 0–100), a delay divergent sequences switch set at 30% divergence and a DNA transition weight of 0.5 (range 0–1). The IUB weight matrix was used for computation. A phylogenetic tree was built using the Neighbor Joining (NJ) Algorithm with the same program. The NJ-tree was visualized and further edited with Figtree (version 1.4.0.1; Institute of Evolutionary Biology, University of Edinburgh4). The midpoint criterion was used for rooting.
A phylogenetic analysis based on rdhA amino acid sequences was also computed using the ClustalX v2.0.12. For computing the alignment, the following protein gap parameter options were considered: (i) the residue specific and hydrophilic residue penalties options were enabled, (ii) a gap separation distance of 4 (range 0–100) and (iii) no end gap separation, which treats end gaps the same way as internal gaps, was allowed. The phylogenetic tree was built using the Neighbor Joining (NJ) Algorithm and further visualized and edited with Figtree v1.4.0. As for the nucleotide-based phylogenetic tree the midpoint criterion was used for rooting. Ortholog groups were highlighted on the trees with Adobe Illustrator.
Groundwater Sampling and Site Description
Groundwater was collected from two TCE-contaminated sites prior to and after bioaugmentation with KB-1. The first site was located in Southern Ontario (ISSO site) and was characterized by contaminants in fractured bedrock. Supplementary Figure S1A shows details of relevant sampling dates and events related to this site. Samples corresponding to three different phases of the remediation were investigated: (i) predonor or pretreatment phase, (ii) biostimulation phase, consisting of the daily addition of ethanol as an electron donor and (iii) bioaugmentation phase, following the inoculation of KB-1 (Supplementary Figure S1A). At the ISSO site, a groundwater recirculation system consisting of two injection and three extraction wells was installed to improve the distribution of electron donor (ethanol) and microorganisms (Supplementary Figure S1B). During both the biostimulation and bioaugmentation phases, ethanol was added on a daily basis. Bioaugmentation with KB-1 consisted of one single addition of approximately 100 L of culture. Groundwater samples for molecular analysis were obtained from the composite pipeline, where groundwater from the three extraction wells was combined (Supplementary Figure S1B). Additional information on this site can be found in an earlier published study reporting on a microbial community survey at the site (Pérez-de-Mora et al., 2014).
The second site is located in the United Kingdom and consisted of a pilot test cell (30 m × 7 m × 4 m) for treatment of a DNAPL source area (∼1000 kg of DNAPL within the cell). The cell was conceived as an “in-Situ Laboratory” for investigating source area bioremediation (SaBRE project5). The relevant sampling dates and events related to this site and a sketch with sampling locations are shown in Supplementary Figures S2A,B. Samples for investigation were collected: (i) prior to any remediation action; and (ii) after donor addition of one single dose of donor SRSTM, a commercially available emulsified vegetable oil (Terra Systems, Inc.) and bioaugmentation with KB-1 (Supplementary Figure S2A). Groundwater was collected from fully screened sampling wells (SW) at four locations within the test cell: (i) at the influent (INF); (ii) within the source zone (SW70); (iii) within the plume (SW75); and (iv) at the effluent (EFF), also within the plume. The test cell was operated initially for a 90-day baseline period to establish steady-state pre-treatment conditions. Groundwater was extracted at an average of 1.4 l per minute, corresponding to an average residence time within the cell of 45 days. A total of 2,400 kg of SRSTM at a 5% concentration was used as the electron donor and injected along the test cell. Two weeks after donor injection approximately 65 L of KB-1 was added using the same injection ports that were used to add electron donor. Within the test cell, both TCE and cDCE were the main cVOCs. A dissolved phase plume emanating from the source and extending more than 400 m away was further characterized by the presence of VC and ethene.
The starting point (Day 0) was defined as the day following the end of the emulsified oil injection, which took approximately 1 week to complete. Further details on the SaBRE site can be found in technical bulletins freely available on the SaBRE-CL:Aire website (see above).
Nucleic Acid Extraction
Samples were collected from eleven different enrichment cultures at one or two times each during 2011 (Supplementary Table S1). Frozen DNA samples (-80°C) from the TCE/ME_2001_SiREM culture collected over 5 years were obtained from SiREM. DNA was also extracted from groundwater samples from the two field sites described above. For extraction and isolation of genomic DNA (gDNA), samples from cultures (10–50 mL) or groundwater (200–1000 mL) were filtered through SterivexTM (Millipore, MA, United States) (0.22 μm pore size) filters using a centrifugal pump and dual-trap (two liquid traps in series) system. Filters were subsequently stored at -80°C until further processing. For gDNA extraction, the casing of the filter was opened and the filter cut in about 30 pieces of similar size. The latter were introduced into a 2 mL nucleic acid extraction tube containing buffers and beads (Mo Bio Laboratories UltraClean® Soil DNA Isolation Kit, CA, United States) and DNA extraction was completed following the manufacturer’s instructions. Elution of nucleic acids from the silica membrane was performed using 50 μL of UltraPureTM DNase/RNase-Free distilled water (Invitrogen, CA) for samples from cultures as well as from the ISSO site in Canada, whereas 920 μL were used for elution of samples from the SaBRE site in the United Kingdom.
Quantitative PCR (qPCR) Amplification of Extracted DNA
Quantification of the 16S rRNA gene of Dehalococcoides and Geobacter-KB1 as well as a total of 15 D. mccartyi rdhA genes plus one Geobacter rdhA gene from the KB-1 culture was achieved via qPCR on an Opticon 2 thermocycler (MJ Research). Supplementary Table S3 provides details on the primer pairs used, their annealing temperatures and the length of the amplicon generated. With the exception of five genes (KB1-6/bvcA, KB1-14/vcrA, KB1-27/tceA, KB1-1 and KB1-5), new primers were designed for all other rdhA genes in this study. The specificity of the primers was tested in silico against the public NCBI NR nucleotide database and tested in vitro against DNA extracted from mixed dechlorinating and non-dechlorinating cultures. Supplementary Table S4 shows the number of mismatches for each primer pair with sequences belonging to the ortholog group of the targeted rdhA gene. The PCR reaction (20 μL) consisted of: 10 μL of SsoFastTM EvaGreen® Supermix (Bio-Rad, CA), 0.5 μL of each primer (10 mM), 7 μL of UltraPureTM DNase/RNase-Free distilled water (Invitrogen, CA) and 2 μL of template. The amplification program included an initial denaturation step at 98°C for 2 min followed by 40 cycles of 5 s at 98°C and 10 s at the corresponding annealing temperature. A final melting curve from 70 to 95°C degrees at increments of 0.5°C per second was performed. Since two concentrations were tested per template (undiluted and 10-fold diluted) for assessment of potential matrix-associated inhibitory effects, reactions for each dilution were performed in duplicate. The undiluted sample generally contained between 10–20 ng of DNA per μL as measured using a Nanodrop spectrophotometer (Thermo Scientific, DE). Generally, there was good agreement between the two measurements. Ten-fold serial dilutions of plasmid DNA containing one copy of the 16S rRNA gene or the rdhA gene (∼1000–1500 bases) were used as calibrators. Plasmids for calibration were prepared by PCR amplifying the desired rdhA from KB-1, inserting the gene into the pCR 2.1 PCR vector and subsequently transforming the construct into TOP10 Escherichia coli competent cells (Invitrogen, CA) as per the TOPO TA cloning® kit (Invitrogen, CA). Plasmid DNA was purified using the GenEluteTM Plasmid Miniprep Kit following the manufacturer’s instructions (Sigma-Aldrich, MO). DNA was eluted using 50 μL of Ultra Pure DNase/RNase-free distilled water (Invitrogen, CA). Standard curves exhibited linear behavior (R2 > 0.990) when plotted on a logarithmic scale over seven orders of magnitude. Supplementary Table S5 provides the details on the standard curves for each primer pair, including slopes (efficiencies), Y-intercepts and calibration model fit. The specificity of the amplicons was checked by melt curve analysis as well as by agarose gel electrophoresis for selected samples. Non-template controls were included in each run. Absolute gene copy concentrations for all cultures and field samples are provided as Supplementary Tables S6–S8. The method detection limits (MDLs) were expressed in terms of gene copies per L of groundwater or per mL of culture and varied depending on the volume of sample filtered and the volume employed for elution of DNA from the purification column. The MDLs for each set of samples are provided in Supplementary Table S9.
Cluster Analysis of rdhA Sequences and Calculation of rdhA/16S rDNA Dhc Ratios
Phylogenetic analysis of rdhA nucleotide and amino acid sequences, including bootstrapping, was performed with the ClustalX free software (version 2.0.12; University College Dublin6). Protein sequences were clustered into ortholog groups as previously defined [90% pairwise identity in amino acid alignments as per (Hug et al., 2013)]. The similarity of the Dehalococcoides populations in the various KB-1 subcultures was investigated on the basis of their rdhA fingerprints (rdhA/16S rRNA gene Dhc ratios) by means of hierarchal cluster ordination analysis. The latter was performed with the free software Hierarchal Clustering Explorer (HCE) (version 3.5; Human-Computer Interaction Lab, University of Maryland7). The Unweighted Pair Group Method with Arithmetic Mean (UPGMA) was used as linkage clustering method, whilst Pearson’s correlation coefficients were used to construct the similarity distance matrix. Heatmaps generated with the HCE v3 software were further edited manually for scale optimization in Excel 2010.
Results and Discussion
Reductive Dehalogenase (rdhA) Genes in the KB-1 Consortium
As the core genome of all D. mccartyi strains is almost identical, the metagenome search for unique non-coding regions that could differentiate different strains yielded no positive results. As a consequence, efforts were turned to the complement of rdhA genes, which does vary significantly between strains. To visualize sequence similarities, we constructed phylogenetic trees using 249 amino acid (Figure 1) and nucleotide (Supplementary Figure S3) sequences that included all full RdhA sequences found in the KB-1 metagenome as well as those identified in 11 isolated and sequenced D. mccartyi strains. Amino acid sequences belonging to the same ortholog group (OG), defined as having >90% PID (Hug et al., 2013), are highlighted in different colors on the phylogenetic trees. These highlighted branches clearly support the classification and reveal how some RdhA sequences are common to all strains, while others only in a few (Figure 1). When the same sequences are compared at the nucleotide level (Supplementary Figure S3) identity within an ortholog group can be substantially lower than 90%. The terminology reductive dehalogenase homologous genes (rdhA) was adopted years ago, and perhaps implies more knowledge of common ancestry than is in fact known; still, it is not unreasonable to suspect that these genes arose from either speciation (orthologous) or duplication (paralogous) events. Herein we use the term “ortholog” to refer to rdhA genes that group together according to the classification system cited above. The term “homologous” is used to refer to all rdhA genes regardless of which ortholog group they belong to.
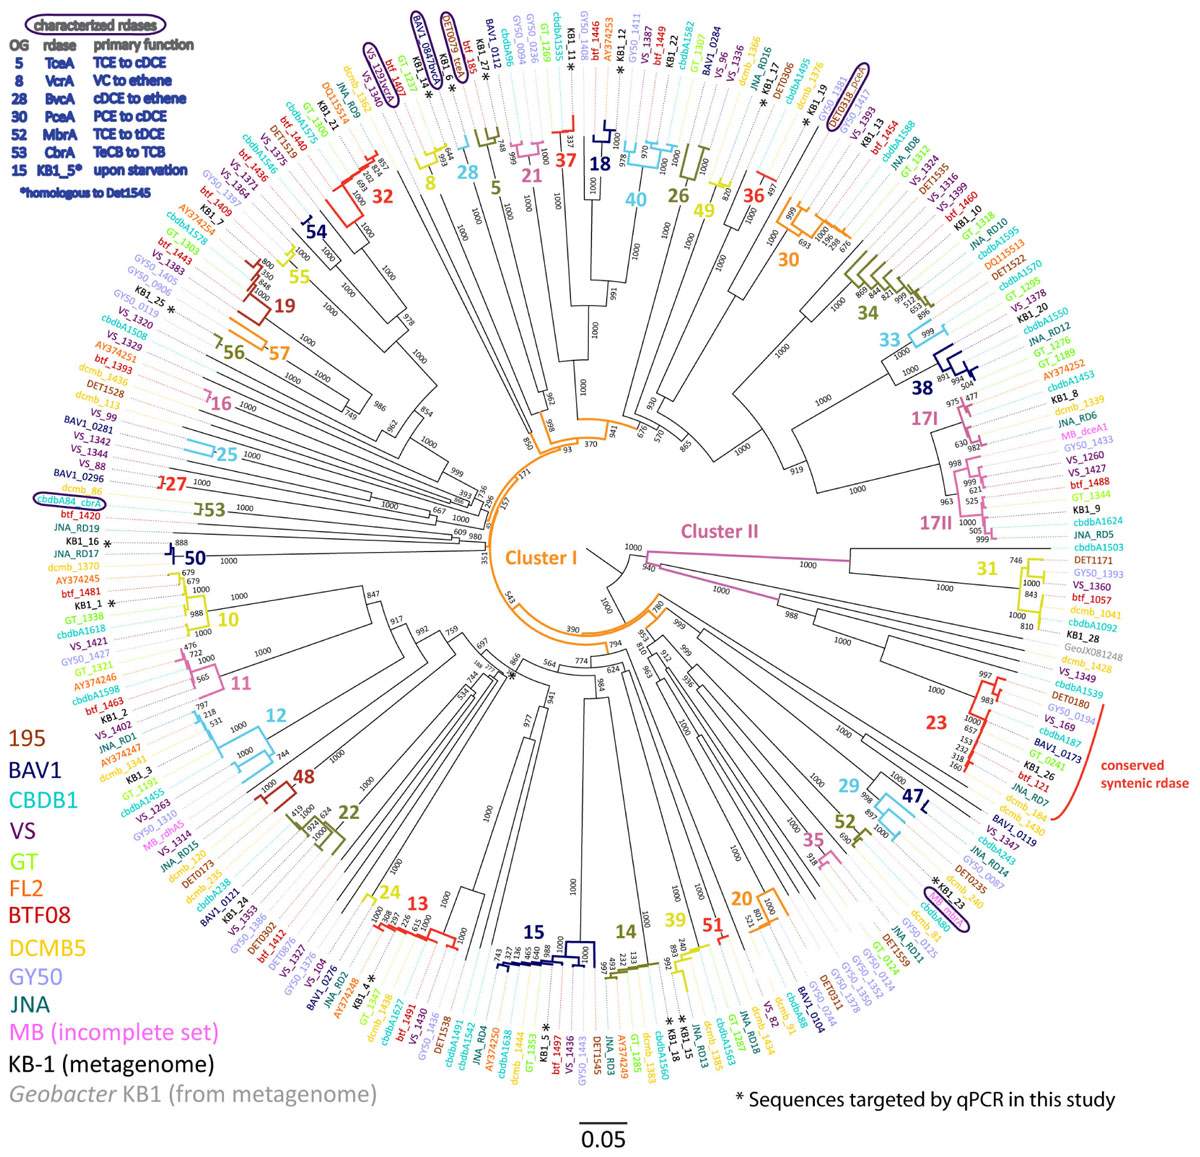
FIGURE 1. Phylogenetic tree of Dehalococcoides mccartyi reductive dehalogenases based on amino acid sequences. Tree includes sequences predicted from 248 rdhA genes found in eleven isolated D. mccartyi strains as well as those found in the mixed dechlorinating culture KB-1, including the rdhA gene sequence found in Geobacter KB-1 as an outgroup. The scale is the number of substitutions per amino acid. Bootstraps are shown at tree nodes. Sequences names are colored corresponding to their source as shown in the legend at bottom left. The numbers and different branch colors highlight ortholog groups (OGs) where sequences have >90% PID. Sequences corresponding to characterized RDases are circled and their substrates shown in the top right legend (chlorinated substrate abbreviations as in text, plus TeCB, tetrachlorobenzene; TCB, trichlorobenzene).
The phylogenetic analysis of 249 D. mccartyi RdhA sequences generated a total of 43 ortholog groups (OG) including 6 previously un-described groups (OG 52 to 57). Of the 249 sequences analyzed in 2016, 37 sequences remained ungrouped, meaning without a single ortholog (Figure 1). At the amino acid level, none of the KB-1 D. mccartyi RdhA sequences is unique because each is more than 90% similar to a sequence in at least one other D. mccartyi strain. The existence of numerous shared rdhA genes among D. mccartyi is consistent with their co-localization with insertion sequences and other signatures for horizontal gene transfer, and within genomic islands in high plasticity regions (McMurdie et al., 2009).
Selection of Suite of Distinguishing KB-1 rdhA Genes
We selected a total of 15 characterized and uncharacterized rdhA sequences to track using qPCR. Ten uncharacterized rdhA sequences, KB1-25 (OG56), KB1-11 (OG37), KB1-12 (OG18), KB1-16 (OG50), KB1-17 (OG 49), KB1-19 (OG36), and KB1-23 (OG29), were selected as those with the fewest orthologs in other strains based on our trees (Figure 1 and Supplementary Figure S3). KB1-15 (OG39) and KB1-18 (OG14) were selected because they were found on the same contig in the KB-1 metagenome and both share homology to genes in strains GT, CBDB1, DCMB5, and JNA, therefore they may be mobilized together (Figure 1). We included KB1-4 (OG13) because it appears to have orthologs in all other strains and could be useful for normalization, similar to the 16S rRNA gene. To this set of 10 uncharacterized genes, we added five more genes of interest: KB1-1 (OG10), KB1-5 (OG15), KB1_14/vcrA (OG8), KB1_6/bvcA (OG28) and KB1_27/tceA (OG5). KB1-1 and KB1-5 were selected because their corresponding proteins have previously been detected in KB-1 (Tang et al., 2013; Liang et al., 2015). Furthermore, KB1-5 (OG 15) which is expressed upon starvation, is orthologous to DET1545 from Strain 195 (Rahm and Richardson, 2008; Tang et al., 2013). KB1_14, KB1_6 and KB_27 correspond to the functionally-characterized vinyl chloride and trichloroethene reductases VcrA, BvcA, and TceA, respectively. We designed qPCR primers to these 10 uncharacterized genes, and used previously designed primers for the remaining 5 genes (Supplementary Table S4). Next we monitored the abundance of this suite of rdhA genes in DNA samples from 11 different KB-1 enrichment sub-cultures maintained over years on different chlorinated electron acceptors (Supplementary Table S1).
Quantification of rdhA Genes in KB-1 Enrichments With Different Chlorinated Electron Acceptors
To reflect shifts in D. mccartyi populations, qPCR results for each sample are presented as rdhA gene copies divided by 16S rRNA gene copies to provide an approximation of the relative proportion of each rdhA gene per D. mccartyi genome. D. mccartyi are known to harbor only one copy of the 16S rRNA gene per genome. rdhA/16S rRNA ratios were visualized using heatmaps with values ranging from above 0.6 (where more than 60% of all D. mccartyi genomes in the culture contains that gene) to less than 0.001 (where the gene is present in fewer than 0.1% of the D. mccartyi populations) (Figure 2). Although the primers were designed to target specific KB-1 rdhA sequences, most sequences within the same ortholog group would likely also be amplified. Supplementary Table S4 compiles all mismatches found between primers used and other sequences in the corresponding OG.
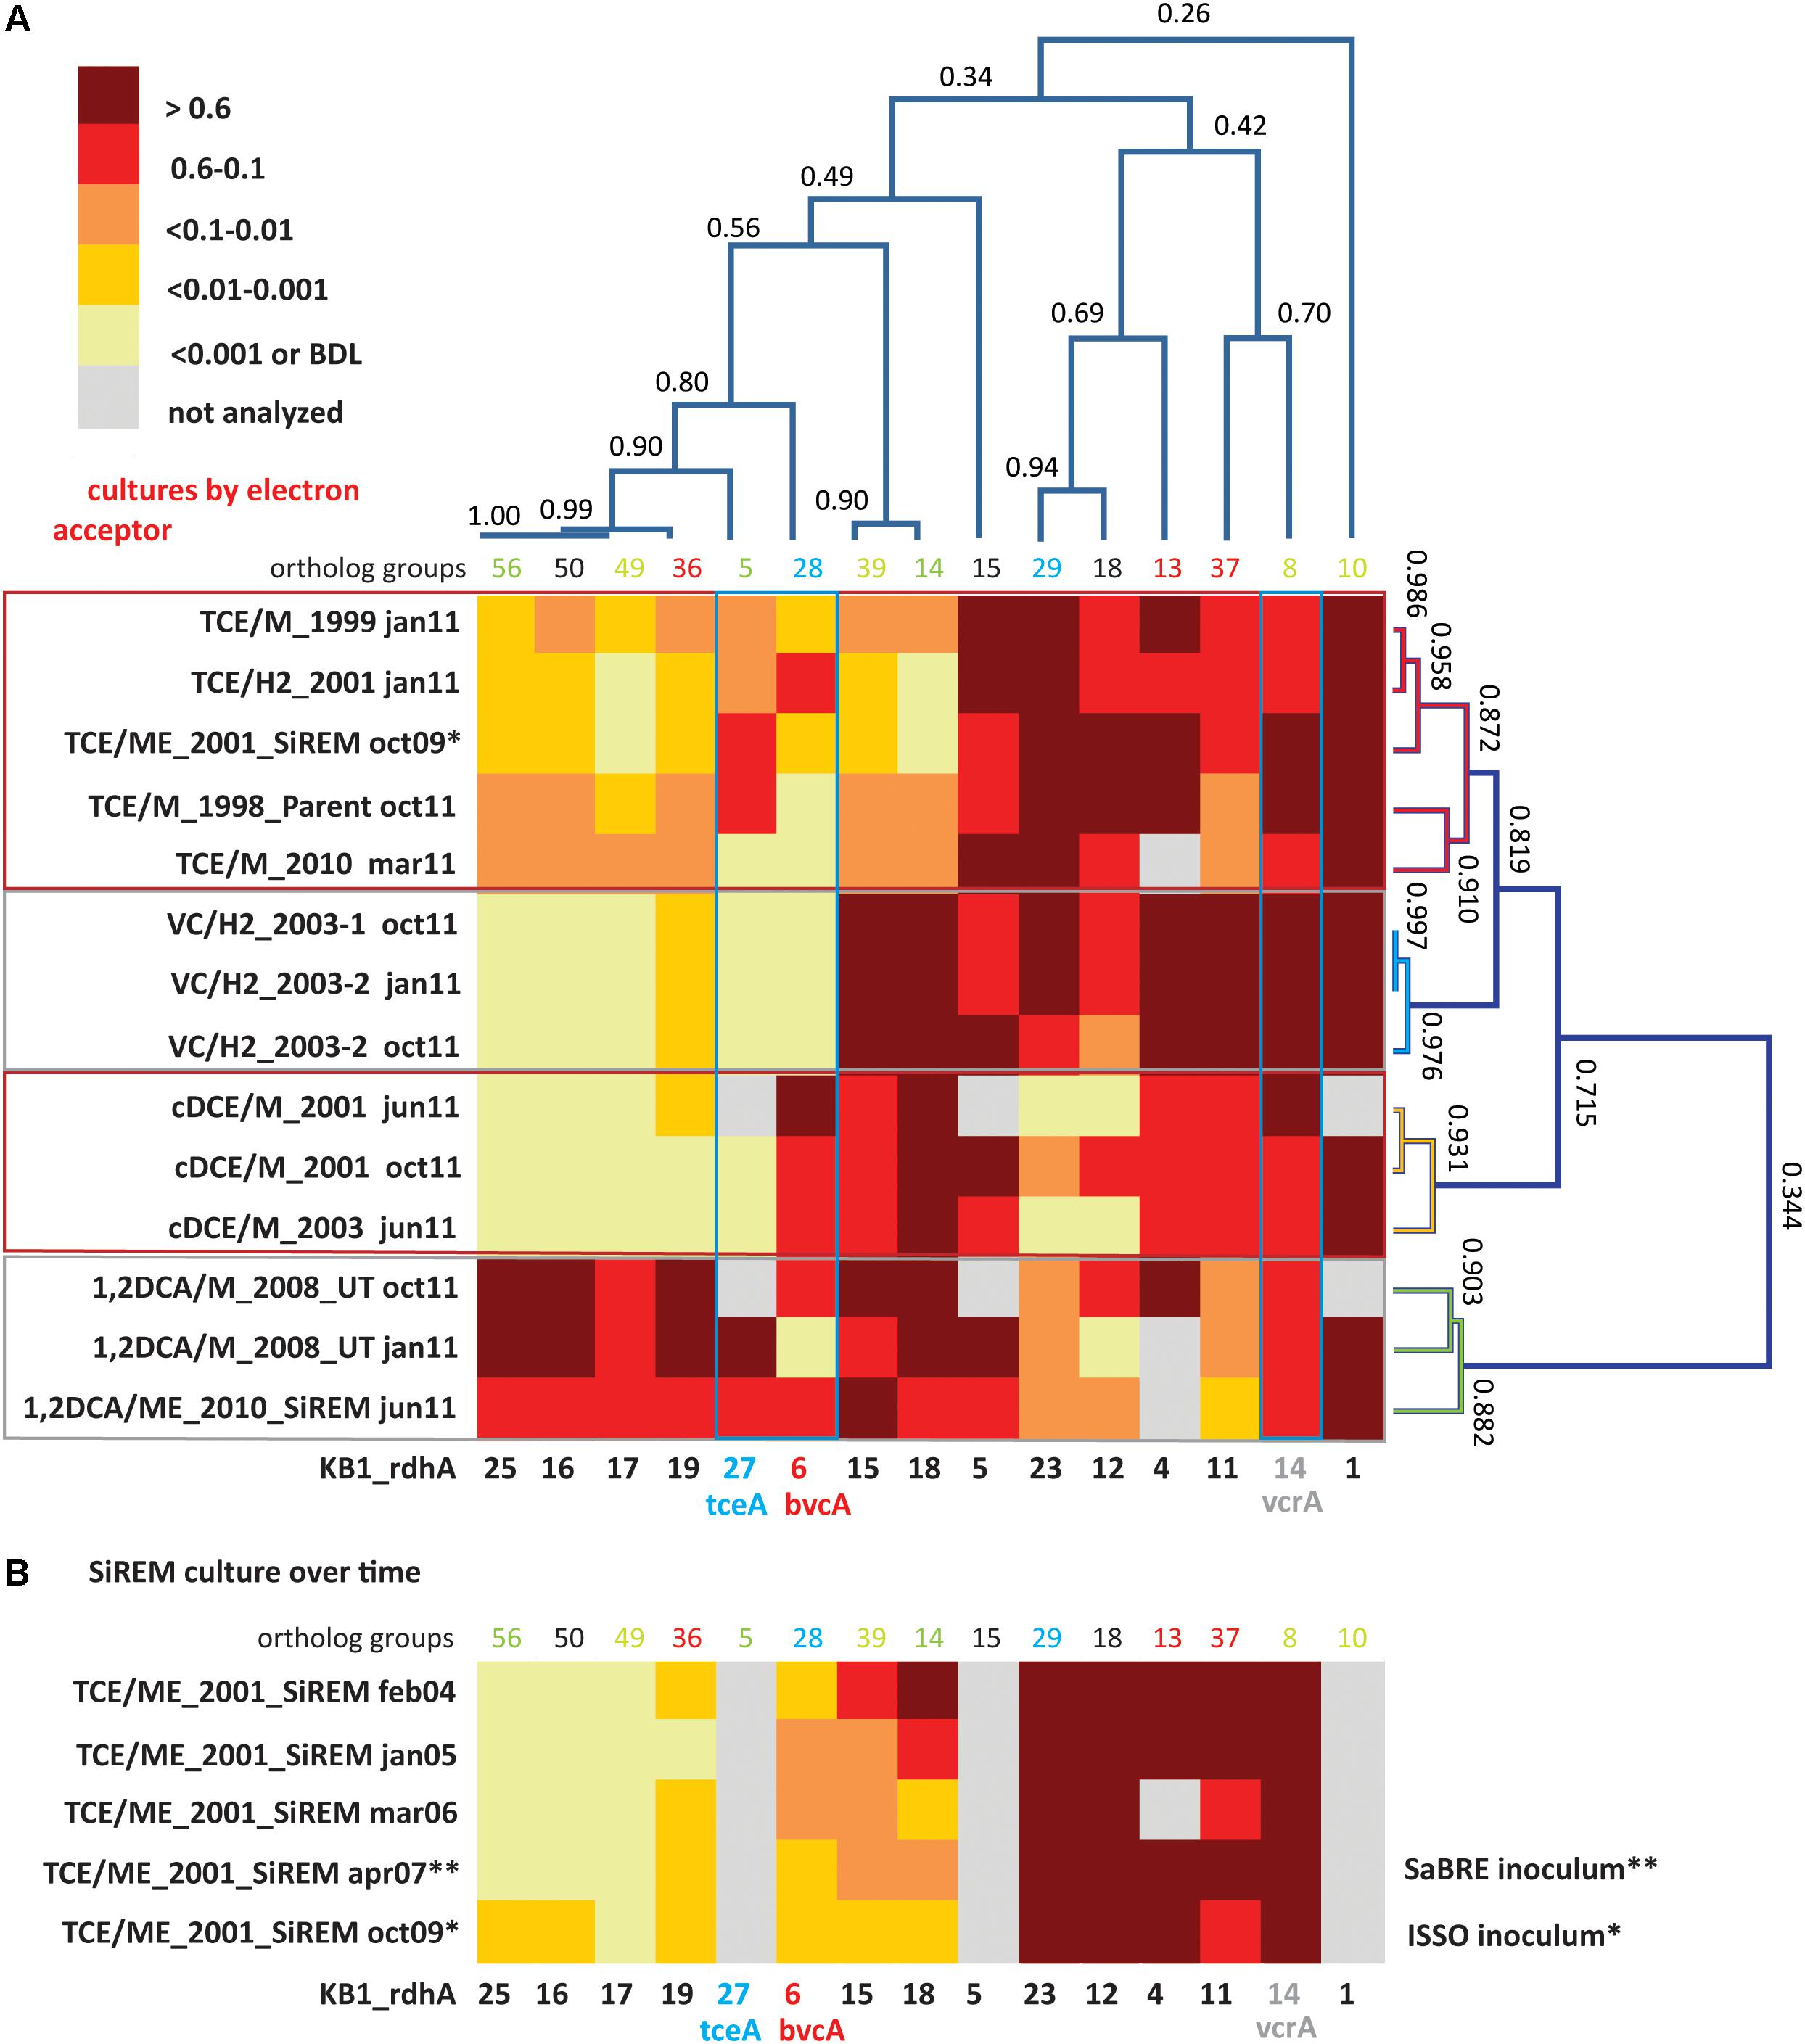
FIGURE 2. Cluster analysis and heatmaps showing D. mccartyi rdhA/16S rRNA gene copy ratios measured in KB-1 enrichment cultures. (A) Shows how data clustered by the chlorinated electron acceptor amended to individual enrichment cultures as well as by rdhA sequence. The name format indicates electron acceptor amended/donor used_year created, followed by date sampled (e.g., TCE/M_1999 jan11 is a TCE and methanol enrichment culture first established in 1999 and sampled in January of 2011). The numbers on the cluster branches of both axes indicate the percentage similarity between samples based on the Pearson’s correlation coefficient. (B) It is a heatmap of rdhA/16S rRNA gene copy ratios in the SiREM KB-1 culture over 5 years. Cultures indicated with ∗ or ∗∗ are those used for bioaugmenting field sites in 2007 (SaBRE) and 2009 (ISSO).
Dehalococcoides mccartyi rdhA/16S rDNA gene copy ratios measured in KB-1 enrichment cultures (Figure 2) revealed more variability of D. mccartyi strains than anticipated, considering the number of years of enrichment and the fact that they all originated from a common parent culture. Clustering analysis revealed rdhA genes common to all cultures and rdhA gene specific to a particular chlorinated electron acceptor. For instance, all subcultures were found to contain KB1-1 (OG10) (ratios all greater than 0.6), and to have consistently abundant rdhA sequences of KB1-4 (OG13) and KB1-5 (OG15), and KB1-14 (vcrA; OG8). The most striking finding (Figure 2A) is the clustering of specific patterns with terminal chlorinated electron acceptor. The VC enrichments show the lowest diversity of rdhA sequences and the most concordance between enrichments. These enrichments contain high abundances of 6 genes (KB1-1, KB1-14/vcrA, KB1-11, KB1-4, KB1-15, and KB1-18) with more variable but still abundant presence of KB1-5, KB1-23 and KB1-12. Other rdhA sequences are near or below detection. The cDCE enrichments form their own cluster, distinct from the VC enrichments, because they contain significant abundance of the KB1-6/bvcA gene, and much lower proportions of KB1-23 and KB1-12. These cDCE enrichments were the only ones consistently enriched in bvcA. The 1,2-DCA enrichments also formed a distinct cluster characterized by high ratios for KB1-16, KB1-17, KB1-19, KB1-25 as well as KB1-27/tceA. Finally, the TCE cultures reflect a blend of all the other enrichments, showing more variability, although favoring an rdhA ratio pattern most like the VC enrichments.
The clustering analysis also revealed co-variation among some of the rdhA genes regardless of the enrichment, suggesting co-location of these genes on the same genome as is the case of KB1-15 and -18, and possibly also KB1-16, -17, -19, and -25 (Figure 2A). The Geobacter rdhA gene was detected at similar abundance to the Geobacter 16S rRNA gene only in the TCE-amended cultures (at approximately 15–25% of Dhc abundance); in all other enrichments Geobacter 16S rDNA and rdhA genes were below the detection limits (Supplementary Tables S6, S7), as expected since Geobacter only dechlorinates PCE or TCE as far as cDCE. In control DNA samples from cultures without D. mccartyi, copies of rdhA genes were all below the MDL (data not shown).
The stability of the rdhA fingerprints over time was also assessed. For the VC, 1,2-DCA and cDCE enrichments, two samples from the same enrichment culture bottle were analyzed at 4 or 9 month’s intervals (January and October or June and October, 2011; Figure 2A). There was good agreement between the two time points, although small differences likely reflect changes in relative abundance of D. mccartyi strains in batch incubation conditions. For the TCE/ME_2001_SiREM culture, five DNA samples over a time span of 5 years (2004, 2005, 2006, 2007, and 2009) were available, and were investigated using a subset of rdhA genes (Figure 2B). The rdhA fingeprint was relatively stable over time except for three rdhA genes, namely KB1-18, KB1-15, and KB1-6/bvcA. Ratios for KB1-18 and KB1-15 gradually shifted from greater than 0.6 in 2004 to less than 0.01 and even less than 0.001 by 2009. KB1-6/bvcA ratios fluctuated over this time period between 0.01 and 0.1. As noted already, KB1-18 and KB1-15 appear to co-vary, supporting their co-localization in the same genome. These two genes are abundant in VC, cDCE, and 1,2-DCA enrichment cultures but not in the TCE enrichments and diminished over time in the TCE/ME_2001_SiREM. These data reveal that the dominant VC-dechlorinating, vcrA-containing D. mccartyi strains are not the same in the TCE and VC enrichment cultures. It appears that the dominant D. mccartyi strain more recently present in the VC/H2 sub-cultures is more similar to the one that was originally present in the parent culture, and that this population has been gradually surplanted in TCE/ME_2001_SiREM culture. This data indicates that a major shift can also happen in the rdhA fingerprint of a mixed culture even when maintained consistently on the same electron acceptor. This is different to the wholesale changes observed when the electron acceptor is changed, where a shift in the dominant D. mccartyi population may happen much faster, as demonstrated in studies by Mayer-Blackwell et al. (2014, 2016) where the dominant D. mccartyi population in a bioreactor shifted over a period of 50–100 days when the electron acceptor was switched for 1,2-DCA from TCE. In the field, significant changes in Dhc populations may also be expected within a few months due to changing conditions: for instance, in electron acceptor availability.
The clustered data for 15 rdhA genes across 14 DNA samples from 11 different cultures yielded four major groups corresponding to each of the four chlorinated electron acceptors (Figure 2A). To create a more visual representation of the distribution of these rdhA genes in the two High Plasticity Regions (HPRs) of D. mccartyi genomes, we mapped corresponding OG groups in the order and HPR they typically appear in published genomes (Figure 3). This map provides evidence not just of multiple strains but also of likely gene insertions and/or deletions (e.g., bvcA in the HPR1). As indicated previously, the considerable variability in the rdhA to 16S ratios within each culture and electron acceptor group was at first very surprising, because the cultures all derive from the same parent and have been enriched for so long on the same substrate. We expected to see only one clearly dominant population, especially in the VC to ethene and 1,2-DCA to ethene cultures that involve only a single dechlorination step. What the data show instead is a more complex pattern in each group, suggesting the presence of more than one D. mccartyi population even in the single-dechlorination step, highly enriched VC/H2 cultures. We repeated many of the DNA extractions and qPCR reactions to verify results, with no appreciable changes. Recent analysis of these enrichments yielded similar results (data not shown). Early experiments by Duhamel et al. (2002, 2004) and Waller et al. (2005) had identified at least two distinct D. mccartyi populations (KB1-PCE and KB1-VC), the former containing KB1-6 (bvcA) and the latter not; these two strains could actually also be distinguished by a single nucleotide difference in their 16S rRNA sequences (Duhamel et al., 2004). Subsequently, Hug (Hug, 2012) was unable to close the assembly of a D. mccartyi genome from the KB-1 TCE/M_1998 parent culture metagenome, particularly in the high plasticity regions rich in rdhA genes, because of the presence of multiple, highly similar D. mccartyi populations. Considering the cluster diagram by enrichment culture (Figure 2A; right side), we can perhaps infer at least four distinct populations based on rdhA distribution in the TCE enrichments, at least two in the VC enrichments (one with and one without rdhA KB1-12 (OG18), at least two in the cDCE enrichments and three in the 1,2-DCA enrichments (Figure 3). In an attempt to verify these results, we sequenced metagenomes from representative VC, cDCE, and 1,2-DCA enrichments. Sequencing has confirmed the presence of multiple distinct D. mccartyi genomes in all enrichment cultures, even in the VC enrichments, upholding these results (data not shown; manuscript in preparation). The co-existence of multiple D. mccartyi strains at different cell densities within these enrichments likely arises from subtle substrate preferences of the expressed reductive dehalogenases and competition for available nutrients and vitamins. Functional characterization of some reductive dehalogenases reveals substrate overlap yet specific substrate preferences as observed for BvcA and VcrA (Yan et al., 2012). Moreover, availability and type of corrinoid can alter rates of dechlorination for certain enzymes (Yan et al., 2016). Low abundance populations may persist in these cultures because they are maintained in batch mode, with infrequent medium changes and thus long residence times from 30 to 100 days.
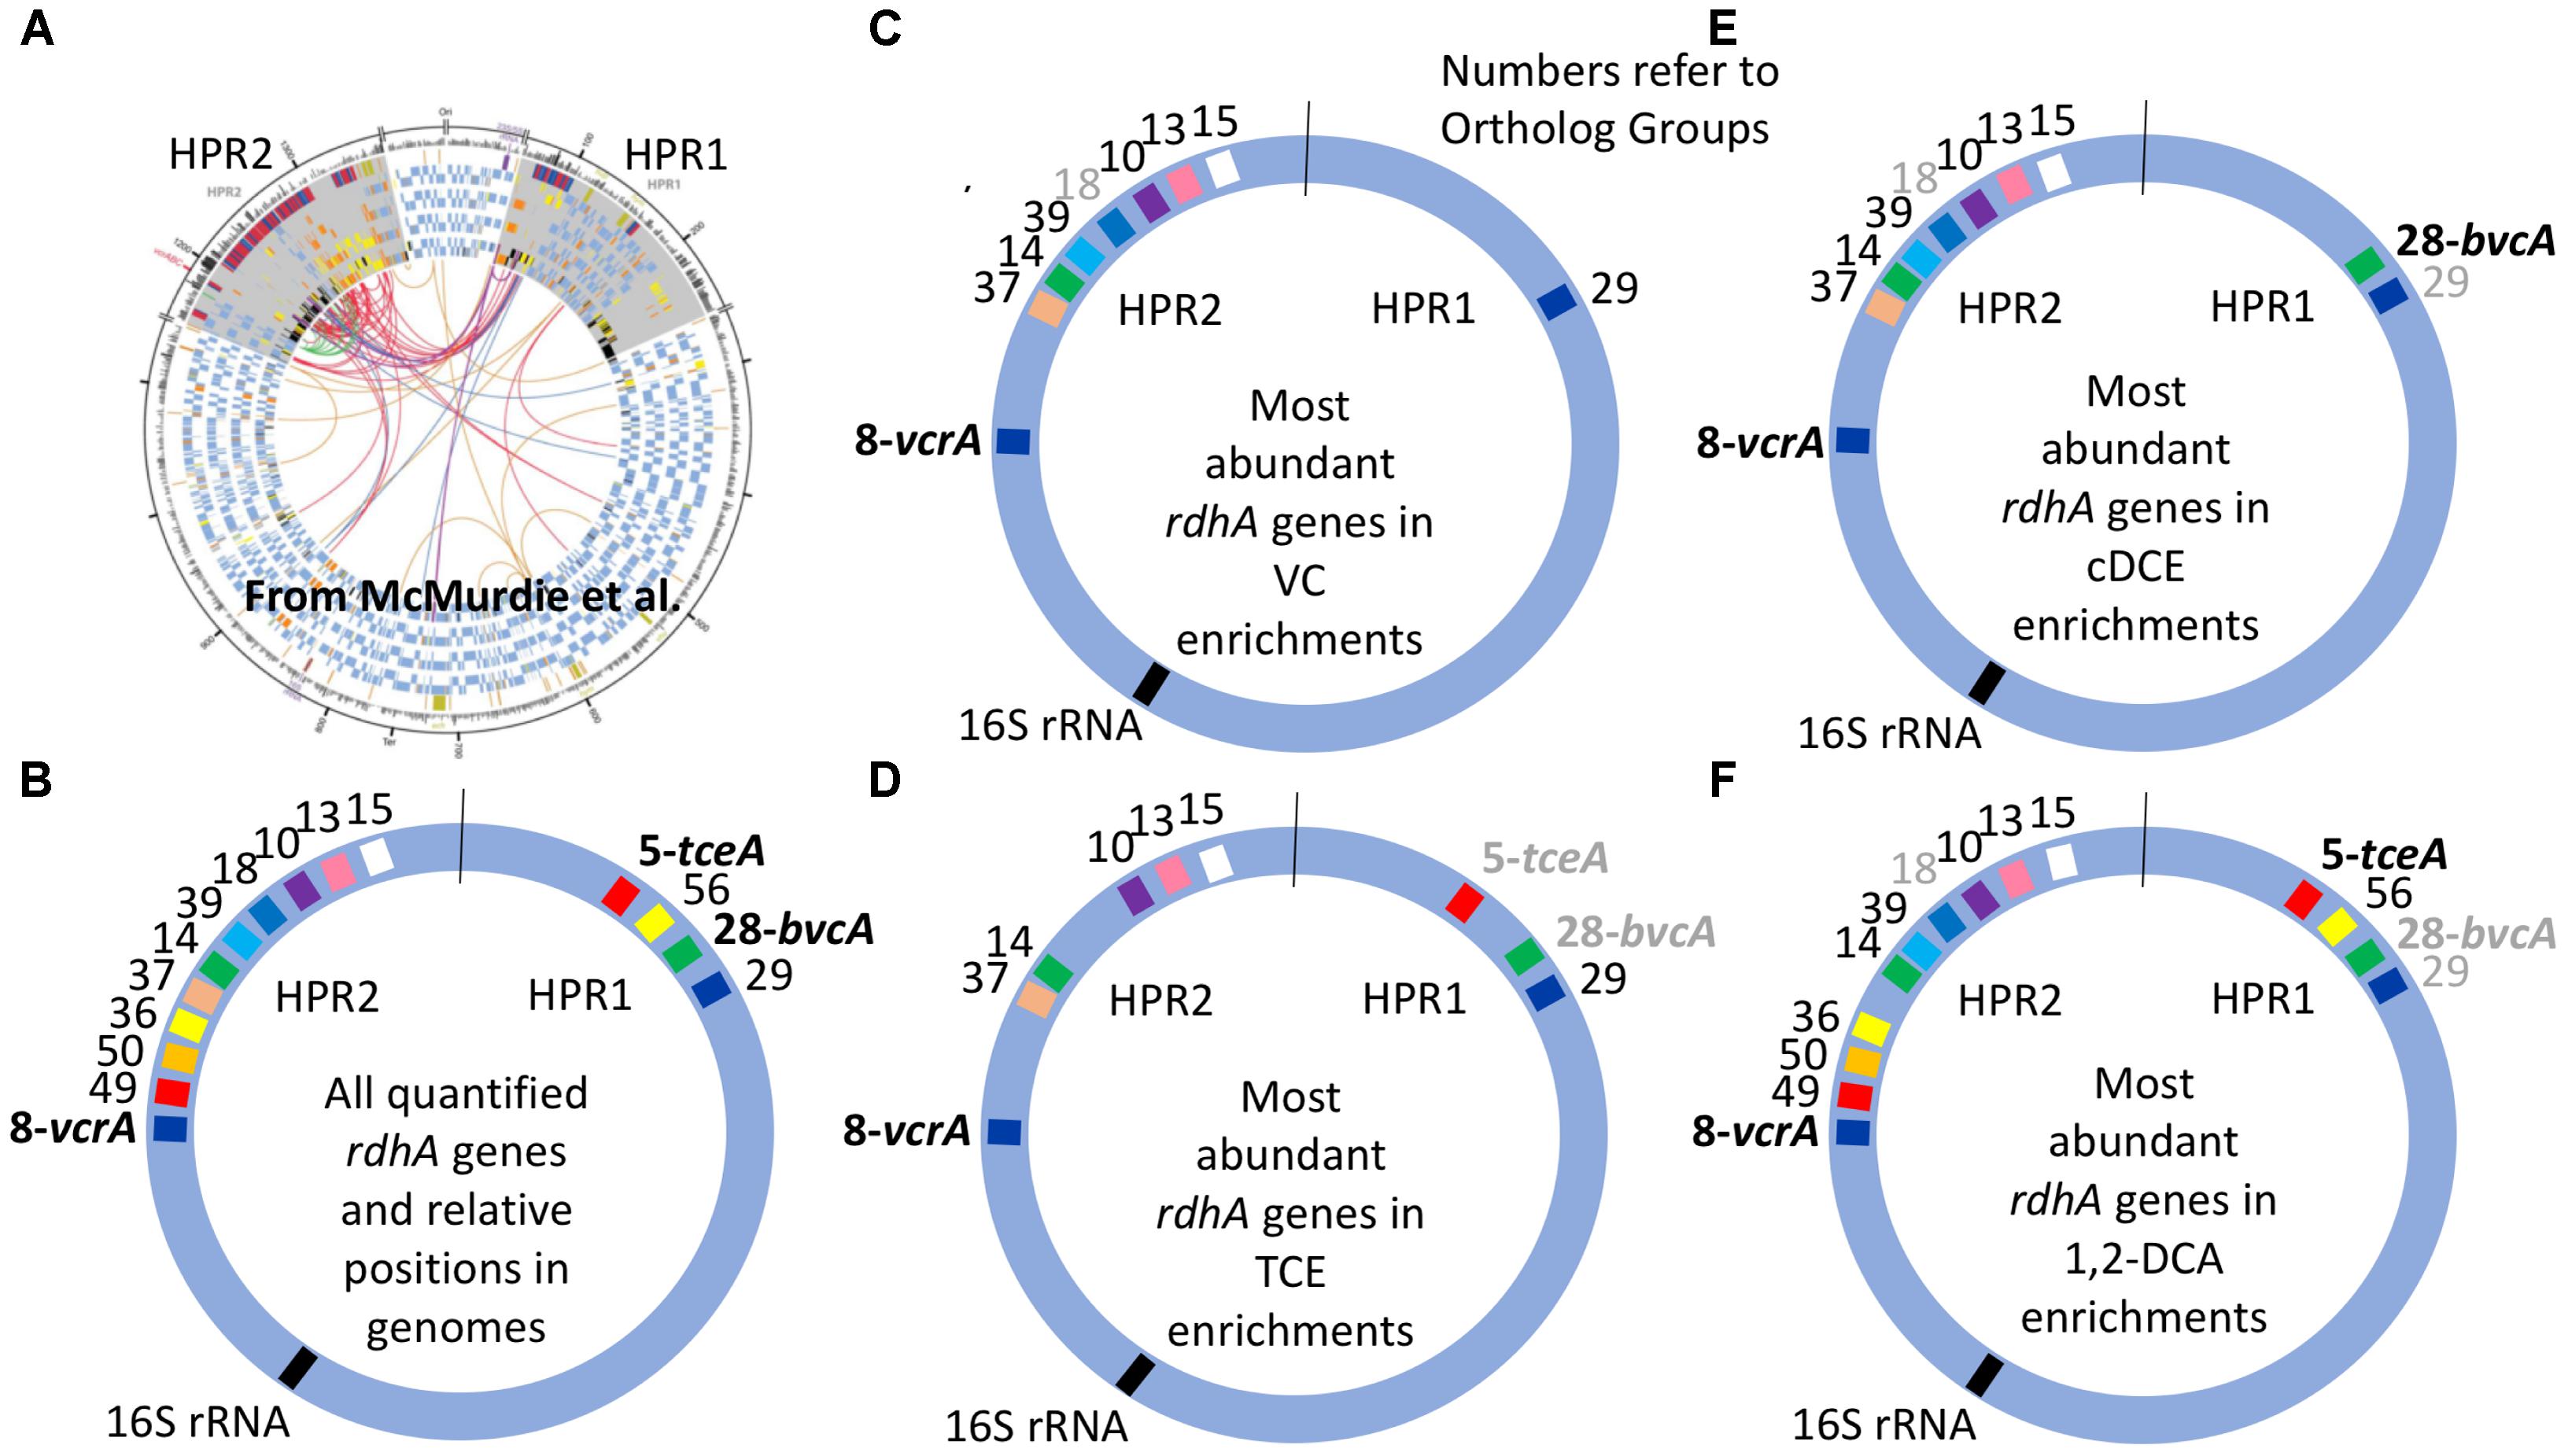
FIGURE 3. Distribution of most abundant D. Mccartyi reductive dehalogenase homologous (rdhA) genes quantified in KB-1 enrichment cultures. RdhA sequences are represented by their corresponding ortholog group (OG) numbers and relative positions in High Plasticity Regions (HPR) 1 and 2, as defined by McMurdie et al. (2009).) (A) Circular map of four Dehalococcoides genomes reproduced from McMurdie et al. (2009), illustrating the two high plasticity regions where most rdhA genes are found; origin is at top. (B) Relative position of all of the rdhA sequences quantified by qPCR in this study. (C–F) Most abundant rdhA genes detected in the respective enrichment culture samples, with evidence for considerable strain variation within and between enrichment cultures. OG numbers that are gray correspond to genes that are abundant in only some of the samples from the respective enrichments. See Supplementary Table S3 or Figure 1 for correspondence between OG and KB-1 rdhA numbers.
Quantification of rdhA Genes in Site Groundwater
A suite of 12 rdhA genes representative of both dominant and minor D. mccartyi strains was used to monitor population shifts before and after bioaugmentation with KB-1 (TCE/ME_2001_SiREM) at two TCE-contaminated sites: one in Canada (ISSO) and another site in the United Kingdom (SaBRE). At the United Kingdom site, the abundance of Geobacter 16S rRNA and rdh genes were also monitored.
The results from the Canadian ISSO site revealed that the two most abundant rdhA genes in native populations (monitored prior to any treatment) were orthologs to KB1-4 and KB1-6/bvcA, but that their titers were barely above detection limits, at approximately 3 × 10⁵ copies per L (Supplementary Table S8). Although the bvcA-encoded dehalogenase is known to catalyze the dechlorination of cDCE all the way to ethene (Holmes et al., 2006), there was little dechlorination beyond cDCE before electron donor amendment (Pérez-de-Mora et al., 2014). During biostimulation with electron donor prior to bioaugmentation, D. mccartyi and vcrA copy numbers increased significantly, reaching a vcrA/16S rRNA gene ratio near one (Figure 4A), indicating growth of vcrA-bearing native populations. The abundance of rdhA genes orthologous to KB1-11, KB1-15, KB1-18 also increased during this period (Figure 4A). After bioaugmentation with KB-1, the rdhA profile did not change substantially, even though higher ethene concentrations and faster dechlorination were observed (Figure 4A). A reduction of the bvcA/16S rRNA gene ratio from ∼0.5 to 0.1 was the most notable change during this period (Figure 4A). The native populations that grew upon electron donor addition (prior to inoculation) harbored orthologs of 6 out of the 12 KB-1 rdhA genes monitored. From the data after bioaugmentation, it is clear that the dominant D. mccartyi populations from the KB-1 inoculum were not the ones responsible for the enhanced ethene production observed because KB1-12 and KB1-23 sequences that were dominant in the inoculum were not enriched in samples from the site. Instead a low-abundance D. mccartyi population in the inoculum grew at the site or, alternatively, bioaugmentation may have provided supporting organisms that enhance dechlorination of VC by the native D. mccartyi. This result is in agreement with previous analyses of data from this site (Pérez-de-Mora et al., 2014) that suggested that growth of a Bacteroidetes present in KB-1 capable of ethanol fermentation enhanced ethenogenesis after bioaugmentation. Other fermenters or acetogens capable of producing the lower base of vitamin B12, namely dimethylbenzimidazole (DMB), which is required by VcrA, may have grown at the site, although this could not be shown for the known strains in KB-1.
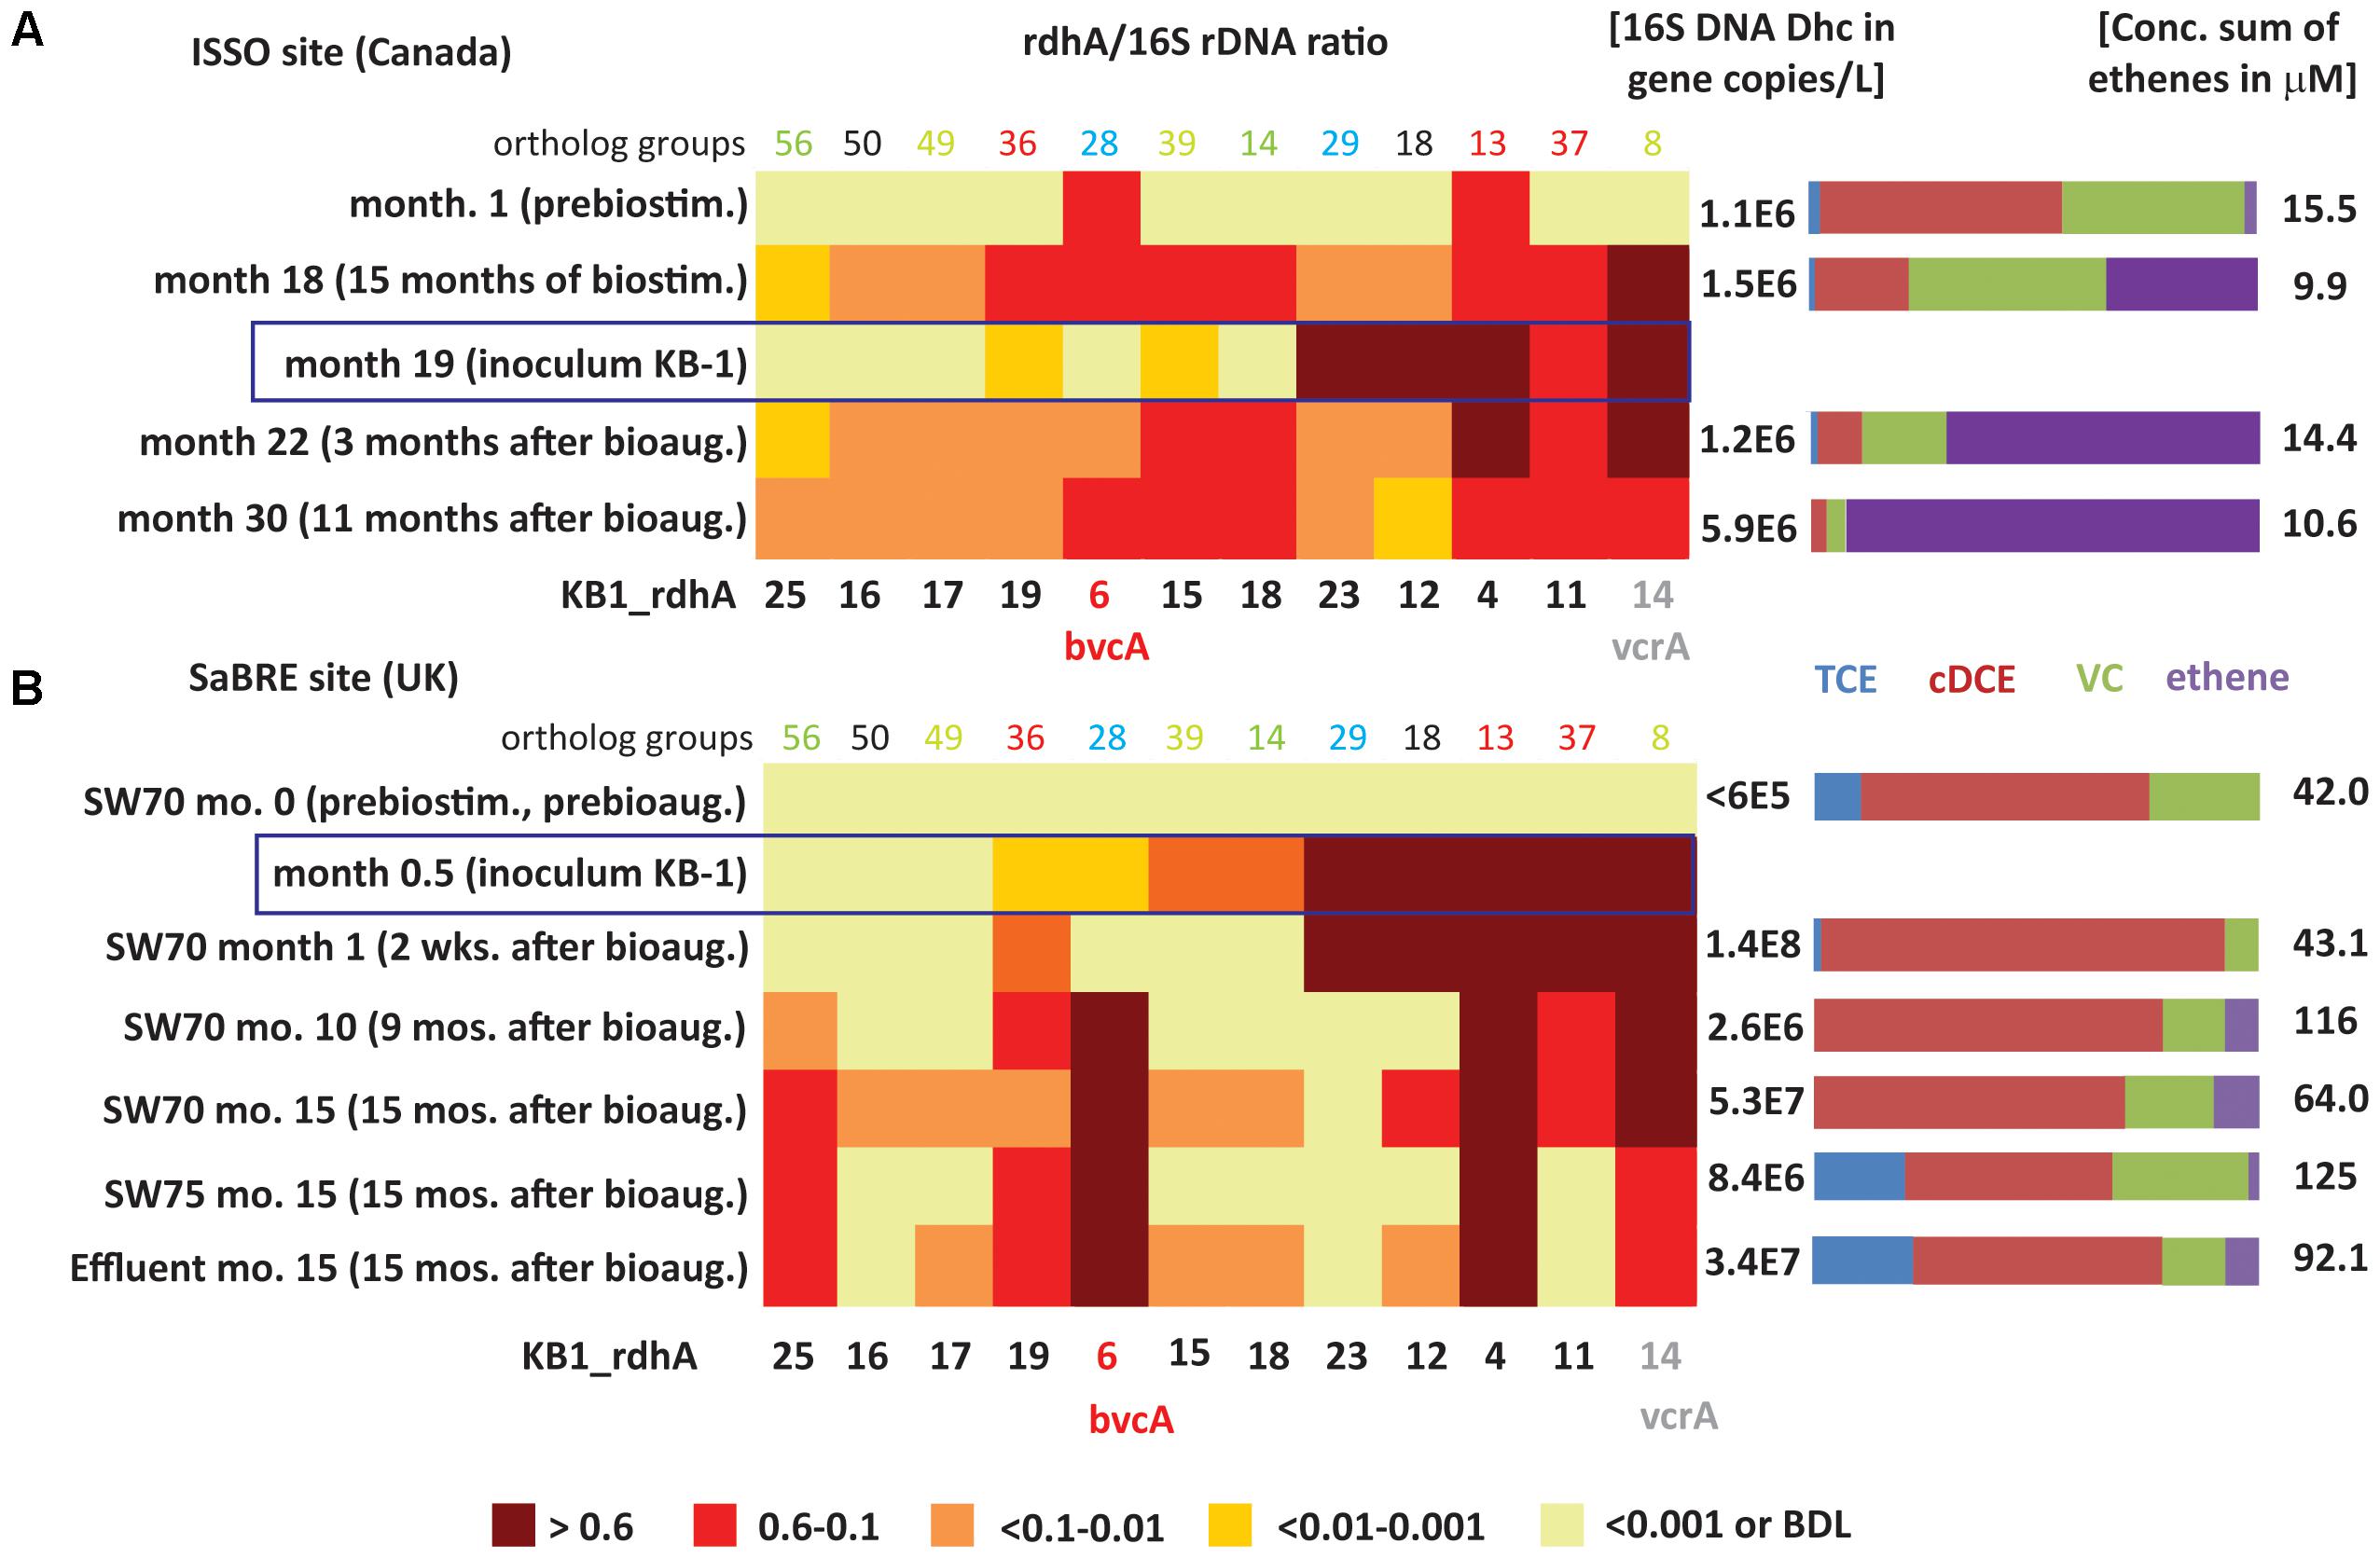
FIGURE 4. Heatmaps showing D. mccartyi rdhA/16S rRNA gene copy ratios in field samples. (A) Canadian ISSO site. (B) United Kingdom SaBRE site. Corresponding absolute copies of D. mccartyi per L and concentrations of chlorinated ethenes are represented on the right side of each panel. Data from the ISSO site are from the composite pipeline (see Supplementary Figure S1). Data from the SaBRE site are from the influent (INF), sampling wells (SW70 and SW75) and effluent (EFF) of the test plot (see Supplementary Figure S2).
The rdhA survey also revealed D. mccartyi population shifts as dechlorination progressed in the field (Figure 4A). Specifically, prior to any active treatment and when cDCE was the dominant cVOC, bvcA and KB1-4 were the most abundant rdhA genes found, a feature only seen with the cDCE enrichments in the KB-1 subculture survey. During biostimulation with electron donor, there was a gradual decrease in cDCE concentration and an increase in the concentration of VC and ethene. After 15 months of biostimulation (Month 18), the relative abundance of several other rdhA genes increased to above 10%, including genes similar to KB1-11, KB1-15, KB1-18, and especially vcrA (Figure 4A). This parttern of rdhA genes was also seen in the KB-1 VC enrichments. Three months after bioaugmentation (Month 22), the proportion of ethene relative to VC and cDCE further increased. Here, the bvcA ratio decreased to less than 0.1 while the vcrA ratio remained at approximately 1. At Month 30, when there was almost no VC or cDCE left, the vcrA ratio returned to below 0.6. At this time, relative abundance of KB1-12 decreased substantially; these rdhA was also found to vary between enrichment cultures.
Ratios describe shifts in the underlying D. mccartyi strains, but the absolute abundance of D. mccartyi is also relevant to observed dechlorinating activity. Major changes in absolute abundance of rdhA genes KB1-11, KB1-15, KB1-18, and KB1-14/vcrA were observed as well, starting from below detection limit (<∼105 copies L-1) up to 0.9–3 × 10⁶ copies L-1 (Supplementary Table S8). The abundances of vcrA and D. mccartyi 16S rRNA genes increased up to the end of the monitoring period (Month 30) reaching concentrations of 1.6 × 10⁶ and 6 × 10⁶ copies L-1, respectively. For the rdhA genes KB1-12 and KB1-23, characteristic of the dominant D. mccartyi populations in the inoculum (Figure 4A), there was no such significant change, further indicating that this population did not contribute to the enhanced dechlorination observed after bioaugmentation.
The rdhA gene suite also was used to investigate groundwater from the SaBRE bioaugmentation trial within a test cell at a TCE-contaminated site in the United Kingdom. Prior to any treatment, D. mccartyi gene copy numbers were below the detection limit (<6 × 10⁴ gene copies L-1) in all wells studied except the effluent (EFF) location where D. mccartyi titers of about 105 gene copies L-1 were detected (data not shown). No significant VC and ethene concentrations were measured in these wells prior to treatment. Unfortunately, no samples were collected during biostimulation prior to inoculation of KB-1 (all data provided in Supplementary Table S8). Two weeks after bioaugmentation with KB-1 and about a month after a single donor addition event, D. mccartyi titers increased by three orders of magnitude in SW70, reaching 108 gene copies L-1 (Supplementary Table S8). In a sample from this well, all KB-1 biomarkers characteristic of the original inoculum, that is KB1-4, KB1-11, KB1-12, KB1-14/vcrA, and KB-23 were found to have rdhA ratios greater than 0.6 (Figure 4B). The KB-1 Geobacter 16S rRNA gene and the Geobacter rdhA gene were also detected at significant titers in the range 0.8–4.6 × 10⁷ copies L-1 (Supplementary Table S8). These data indicate that the dominant KB-1 D. mccartyi strain in the inoculum grew within the test cell, at least in the vicinity of this particular well (SW70).
In samples from SW-70 taken 10 and 15 months after donor addition, the ratios of KB1-11, KB1-12, and KB1-23, abundant in the inoculum and at 1 month, gradually decreased from values greater than 0.6 down to 0.1 (Figure 4B). The decrease of the ratio for KB1-23 was even more pronounced with a conservative estimate of 0.001 at month 15. Over the same time, the vcrA ratio remained greater than 0.6, while the bvcA ratio increased from less than 0.01 to about one (Figure 4B), indicating a dramatic shift in the dominant D. mccartyi strains with time in this well. A feature of this site was the consistently high concentrations of cDCE that seems to have led to the growth of bvcA-containing strains. At month 15, downgradient sampling locations SW75 and EFF were dominated by KB1-6/bvcA, KB1-4 and KB1-14/vcrA, and were similar to well SW70. At the influent (INF) sample location, upgradient of where the inoculum was added, gene copy numbers of D. mccartyi and rdhA genes were all below their detection limits. Curiously, the rdhA and 16S rRNA genes from Geobacter were detected at levels just above the detection.
The Canadian ISSO and United Kingdom SaBRE sites differed in many ways. The former Ontario site had one order of magnitude lower cVOC concentrations, more complete dechlorination to ethene, a more-readily fermentable substrate (ethanol vs. emulsified oil) and a recirculation system that provided better mixing of substrates and microorganisms. The SaBRE site had higher concentrations of VOCs, giving rise to higher microbial and ethene concentrations than at the Canadian site, although the dominant compound at the site was cDCE. Particularly interesting at the SaBRE site was the co-presence of both vcrA (KB1-14) and bvcA (KB1-6) after month 10 at SW70 and after month 15 at both SW75 and Effluent. Co-presence of bvcA and vcrA at field sites has been reported in various studies, with greater abundance of bvcA over vcrA at some sites and vice versa at others (Lee et al., 2008; Carreon-Diazconti et al., 2009; van der Zaan et al., 2010; Atashgahi et al., 2017). Such differences have been attributed to redox potential, with bvcA perhaps more abundant under less reducing conditions (van der Zaan et al., 2010). The redox potential at SaBRE was relatively low (-200 to -400 mV) and consistent over the length of the cell and the experimental time. Based on our laboratory cultures enriched with cDCE, it seems more likely that the high concentrations of cDCE and VC at a site exerted significant selective pressure on D. mccartyi strains harboring different rdhA genes, mimicking what we also observed in enrichment cultures.
Our results show that tracking specific rdhA fingerprints is challenging due to growth of minor populations of D. mccartyi either from native or inoculum-derived strains. Still, the approach employed in this study did reveal significant differences regarding the growth of the bioaugmented inoculum at the two sites. In future studies, it will be necessary to first identify site-specific rdhA genes that are not present at all in bioaugmentation cultures like KB-1, to track growth of indigenous populations. Perhaps a screening approach such as outlined in Hug and Edwards (2013) based on a set of 46 primer pairs to all known rdhA sequences, or the approach by Mayer-Blackwell et al. (2014) should be used to identify rdh genes in native strains prior to bioaugmentation. Then subsequent screens may be more discriminating.
More significantly, this study found clear selective pressure on D. mccartyi populations from the most abundant terminal chlorinated electron acceptor present. In both field samples and in well-established enrichment cultures, we found that D. mccartyi are not a homogeneous population but rather a complex and diverse mixture of strains harboring different complements of rdhA genes that respond and perhaps adapt selectively to external conditions – in particular electron acceptor – as revealed herein by monitoring rdhA/16S rRNA gene of Dhc ratios. The success of biostimulation and bioaugmentation approaches relies on the growth of populations with enzymes that actively convert chlorinated ethenes past VC to ethene. It seems that specific rdhA sequences confer populations and, by extent, mixed dechlorinating cultures, with fitness advantages depending on their local environment, and suggests that bioaugmenting with more refined cultures acclimated to intermediates like cDCE or VC that tend to accumulate at some sites may help to overcome stall and achieve complete dechlorination at some contaminated sites.
This study also underpins the need to further understand the role of horizontal gene transfer in these dechlorinating communities as suggested by the insertion/deletion of rdhA genes observed in the metagenomes of the KB-1 subcultures (Figure 3). These rdhA genes are often situated in regions of the genome that suggest potential for mobilization; yet we have no idea how quickly and under what conditions rdhA gene transfer occurs in organohalide-respiring bacteria such as Dehalococcoides. This may be particularly relevant for bioaugmented sites where native and non-native populations coexist.
Author Contributions
AP-d-M conceived of the experiments, carried out the molecular experiments, performed the comparative analyses, and co-drafted the manuscript. AL and XL assisted with the molecular experiments, culture maintenance, and helped to draft the manuscript. SD and MM conceived and led both field bioaugmentation trials, coordinated field monitoring, and helped to draft the manuscript. EE participated in the design of the study and co-drafted the manuscript. All authors read and approved the final manuscript.
Funding
AP-d-M thanks the European Commission for financial support through an IOF Marie Curie Fellowship within the project AnDeMic (Contract 23974/7th Framework). The authors also wish to thank the Natural Sciences and Engineering Research Council of Canada (NSERC), the United States Department of Defense Strategic Environmental Research and Development Program (SERDP), Genome Canada and the Ontario Genomics Institute (2009-OGI-ABC-1405), the Government of Ontario through the ORF-GL2 program, and Sustainable Development Technology Canada (SDTC) for providing funding. The authors also acknowledge R&D in kind contributions by Geosyntec and SiREM to the project study.
Conflict of Interest Statement
The authors declare that the research was conducted in the absence of any commercial or financial relationships that could be construed as a potential conflict of interest.
Acknowledgments
The authors wish to thank Adria Bells, Jeff Roberts, and Carey Austrins for the field assistance and Olivia Molenda for a thorough review of the manuscript.
Supplementary Material
The Supplementary Material for this article can be found online at: https://www.frontiersin.org/articles/10.3389/fmicb.2018.00812/full#supplementary-material
Footnotes
- ^ www.siremlab.com
- ^ https://genome.jgi.doe.gov/portal/BioGr_2013843002/BioGr_2013843002.download.html
- ^ http://www.clustal.org/clustal2/
- ^ http://tree.bio.ed.ac.uk/software/figtree/
- ^ http://www.claire.co.uk/index.php?option=com_content&view=article&id=53&Itemid=47
- ^ http://www.clustal.org/clustal2/
- ^ www.cs.umd.edu/hcil/hce/
References
Atashgahi, S., Lu, Y., Zheng, Y., Saccenti, E., Suarez-Diez, M., Ramiro-Garcia, J., et al. (2017). Geochemical and microbial community determinants of reductive dechlorination at a site biostimulated with glycerol. Environ. Microbiol. 19, 968–981. doi: 10.1111/1462-2920.13531
Bommer, M., Kunze, C., Fesseler, J., Schubert, T., Diekert, G., and Dobbek, H. (2014). Structural basis for organohalide respiration. Science 346, 455–458. doi: 10.1126/science.1258118
Carreon-Diazconti, C., Santamaria, J., Berkompas, J., Field, J. A., and Brusseau, M. L. (2009). Assessment of in situ reductive dechlorination using compound-specific stable isotopes, functional gene PCR, and geochemical data. Environ. Sci. Technol. 43, 4301–4307. doi: 10.1021/es803308q
Chan, W. W., Grostern, A., Löffler, F. E., and Edwards, E. A. (2011). Quantifying the effects of 1,1,1-trichloroethane and 1,1-dichloroethane on chlorinated ethene reductive dehalogenases. Environ. Sci. Technol. 45, 9693–9702. doi: 10.1021/es201260n
Cupples, A. M., Spormann, A. M., and McCarty, P. L. (2003). Growth of a Dehalococcoides-like microorganism on vinyl chloride and cis-dichloroethene as electron acceptors as determined by competitive PCR. Appl. Environ. Microbiol. 69, 953–959. doi: 10.1128/AEM.69.2.953-959.2003
Dugat-Bony, E., Biderre-Petit, C., Jaziri, F., David, M. M., Denonfoux, J., Lyon, D. Y., et al. (2012). In situ TCE degradation mediated by complex dehalorespiring communities during biostimulation processes. Microb. Biotechnol. 5, 642–653. doi: 10.1111/j.1751-7915.2012.00339.x
Duhamel, M., and Edwards, E. A. (2006). Microbial composition of chlorinated ethene-degrading cultures dominated by Dehalococcoides. FEMS Microbiol. Ecol. 58, 538–549. doi: 10.1111/j.1574-6941.2006.00191.x
Duhamel, M., and Edwards, E. A. (2007). Growth and yields of dechlorinators, acetogens, and methanogens during reductive dechlorination of chlorinated ethenes and dihaloelimination of 1,2-dichloroethane. Environ. Sci. Technol. 41, 2303–2310. doi: 10.1021/es062010r
Duhamel, M., Mo, K., and Edwards, E. A. (2004). Characterization of a highly enriched Dehalococcoides-containing culture that grows on vinyl chloride and trichloroethene. Appl. Environ. Microbiol. 70, 5538–5545. doi: 10.1128/AEM.70.9.5538-5545.2004
Duhamel, M., Wehr, S., Yu, L. Y., Rizvi, H., Seepersad, D., Dworatzek, S., et al. (2002). Comparison of anaerobic dechlorinating enrichment cultures maintained on tetrachloroethene, trichloroethene, cis- 1,2-dichloroethene and vinyl chloride. Water Res. 36, 4193–4202. doi: 10.1016/S0043-1354(02)00151-3
Ellis, D. E., Lutz, E. J., Odom, J. M., Buchanan, J. R. L., Bartlett, C. L., Lee, M. D., et al. (2000). Bioaugmentation for accelerated in situ anaerobic bioremediation. Environ. Sci. Technol. 34, 2254–2260. doi: 10.1021/es990638e
Fung, J. M., Morris, R. M., Adrian, L., and Zinder, S. H. (2007). Expression of reductive dehalogenase genes in Dehalococcoides ethenogenes strain 195 growing on tetrachloroethene, trichloroethene, or 2,3-dichlorophenol. Appl. Environ. Microbiol. 73, 4439–4445. doi: 10.1128/AEM.00215-07
Gerritse, J., Renard, V., Pedro-Gomes, T. M., Lawson, P. A., Collins, M. D., and Gottschal, J. C. (1996). Desulfitobacterium sp. Strain PCE1, an anaerobic bacterium that can grow by reductive dechlorination of tetrachloroethene or orotho-chlorinated phenols. Arch. Microbiol. 165, 132–140. doi: 10.1007/s002030050308
Hatt, J. K., and Löffler, F. E. (2012). Quantitative real-time PCR (qPCR) detection chemistries affect enumeration of the Dehalococcoides 16S rRNA gene in groundwater. J. Microbiol. Methods 88, 263–270. doi: 10.1016/j.mimet.2011.12.005
Hatt, J. K., Ritalahti, K. M., Ogles, D. M., Lebron, C. A., and Loffler, F. E. (2013). Design and application of an internal amplification control to improve Dehalococcoides mccartyi 16S rRNA gene enumeration by qPCR. Environ. Sci. Technol. 47, 11131–11138. doi: 10.1021/es4019817
He, J., Ritalahti, K. M., Aiello, M. R., and Löffler, F. E. (2003). Complete detoxification of vinyl chloride by an anaerobic enrichment culture and identification of the reductively dechlorinating population as a Dehalococcoides species. Appl. Environ. Microbiol. 69, 996–1003. doi: 10.1128/AEM.69.2.996-1003.2003
Henry, B. M. (2010). “Biostimulation for anaerobic bioremediation of chlorinated solvents,” in Situ Remediation of Chlorinated Solvent Plumes. SERDP and ESTCP Remediation Technology Monograph Series, eds H. F. Stroo and C. H. Ward (New York, NY: Springer), 357–421.
Holliger, C., Hahn, D., Harmsen, H., Ludwig, W., Schumacher, W., Tindall, B., et al. (1998). Dehalobacter restrictus gen. nov. and sp. nov., a strictly anaerobic bacterium that reductively dechlorinates tetra- and trichloroethene in an anaerobic respiration. Arch. Microbiol. 169, 313–321. doi: 10.1007/s002030050577
Holmes, V., He, J., Lee, P., and Alvarez-Cohen, L. (2006). Discrimination of multiple Dehalococcoides strains in a trichloroethene enrichment by quantification of their reductive dehalogenase genes. Appl. Environ. Microbiol. 72, 5877–5883. doi: 10.1128/AEM.00516-06
Hood, E. D., Major, D. W., Quinn, J. W., Yoon, W.-S., Gavaskar, A., and Edwards, E. A. (2008). Demonstration of enhanced bioremediation in a tce source area at launch complex 34. Cape canaveral air force station. Groundwater Monitor. Remediat. 28, 98–107. doi: 10.1111/j.1745-6592.2008.00197.x
Hug, L. A. (2012). A Metagenome-Based Examination of Dechlorinating Enrichment cultures: Dehalococcoides and the Role of the Non-Dechlorinating Microorganisms. Ph.D. thesis, University of Toronto, Toronto.
Hug, L. A. (2016). “Chapter 16 in organohalide respiring bacteria,” in Diversity, Evolution, and Environmental Distribution of Reductive Dehalogenase Genes, ed. L. Adrian (Berlin: Springer-Verlag).
Hug, L. A., Beiko, R. G., Rowe, A. R., Richardson, R. E., and Edwards, E. A. (2012). Comparative metagenomics of three Dehalococcoides-containing enrichment cultures: the role of the non-dechlorinating community. BMC Genomics 13:327. doi: 10.1186/1471-2164-13-327
Hug, L. A., and Edwards, E. A. (2013). Diversity of reductive dehalogenase genes from environmental samples and enrichment cultures identified with degenerate primer screens. Fronti. Microbiol. 4:341. doi: 10.3389/fmicb.2013.00341
Hug, L. A., Maphosa, F., Leys, D., Löffler, F. E., Smidt, H., Edwards, E. A., et al. (2013). Overview of organohalide-respiring bacteria and a proposal for a classification system for reductive dehalogenases. Philos. Trans. R. Soc. Lond. B Biol. Sci. 368:20120322. doi: 10.1098/rstb.2012.0322
Islam, M. A., Waller, A. S., Hug, L. A., Provart, N. J., Edwards, E. A., and Mahadevan, R. (2014). New insights into Dehalococcoides mccartyi metabolism from a reconstructed metabolic network-based systems-level analysis of D. mccartyi transcriptomes. PLoS One 9:e94808. doi: 10.1371/journal.pone.0094808
Kocur, C. M., Lomheim, L., Molenda, O., Weber, K. P., Austrins, L. M., Sleep, B. E., et al. (2016). Long term field study of microbial community and dechlorinating activity following carboxymethyl cellulose-stabilized nanoscale zero valent iron injection. Environ. Sci. Technol. 50, 7658–7670. doi: 10.1021/acs.est.6b01745
Krajmalnik-Brown, R., Hölscher, T., Thomson, I. N., Saunders, F. M., Ritalahti, K. M., and Löffler, F. E. (2004). Genetic identification of a putative vinyl chloride reductase in Dehalococcoides sp. strain BAV1. Appl. Environ. Microbiol. 70, 6347–6351. doi: 10.1128/AEM.70.10.6347-6351.2004
Krumholz, L. R. (1997). Desulfuromonas chloroethenica sp. nov. uses tetrachloroethylene and trichloroethylene as electron acceptors. Int. J. Syst. Bacteriol. 47, 1262–1263. doi: 10.1099/00207713-47-4-1262
Kube, M., Beck, A., Zinder, S. H., Kuhl, H., Reinhardt, R., and Adrian, L. (2005). Genome sequence of the chlorinated compound-respiring bacterium Dehalococcoides species strain CBDB1. Nat. Biotechnol. 23, 1269–1273. doi: 10.1038/nbt1131
Lee, P. K., MacBeth, T. W., Sorenson, K. S., Deeb, R. A., and Alvarez-Cohen, L. (2008). Quantifying gene and transcripts of to assess the in situ physiology of Dehalococcoides in a trichloroethene groundwater site. Appl. Environ. Microbiol. 74, 2728–2739. doi: 10.1128/AEM.02199-07
Lee, P. K., Warnecke, F., Brodie, E. L., MacBeth, T. W., Conrad, M. E., Andersen, G. L., et al. (2012). Phylogenetic microarray analysis of a microbial community performing reductive dechlorination at a TCE-contaminated site. Environ. Sci. Technol. 46, 1044–1054. doi: 10.1021/es203005k
Lendvay, J. M., Löffler, F. E., Dollhopf, M., Aiello, M. R., Daniels, G., Fathepure, B. Z., et al. (2003). Bioreactive barriers: a comparison of bioaugmentation and biostimulation for chlorinated solvent remediation. Environ. Sci. Technol. 37, 1422–1431. doi: 10.1021/es025985u
Liang, X., Molenda, O., Tang, S., and Edwards, E. A. (2015). Identity and substrate-specificity of reductive dehalogenases expressed in Dehalococcoides-containing enrichment cultures maintained on different chlorinated ethenes. Appl. Environ. Microbiol. 81, 4626–4633. doi: 10.1128/AEM.00536-15
Lu, Y., Atashgahi, S., Hug, L., and Smidt, H. (2015). “Primers that target functional genes of organohalide-respiring bacteria,” in Hydrocarbon and Lipid Microbiology Protocols. Springer Protocols Handbooks, eds T. J. McGenity, K. N. Timmis, B. Nogales (Heidelberg: Springer).
Luijten, M. L., de Weert, J., Smidt, H., Boschker, H. T., de Vos, W. M., Schraa, G., et al. (2003). Description of Sulfurospirillum halorespirans sp nov., an anaerobic, tetrachloroethene-respiring bacterium, and transfer of Dehalospirillum multivorans to the genus Sulfurospirillum as Sulfurospirillum multivorans comb. nov. Int. J. Syst. Evol. Microbiol. 53, 787–793. doi: 10.1099/ijs.0.02417-0
Magnuson, J. K., Romine, M. F., Burris, D. R., and Kingsley, M. T. (2000). Trichloroethene reductive dehalogenase from Dehalococcoides ethenogenes: sequence of tceA and substrate range characterization. Appl. Environ. Microbiol. 66, 5141–5147. doi: 10.1128/AEM.66.12.5141-5147.2000
Magnuson, J. K., Stern, R. V., Gossett, J. M., Zinder, S. H., and Burriss, D. R. (1998). Reductive dechlorination of tetrachloroethene to ethene by a two-component enzyme pathway. Appl. Environ. Microbiol. 64, 1270–1275.
Major, D. W., McMaster, M. L., Cox, E. E., Edwards, E. A., Dworatzek, S. M., Hendrickson, E. R., et al. (2002). Field demonstration of successful bioaugmentation to achieve dechlorination of tetrachloroethene to ethene. Environ. Sci. Technol. 36, 5106–5116. doi: 10.1021/es0255711
Manchester, M. J., Hug, L. A., Zarek, M., Zila, A., and Edwards, E. A. (2012). Discovery of a trans-dichloroethene-respiring Dehalogenimonas species in the 1,1,2,2-tetrachloroethane-dechlorinating WBC-2 consortium. Appl. Environ. Microbiol. 78, 5280–5287. doi: 10.1128/AEM.00384-12
Mayer-Blackwell, K., Azizian, M. F., Machak, C., Vitale, E., Carpani, G., de Ferra, F., et al. (2014). Nanoliter qPCR platform for highly parallel, quantitative assessment of reductive dehalogenase genes and populations of dehalogenating microorganisms in complex environments. Environ. Sci. Technol. 48, 9659–9667. doi: 10.1021/es500918w
Mayer-Blackwell, K., Fincker, M., Molenda, O., Callahan, B., Sewell, H., Holmes, S., et al. (2016). 1,2-Dichloroethane exposure alters the population structure, metabolism, and kinetics of a trichloroethene-dechlorinating Dehalococcoides mccartyi consortium. Environ. Sci. Technol. 50, 12187–12196. doi: 10.1021/acs.est.6b02957
Maymó-Gatell, X., Chien, Y.-T., Gossett, J. M., and Zinder, S. H. (1997). Isolation of a bacterium that reductively dechlorinates tetrachloroethene to ethene. Science 276, 1568–1571. doi: 10.1126/science.276.5318.1568
Maymó-Gatell, X., Nijenhuis, I., and Zinder, S. H. (2001). Reductive dechlorination of cis-1,2-dichloroethene and vinyl chloride by Dehalococcoides ethenogenes. Environ. Sci. Technol. 35, 516–521. doi: 10.1021/es001285i
McCarty, P. L. (2010). “Groundwater contamination by chlorinated solvents: history, remediation technologies and strategies,” in Situ Remediation of Chlorinated Solvent Plumes, eds H. F. Stroo, and C. H. Ward (New York, NY: Taylor & Francis), 1–24.
McMurdie, P. J., Behrens, S. F., Müller, J. A., Goke, J., Ritalahti, K. M., Wagner, R., et al. (2009). Localized plasticity in the streamlined genomes of vinyl chloride respiring Dehalococcoides. PLoS Genet. 5:e1000714. doi: 10.1371/journal.pgen.1000714
Moe, W. M., Yan, J. Y., Nobre, M. F., da Costa, M. S., and Rainey, F. A. (2009). Dehalogenimonas lykanthroporepellens gen. nov., sp. nov., a reductively dehalogenating bacterium isolated from chlorinated solvent-contaminated groundwater. Int. J. Syst. Evol. Microbiol. 59, 2692–2697. doi: 10.1099/ijs.0.011502-0
Müller, J. A., Rosner, B. M., von Abendroth, G., Meshulam-Simon, G., McCarty, P. L., and Spormann, A. M. (2004). Molecular identification of the catabolic vinyl chloride reductase from Dehalococcoides sp. strain VS and is environmental distribution. Appl. Environ. Microbiol. 70, 4880–4888. doi: 10.1128/AEM.70.8.4880-4888.2004
Payne, K. A., Quezada, C. P., Fisher, K., Dunstan, M. S., Collins, F. A., Sjuts, H., et al. (2015). Reductive dehalogenase structure suggests a mechanism for B12-dependent dehalogenation. Nature 517, 513–516. doi: 10.1038/nature13901
Pérez-de-Mora, A., Zila, A., McMaster, M. L., and Edwards, E. A. (2014). Bioremediation of chlorinated ethenes in fractured bedrock and associated changes in dechlorinating and non-dechlorinating microbial populations. Environ. Sci. Technol. 48, 5770–5779. doi: 10.1021/es404122y
Rahm, B. G., Chauhan, S., Holmes, V. F., Macbeth, T. W., Sorenson, K. S. J., and Alvarez-Cohen, L. (2006a). Molecular characterization of microbial populations at two sites with differing reductive dechlorination abilities. Biodegradation 17, 523–534.
Rahm, B. G., Morris, R. M., and Richardson, R. E. (2006b). Temporal expression of respiratory genes in an enrichment culture containing Dehalococcoides ethenogenes. Appl. Environ. Microbiol. 72, 5486–5491.
Rahm, B. G., and Richardson, R. E. (2008). Correlation of respiratory gene expression levels and pseudo-steady-state PCE respiration rates in Dehalococcoides ethenogenes. Environ. Sci. Technol. 42, 416–421. doi: 10.1021/es071455s
Ritalahti, K., Amos, B., Sung, Y., Wu, Q., Koenigsberg, S., and Loffler, F. (2006). Quantitative PCR targeting 16S rRNA and reductive dehalogenase genes simultaneously monitors multiple Dehalococcoides strains. Appl. Environ. Microbiol. 72, 2765–2774. doi: 10.1128/AEM.72.4.2765-2774.2006
Ritalahti, K. M., Hatt, J. K., Lugmayr, V., Henn, L., Petrovskis, E. A., Ogles, D. M., et al. (2010). Comparing on-site to off-site biomass collection for Dehalococcoides biomarker gene quantification to predict in situ chlorinated ethene detoxification potential. Environ. Sci. Technol. 44, 5127–5133. doi: 10.1021/es100408r
Seshadri, R., Adrian, L., Fouts, D. E., Eisen, J. A., Phillippy, A. M., Methe, B. A., et al. (2005). Genome sequence of the PCE-dechlorinating bacterium Dehalococcoides ethenogenes. Science 307, 105–108. doi: 10.1126/science.1102226
Smidt, H., and de Vos, W. M. (2004). Anaerobic microbial dehalogenation. Annu. Rev. Microbiol. 58, 43–73. doi: 10.1146/annurev.micro.58.030603.123600
Stroo, H. F., Major, D. W., and Gossett, J. M. (2010). “Bioaugmentation for anaerobic bioremediation of chlorinated solvents,” in Situ Remediation of Chlorinated Solvent Plumes, eds H. F. Stroo, and C. H. Ward (New York, NY: Springer), 425–454. doi: 10.1007/978-1-4419-1401-9_13
Sung, Y., Fletcher, K. E., Ritalahti, K. M., Apkarian, R. P., Ramos-Hernández, N., Sanford, R. A., et al. (2006a). Geobacter lovleyi sp. nov. strain SZ, a novel metal-reducing and tetrachloroethene-dechlorinating bacterium. Appl. Environ. Microbiol. 69, 2775–2782.
Sung, Y., Ritalahti, K. M., Apkarian, R. P., and Löffler, F. E. (2006b). Quantitative PCR confirms purity of strain GT, a novel trichloroethene-to-ethenerespiring Dehalococcoides isolate. Appl. Environ. Microbiol. 72, 1980–1987.
Tang, S., Chan, W. W., Fletcher, K. E., Seifert, J., Liang, X., Löffler, F. E., et al. (2013). Functional characterization of reductive dehalogenases using blue native polyacrylamide gel electrophoresis. Appl. Environ. Microbiol. 79, 974–981. doi: 10.1128/AEM.01873-12
Tang, S., Wang, P. H., Higgins, S. A., Löffler, F. E., and Edwards, E. A. (2016). Sister dehalobacter genomes reveal specialization in organohalide respiration and recent strain differentiation likely driven by chlorinated substrates. Front. Microbiol. 7:119. doi: 10.3389/fmicb.2016.00100
van der Zaan, B., Hannes, F., Hoekstra, N., Rijnaarts, H., de Vos, W. M., Smidt, H., et al. (2010). Correlation of Dehalococcoides 16S rRNA and chloroethene-reductive dehalogenase genes with geochemical conditions in chloroethene-contaminated groundwater. Appl. Environ. Microbiol. 76, 843–850. doi: 10.1128/AEM.01482-09
Waller, A. S. (2009). Molecular Investigation of Chloroethene Reductive Dehalogenation by the Mixed Microbial Community KB1. Ph.D. thesis, University of Toronto, Toronto.
Waller, A. S., Hug, L. A., Mo, K., Radford, D. R., Maxwell, K. L., and Edwards, E. A. (2012). Transcriptional analysis of a Dehalococcoides-containing microbial consortium reveals prophage activation. Appl. Environ. Microbiol. 78, 1178–1186. doi: 10.1128/AEM.06416-11
Waller, A. S., Krajmalnik-Brown, R., Löffler, F. E., and Edwards, E. A. (2005). Multiple reductive-dehalogenase-homologous genes are simultaneously transcribed during dechlorination by Dehalococcoides-containing cultures. Appl. Environ. Microbiol. 71, 8257–8264. doi: 10.1128/AEM.71.12.8257-8264.2005
Yan, J., Ritahalati, K. M., Wagner, D., and Löffler, F. E. (2012). Unexpected specificity of interspecies cobamide transfer from Geobacter spp. to organohalide-respiring Dehalococcoides mccartyi strains. Appl. Environ. Microbiol. 78, 6630–6636. doi: 10.1128/AEM.01535-12
Yan, J., Şimşir, B., Farmer, A. T., Bi, M., Yang, Y., Campagna, S. R., et al. (2016). The corrinoid cofactor of reductive dehalogenases affects dechlorination rates and extents in organohalide-respiring Dehalococcoides mccartyi. ISME J. 10, 1092–1101. doi: 10.1038/ismej.2015.197
Keywords: bioaugmentation, rdhA gene, Dehalococcoides, real-time PCR, chlorinated ethenes (CE), groundwater bioremediation, bioestimulation, reductive dechlorination
Citation: Pérez-de-Mora A, Lacourt A, McMaster ML, Liang X, Dworatzek SM and Edwards EA (2018) Chlorinated Electron Acceptor Abundance Drives Selection of Dehalococcoides mccartyi (D. mccartyi) Strains in Dechlorinating Enrichment Cultures and Groundwater Environments. Front. Microbiol. 9:812. doi: 10.3389/fmicb.2018.00812
Received: 29 January 2018; Accepted: 10 April 2018;
Published: 17 May 2018.
Edited by:
Jianzhong He, National University of Singapore, SingaporeReviewed by:
Siavash Atashgahi, Wageningen University & Research, NetherlandsErnest Marco-Urrea, Universitat Autònoma de Barcelona, Spain
Mark Krzmarzick, Oklahoma State University, United States
Copyright © 2018 Pérez-de-Mora, Lacourt, McMaster, Liang, Dworatzek and Edwards. This is an open-access article distributed under the terms of the Creative Commons Attribution License (CC BY). The use, distribution or reproduction in other forums is permitted, provided the original author(s) and the copyright owner are credited and that the original publication in this journal is cited, in accordance with accepted academic practice. No use, distribution or reproduction is permitted which does not comply with these terms.
*Correspondence: Elizabeth A. Edwards, elizabeth.edwards@utoronto.ca
†Present address: Alfredo Pérez-de-Mora, Business Unit Soil & Groundwater, Tauw GmbH, Moers, Germany