 Guannan Mao
 Yuhao Song
 Mark Bartlam
 Yingying Wang
- 1Key Laboratory of Pollution Processes and Environmental Criteria (Ministry of Education), Tianjin Key Laboratory of Environmental Remediation and Pollution Control, College of Environmental Science and Engineering, Nankai University, Tianjin, China
- 2State Key Laboratory of Medicinal Chemical Biology, Nankai University, Tianjin, China
- 3College of Life Sciences, Nankai University, Tianjin, China
Residual chlorine is often required to remain present in public drinking water supplies during distribution to ensure water quality. It is essential to understand how bacteria respond to long-term chlorine exposure, especially with the presence of assimilable organic carbon (AOC). This study aimed to investigate the effects of chlorination on Pseudomonas aeruginosa in low AOC medium by both conventional plating and culture-independent methods including flow cytometry (FCM) and quantitative PCR (qPCR). In a simulated chlorinated system using a bioreactor, membrane damage and DNA damage were measured by FCM fluorescence fingerprint. The results indicated membrane permeability occurred prior to DNA damage in response to chlorination. A regrowth of P. aeruginosa was observed when the free chlorine concentration was below 0.3 mg/L. The bacterial response to long-term exposure to a constant low level of free chlorine (0.3 mg/L) was subsequently studied in detail. Both FCM and qPCR data showed a substantial reduction during initial exposure (0–16 h), followed by a plateau where the cell concentration remained stable (16–76 h), until finally all bacteria were inactivated with subsequent continuous chlorine exposure (76–124 h). The results showed three-stage inactivation kinetics for P. aeruginosa at a low chlorine level with extended exposure time: an initial fast inactivation stage, a relatively stable middle stage, and a final stage with a slower rate than the initial stage. A series of antibiotic resistance tests suggested long-term exposure to low chlorine level led to the selection of antibiotic-resistant P. aeruginosa. The combined results suggest that depletion of residual chlorine in low AOC medium systems could reactivate P. aeruginosa, leading to a possible threat to drinking water safety.
Introduction
Safe and clean water is a basic necessity that is essential for all aspects of everyday life. Nowadays, residual disinfectants are crucial to inhibit microbial growth and maintain water quality throughout distribution until the point-of-use in many countries (Proctor and Hammes, 2015; Prest et al., 2016). Among the many various disinfection methods, chlorination is widely used in public drinking water supply systems due to its low cost and simple use (Levy et al., 2014). The residual chlorine levels may be depleted over long distances or within complicated drinking water distribution systems and, as a consequence, excessive bacterial growth may lead to deterioration of water quality (Nescerecka et al., 2014). It has been reported that insufficient chlorine levels could result in a higher proportion of intact cells in chlorinated systems (Niquette et al., 2001; Gillespie et al., 2014). Meanwhile, previous studies have also found that biological stability is associated with nutrient limitation in drinking water distribution networks without any residual disinfectants (Vital et al., 2012; Lautenschlager et al., 2013). However, it is difficult to maintain low levels of nutrients during the distribution of drinking water. For instance, organic compounds from pipes have been shown to migrate into the water phase, which may not only support microbial growth (Wen et al., 2015) but also react with chlorine. Hence, the presence of nutrients and an inadequate chlorine concentration in drinking water would stimulate bacterial proliferation. Therefore, it is essential to investigate how microorganisms respond to real chlorinated drinking water systems with the presence of dissolved organic matter.
Previous studies on the effects of disinfectant on pure cultures have relied on conventional plating methods to quantify the extent of inactivation (Delaedt et al., 2008; Francisque et al., 2009; Huang et al., 2011). However, the culture-dependent method heterotrophic plate counts (HPC) has clear limitations, with only a minority of viable cells able to be cultivated in drinking water (Hammes et al., 2008). Culture-independent methods, such as flow cytometry (FCM) and quantitative PCR (qPCR), are therefore used for assessment and monitoring of indigenous bacteria in drinking water (McDaniels et al., 2005; Hammes et al., 2008; Wang et al., 2010b; Douterelo et al., 2014; Besmer et al., 2017). The combination of FCM and fluorescent stains has been successfully applied to the analysis of non-chlorinated drinking water (Besmer et al., 2014) and drinking water with residual chlorine (Gillespie et al., 2014). Bacteria in water samples can be enumerated by qPCR based on the quantification of target gene copies (Douterelo et al., 2014). The culture-independent methods are therefore conducive to providing more realistic information than conventional culture-dependent methods.
Pseudomonas aeruginosa is a rod-shaped Gram-negative opportunistic pathogen that may cause human infections, and P. aeruginosa is also considered to be the most important pseudomonad in drinking water (Mena and Gerba, 2009). Previous studies have reported that P. aeruginosa could develop resistance to low levels of chlorine used in water treatment (Ridgway and Olson, 1982; Shrivastava et al., 2004). Furthermore, P. aeruginosa is able to grow under a wide variety of environmental conditions, especially in low-nutrient water (Silva et al., 2008). Mendis et al. (2014) found P. aeruginosa growing in nutrient-poor water exhibited considerably diverse properties compared to bacteria grown in rich media under laboratory conditions. Additionally, several opportunistic pathogens have been shown to reactivate during long-term storage of added chlorine (Jjemba et al., 2010). Therefore, it is essential to investigate the dynamics of P. aeruginosa subjected to long-term chlorine disinfection in drinking water distribution systems.
In the present study, we used culture-independent methods (i.e., FCM and qPCR) as well as culture-dependent methods (i.e., HPC) to investigate the effects of long-term low levels of chlorine on P. aeruginosa growth in bioreactor fed with low assimilable organic carbon (AOC) medium. The aims of this study were to: (i) determine the threshold chlorine concentration in drinking water in the presence of nutrients; (ii) investigate whether long-term exposure of chlorine leads to selection of chlorine-resistant P. aeruginosa; and (iii) elucidate the inactivation kinetics for long-term chlorination.
Materials and Methods
Microorganism and Pre-cultivation
Pseudomonas aeruginosa PAO1 was incubated in sterile Luria-Bertani (LB) broth overnight at 37°C. P. aeruginosa was streaked onto the LB agar plate and grown for 24 h at 37°C. A single colony was transferred with a loop into the sterile 100-times diluted LB broth and incubated for 24 h at 37°C on a shaking incubator to be used as inoculum.
Low AOC Medium Systems
A bioreactor (BioFlo CelliGen 115, New Brunswick, Eppendorf, United States) was used to simulate low AOC medium systems. The 10000-times diluted LB medium was used to simulate the low AOC medium system. The method of synthetic substrates addition has been successfully applied to analyze the effects of nutrients on the regrowth bacteria in drinking water distribution system (Van der Kooij et al., 1982; Miettinen et al., 1999; Ellis et al., 2000; Jegatheesan et al., 2004; Tsai, 2005; Oh et al., 2009). Sterile 10000-times diluted LB medium (simulated drinking water) was continuously pumped into the bioreactor (flow rate 2 ± 0.07 mL/h) and the mixed water was pumped out of the bioreactor with two peristaltic pumps (maintaining a constant water level in the bioreactor). The bioreactor was cleaned with soap and rinsed with deionized water twice and then air-dried. The bioreactor was sterilized by autoclaving. The bioreactor was supplied with sterile 1 L 10000-times diluted LB medium and sealed by headplate to avoid bacterial contamination. The main parameters of the medium (i.e., temperature, 23.1 ± 0.35°C and pH, 7.46 ± 0.07) were controlled and monitored by bioreactor. The chlorine solution was obtained by adding a sodium hypochlorite (NaOCl) solution with a concentration of about 14.5% active chlorine (Energy Chemical, China) to the carbon-free deionized water to the final concentration of 20 mg/L. Chlorine solution was pumped into the bioreactor by a peristaltic pump (the flow rate see below).
Chlorination Experiments With P. aeruginosa
For P. aeruginosa disinfection experiments, P. aeruginosa was added to the bioreactor with a sterile syringe. When the final cell concentration reached 107 cells/mL, chlorine solution was pumped into the bioreactor. The concentration of chlorine was increased from 0 mg/L to 0.47 mg/L (flow rate 2 ± 0.07 mL/h) in the first 10 h. When chlorine peaked at 0.47 mg/L, the addition of chlorine was stopped. The experiment was stopped when the concentration of chlorine was under 0.02 mg/L. Samples were taken from system at regular time interval. Free chlorine concentration was measured immediately after sampling. Cultivable cells were measured with HPC (as described below). FCM was applied in total cell and intact cell number analysis. Quenching step was not included in this study since it had no significant effect on cell counting (Supplementary Figure S1) with the chlorine concentration applied in the current study. All measurements were performed in triplicate.
Long-Term Chlorination Experiments on Constant Concentration
The sterilized, 10,000-times diluted LB medium was spiked with P. aeruginosa (final concentration of 107 cells/mL) and chlorine. The concentration of chlorine was maintained constant at 0.3 mg/L by an uninterrupted supply of fresh chlorine (flow rate 0.9 ± 0.06 mL/h). 124 h of chlorination was performed. Samples were taken at regular time intervals and collected in 40 mL sterile vials. Antibiotic resistance, FCM and qPCR analysis were carried out after sampling (as described below). All measurements were performed in triplicate.
The chlorination inactivation kinetics were analyzed based on plotting log(N/N0) versus the chlorination exposure according to the equation log(N/N0) = –k[Ct]. [N] is the intact cell number, and [N0] is the initial cell concentration. [Ct]: Chlorine concentration [C] multiplied by the exposure time [t] for each time point. The rate constant [k] is determined by fitting log(N/N0) against [Ct].
Chlorine Determination
The chlorine concentrations were determined by the N,N-diethyl-p-phenylenediamine (DPD) colorimetric method using a pocket colorimeter (Hach-Lange, Salford, United Kingdom). In this method, the DPD powder is added to the sample and oxidized by chlorine. The solution becomes red in color and the color intensity is proportional to the chlorine concentration. The range of the colorimeter is 0.02 to 8 mg/L. The colorimeter has an accuracy of ±3%.
FCM Measurements
Flow cytometry was performed on a Partec CyFlow Space flow cytometer (Partec GmbH, Münster, Germany) with a 50 mW blue solid-state laser, emitting at a fixed wavelength of 488 nm. Detection was triggered on green fluorescence and collected as logarithmic signals. Green fluorescence was collected at FL1 = 520 ± 20 nm, and red fluorescence was collected at FL3 = 630 nm, while forward and sideward scattered light intensities were collected as well. The instrument is equipped with volumetric counting hardware. In short, the number of particles in 200 μL of each sample were automatically enumerated (Berney et al., 2008). Counts quantification limited of the instrument were 1000 cells/mL and the instrument have an instrumental error below 5% (Hammes et al., 2008; Lee et al., 2016). The FCM regularly maintains and calibrate with calibration beads. The corresponding light signals are then converted to electronic signals and data were analyzed with the Flomax software.
For measurements of total cell count (TCC), 10 μL SYBR Green I (SGI) (1:100 dilution in dimethyl sulfoxide (DMSO), Invitrogen) was added to 1 mL sample (dilutions of the sample were performed when appropriate). Samples were briefly vortexed and incubated at 37°C for 15 min in the dark before measurement. Strictly controlling staining time avoid interference of DMSO solvent on viability of cells (Berney et al., 2008; Nescerecka et al., 2016a). For measurements of intact cell count (ICC), Propidium Iodide (PI) (30 mW, Invitrogen) was combined with SYBR Green I stock at a ratio of 1:50. The same protocol as described above was used for the staining.
Plate Counts and Antibiotic Resistance Testing
To obtain HPC, samples were diluted 10-times with sterile physiological solution (0.85% NaCl) and 100 μL of the appropriate dilutions were spread onto the LB agar plates. Colony-Forming Units (CFUs) were counted after 24 h incubation at 37°C.
Samples were tested for antibiotic resistance using the National Food and Drug Administration disk diffusion method. The following antibiotic disks were tested: ciprofloxacin (5 μg/disk), gentamicin (10 μg/disk), erythromycin (15 μg/disk), norfloxacin (10 μg/disk), and tetracycline (30 μg/disk). Samples were streaked on the MH agar plate containing antibiotic disks, and the diameter (D) of the inhibition zone was measured after 18 h incubation at 37°C.
DNA Extraction and Quantitative PCR
Total DNA was extracted from each sample isolate by DNA extraction kit (Qiagen, Germany) according to the manufacturer’s instructions. For amplification of the highly conserved region of gyrA gene of P. aeruginosa, the forward primer (5′-TTATGCCATGAGCGAGCTGGGCAACGACT-3′) and reverse primer (5′-AACCGTTGACCAGCAGGTTGGGAATCTT-3′) (Kureishi et al., 1994) were used. Each 20 μL reaction mixture contained 10 μL of 2 × GoTaq® qPCR Master Mix (Promega, United States), 0.05 μL of each primer, 7.2 μL nuclease-free water, and 2 μL DNA templates. The cycling programs were optimized at 95°C for 420 s for preincubation, followed by 3-step amplification with 50 cycles of 95°C for 15 s, 55°C for 30 s and 72°C for 30 s with fluorescence acquisition. The melting curve was generated at the end. In every run, standard curves were plotted using a 10-fold serial dilution of purified plasmid DNA containing the target insert. Negative controls contained nuclease-free water instead of the DNA template. All samples were run in triplicate.
Results
Change of P. aeruginosa Cells During the Chlorination Process
Cell damage in chlorinated water with AOC concentration was monitored over 48 h. Free chlorine concentrations increased from 0 to 0.47 mg/L in the first 10 h, then decreased to below 0.02 mg/L in this study (Figure 1). Four distinct phases (i.e., non-chlorinated; membrane damage; DNA damage and cell regeneration) were revealed during the chlorination process (Figure 2). Figures 2A–E shows the result of samples stained with SGI. The TCC of 1.3 × 10⁷ cells/mL was observed before chlorination, as shown in the yellow ellipse gate (Figure 2A). In general, the TCC gate (or so-called fluorescence fingerprint) is fixed when SGI stains all cells indiscriminate of viability (Berney et al., 2008; Prest et al., 2013). However, Lee et al. (2016) found the fixed-gate strategy was incorrect for measurement of TCC when DNA underwent considerable damage. In this study, the shift of the gate [yellow dashed ellipse shifted to yellow solid ellipse (Figure 2C)] was also observed at high chlorine concentration (0.47 mg/L) after 1 h. If the fixed-gate strategy is used for quantification, the TCC decreased dramatically. This is important as it indicated bacteria experienced considerable DNA damage (e.g., DNA unwinding) at the specific chlorine dose of 0.47 mg/L. New dots within the yellow dashed ellipse appeared when chlorine was gradually depleted (below 0.3 mg/L) (Figure 2D). It can be concluded from these results that the cells begin to recover (regrow) when the free chlorine residual level dropped below 0.3 mg/L. After 12 h (hours 36–48) of suboptimal chlorination levels, the TCC fingerprint (yellow solid ellipse) was restored to the same position as the original (Figures 2E vs. 2A).
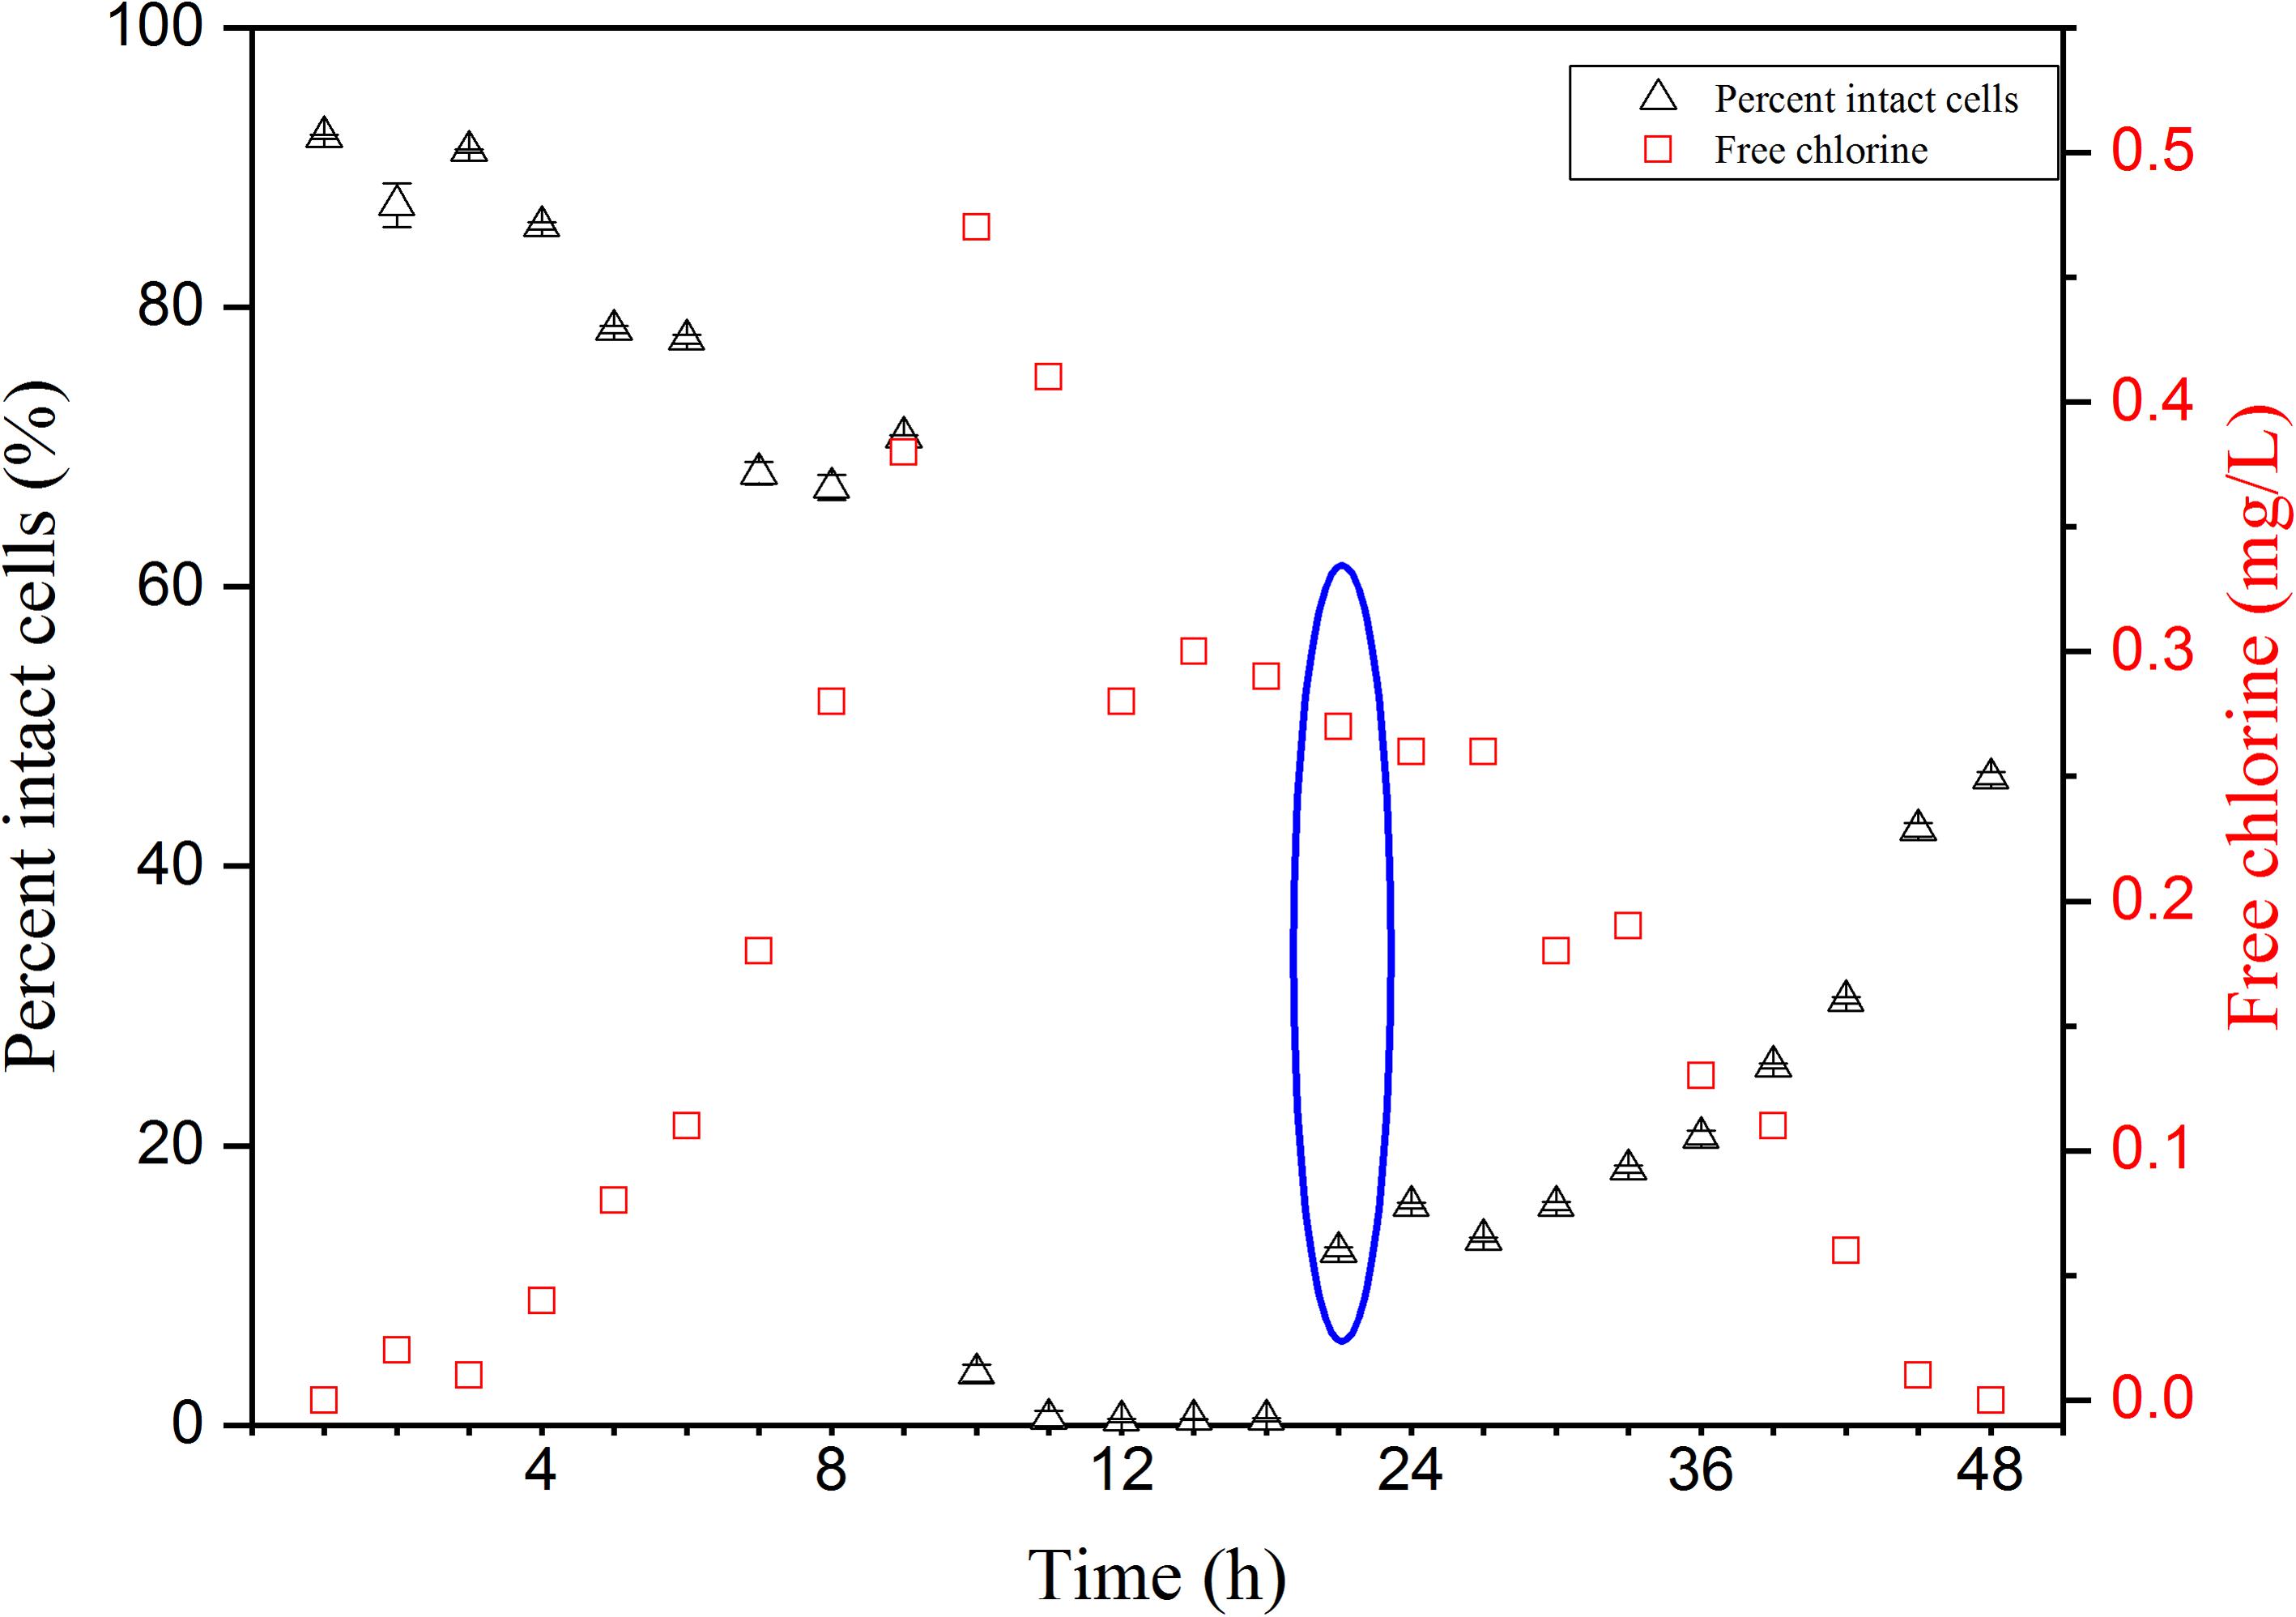
FIGURE 1. Free chlorine concentration changes and proportions of intact cells of Pseudomonas aeruginosa over 48 h of chlorination in the simulated low assimilable organic carbon (AOC) medium systems. SGI/PI stained cells were enumerated by FCM for intact cell number. Bacteria reactivation was observed from blue cycle data.
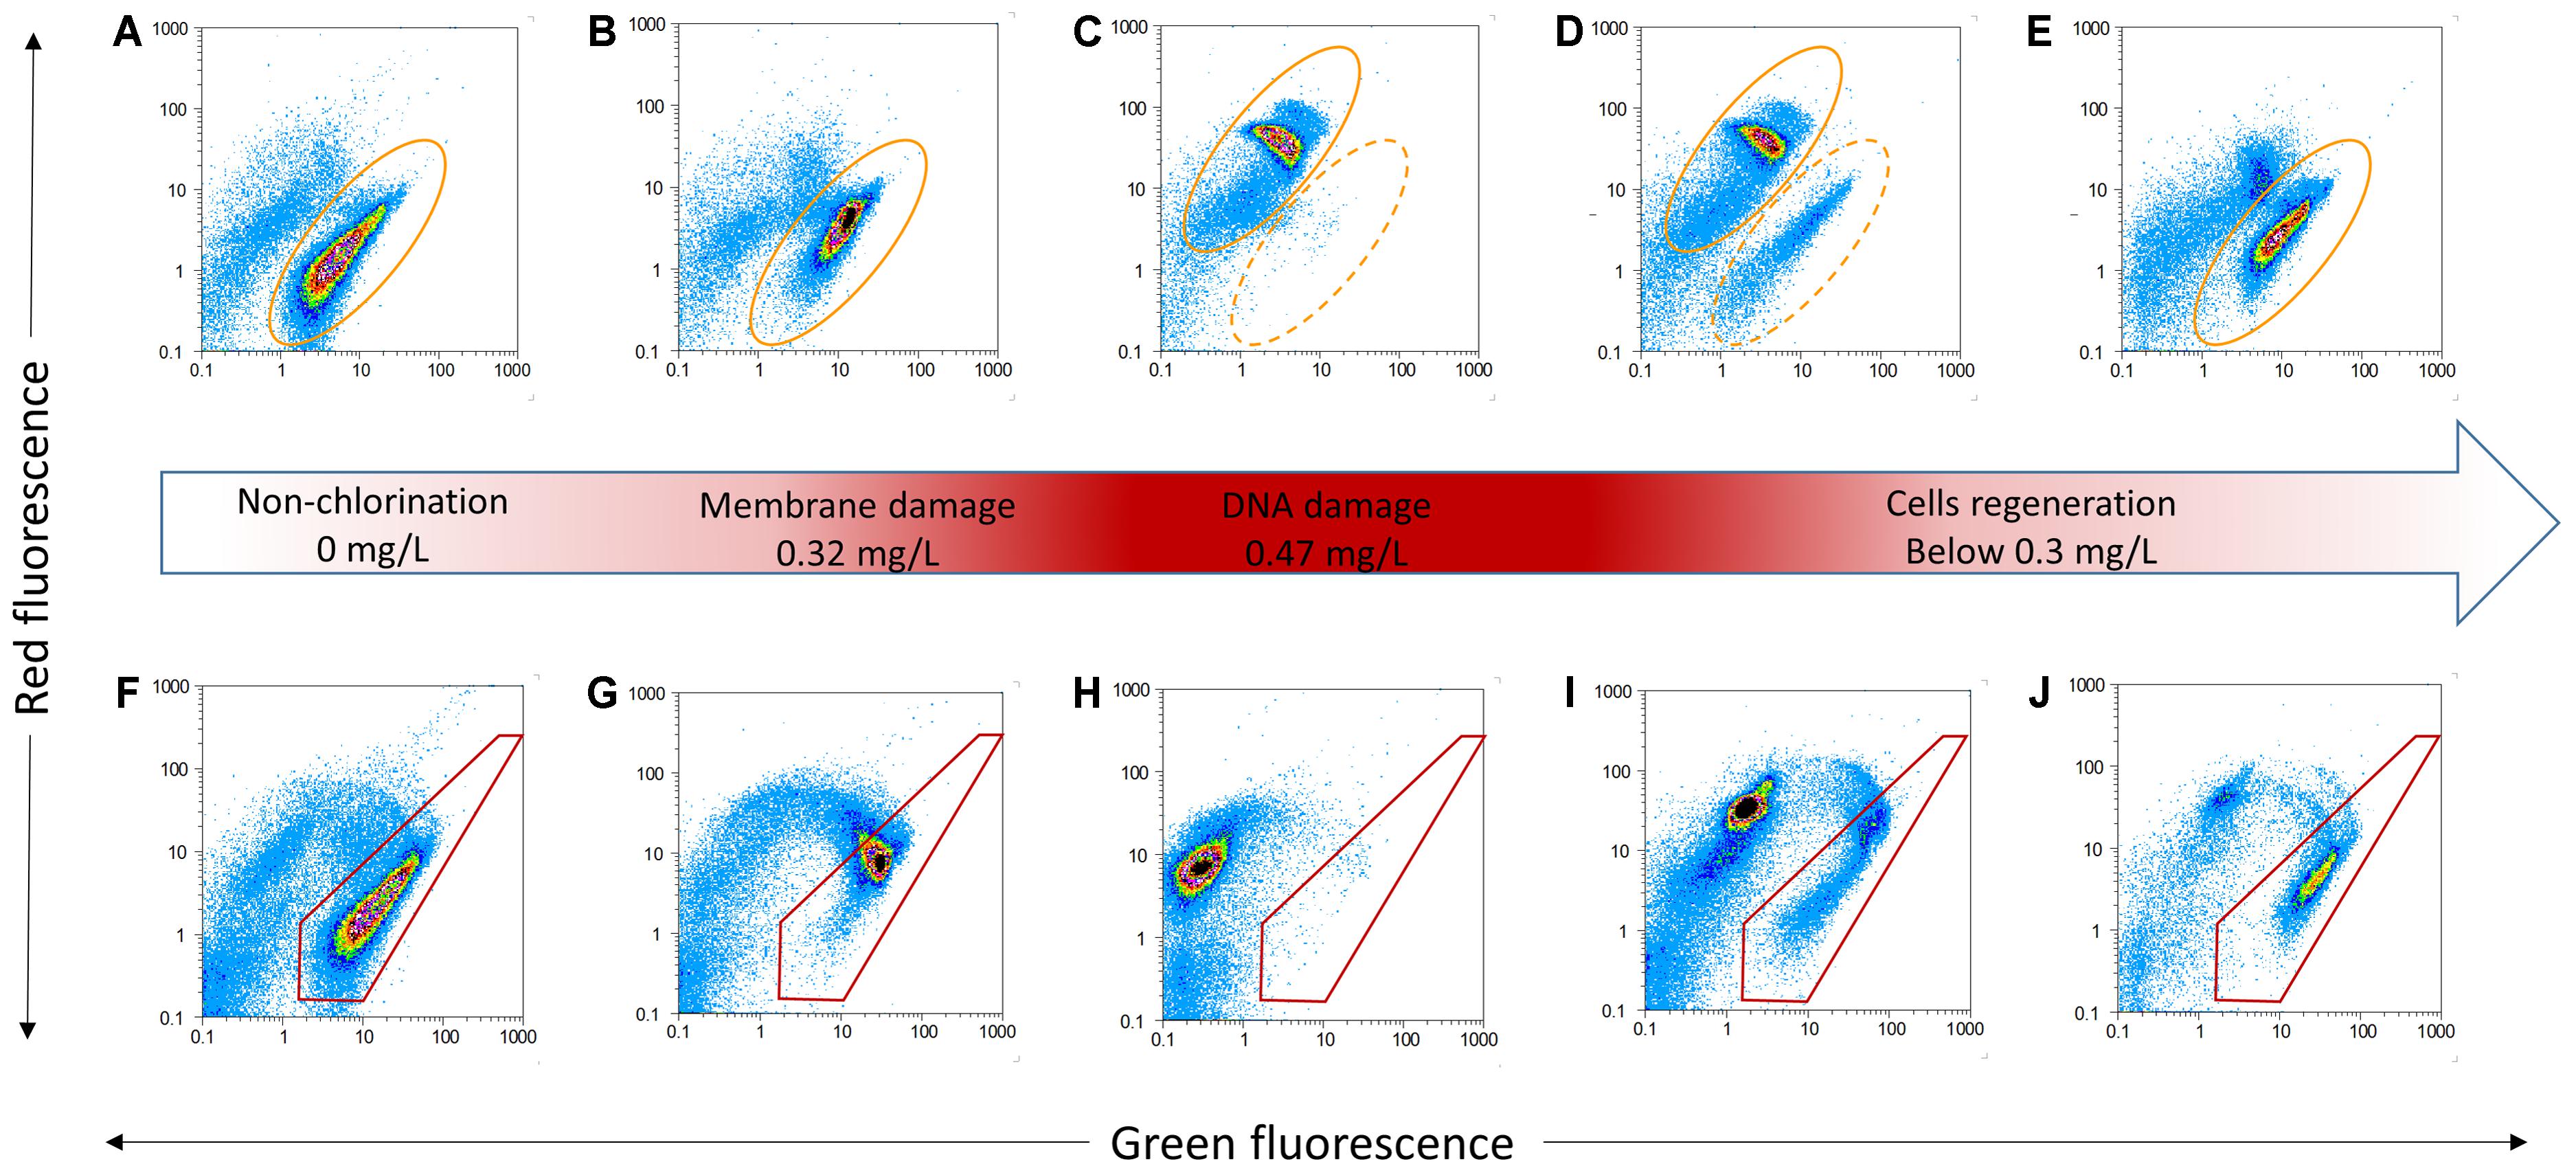
FIGURE 2. Examples of flow cytometric dot plots of P. aeruginosa for TCC stained with SGI (A–E) and ICC stained with SGI/PI (F–J) and various status (middle red arrow). Yellow ellipses (dashed and solid) tracked SGI fingerprint shift due to different chlorination. Red polygons illustrated membrane damage with change of chlorine.
During the period of increasing chlorine, the percentage of intact cells decreased slightly in the first 9 h (Figure 1). When the free residual chlorine level approached 0.47 mg/L, the proportion of intact cells dropped dramatically to less than 1%. From the FCM plots, various cellular changes can be observed at different concentrations of chlorine. Figures 2F–J shows cells that are stained with a combination of SGI and PI. The cells take up red fluorescent PI when their membrane integrity is lost (Berney et al., 2007). The ICC data showed cell damage (Figures 2F–H) due to increasing chlorine concentration and cell regeneration (Figures 2I,J) as a result of insufficient chlorination. It is evident that membrane damage (Figure 2G) could be detected at 0.32 mg/L-Cl. After a higher exposure level (0.47 mg/L; 1 h, Figure 2H), most of the P. aeruginosa cells had lost their integrity, while at the same time DNA damage was also observed via the changing gate of TCC. The results demonstrated that chlorine first damaged the cell membranes and then attacked intracellular components such as the chromosome. It is interesting to note that at a disinfection residual below 0.3 mg/L free chlorine, bacterial regrowth was detected in this system (Figure 1, blue circle). The intact region became dominant once again on the FCM plots (Figures 2I,J). This indicates that part of the population had the ability to regenerate in the presence of residual chlorine.
Intact cells in P. aeruginosa was also enumerated by HPC. Both microbiological parameters (FCM and HPC) showed a decrease with increasing [Ct] value (Figure 3). However, the conventional HPC results were lower than those measured by FCM, indicating some P. aeruginosa entered a viable-but-not-cultivable (VBNC) bacterial state after disinfection treatment. The percentage of cells in the VBNC state increased along with increasing chlorine concentration (Figure 3).
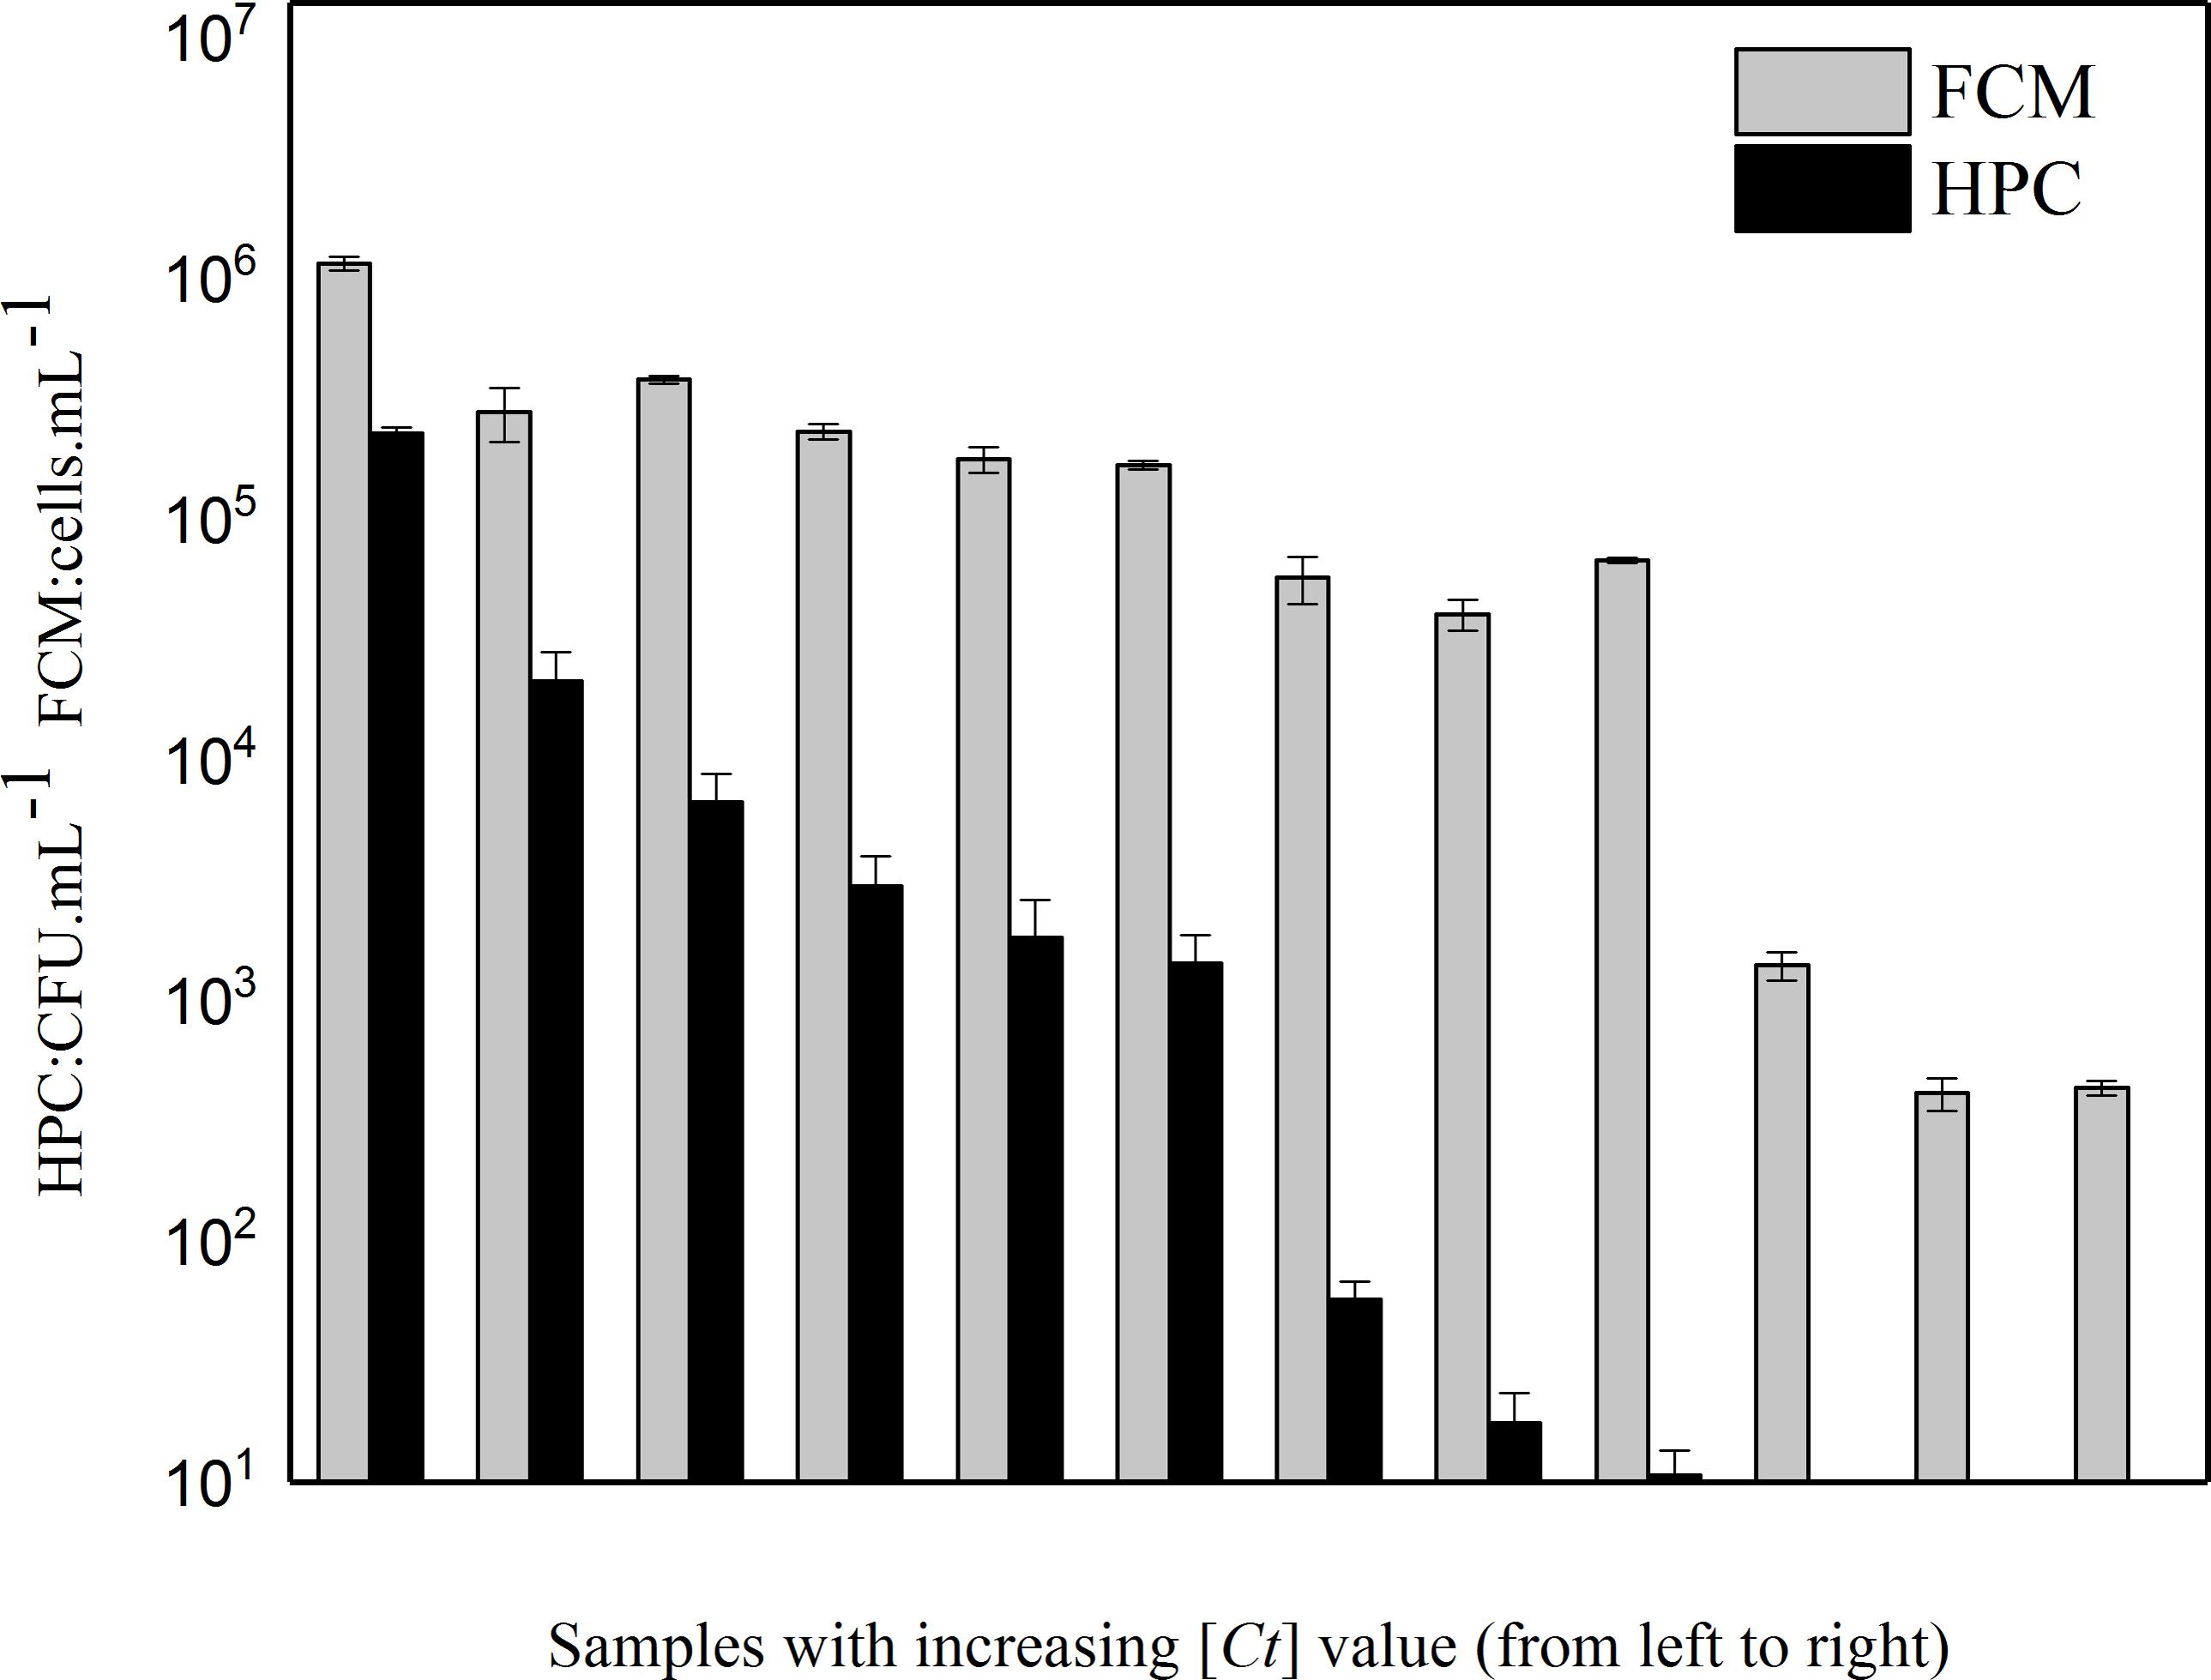
FIGURE 3. Relative decrease of intact cell number determined by two different methods (i.e., culture-dependent method HPC and culture-independent method FCM) with increasing [Ct] value in the simulated low AOC medium systems.
Effects of Long-Term Exposure to Constant Chlorine on P. aeruginosa
Temporal Change of Cell Concentrations Analyzed by FCM and qPCR
A regrowth threshold (0.3 mg/L-Cl) was observed during the chlorination process. Long-term (i.e., 124 h) exposure to this constant chlorine concentration (0.3 ± 0.05 mg/L) revealed temporal changes in TCC and ICC (Figure 4). During the initial 10 h of exposure, the ICC decreased substantially from 6.8 × 10⁶ cells/mL to 9.8 × 10⁴ cells/mL, indicating that most bacterial membranes were damaged during initial exposure to chlorine. The number of intact cells remained stable between 16 and 76 h after exposure, showing that some of the population gained resistance to chlorine exposure. Finally, all of the P. aeruginosa cells were inactivated after prolonged exposure to chlorine. The TCC remained constant over 100 h. Due to oxidative damage of DNA during long-term exposure, the fluorescence intensity weakened slightly (Phe et al., 2004). Lastly the final concentration of total bacteria decreased to 7.1 × 10⁵ cells/mL. At a concentration of 0.3 mg/L, there was no apparent resuscitation over 124 h with long-term chlorine exposure.
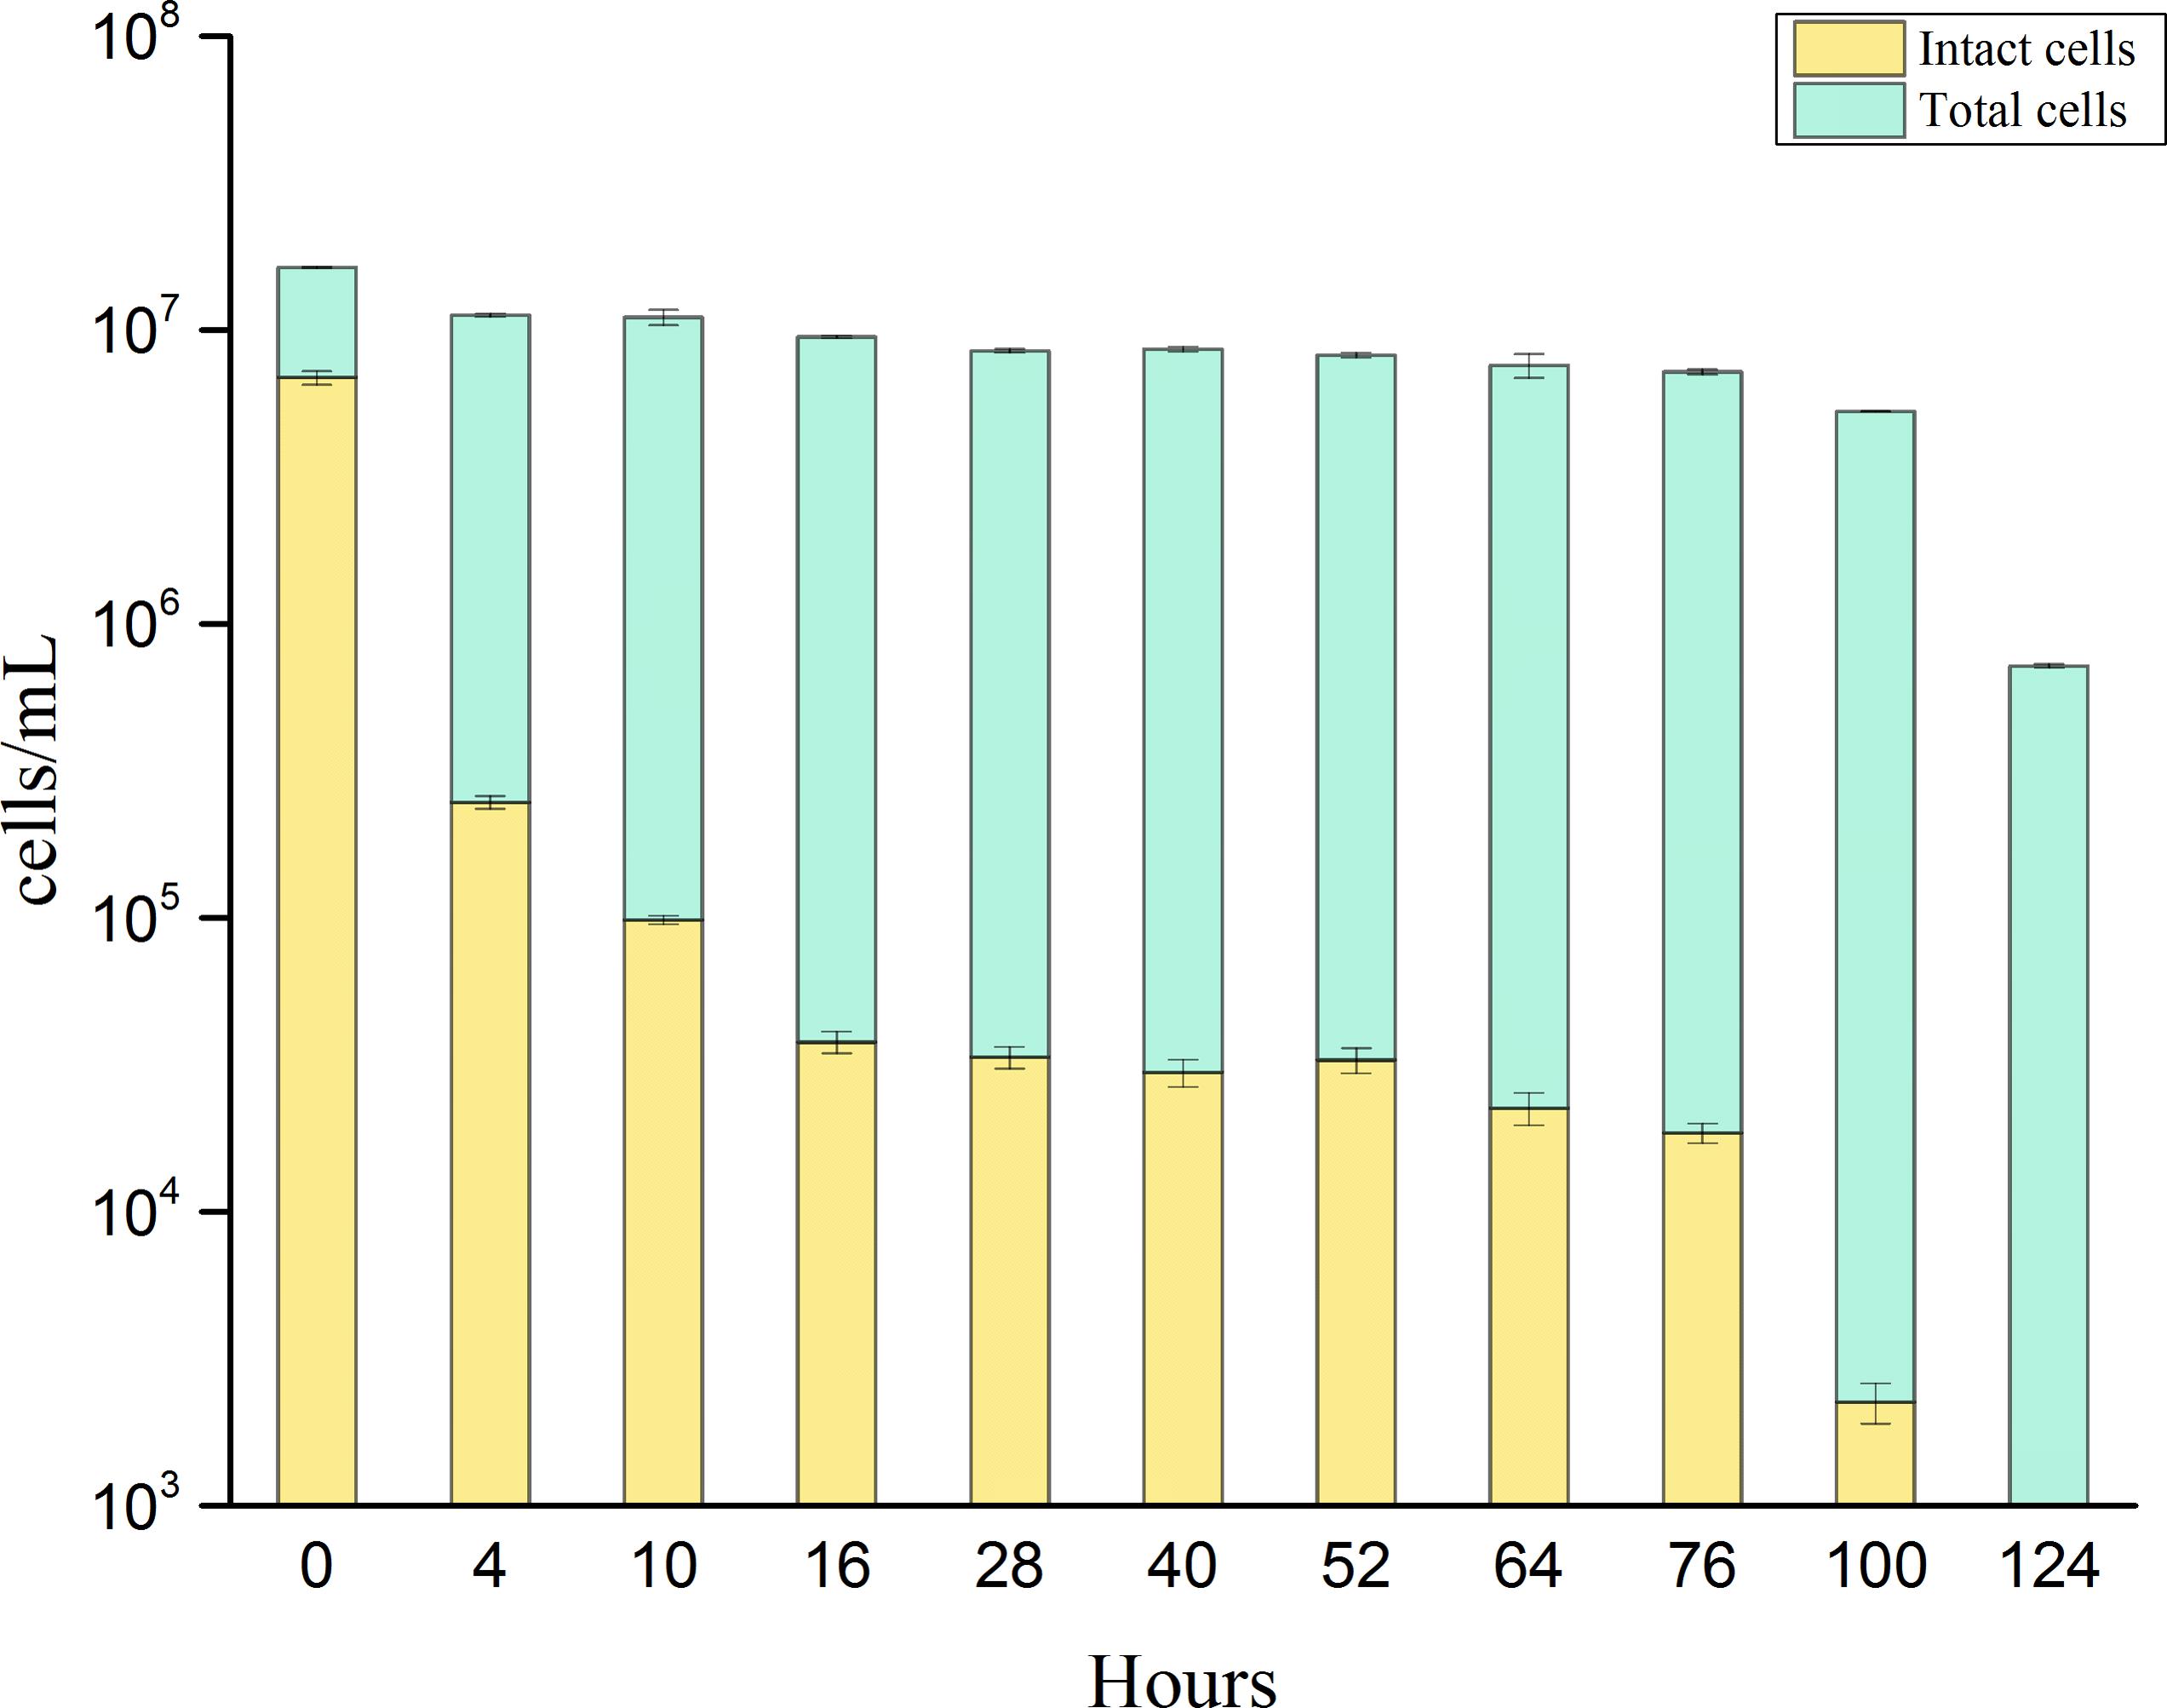
FIGURE 4. Changes of total cell concentration (stained by SGI) and intact cell concentration (stained by SGI/PI) of P. aeruginosa during long-term (124 h) exposure to chlorine at a constant chlorine concentration of 0.3 ± 0.05 mg/L. Error bars indicate standard deviation of triplicate measurements.
Temporal changes of P. aeruginosa during long-term exposure to chlorine was also monitored with qPCR. gyrA encodes for the subunit A of DNA gyrase in P. aeruginosa (Schwartz et al., 2006). Serial dilutions of the plasmid containing gyrA gene were used to establish the standard curve (Supplementary Figure S2), ranging from 1 × 10³ – 1 × 10⁹ copies per reaction. The standard curve slope was –3.39 with a correlation coefficient greater than 0.99. The qPCR efficiency was 97%. The copies of the gyrA gene of P. aeruginosa during chlorine disinfection were monitored by a culture-independent method (qPCR) (Figure 5). At an initial chlorine exposure of 98 mg⋅min/L the gyrA copies were 8.8 × 10⁴ copies/mL. Afterwards, the number of gyrA copies decreased to 3.7 × 10⁴ copies/mL at a chlorine exposure of 460 mg⋅min/L. With increasing exposure to chlorine, it can be observed that in the red region, the concentration of gyrA remained stable or even increased rather than continuously decreased, which is consistent with the FCM results. The concentration of gyrA was negligible at higher exposures (1700 mg⋅min/L), presumably due to further oxidative damage of the target gene. The gyrA gene abundance showed a similar trend to the FCM method: (i) a strong reduction of concentration during the initial exposure stage, and (ii) a relatively stable period from 16 to 76 h of exposure.
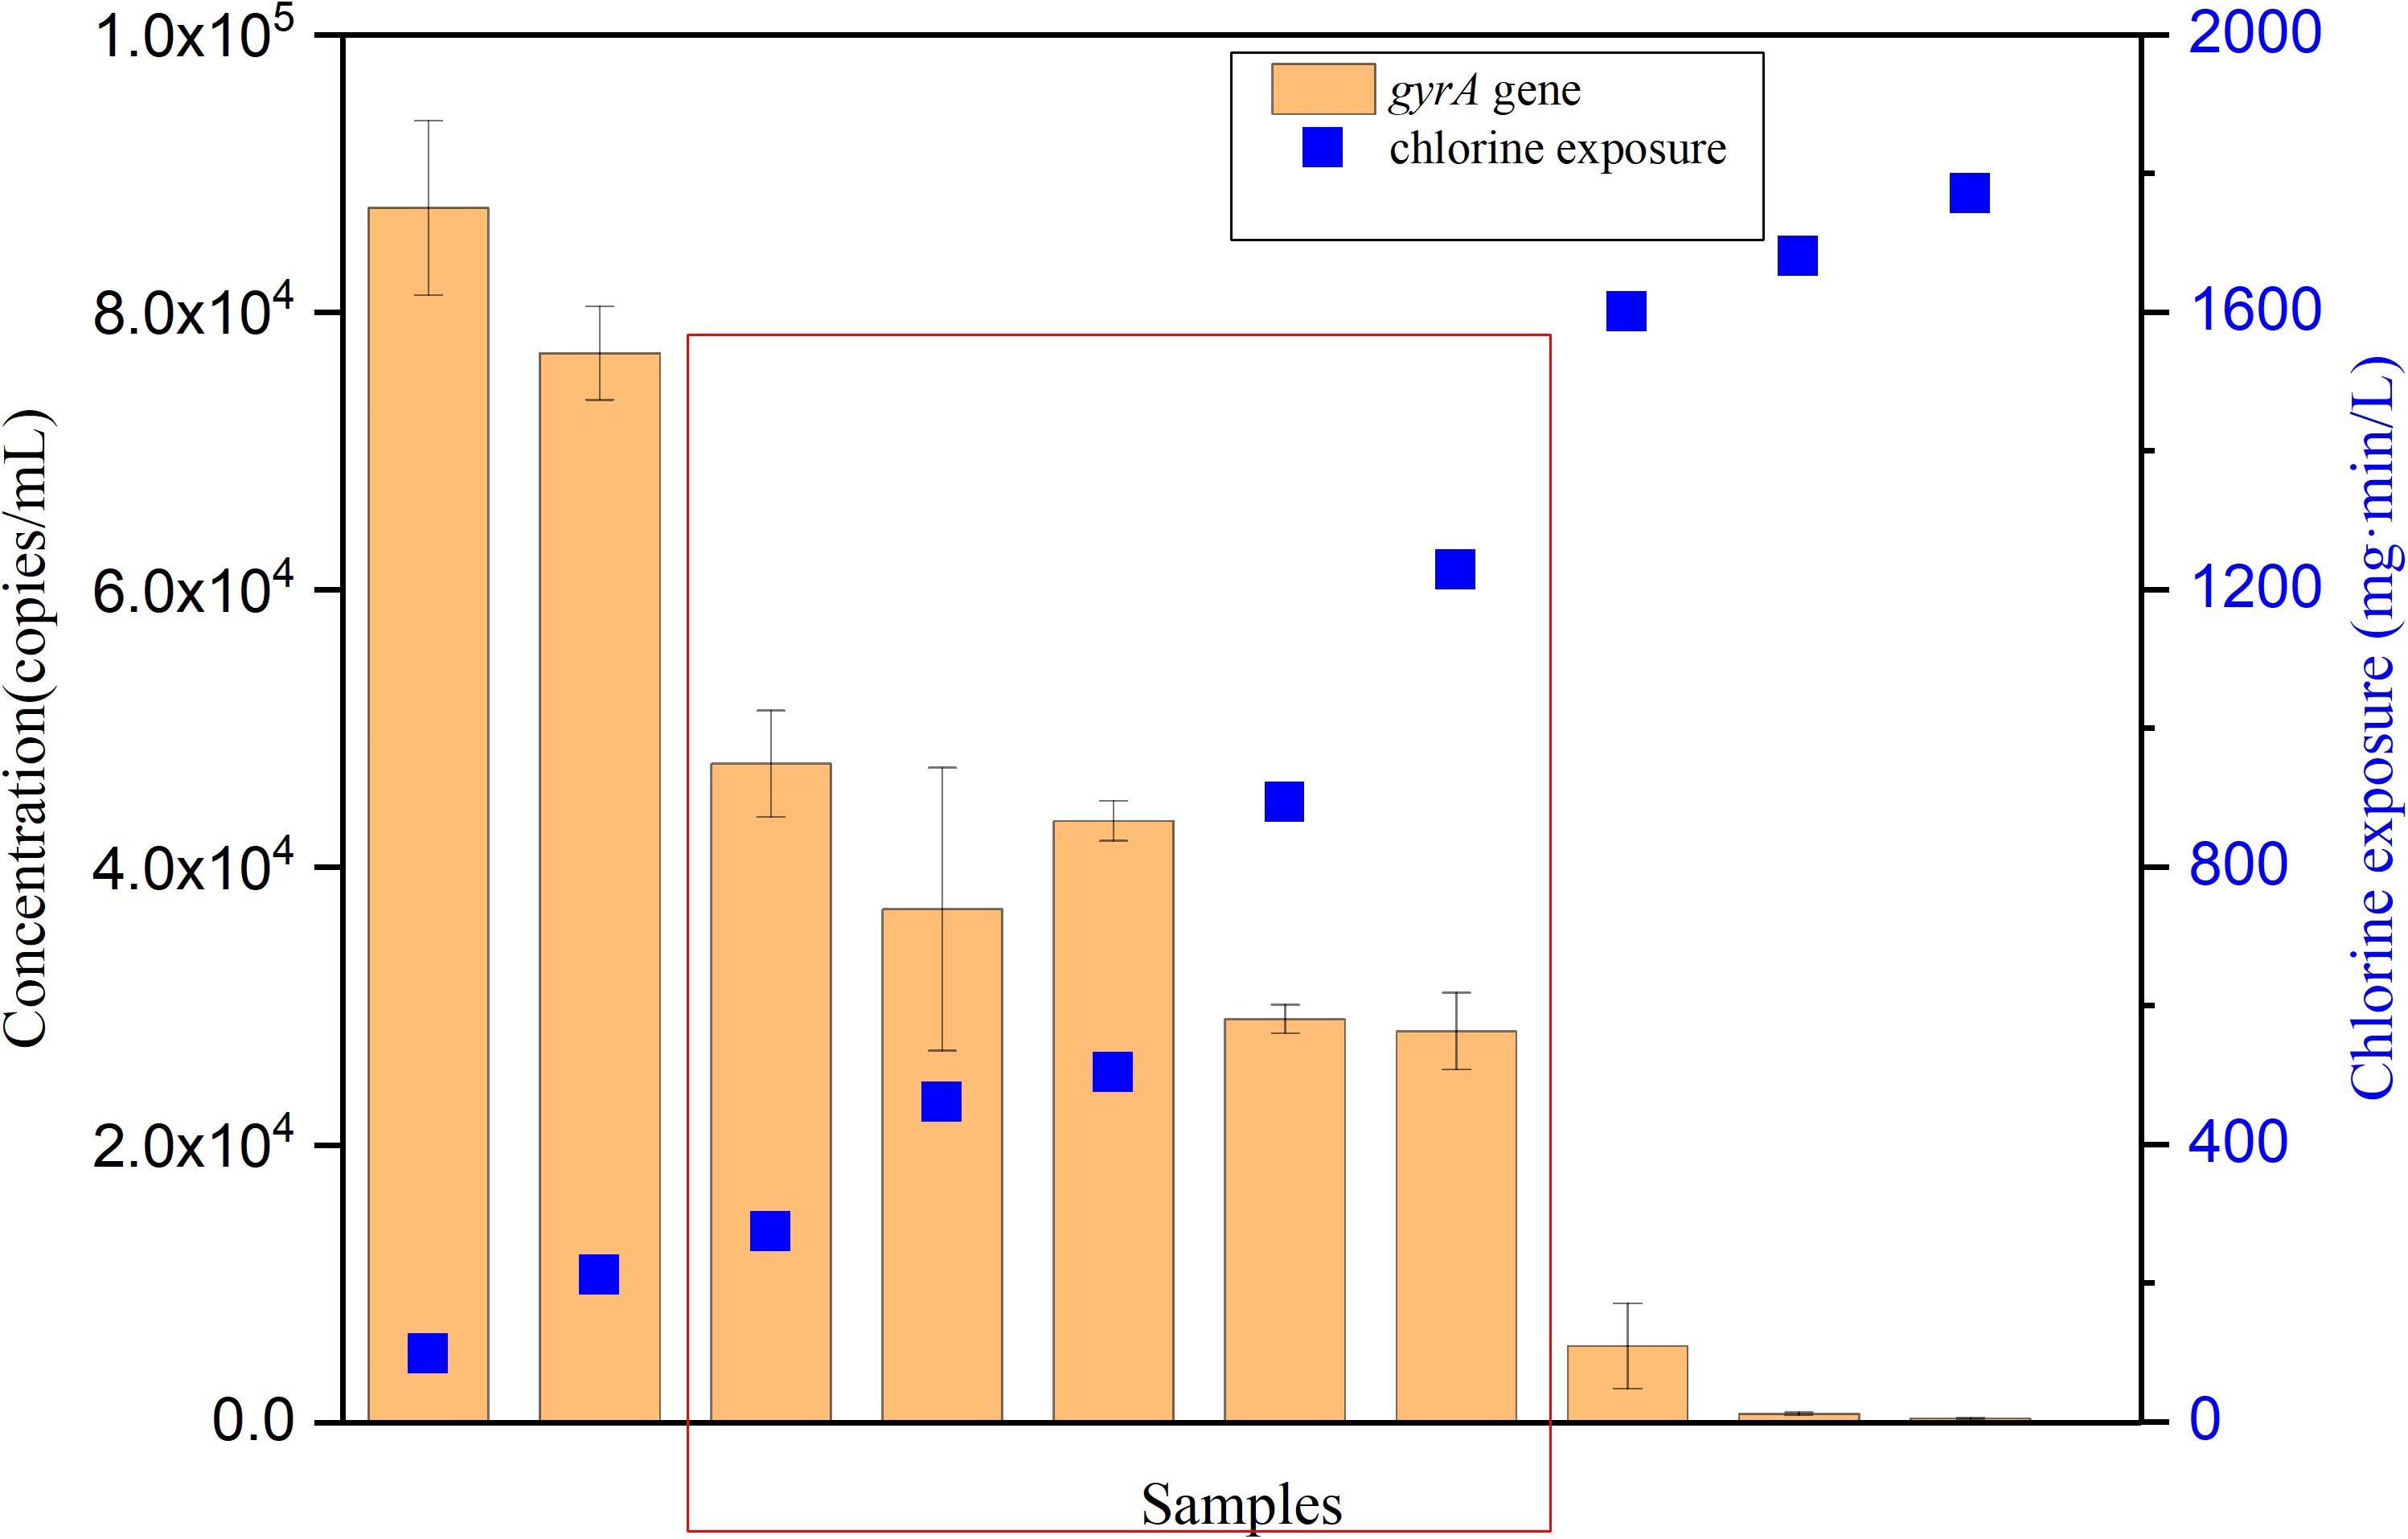
FIGURE 5. The variation tendency of gyrA gene with increasing chlorine exposure in the simulated low AOC medium systems. Red region indicates a relative stable period of gyrA gene during chlorine disinfection. Error bars indicate standard deviation of triplicate measurements.
Kinetics of Chlorine Disinfection
In the simulated drinking water system with a constant concentration of 0.3 ± 0.05 mg/L-Cl, the kinetics of P. aeruginosa inactivation can be characterized by three stages (Figure 6). During the initial chlorine exposure, between 0 and 270 mg⋅min/L of [Ct], the first stage led to 2.5-log removal of live bacteria. The ratio of inactivation kinetics decreased strongly with a slope of 8.7 × 10⁻³ L/(mg⋅min). This indicated that most of the cells were heavily damaged or lysed. For 270 < [Ct] < 1200 mg⋅min/L, a plateau was reached. The slope of the second stage [3.0 × 10⁻⁴ L/(mg⋅min)] was much lower than that of the first stage. The kinetic change indicated development of chlorine resistance in bacterial community. For the higher [Ct] values, the third stage [2.7 × 10⁻³ L/(mg⋅min)] showed a slight decay again with further deterioration of the environment. However, the slope [k] of the third stage is lower than that of the first stage.
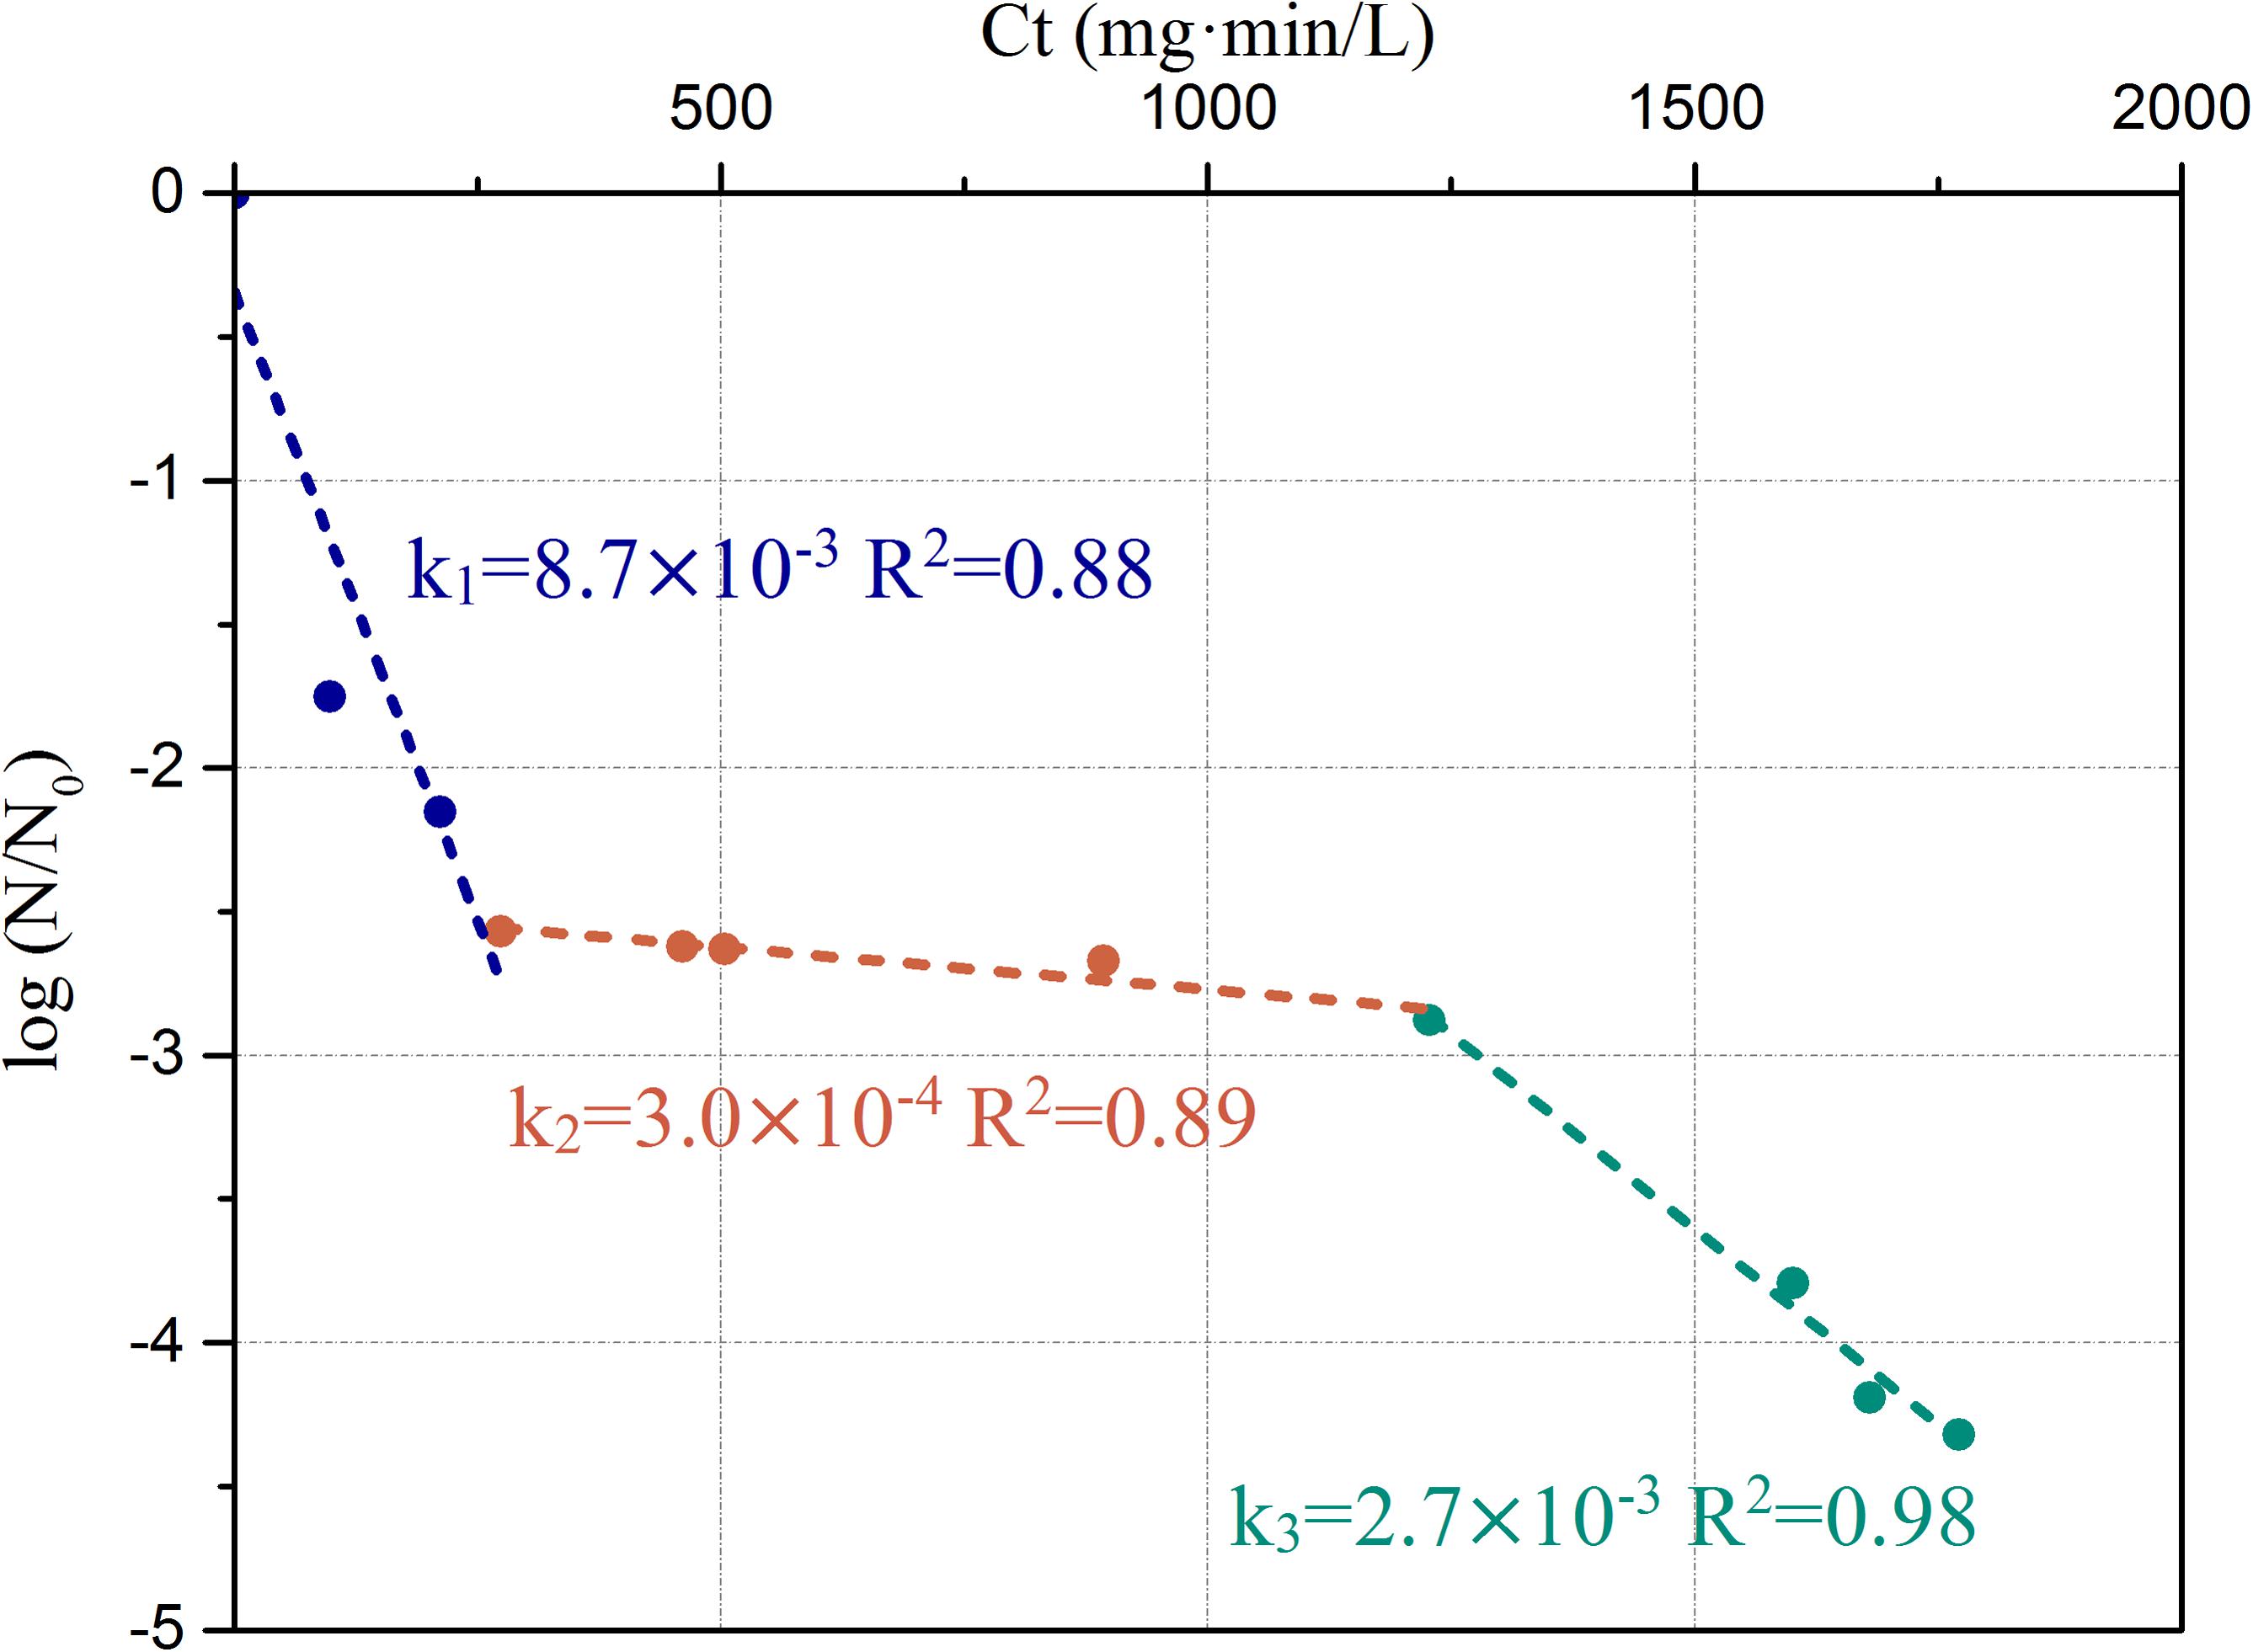
FIGURE 6. Chlorine inactivation kinetics of P. aeruginosa in the simulated low AOC medium systems. The slopes and corresponding R2-value are labeled on the figure.
Antibiotic Resistance
The sensitivity of P. aeruginosa to different antibiotics was estimated during the long-term chlorine exposure. The antibiotic resistance of P. aeruginosa changed with increasing disinfectant exposure time. Table 1 lists the diameter of the inhibition zone and antibiotic sensitivity profiles of P. aeruginosa at the different exposure times to 0.3 mg/L chlorine. The experimental results showed the selection of quinolone-resistant P. aeruginosa in the system treated with chlorine. Specifically, P. aeruginosa cells developed resistance to ciprofloxacin and norfloxacin after 52 h of exposure. However, after 64 h, all of the cells had already lost their cultivability.
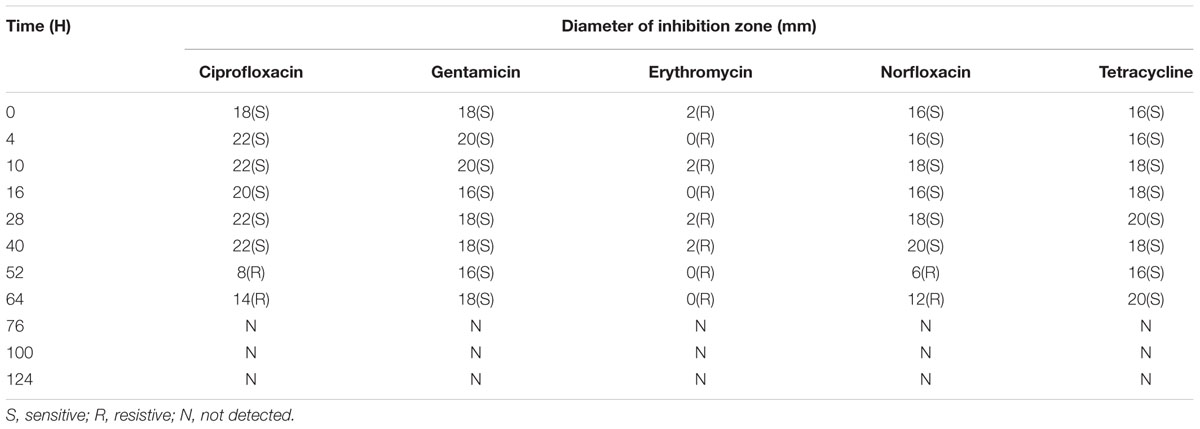
TABLE 1. Diameter of inhibition zone and sensitivity of P. aeruginosa to different antibiotics at different exposure time during long-term exposure to 0.3 mg/L chlorine.
Discussion
Chlorination is the most common used disinfection for the bacteriological quality control of drinking water distribution systems. To ensure the water quality, residual disinfections were required to remain during distribution in some countries. Previous studies have already confirmed insufficient chlorine levels could result in regrowth bacteria in chlorinated systems (Niquette et al., 2001; Gillespie et al., 2014). However, the microorganisms respond to inadequate chlorinated water in low AOC medium for long-term exposure, which was not previously possible. In the present study, application of FCM combined with different fluorescent stains (SGI and SGI/PI) was used to rapidly assess not only the effects of disinfection, but also changes in the bacteria due to suboptimal chlorine levels in low AOC medium (less than 0.50 mg/L). FCM in combination with SGI and PI is a highly conservative method that distinguishes between viable and non-viable cells based on membrane integrity (Ramseier et al., 2011). For instance, Berney et al. (2008) showed the last viability indicator was the membrane integrity when Escherichia coli was exposed to UV-A disinfection. Our results showed that substantial inactivation of bacteria was found when free chlorine levels reached 0.47 mg/L, which is consistent with an earlier report (Gillespie et al., 2014).
In the current study, changes in cell membrane permeability and DNA damage during chlorine exposure were reflected by FCM analysis. Furthermore, flow cytometric TCC fingerprints demonstrated considerable damage to DNA at a specific chlorine dose. Similar TCC and ICC fingerprint results were observed during ozonation of E. coli (Lee et al., 2016). Comparison between TCC and ICC fingerprints provided evidence that membrane permeability occurred prior to DNA damage. Such membrane damage would lead to considerable release of ATP from bacteria (Nescerecka et al., 2016b). Francisque et al. (2009) also found that a residual chlorine level of less than 0.3 mg/L was insufficient to inhibit bacterial growth. This is most likely due to the cells being partially damaged and/or developing resistance to chlorine. In addition, the presence of an appropriate amount of nutrients available in this system provides important support for cell regrowth. Meier and Bendinger (2016) found an elevated nutrient condition in water could increase the regrowth of P. aeruginosa after chlorination. A free residual chlorine level ≥ 0.3 mg/L should be maintained at the exit of the water treatment plant (USEPA, 1989; WHO, 1997). Based on the results of cellular changes of P. aeruginosa during the chlorination process, a free chlorine concentration of 0.3 mg/L was chosen for the following long-term exposure experiments. It is important to note that water quality parameters including pH and temperature (constant in this study) could influence disinfection efficacy (Meier and Bendinger, 2016). Biofilms occur usually in surfaces which are in contact with water even disinfectant residual water. The formation of biofilm will protect the bacteria from chlorine disinfection (Pintar and Slawson, 2003).
Combination FCM and qPCR methods to reveal temporal changes of bacterial cells during long-term exposure to constant inadequate chlorine concentration in low AOC medium. Overall, the chlorination of P. aeruginosa in low AOC medium could be characterized by three stages (Figure 6). The rate of inactivation of the initial stage was relatively fast, followed by a stable plateau stage and then finally damaged as indicated by a lower slope. The first two stages have been reported in previous studies during disinfection of Mycobacterium avium (Luh and Marinas, 2007) and chlorination of drinking water (Ramseier et al., 2011). Compared to the two stages of disinfection in previous studies, our results showed a more complex inactivation mechanism. This may be attributed to the longer chlorine exposure time than in previous reports. Meanwhile, the dose of chlorination applied here is relatively low compared to previous studies. Such long-term exposure to low residual chlorine revealed subtle changes at the cellular level. Furthermore, free chlorine and AOC are the two main factors regulating the bacterial regrowth in drinking water distribution systems where chlorine is applied as a disinfectant (Liu et al., 2015). Here we argue that a more detailed inactivation mechanism was revealed partly due to the fact free chlorine was the only influencing factor for the inactivation kinetics since a constant level of AOC was applied in the present system. To the best of our knowledge, this is the first demonstration of three stages of inactivation kinetics for P. aeruginosa with chlorine disinfection. The results demonstrated a selection of chlorine resistant cells during long-term exposure. Similar findings were reported in which chlorine-tolerant microbes were selected from chlorinated water (Ridgway and Olson, 1982; Shrivastava et al., 2004; Chiao et al., 2014). Compared to previous studies, a relatively low rate constant of 99% inactivation was observed in this study (Table 2). Culture-dependent methods applied in previous studies may lead to significant underestimation of bacterial counts when bacteria enter the “VBNC” state, resulting in a higher inactivation rate constant. Various combinations of treatments (exposure time and concentration of chlorine) may result in different inactivation kinetics even at the same [Ct] value. It has previously been demonstrated that a higher concentration of chlorine with a shorter exposure time is more beneficial for inactivation (Huang et al., 2011). In our low AOC medium system, P. aeruginosa may grow attached to surface and formed the biofilms. The biofilms with the extracellular polymeric substance (EPS) could reduce efficiency of chlorine disinfection and also lead to small inactivation rate constants (Liu et al., 2016; Shen et al., 2016). Overall, the results showed that P. aeruginosa could resist a longer exposure time with a lower dose of chlorine. It is thus inferred that long-term storage of water with residual chlorine may be advantageous for the prevalence of chlorine-resistant bacteria. To avoid this problem, such as decreasing storage times or flush 30 s tap water before first use long-term storage of water are required.
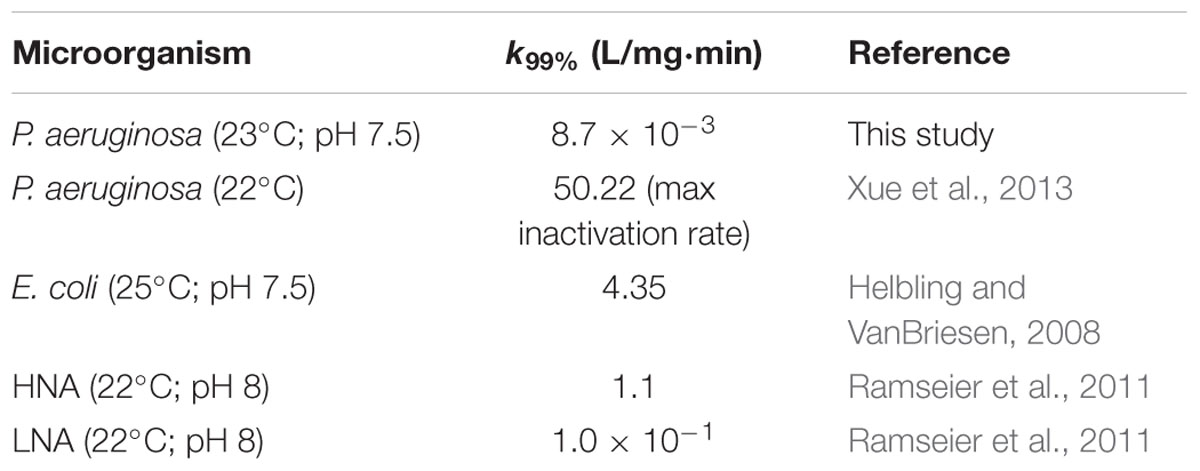
TABLE 2. The rate constants k to achieve 99% inactivation of different microorganisms with chlorine disinfection.
Previous studies have revealed the selection pressure of chlorination for antibiotic-resistance bacteria (Shrivastava et al., 2004; Huang et al., 2011), and our results further indicated that long-term exposure with low chlorine concentration (simulated stagnation) could elevate resistance of P. aeruginosa to ciprofloxacin and norfloxacin, which is supported by a previous study demonstrating that chlorination can cause enrichment of antibiotic resistance bacteria and antibiotic resistance genes in the drinking water (Shi et al., 2013). However, after 64 h, all of the cells had already lost their cultivability and entered the “VBNC” state. Nevertheless, it was noted that long-term chlorination selected antibiotic-resistant P. aeruginosa strains. Hence, future research should concentrate on avoiding antibiotic-resistance microbes during chlorination, which is very important for a safe drinking water network.
Heterotrophic plate counts is considered to be a conventional parameter used for monitoring microbial inactivation during chlorination. However, the culture-dependent parameter is not suitable for microbial quality assessment in drinking water distribution network with residual chlorine (Nescerecka et al., 2014). Considerable underestimation of the bacterial population was detected when compared to the culture-independent methods (FCM and qPCR) (Chiao et al., 2014). In the current study, Figure 3 shows a similar conclusion whereby the HPC counts were lower compared with the FCM counts, and the gap between the HPC and FCM counts became greater with increasing chlorine concentration. Similar patterns were reported for E. coli exposed to chlorine and UV-A light (Berney et al., 2006; Wang et al., 2010a). This may be due to the fact that some bacteria exposed to severe environmental stress (e.g., high chlorine concentration) lose the capacity for growth but retain their membrane integrity and enzymatic activity (Vital et al., 2012). When bacteria enter the VBNC state, remaining metabolically active and posing a potential threat to water quality (Bosshard et al., 2009; Wang et al., 2010a; Chiao et al., 2014), the traditional HPC method can no longer correctly enumerate the number of viable cells (Liu et al., 2015).
Among the different cell viability testing methods applied in this study, FCM and qPCR data showed clear correlations (Supplementary Figure S3). A significant linear correlation (R2 = 0.9) between qPCR (specific gene concentrations) and FCM (intact cell counts) methods was observed, demonstrating the two methods are complementary tools to characterize and monitor the efficiency of the chlorination processes. This result is consistent with a previous study that showed good correlation when comparing FCM with PMA-qPCR (Zacharias et al., 2015). Furthermore, FCM has been successfully applied to assess disinfection efficacy on bacteria (Ramseier et al., 2011; Nescerecka et al., 2014; Lee et al., 2016). Hence, it is evident that FCM is a proper tool in assessing accurate changes of bacterial cells during disinfection of drinking water.
Conclusion
1. High chlorine exposure (0.47 mg/L, 1 h) could damage not only membrane integrity (ICC fingerprint) but also cellular DNA (TCC fingerprint), and DNA damage falls behind loss of membrane integrity. P. aeruginosa cells entered “VBNC” state under chlorine stress, which is not detectable using culture-dependent methods.
2. Free residual chlorine concentrations below 0.3 mg/L were found to reactivate P. aeruginosa in the low AOC medium system. Long time storage of water with insufficient chlorine levels may develop thriving bacteria that in turn influence water quality.
3. The long-term chlorine disinfection kinetics of P. aeruginosa shows three stages: an initial stage with relatively fast inactivation rate (k = 8.7 × 10⁻³), followed by a stationary stage (k = 3.0 × 10⁻⁴) and then a final stage with a slower inactivation rate than the initial stage (k = 2.7 × 10⁻³).
4. Long-term chlorination selected the antibiotic-resistant P. aeruginosa, although all antibiotic-resistant bacteria could be inactivated with subsequent continuous exposure to chlorine.
Author Contributions
YW and MB designed and planned the experiments. GM and YS performed the experiments. GM, YS, YW, and MB analyzed the data. GM, YW, and MB wrote the manuscript.
Funding
The authors are grateful for the financial support from the National Key Basic Research Development Program (2015CB459000), National Science Foundation (31322012, 31670498, and 31570128), and National Program for Support of Top-notch Young Professionals.
Conflict of Interest Statement
The authors declare that the research was conducted in the absence of any commercial or financial relationships that could be construed as a potential conflict of interest.
Supplementary Material
The Supplementary Material for this article can be found online at: https://www.frontiersin.org/articles/10.3389/fmicb.2018.00879/full#supplementary-material
FIGURE S1 | Flow cytometric dot plots of Pseudomonas aeruginosa with SYBR Green I and stained with propidium iodide. (A) 0.38 mg/L chlorine without quenching solvent (1.27 ± 0.07 × 10⁴ cells/mL). (B) 0.38 mg/L chlorine with thiosulfate sodium quenching solvent (0.9 ± 0.03 × 10⁴ cells/mL).
FIGURE S2 | Calibration curve of quantitative PCR with plasmid containing gyrA gene. The curve represents a range from 103 to 109 copies per reaction. Error bars show the standard deviation on triplicate measurements.
FIGURE S3 | Comparison of the various culture-independent methods during chlorination. Clear correlations (R2 = 0.9) were observed between intact cells (FCM) and gyrA gene (qPCR).
References
Berney, M., Hammes, F., Bosshard, F., Weilenmann, H. U., and Egli, T. (2007). Assessment and interpretation of bacterial viability by using the live/dead baclight kit in combination with flow cytometry. Appl. Environ. Microbiol. 73, 3283–3290. doi: 10.1128/AEM.02750-06
Berney, M., Vital, M., Huelshoff, I., Weilenmann, H. U., Egli, T., and Hammes, F. (2008). Rapid, cultivation-independent assessment of microbial viability in drinking water. Water Res. 42, 4010–4018. doi: 10.1016/j.watres.2008.07.017
Berney, M., Weilenmann, H. U., and Egli, T. (2006). Flow-cytometric study of vital cellular functions in Escherichia coli during solar disinfection (SODIS). Microbiology 152, 1719–1729. doi: 10.1099/mic.0.28617-0
Besmer, M. D., Sigrist, J. A., Props, R., Buysschaert, B., Mao, G. N., Boon, N., et al. (2017). Laboratory-scale simulation and real-time tracking of a microbial contamination event and subsequent shock-chlorination in drinking water. Front. Microbiol. 8:1900. doi: 10.3389/fmicb.2017.01900
Besmer, M. D., Weissbrodt, D. G., Kratochvil, B. E., Sigrist, J. A., Weyland, M. S., and Hammes, F. (2014). The feasibility of automated online flow cytometry for in-situ monitoring of microbial dynamics in aquatic ecosystems. Front. Microbiol. 5:265. doi: 10.3389/fmicb.2014.00265
Bosshard, F., Berney, M., Scheifele, M., Weilenmann, H. U., and Egli, T. (2009). Solar disinfection (SODIS) and subsequent dark storage of Salmonella typhimurium and Shigella flexneri monitored by flow cytometry. Microbiology 155, 1310–1317. doi: 10.1099/mic.0.024794-0
Chiao, T. H., Clancy, T. M., Pinto, A., Xi, C., and Raskin, L. (2014). Differential resistance of drinking water bacterial populations to monochloramine disinfection. Environ. Sci. Technol. 48, 4038–4047. doi: 10.1021/es4055725
Delaedt, Y., Daneels, A., Declerck, P., Behets, J., Ryckeboer, J., Peters, E., et al. (2008). The impact of electrochemical disinfection on Escherichia coli and Legionella pneumophila in tap water. Microbiol. Res. 163, 192–199. doi: 10.1016/j.micres.2006.05.002
Douterelo, I., Boxall, J. B., Deines, P., Sekar, R., Fish, K. E., and Bigge, C. A. (2014). Methodological approaches for studying the microbial ecology of drinking water distribution systems. Water Res. 65, 134–156. doi: 10.1016/j.watres.2014.07.008
Ellis, B., Butterfield, P., Jones, W. L., McFeters, G. A., and Camper, A. K. (2000). Effects of carbon source, carbon concentration, and chlorination on growth related parameters of heterotrophic biofilm bacteria. Microb. Ecol. 38, 330–347. doi: 10.1007/s002489901003
Francisque, A., Rodriguez, M., Miranda-Moreno, L. F., Sadiq, R., and Proulx, F. (2009). Modeling heterotrophic bacteria counts in a water distribution system. Water Res. 43, 1075–1087. doi: 10.1016/j.watres.2008.11.030
Gillespie, S., Lipphaus, P., Green, J., Parsons, S., Weir, P., Juskowiak, K., et al. (2014). Assessing microbiological water quality in drinking water distribution systems with disinfectant residual using flow cytometry. Water Res. 65, 224–234. doi: 10.1016/j.watres.2014.07.029
Hammes, F., Berney, M., Wang, Y., Vital, M., Koster, O., and Egli, T. (2008). Flow-cytometric total bacterial cell counts as a descriptive microbiological parameter for drinking water treatment processes. Water Res. 42, 269–277. doi: 10.1016/j.watres.2007.07.009
Helbling, D. E., and VanBriesen, J. M. (2008). Continuous monitoring of residual chlorine concentrations in response to controlled microbial intrusions in a laboratory-scale distribution system. Water Res. 42, 3162–3172. doi: 10.1016/j.watres.2008.03.009
Huang, J. J., Hu, H. Y., Tang, F., Li, Y., Lu, S. Q., and Lu, Y. (2011). Inactivation and reactivation of antibiotic-resistant bacteria by chlorination in secondary effluents of a municipal wastewater treatment plant. Water Res. 45, 2775–2781. doi: 10.1016/j.watres.2011.02.026
Jegatheesan, V., Kastl, G., Fisher, I., Chandy, J., and Angles, M. (2004). Modeling bacterial growth in drinking water: effect of nutrients. J. Am. Water Works Assoc. 96, 129–141. doi: 10.1002/j.1551-8833.2004.tb10634.x
Jjemba, P. K., Weinrich, L. A., Cheng, W., Giraldo, E., and LeChevallier, M. W. (2010). Regrowth of potential opportunistic pathogens and algae in reclaimed-water distribution systems. Appl. Environ. Microbiol. 76, 4169–4178. doi: 10.1128/AEM.03147-09
Kureishi, A., Diver, J. M., Beckthold, B., Schollaardt, T., and Bryan, L. E. (1994). Cloning and nucleotide sequence of Pseudomonas aeruginosa DNA gyrase gyrA gene from strain PAO1 and quinolone-resistant clinical isolates. Antimicrob. Agents Chemother. 38, 1944–1952. doi: 10.1128/AAC.38.9.1944
Lautenschlager, K., Hwang, C., Liu, W. T., Boon, N., Koster, O., Vrouwenvelder, H., et al. (2013). A microbiology based multi-parametric approach towards assessing biological stability in drinking water distribution networks. Water Res. 47, 3015–3025. doi: 10.1016/j.watres.2013.03.002
Lee, Y., Imminger, S., Czekalski, N., von Gunten, U., and Hammes, F. (2016). Inactivation efficiency of Escherichia coli and autochthonous bacteria during ozonation of municipal wastewater effluents quantified with flow cytometry and adenosine tri-phosphate analyses. Water Res. 101, 617–627. doi: 10.1016/j.watres.2016.05.089
Levy, K., Anderson, L., Robb, K. A., Cevallos, W., Trueba, G., and Eisenberg, J. N. S. (2014). Household effectiveness vs. laboratory efficacy of point-of-use chlorination. Water Res. 54, 69–77. doi: 10.1016/j.watres.2014.01.037
Liu, S., Gunawan, C., Barraud, N., Rice, S. A., Harry, E. J., and Amal, R. (2016). Understanding, monitoring, and controlling biofilm growth in drinking water distribution systems. Environ. Sci. Technol. 50, 8954–8976. doi: 10.1021/acs.est.6b00835
Liu, X., Wang, J., Liu, T., Kong, W., He, X., Jin, Y., et al. (2015). Effects of assimilable organic carbon and free chlorine on bacterial growth in drink water. PLoS One 10:e0128825. doi: 10.1371/journal.pone.0128825
Luh, J., and Marinas, B. J. (2007). Inactivation of Mycobacterium avium with free chlorine. Environ. Sci. Technol. 41, 5096–5102. doi: 10.1021/es0630801
McDaniels, A. E., Wymer, L., Rankin, C., and Haugland, R. (2005). Evaluation of quantitative real time PCR for the measurement of Helicobacter pylori at low concentrations in drinking water. Water Res. 39, 4808–4816. doi: 10.1016/j.watres.2005.09.030
Meier, T., and Bendinger, B. (2016). Survival of pathogens in drinking water plumbing systems: impact factors and sanitation options. Water Sci. Technol. 16, 931–941. doi: 10.2166/ws.2016.040
Mena, K. D., and Gerba, C. P. (2009). Risk assessment of Pseudomonas aeruginosa in water. Rev. Environ. Contam. Toxicol. 201, 71–115. doi: 10.1007/978-1-4419-0032-6_3
Mendis, N., Lin, Y. R., and Faucher, S. P. (2014). Comparison of virulence properties of Pseudomonas aeruginosa exposed to water and grown in rich broth. Can. J. Microbiol. 60, 777–881. doi: 10.1139/cjm-2014-0519
Miettinen, I., Vartianen, T., and Martikainen, P. J. (1999). Determination of assimilable organic carbon in humus rich drinking waters. Water Res. 33, 2277–2282. doi: 10.1016/S0043-1354(98)00461-8
Nescerecka, A., Hammes, F., and Juhna, T. (2016a). A pipeline for developing and testing staining protocols for flow cytometry, demonstrated with SYBR Green I and propidium iodide viability staining. J. Microbiol. Methods 131, 172–180. doi: 10.1016/j.mimet.2016.10.022
Nescerecka, A., Juhna, T., and Hammes, F. (2016b). Behavior and stability of adenosine triphosphate (ATP) during chlorine disinfection. Water Res. 101, 490–497. doi: 10.1016/j.watres.2016.05.087
Nescerecka, A., Rubulis, J., Vital, M., Juhna, T., and Hammes, F. (2014). Biological instability in a chlorinated drinking water distribution network. PLoS One 9:e96354. doi: 10.1371/journal.pone.0096354
Niquette, P., Servais, P., and Savoir, R. (2001). Bacterial dynamics in the drinking water distribution system of Brussels. Water Res. 35, 675–682. doi: 10.1016/S0043-1354(00)00303-1
Oh, H., Lee, J., Kim, K., Kim, J., Choung, Y., and Park, J. (2009). A novel laboratory cultivation method to examine antibiotic-resistance-related microbial risks in urban water environments. Water Sci. Technol. 59, 347–352. doi: 10.2166/wst.2009.857
Phe, M. H., Dossot, M., and Block, J. C. (2004). Chlorination effect on the fluorescence of nucleic acid staining dyes. Water Res. 38, 3726–3737. doi: 10.1016/j.watres.2004.05.018
Pintar, K. D., and Slawson, R. M. (2003). Effect of temperature and disinfection strategies on ammonia-oxidizing bacteria in a bench-scale drinking water distribution system. Water Res. 37, 1805–1817. doi: 10.1016/S0043-1354(02)00538-9
Prest, E. I., Hammes, F., Kotzsch, S., van Loosdrecht, M. C. M., and Vrouwenwelder, J. S. (2013). Monitoring microbiological changes in drinking water systems using a fast and reproducible flow cytometric method. Water Res. 47, 7131–7142. doi: 10.1016/j.watres.2013.07.051
Prest, E. I., Hammes, F., Kotzsch, S., van Loosdrecht, M. C. M., and Vrouwenwelder, J. S. (2016). Biological stability of drinking water: controlling factors, methods, and challenges. Front. Microbiol. 7:45. doi: 10.3389/fmicb.2016.00045
Proctor, C. R., and Hammes, F. (2015). Drinking water microbiology- from measurement to management. Curr. Opin. Microbiol. 33, 87–94. doi: 10.1016/j.copbio.2014.12.014
Ramseier, M. K., von Gunten, U., Freihofer, P., and Hammes, F. (2011). Kinetics of membrane damage to high (HNA) and low (LNA) nucleic acid bacterial clusters in drinking water by ozone, chlorine, chlorine dioxide, monochloramine, ferrate (VI), and permanganate. Water Res. 45, 1490–1500. doi: 10.1016/j.watres.2010.11.016
Ridgway, H. F., and Olson, B. H. (1982). Chlorine resistance patterns of bacteria from two drinking water distribution systems. Appl. Environ. Microbiol. 44, 972–987.
Schwartz, T., Volkmann, H., Kirchen, S., Kohnen, W., Schön-Hölz, K., Jansen, B., et al. (2006). Real-time PCR detection of Pseudomonas aeruginosa in clinical and municipal wastewater and genotyping of the ciprofloxacin-resistant isolates. FEMS Microbiol. Ecol. 57, 158–167. doi: 10.1111/j.1574-6941.2006.00100.x
Shen, Y., Huang, C. H., Monroy, G. L., Janjaroen, D., Derlon, N., Lin, J., et al. (2016). Response of simulated drinking water biofilm mechanical and structural properties to long-term disinfectant exposure. Environ. Sci. Technol. 50, 1779–1787. doi: 10.1021/acs.est.5b04653
Shi, P., Jia, S. Y., Zhang, X. X., Zhang, T., Cheng, S. P., and Lim, A. M. (2013). Metagenomic insights into chlorination effects on microbial antibiotic resistance in drinking water. Water Res. 47, 111–120. doi: 10.1016/j.watres.2012.09.046
Shrivastava, R., Upreti, R. K., Jain, S. R., Prasad, K. N., Seth, P. K., and Chaturvedia, U. C. (2004). Suboptimal chlorine treatment of drinking water leads to selection of multidrug-resistant Pseudomonas aeruginosa. Ecotoxicol. Environ. Saf. 58, 277–283. doi: 10.1016/S0147-6513(03)00107-6
Silva, M. E., Filho, I. C., Endo, E. H., Nakamura, C. V., Ueda-Nakamura, T., and Filho, B. P. (2008). Characterisation of potential virulence markers in Pseudomonas aeruginosa isolated from drinking water. Antonie Van Leeuwenhoek 93, 323–334. doi: 10.1007/s10482-007-9209-8
Tsai, Y. P. (2005). Simulation of biofilm formation at different assimilable organic carbon concentrations under lower flow velocity condition. J. Basic Microbiol. 45, 475–485. doi: 10.1002/jobm.200510583
USEPA (1989). 40 CRF parts 141 and 142 drinking water; national primary water rules and regulations; filtration, disinfection, turbidity, Giardia lamblia, viruses, Legionella and heterotrophic bacteria final rule. United States Environmental Protection Agency (USEPA). Fed. Regist. 54, 27486–27541.
Van der Kooij, D., Oranje, J. P., and Hijnen, W. A. (1982). Growth of Pseudomonas aeruginosa in tap water in relation to utilization of substrates at concentrations of a few micrograms per liter. Appl. Environ. Microbiol. 44, 1086–1095.
Vital, M., Dignum, M., Magic-Knezev, A., Ross, P., Rietveld, L., and Hammes, F. (2012). Flow cytometry and adenosine triphosphate analysis: alternative possibilities to evaluate major bacteriological changes in drinking water treatment and distribution systems. Water Res. 46, 4665–4676. doi: 10.1016/j.watres.2012.06.010
Wang, Y., Claeys, L., van der Ha, D., Verstraete, W., and Boon, N. (2010a). Effects of chemically and electrochemically dosed chlorine on Escherichia coli and Legionella beliardensis assessed by flow cytometry. Appl. Microbiol. Biotechnol. 87, 331–341. doi: 10.1007/s00253-010-2526-2
Wang, Y., Hammes, F., De Roy, K., Verstraete, W., and Boon, N. (2010b). Past, present and future applications of flow cytometry in aquatic microbiology. Trends Biotechnol. 28, 416–424. doi: 10.1016/j.tibtech.2010.04.006
Wen, G., Kotzsch, S., Vital, M., Egli, T., and Ma, J. (2015). BioMig-A method to evaluate the potential release of compounds from and the formation of biofilms on polymeric materials in contact with drinking water. Environ. Sci. Technol. 49, 11659–11669. doi: 10.1021/acs.est.5b02539
WHO (1997). Guidelines for Drinking-Water Quality in Surveillance and Control of Community Supplies, 2nd Edn, Vol. 3. Geneva: World Health Organization.
Xue, Z., Hessler, C. M., Panmanee, W., Hassett, D. J., and Seo, Y. (2013). Pseudomonas aeruginosa inactivation mechanism is affected by capsular extracellular polymeric substances reactivity with chlorine and monochloramine. FEMS Microbiol. Ecol. 83, 101–111. doi: 10.1111/j.1574-6941.2012.01453.x
Keywords: chlorination, regrowth, antibiotic-resistant, Pseudomonas aeruginosa, low AOC medium
Citation: Mao G, Song Y, Bartlam M and Wang Y (2018) Long-Term Effects of Residual Chlorine on Pseudomonas aeruginosa in Simulated Drinking Water Fed With Low AOC Medium. Front. Microbiol. 9:879. doi: 10.3389/fmicb.2018.00879
Received: 11 May 2017; Accepted: 16 April 2018;
Published: 03 May 2018.
Edited by:
Hongyue Dang, Xiamen University, ChinaReviewed by:
M. Jahangir Alam, University of Houston, United StatesPierangela Cristiani, Ricerca Sul Sistema Energetico, Italy
Copyright © 2018 Mao, Song, Bartlam and Wang. This is an open-access article distributed under the terms of the Creative Commons Attribution License (CC BY). The use, distribution or reproduction in other forums is permitted, provided the original author(s) and the copyright owner are credited and that the original publication in this journal is cited, in accordance with accepted academic practice. No use, distribution or reproduction is permitted which does not comply with these terms.
*Correspondence: Mark Bartlam, bartlam@nankai.edu.cn Yingying Wang, wangyy@nankai.edu.cn