 Shuai Peng
 Longxiang Liu
 Hongyu Zhao
 Hua Wang
 Hua Li1,2,3*
- 1College of Enology, Northwest A & F University, Yangling, China
- 2Shaanxi Engineering Research Center for Viti-Viniculture, Yangling, China
- 3Heyang Experimental and Demonstrational Stations for Grape, Weinan, China
The powerful Quantitative real-time PCR (RT-qPCR) was widely used to assess gene expression levels, which requires the optimal reference genes used for normalization. Oenococcus oeni (O. oeni), as the one of most important microorganisms in wine industry and the most resistant lactic acid bacteria (LAB) species to ethanol, has not been investigated regarding the selection of stable reference genes for RT-qPCR normalization under ethanol stress conditions. In this study, nine candidate reference genes (proC, dnaG, rpoA, ldhD, ddlA, rrs, gyrA, gyrB, and dpoIII) were analyzed to determine the most stable reference genes for RT-qPCR in O. oeni SD-2a under different ethanol stress conditions (8, 12, and 16% (v/v) ethanol). The transcript stabilities of these genes were evaluated using the algorithms geNorm, NormFinder, and BestKeeper. The results showed that dnaG and dpoIII were selected as the best reference genes across all experimental ethanol conditions. Considering single stress experimental modes, dpoIII and dnaG would be suitable to normalize expression level for 8% ethanol shock treatment, while the combination of gyrA, gyrB, and rrs would be suitable for 12% ethanol shock treatment. proC and gyrB revealed the most stable expression in 16% ethanol shock treatment. This study selected and validated for the first time the reference genes for RT-qPCR normalization in O. oeni SD-2a under ethanol stress conditions.
Introduction
Oenococcus oeni (O. oeni) is well known as the main starter of malolactic fermentation (MLF). Through the MLF process, O. oeni reduces the acidity naturally and improves the quality and stability of wine (Guzzo et al., 2000; Maicas et al., 2000; Mohedano Mde et al., 2014). However, the harsh environmental conditions of wine such as high ethanol concentration, low pH, and SO2, can often delay the growth of O. oeni and MLF process (G-Alegría et al., 2004; Olguín et al., 2015; Betteridge et al., 2017). Ethanol stress is generally considered as one of the main inhibitors of O. oeni growth in wine (Mendoza et al., 2017; Contreras et al., 2018). The strain O. oeni SD-2a is able to survive and grow in high ethanol conditions and shows strong MLF ability (Liu, 2002), however its ethanol stress response mechanism was still obscure.
Quantitative real-time PCR (RT-qPCR), one of the most common technologies for quantifying gene expression level, was often used to analyze the stress response to abiotic and biotic stresses in O. oeni (Beltramo et al., 2006; Olguín et al., 2010). It is characterized by high sensitivity, specificity, good reproducibility and low cost, and always used to confirm results obtained by microarrays or RNA-seq (Allison et al., 2006; Fang and Cui, 2011). The methods of presenting quantitative gene expression include the absolute quantification method and relative quantification method. When using relative quantification in RT-qPCR, the optimal reference genes are indispensable in order to normalize RT-qPCR data of target gene. The MIQE guidelines (Bustin et al., 2009) emphasized the fact that the discovery of one or multiple stably expressed reference genes were crucial for obtaining accurate gene expression data. Therefore, the selection and validation of reliable reference genes for each particular condition are essential to quantitative accuracy.
Several stress-related genes such as hsp18, citE, ctsR, clpP, ftsH, have been studied using RT-qPCR analysis in O. oeni under different stress conditions, however only one common reference gene, ldhD, was used for normalization (Bourdineaud et al., 2003; Beltramo et al., 2006; Olguín et al., 2009, 2010; Capozzi et al., 2010). Recently, some studies attempted to elucidate the mechanisms of the adaptation and tolerance of O. oeni under stress conditions through transcriptomic and proteomic analysis, in which RT-qPCR was applied to confirm transcriptomic analysis results using the multiple common reference genes for normalization (Olguín et al., 2015; Margalef-Català et al., 2016; Liu et al., 2017). However, in these studies, the evaluation of reference genes was not performed in advance. As so far, few studies for evaluation of reference genes have been reported in O. oeni (Supplementary Table 1). However, the selection and validation of reference genes for RT-qPCR normalization in O. oeni under ethanol conditions have not yet been reported.
In this study, nine genes, proC, rrs, dnaG, gyrA, ddlA, rpoA, gyrB, ldhD, and dpoIII, were selected as candidate reference genes. Besides the commonly used genes for transcript normalization in O. oeni such as ldhD, ddlA, and gyrB, we selected others genes based on literature review. The three most diffused algorithms (geNorm, NormFinder, and BestKeeper) were used to calculate the expression stability of the candidate genes and obtain the most stable reference genes. In addition, the optimal reference genes were tested to normalize the expression of one target gene (hsp18) under ethanol stress conditions. This work is hoping to provide a basis for future study on gene expression under ethanol conditions in O. oeni SD-2a and other lactic acid bacteria (LAB) species.
Materials and Methods
Bacterial Strain
Oenococcus oeni SD-2a was obtained from our own collection (College of Enology, Northwest A&F University, Yangling, China). This strain was previously isolated from Shandong province in China and was properly identified (Liu, 2002; Li et al., 2006). The strain O. oeni SD-2a has obtained patent protection (02123444.2) in China.
Growth Conditions
The O. oeni SD-2a was cultured at 28°C and pH 4.8 in three flasks with 100 mL FMATB broth, which contains glucose 5 g/L, D, L-malate 5 g/L, yeast extract 5 g/L, peptone 10 g/L, MgSO4 •7H2O 0.2 g/L, MnSO4 •4H2O 0.05 g/L, Cysteine/HCl 0.5 g/L, and tomato juice 250 mL (Li et al., 2009; Liu et al., 2017). The growth of cultures was monitored by measuring OD value using a spectrophotometer (Cary 60 UV-Vis, Agilent Technologies, USA). When cultures reached the mid-exponential phase (OD600nm≈1, 109 CFU/mL), they were completely mixed and split into three sterile flasks. Then the flasks were performed the shock treatment (ST) by adding with 8, 12 and 16% (v/v) ethanol, respectively. Bacterial samples were collected at time zero just before the addition of ethanol and then at one, 3 h after ethanol was added (Olguín et al., 2015). All assays above were performed in triplicate using independent cultures and incubated at 28°C and pH 4.8.
RNA Extraction and cDNA Synthesis
Cells were harvested by centrifugation at 10,000 × g for 5 min at 4°C, the supernatants were removed and the pellets were washed with 10 mM Tris-HCl prepared with diethylpyrocarbonate-treated water (DEPC), which were then frozen in liquid nitrogen and kept at −80°C until RNA extraction (Margalef-Català et al., 2016). Total RNA extractions were performed using the E.Z.N.A.™ Bacterial RNA Kit (Omega Bio-tek, USA) that includes a DNase treatment step. The quality of the RNA samples was checked on a 1% (w/v) agarose gel (HydraGene, USA). RNA purity was characterized with optical density (OD) 260/280 and 260/230 ratios. All samples passed quality control with the ratio OD260/280 between 1.9 and 2.2 and ratio OD260/230<2.0. RNA concentration was determined by BioDrop μLite Spectrophotometer (Tamar Laboratory Supplies Ltd., Cambridge, England).
The cDNA was synthesized using the RevertAid First Strand cDNA Synthesis kit (Thermo Scientific) as described by the manufacturer. At the end of the reaction, each sample was diluted 1:100 with nuclease-free water prior to the RT-qPCR analysis.
Candidate Reference Genes Primers Design
Primers of candidate reference genes and one target gene for RT-qPCR were designed using Primer Premier (version 5.0) and each has a length of about 20–25 bases, a G/C content of over 50% and a Tm of about 60°C (Beltramo et al., 2006). The primers were checked by gene-specific binding using the genome of O. oeni SD-2a (results not shown), which was also used to check exon-intron borders by matching the primers to their location. The primer sequences are listed in Table 1.
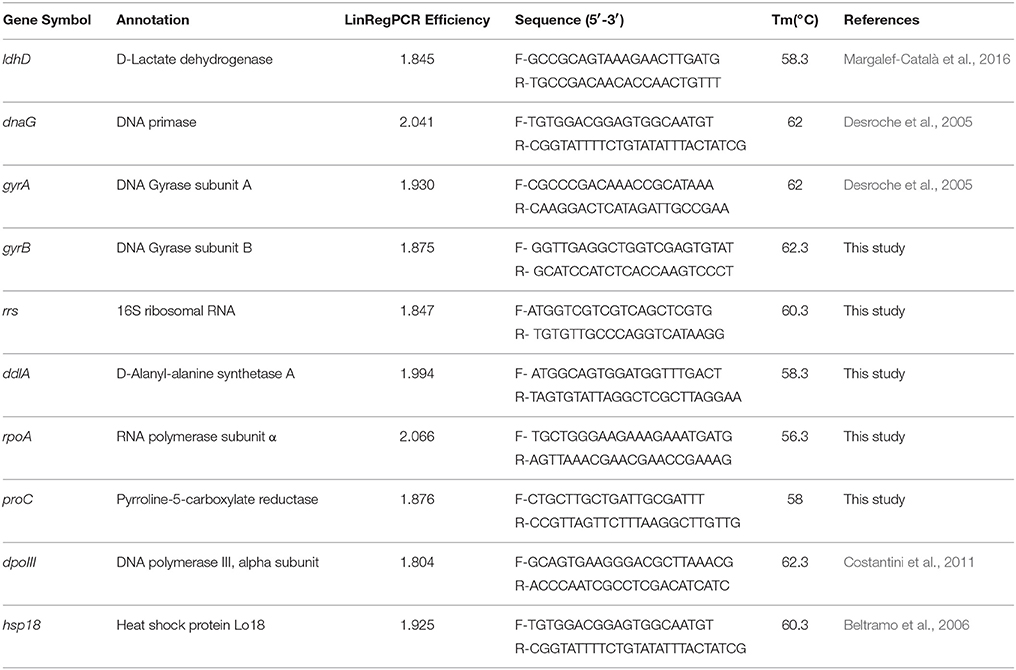
Table 1. Gene descriptions and primer sequences used for RT-qPCR.
Quantitative Real-Time PCR
The RT-qPCR reactions were carried out on a Bio-Rad IQ5 Real-time PCR system with ChamQ SYBR qPCR Master Mix (Vazyme Biotech, Nanjing). Each reaction was performed in triplicate with a total reaction mixture of 20 μl final volume containing 2 μl diluted cDNA, 0.4 μl of each primer, 10 μl of ChamQ SYBR qPCR Master Mix, and 7.2 μl of RNase-free water. PCR conditions were indicated as follows: 95°C for 30 s, 40 cycles of 95°C for 10 s, 60°C for 30 s. To confirm product specificity, a melting curve analysis was performed after each amplification (Supplementary Figure 1). The threshold cycle (Ct) used in this study was automatically calculated by the Bio-Rad IQ5 Optical System software (version 2.1). The amplification efficiency was calculated from the raw data using LinRegPCR software (Ruijter et al., 2009; Tuomi et al., 2010).
Statistical Analysis
The algorithms geNorm (Vandesompele et al., 2002), NormFinder (Andersen et al., 2004), and BestKeeper (Pfaffl et al., 2004) were used to evaluate the expression stability of candidate reference genes under ethanol stress conditions. The raw Ct values were directly applied for BestKeeper analysis, however, for geNorm and NormFinder analysis, the raw data should be transformed into relative quantities using the 2−ΔCt method: ΔCt = Ct sample − minimum Ct (Yan et al., 2014). Finally, an overall ranking of candidate reference genes was generated, by calculating the geometric mean of ranking orders from the three algorithms. In order to confirm the three major algorithms worked properly, the final overall ranking across all samples was compared to that obtained by a new software, named IdealRef (Palombella et al., 2017).
geNorm
geNorm(qbase+)is a statistical algorithm, which is based on the principle that the expression ratio of two reference genes should be constant in all samples, regardless of the experimental condition, or sampling time (Hellemans et al., 2007). The candidate reference genes were ranked by geNorm based on the expression stability value M, which is defined as the average pairwise variation with all other tested candidate genes. Lower M-values indicate more stable expression.
Using the geNorm algorithm, the normalization factor (NF) was also calculated by stepwise inclusion of a less stable gene until the (n+1)th gene has no significant contribution to the newly calculated normalization factor NFn+1(Vandesompele et al., 2002). Particularly, if the pairwise variation Vn/n+1 between the two sequential normalization factors NFn and NFn+1 is lower than the cut-off value of 0.15, it suggested that the NFn+1 is not required.
NormFinder
NormFinder is a Visual Basic application tool for Microsoft Excel used to calculate the stability values of each candidate reference genes by combining intra- and inter-group variations of gene expression (Andersen et al., 2004). The most stably expressed gene is the one with the lowest stability values and the lowest variation values of intra- and inter-groups.
BestKeeper
Pfaffl et al. (2004) have established Excel-based spreadsheet software named BestKeeper to determine the most stably expressed genes based on the standard deviation (SD) and the coefficient of variation (CV). The candidate reference genes can be ranked from the most stable one with the lowest variation, to the least stable one with the highest variation. Any candidate reference gene with the SD higher than 1 will be considered as inconsistent.
IdealRef
IdealRef is the algorithm recently developed by Palombella, based on the principle published by Vandesompele et al. (2002). The raw Ct values of candidate reference genes were required for this algorithm to calculate the average Ct and then the expression of one target gene was normalized with one reference gene at a time. From these values, the algorithm produces a dimensionless value (GS value), indicating the stability of the reference gene. The most stable gene is the one with the lowest GS value (Palombella et al., 2017).
Validation of the Selection of Reference Genes
In order to validate the selection of reference genes, the expression profile analysis of one target gene (hsp18) was carried out with the same cDNA samples used for the selection of reference genes (Guzzo et al., 2000; Beltramo et al., 2006). The RT-qPCR conditions were the same as previously described. The relative expression levels of the target gene were calculated according to the 2−ΔΔCt method (Livak and Schmittgen, 2001). Samples collected at 0 h (without stress) were considered as control groups. Statistical significances between the two means were determined by the t-test using IBM SPSS Statistics version 22.0 (SPSS Inc., USA).
Expression was normalized using the three reference gene strategies in each treatment: (1) the optimal multiple reference genes from all samples, (2) the optimal multiple reference genes from each treatment, (3) the least stable reference gene from each treatment.
Results
Expression Profiling of Candidate Reference Genes
In order to show transcriptional differences among nine candidate genes, the average Ct value was calculated across all experimental samples (Supplementary Table 2). The transcripts of these genes showed different levels of abundance (Figure 1). The mean Ct values for nine genes showed a range of variation from 8.57 to 24.12. rrs showed the most abundant transcript level with the lowest Ct value 8.57, while proC was the least abundant with the highest Ct value 24.12. dnaG revealed the least gene expression variation (coefficient of variation, CV, of 2.45%), while rrs and ldhD with CV of 6.61 and 6.34% were regarded as the most variable (Table 2).
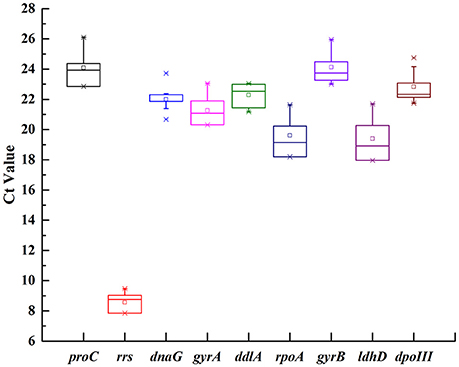
Figure 1. Expression levels of nine candidate reference genes across all samples in O. oeni SD-2a. The mean Ct values of nine candidate reference gene were described using a box and whiskers plot. The outer box is determined from 25 to 75th percentiles, and the inner box represents the mean value. The line across the box is the median. The whiskers represent percentiles from 5 to 95th, and outliers are depicted by asterisks.
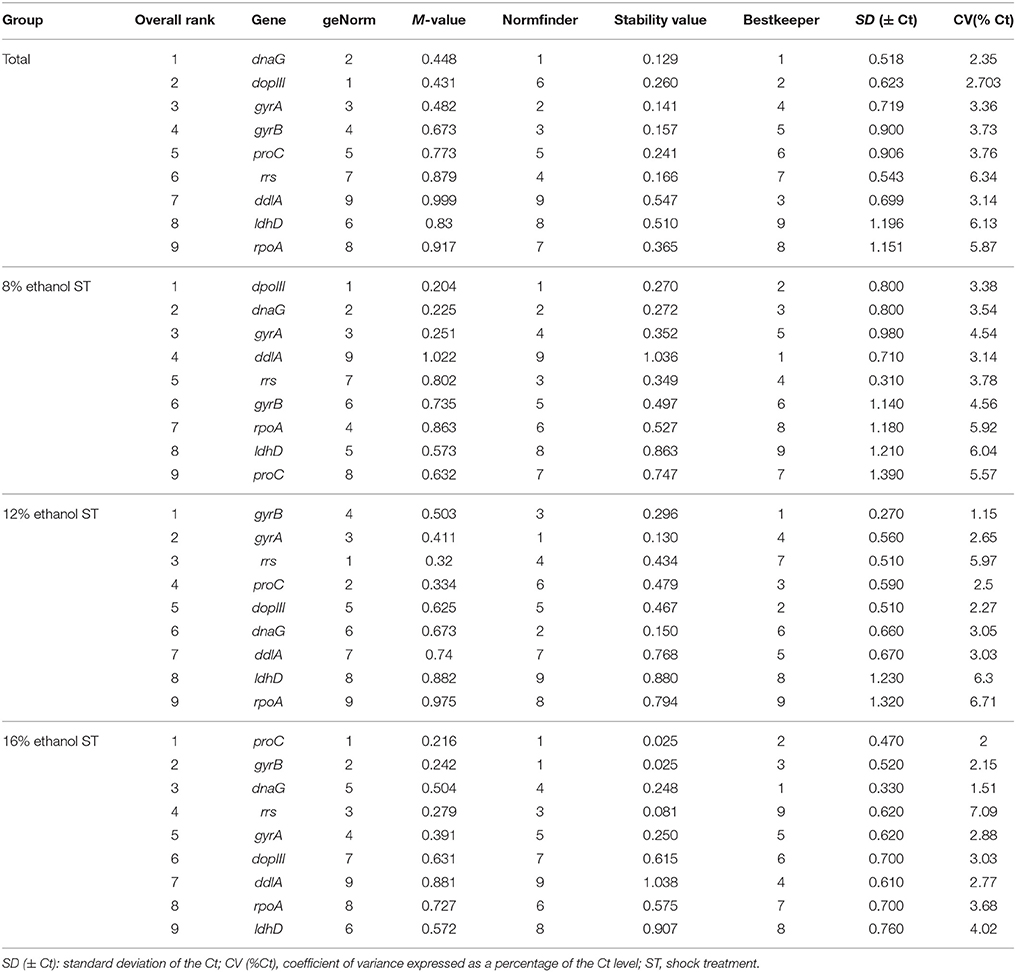
Table 2. Gene expression stability ranked by geNorm, NormFinder, and BestKeeper in all samples and 8, 12, and 16% ethanol shock treatment.
Expression Stability Analyses
geNorm Analysis
Figure 2A showed the rank order of the candidate reference genes according to their expression stability (M-value) across all samples pooled together. When all 21 samples were analyzed together, dpoIII, dnaG, and gyrA were defined as the most stable genes with the M-value of 0.431, 0.448, and 0.482, respectively. While rpoA and ddlA were defined as the least stable genes with the M-value of 0.917 and 0.999, respectively. In 8% ethanol, we also found that dpoIII, dnaG, and gyrA (M-value, 0.204, 0.225, and 0.251, respectively) were the most stable genes, whereas proC and ddlA (0.863 and 1.022, respectively) were the least stable genes (Figure 2B). However, in 12% ethanol, the top-ranked genes were rrs, proC, and gyrA (M-value, 0.32, 0.334, and 0.411, respectively). ldhD and rpoA (M-value,0.882 and 0.975, respectively) showed the greatest variation, which were ranked eighth and ninth, respectively (Figure 2C). In 16% ethanol, proC, gyrB, and rrs (M-value, 0.216, 0.242, and 0.279, respectively) were identified as the most stable genes, while rpoA and ddlA (M-value, 0.727 and 0.876, respectively) as the least stable genes (Figure 2D). In addition, the M-values for all candidate reference genes were below the geNorm default limit of 1.5, indicating relatively high stability for all measured genes. The rank orders generated by geNorm analysis were shown in Table 2.
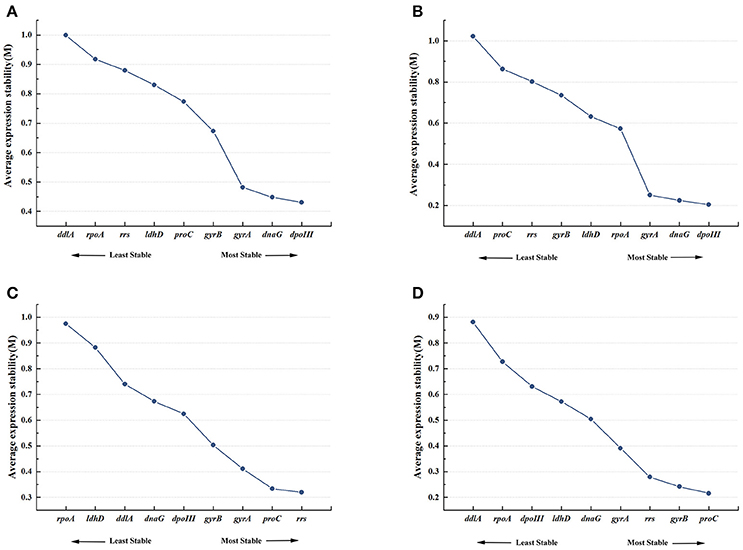
Figure 2. Expression stability and ranking of nine candidate reference genes by geNorm. Average expression stability (M) was calculated following stepwise exclusion of the least stable gene across all treatment groups. (A) All samples. (B) 8% ethanol shock treatment (ST). (C) 12% ethanol ST. (D) 16% ethanol ST.
NormFinder Analysis
NormFinder analysis result was slightly different from that generated by geNorm (Table 2). According to NormFinder analysis, dnaG and gyrA were ranked in top positions across all samples, but ranked second and third by geNorm, respectively. In 8% ethanol, dpoIII, dnaG, and rrs were ranked in top positions by NormFinder analysis, while rrs was ranked seventh by geNorm. In 12% ethanol, according to NormFinder, gyrA, dnaG, and gyrB were considered as the most stable genes, while dnaG was ranked sixth by geNorm. In 16% ethanol, gyrB and proC were ranked in top position by NormFinder, which was identical with the result by geNorm. Nevertheless, in all samples or each treatment, the least stable genes identified by both methods were consistent.
BestKeeper Analysis
As shown in Table 2, across all samples, the most stably expressed gene identified by BestKeeper were dnaG and dpoIII, which were also ranked in top position by geNorm, however dpoIII was ranked sixth position by NormFinder. In 8% ethanol, ddlA, dpoIII, and dnaG were regarded as the most stably expressed genes by BestKeeper, while ddlA as the least stable by both geNorm and NormFinder. Furthermore, in 12% ethanol, we found that gyrB was the most stably expressed using BestKeeper analysis, while ranked fourth and third by geNorm and NormFinder, respectively. And the same lowest stably expressed genes, rpoA and ldhD, were emerged by the three algorithms. In 16% ethanol, dnaG was emerged as the most stably expressed by BestKeeper, followed by proC and gyrB, however dnaG was ranked fifth and fourth by geNorm and NormFinder analysis, respectively. Whereas the least stable gene identified by BestKeeper was rrs, which was ranked third by both geNorm and NormFinder.
Finally, by calculating the geometric mean of the rank orders generated by the three algorithms, the overall rankings in all samples and each treatment were obtained and shown in Table 2: the three most stable reference genes were respectively dnaG, dpoIII, and gyrA in all samples, dpoIII, dnaG, and gyrA in 8% ethanol, gyrA, gyrB, and rrs in 12% ethanol, and proC, gyrB, and dnaG in 16% ethanol. As shown in Figure 3, no universal reference was found for all experimental conditions in this study.
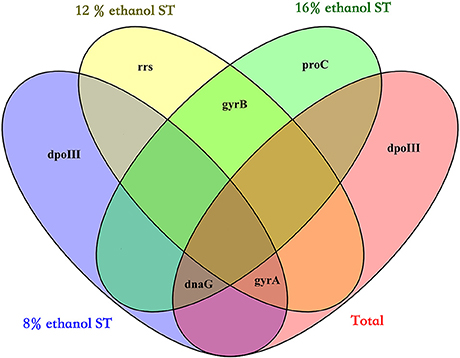
Figure 3. Venn diagram showing the overlap of the three most stable genes in all samples (Total), 8% ethanol shock treatment (ST), 12% ethanol ST, and 16% ethanol ST. The three most stable genes were selected by the overall ranking of three algorithms (geNorm, NormFinder, and BestKeeper).
IdealRef Analysis
In order to confirm the three major algorithms worked properly, the raw Ct data of all samples were analyzed with hsp18 as target gene using IdealRef software. The most stable reference genes (dpoIII and gyrA) identified by IdealRef software were consistent with those selected by the overall ranking across all samples (Supplementary Table 3).
Determination of the Optimal Number of Reference Genes for Normalization by geNorm
In order to determine the optimal number of reference gene used for accurate normalization, geNorm performed a stepwise calculation of the pairwise variation (Vn/Vn+1) between two sequential normalization factors (NFn and NFn+1). As shown in Figure 4 and Supplementary Table 4, in 8 and 16% ethanol, the V2/3 values were respectively 0.099 and 0.117, lower than the cut-off value of 0.15, indicating that two genes would be sufficient for normalization under these conditions. Therefore, we could consider dpoIII and dnaG as the optimal multiple reference genes in 8% ethanol, while proC and gyrB in 16% ethanol. However, in 12% ethanol, three reference genes were required for normalization with an acceptable V3/4 value of 0.137. Hence, gyrA, gyrB, and rrs would be used as the optimal multiple reference genes for normalization in 12% ethanol.
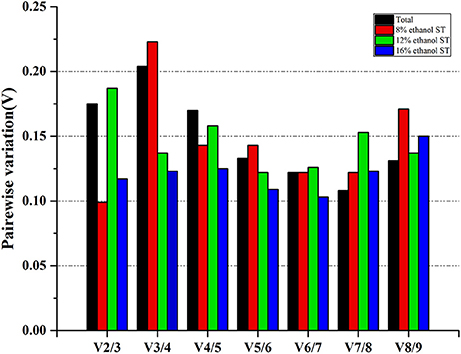
Figure 4. Determination of the optimal number of reference genes for normalization. Pairwise variation (Vn/Vn+1) analysis between the normalization factors (NFn and NFn+1) was performed by geNorm to determine the optimal number of reference genes.
Validation of the Selection of Reference Genes
An expression profile analysis of the target gene (hsp18) was carried out to validate the selection of candidate reference genes. According to the reference gene strategies mentioned above, besides the optimal multiple reference genes selected from each treatment, we also used the least stable gene in each treatment: proC in 8% ethanol, rpoA in 12% ethanol and ldhD in 16% ethanol, and the optimal multiple reference genes selected from all samples: dpoIII and gyrA in 8% ethanol, dnaG, dpoIII, and gyrA in 12% ethanol and dnaG and dpoIII in 16% ethanol, to normalizer the expression level of hsp18.
As shown in Figure 5 and Supplementary Table 5, the expression level of hsp18 increased continuously at 1 and 3 h in 8% ethanol, using dpoIII and dnaG as the optimal reference genes. Similar expression pattern was also revealed in 12% ethanol when normalization was carried out using dnaG, dpoIII, and gyrA as the optimal reference genes. In contrast, when normalizing using proC as reference gene, which was the least stable reference gene in 8% ethanol, the expression exhibited also continuously but sharply increasing. Meanwhile the relative expression was obviously overestimated, much higher than when normalizing using the optimal reference genes, dpoIII and dnaG, at all time points. The same expression trend was observed in 12% ethanol when normalizing using the least stable reference gene, rpoA. Normalizations with the optimal reference genes selected from all samples were also respectively performed in 8 and 12% ethanol. The expression levels were consistent with those obtained when normalization with the optimal reference genes from each treatment. However, in 16% ethanol, when normalization was performed using proC and gyrB as the optimal reference genes, the relative expression increased sharply at 1 h and unchanged at 3 h. The relative expression showed a different trend compared to when normalized with the least stable gene, ldhD, or with the optimal reference genes from all samples, dnaG and dpoIII.
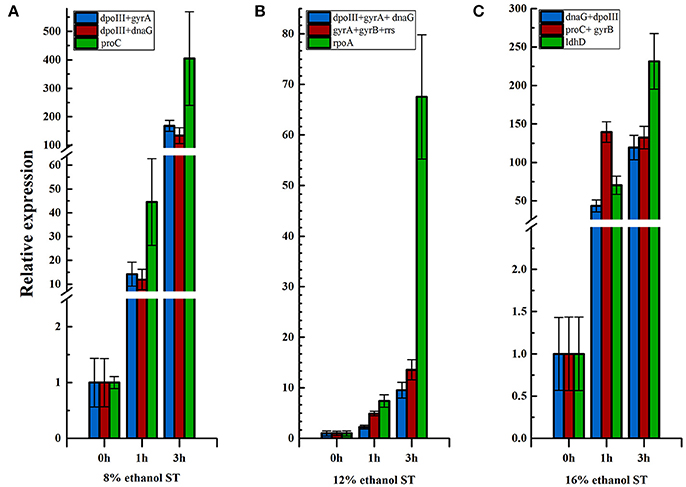
Figure 5. Relative expression of hsp18 in different ethanol stress conditions. (A) Relative expression of hsp18 in 8% ethanol shock treatment (ST) normalized using reference genes, dpoIII+gyrA, dpoIII+dnaG, and ldhD, respectively. (B) Relative expression of hsp18 in 12% ethanol ST normalized using reference genes, dpoIII+gyrA+dnaG, gyrA+gyrB+rrs, and rpoA, respectively. (C) Relative expression of hsp18 in 16% ethanol ST normalized using reference gene, dnaG+dpoIII, proC+gyrB, and ldhD, respectively. The results are represented as mean fold changes in relative expression compared to control samples (t = 0 h).
Discussion
As the most resistant LAB species to ethanol, O. oeni has evolved different mechanisms to cope with the ethanol stress condition in wine (Guzzo et al., 2000; Beltramo et al., 2004; G-Alegría et al., 2004; Li et al., 2009; Olguín et al., 2009, 2015). However, the molecular mechanisms of ethanol tolerance were still not well understood. RT-qPCR is a powerful tool to reveal the stress tolerance mechanisms of O. oeni, but the accuracy of its result was directly affected by the expression stability of reference genes (Vandesompele et al., 2002; Bustin et al., 2009; Sumby et al., 2012). Thus, the selection of the optimal reference genes is essential for quantification of gene expression.
In our study, three popular statistical algorithms, geNorm, NormFinder, and BestKeeper, were used for the evaluation of the expression stability of nine candidate reference genes in three different ethanol conditions. geNorm confirmed the most stable gene with a low pairwise variation among reference genes (Vandesompele et al., 2002). NormFinder determined the most stable gene with the lowest stability value calculated by combining the intra- and inter-group variation (Andersen et al., 2004), and BestKeeper did this based on the standard deviation and the coefficient of variation (Pfaffl et al., 2004). The final rankings of candidate reference genes were not identical when using different algorithms in this study. The variance in results provided by different algorithms was also reported in the previous works (Velada et al., 2014; Gao et al., 2017). The main reason causing the discrepancy is the varying priorities in different algorithms. Furthermore, co-regulated genes with similar expression profiles can affect the rank order of geNorm, resulting in making the wrong choice for normalization. In contrast, the algorithms of NormFinder and Bestkeeper are less sensitive to co-regulation (Wu et al., 2016). Thus, we selected the most stable reference genes based on the integrating of the results from three algorithms. By combining the results of three algorithms, we found that dnaG, dpoIII, and gyrA were the most stable reference genes when all samples pooled were analyzed together, however different experimental conditions emerged their own optimal reference genes. This is more evident that the validation of the reference genes for specific experimental condition is required prior to use in RT-qPCR normalization. In 8% ethanol, dpoIII performed as the most stable gene, followed by dnaG and gyrA. In 12% ethanol, gyrA and gyrB were identified as the most stable gene, while rrs ranked third position. In 16% ethanol, the top-ranked gene was proC, which was not evaluated in the previous studies of O. oeni, whereas gyrB and dnaG were ranked second and third respectively. In our study, dpoIII, dnaG, gyrB, and gyrA showed better expression stability, while in some studies, they were used together as reference genes for RT-qPCR normalization in O. oeni, but not evaluated particularly (Costantini et al., 2011; Margalef-Català et al., 2016; Liu et al., 2017). Moreover, the traditional reference genes in O. oeni, such as ddlA and ldhD varied greatly in our experimental conditions. ddlA were ranked fourth, seventh and seventh in the overall rangkings of 8, 12, and 16% ethanol, respectively. ldhD, together with rpoA, was considered as the least stable genes in all experimental conditions, so in this work, it was not chosen as reference gene for the normalization. This result is consistent with that described by Cafaro et al. (2014). rrs, encoding 16S rRNA, has been reported unstable in some studies with the disadvantage of high transcript level (Desroche et al., 2005; Wen et al., 2016). Our results showed also the much higher abundance of rrs than other genes, however in 12% ethanol, the expression stability of rrs was stable, which was ranked in top position by geNorm analysis and third in the overall ranking, was good (Figure 2C). Thus, in this study, rrs would be used for normalization to validate the selection result in 12% ethanol. Furthermore, in order to neutralize the impact of the high abundance of rrs, the templates for rrs should be diluted more times than the samples for the other genes in RT-qPCR analysis, however the different dilution ratios can lead to more human errors (Sun et al., 2016). Thus, in each experiment, three independent biological replicates and three technical replicates were required at least.
In order to validate the selection of reference genes, in this study, we employed three reference gene strategies to normalize the relative expression of one stress response gene, hsp18. In this study, the results showed that the expression patterns were influenced by the reference gene strategy obviously. When being normalized with the least stable gene, the relative expression levels of hsp18 were overestimated in all experimental conditions (Figure 5). The expression overestimated would deeply affect the accurateness of analysis. The hsp18 gene acts in the early response to stress conditions (Beltramo et al., 2006). A significant over-expression of this gene was observed for 1 h after ethanol shock in all experimental conditions when normalization with the optimal reference genes from each treatment or from all samples. Furthermore, when normalization with the optimal reference genes, in 8 and 12% ethanol, the expression trends were consistent with those observed in previous studies (Guzzo et al., 2000; Beltramo et al., 2006). However, in 16% ethanol, the expression trend using proC and gyrB as reference genes was different from using dnaG and dpoIII (Figure 5C). These results further verified the importance of the selection of reliable reference genes for each particular condition. The hsp18 gene was proposed as molecular marker to select good MLF starters by Coucheney et al. (2005). Capozzi et al. (2010) reported that strains with better MLF performance presented higher relative expression of hsp18, which confirmed hsp18 as a useful tool to evaluate the ability of O. oeni strains to survive in wine and to perform MLF. Moreover, Betteridge et al. (2017) considered hsp18 as an indicator to determine the high ethanol tolerance phenotype of O. oeni. Therefore, according to the expression results, O. oeni SD-2a seems to be a high ethanol tolerance strain and a good starter for MLF process.
Concluding, microarray and RNA-seq datasets from O. oeni could be used as alternative sources to identify novel candidate reference genes, however the validation of these novel genes using RT-qPCR or literature-based searches was required (Alexander et al., 2012; Pombo et al., 2017). The transcriptomic analysis of O. oeni SD-2a using RNA-seq has been reported by Liu et al. (2017). However, prior to validation of this transcriptomic analyses using RT-qPCR, the evaluation of reference genes for normalization was not performed. In further analysis, our findings will make the validation of high-throughput data from O. oeni SD-2a under ethanol stress condition more accurate and robust. In this study, we selected nine candidate genes, commonly used for normalization in O. oeni, based on literature review. These genes are still very popular with the researchers and still used for RT-qPCR data normalization in many studies.
This study is the first to systematically analyze reference genes for RT-qPCR under ethanol stress conditions in O. oeni. The results will benefit future gene expression studies in O. oeni SD-2a and facility the selection of reference genes of other LAB strains under ethanol condition.
Author Contributions
HL and SP conceived the idea of the study. SP, LL, and HZ designed and performed the experiments. SP and HW analyzed the data and wrote the paper. HL revised the paper.
Funding
This study was supported by National Natural Science Foundation of China (Grant No. 31471708). This work was also financially supported by Shaanxi Special Finance for Agriculture Construction of Technological System for Shaanxi Vitis Industry−2016.
Conflict of Interest Statement
The authors declare that the research was conducted in the absence of any commercial or financial relationships that could be construed as a potential conflict of interest.
Acknowledgments
We thank Dr. Pengtao Zhao and Dr. Ren Na for critical revising of the manuscript. We also acknowledge reviewers for their comments and suggestions, which greatly improved the original version of the article.
Supplementary Material
The Supplementary Material for this article can be found online at: https://www.frontiersin.org/articles/10.3389/fmicb.2018.00892/full#supplementary-material
References
Alexander, H., Jenkins, B. D., Rynearson, T. A., Saito, M. A., Mercier, M. L., and Dyhrman, S. T. (2012). Identifying reference genes with stable expression from high throughput sequence data. Front. Microbiol. 3:385. doi: 10.3389/fmicb.2012.00385
Allison, D. B., Cui, X., Page, G. P., and Sabripour, M. (2006). Microarray data analysis: from disarray to consolidation and consensus. Nat. Rev. Genet. 7, 55–65. doi: 10.1038/nrg1749
Andersen, C. L., Jensen, J. L., and Ørntoft, T. F. (2004). Normalization of real-time quantitative reverse transcription-pcr data: a model-based variance estimation approach to identify genes suited for normalization, applied to bladder and colon cancer data sets. Cancer Res. 64, 5245–5250. doi: 10.1158/0008-5472.CAN-04-0496
Beltramo, C., Desroche, N., Tourdot-Maréchal, R., Grandvalet, C., and Guzzo, J. (2006). Real-time PCR for characterizing the stress response of Oenococcus oeni in a wine-like medium. Res. Microbiol. 157, 267–274. doi: 10.1016/j.resmic.2005.07.006
Beltramo, C., Grandvalet, C., Pierre, F., and Guzzo, J. (2004). Evidence for multiple levels of regulation of Oenococcus oeni clpP-clpL locus expression in response to stress. J. Bacteriol. 186, 2200–2205. doi: 10.1128/JB.186.7.2200-2205.2003
Betteridge, A. L., Sumby, K. M., Sundstrom, J. F., Grbin, P. R., and Jiranek, V. (2017). Application of directed evolution to develop ethanol tolerant Oenococcus oeni for more efficient malolactic fermentation. Appl. Microbiol. Biotechnol. 102, 921–932. doi: 10.1007/s00253-017-8593-x
Bourdineaud, J.-P., Nehmé, B., Tesse, S., and Lonvaud-Funel, A. (2003). The ftsH gene of the wine bacterium Oenococcus oeni is involved in protection against environmental stress. Appl. Environ. Microb. 69, 2512–2520. doi: 10.1128/AEM.69.5.2512-2520.2003
Bustin, S. A., Benes, V., Garson, J. A., Hellemans, J., Huggett, J., Kubista, M., et al. (2009). The MIQE guidelines: minimum information for publication of quantitative real-time PCR experiments. Clin. Chem. 55, 611–622. doi: 10.1373/clinchem.2008.112797
Cafaro, C., Bonomo, M. G., and Salzano, G. (2014). Adaptive changes in geranylgeranyl pyrophosphate synthase gene expression level under ethanol stress conditions in Oenococcus oeni. J. Appl. Microbiol. 116, 71–80. doi: 10.1111/jam.12351
Capozzi, V., Russo, P., Beneduce, L., Weidmann, S., Grieco, F., Guzzo, J., et al. (2010). Technological properties of Oenococcus oeni strains isolated from typical southern Italian wines. Lett. Appl. Microbiol. 50, 327–334. doi: 10.1111/j.1472-765X.2010.02795.x
Contreras, A., Ribbeck, M., Gutéerrez, G. D., Cañon, P. M., Mendoza, S. N., and Agosin, E. (2018). Mapping the physiological response of Oenococcus oeni to ethanol stress using an extended genome-scale metabolic model. Front. Microbiol. 9:291. doi: 10.3389/fmicb.2018.00291
Costantini, A., Vaudano, E., Rantsiou, K., Cocolin, L., and Garcia-Moruno, E. (2011). Quantitative expression analysis of mleP gene and two genes involved in the ABC transport system in Oenococcus oeni during rehydration. Appl. Microbiol. Biotechnol. 91, 1601–1609. doi: 10.1007/s00253-011-3498-6
Coucheney, F., Desroche, N., Bou, M., Tourdot-Marechal, R., Dulau, L., and Guzzo, J. (2005). A new approach for selection of Oenococcus oeni strains in order to produce malolactic starters. Int. J. Food Microbiol. 105, 463–470. doi: 10.1016/j.ijfoodmicro.2005.04.023
Desroche, N., Beltramo, C., and Guzzo, J. (2005). Determination of an internal control to apply reverse transcription quantitative PCR to study stress response in the lactic acid bacterium Oenococcus oeni. J. Microbiol. Methods 60, 325–333. doi: 10.1016/j.mimet.2004.10.010
Fang, Z., and Cui, X. (2011). Design and validation issues in RNA-seq experiments. Brief Bioinform. 12, 280–287. doi: 10.1093/bib/bbr.004
G-Alegría, E., López, I., Ruiz, J. I., Sáenz, J., Fernández, E., Zarazaga, M., et al. (2004). High tolerance of wild Lactobacillus plantarum and Oenococcus oeni strains to lyophilisation and stress environmental conditions of acid pH and ethanol. FEMS Microbio. Lett. 230, 53–61. doi: 10.1016/S0378-1097(03)00854-1
Gao, M., Liu, Y., Ma, X., Shuai, Q., Gai, J., and Li, Y. (2017). Evaluation of reference genes for normalization of gene expression using quantitative RT-PCR under aluminum, cadmium, and heat stresses in soybean. PLoS ONE 12:e0168965. doi: 10.1371/journal.pone.0168965
Guzzo, J., Jobina, M.-P., Delmasa, F., Fortier, L.-C., Garmyn, D., Tourdot-Maréchal, R., et al. (2000). Regulation of stress response in Oenococcus oeni as a function of environmental changes and growth phase. Int. J. Food Microbio. 55, 27–31. doi: 10.1016/S0168-1605(00)00209-9
Hellemans, J., Mortier, G., De Paepe, A., Speleman, F., and Vandesompele, J. (2007). qBase relative quantification framework and software for management and automated analysis of real-time quantitative PCR data. Genome Biol. 8:R19. doi: 10.1186/gb-2007-8-2-r19
Li, H., Zhang, C., and Liu, Y. (2006). Species attribution and distinguishing strains of Oenococcus oeni isolated from Chinese wines. World J. Microb. Biot. 22, 515–518. doi: 10.1007/s11274-005-9065-5
Li, H., Zhao, W., Wang, H., Li, Z., and Wang, A. (2009). Influence of culture pH on freeze-drying viability of Oenococcus oeni and its relationship with fatty acid composition. Food Bioprod. Proc. 87, 56–61. doi: 10.1016/j.fbp.2008.06.001
Liu, F. (2002). Study on Enological Characteristics of Selected Oenococcus oeni. Northwest A&F University.
Liu, L., Zhao, H., Peng, S., Wang, T., Su, J., Liang, Y., et al. (2017). Transcriptomic analysis of Oenococcus oeni SD-2a response to acid shock by RNA-seq. Front. Microbiol. 8:1586. doi: 10.3389/fmicb.2017.01586
Livak, K. J., and Schmittgen, T. D. (2001). Analysis of relative gene expression data using real-time quantitative PCR and the 2(-Delta Delta C(T)) Method. Methods 25, 402–408. doi: 10.1006/meth.2001.1262
Maicas, S., Pardo, I., and Ferrer, S. (2000). The effects of freezing and freeze-drying of Oenococcus oeni upon induction of malolactic fermentation in red wine. Int. J. Food Sci. Tech. 35, 75–79. doi: 10.1046/j.1365-2621.2000.00359.x
Margalef-Català, M., Araque, I., Bordons, A., Reguant, C., and Bautista-Gallego, J. (2016). Transcriptomic and proteomic analysis of Oenococcus oeni adaptation to wine stress conditions. Front. Microbiol. 7:1554. doi: 10.3389/fmicb.2016.01554
Mendoza, S. N., Cañón, P. M., Contreras, Á., Ribbeck, M., and Agosín, E. (2017). Genome-scale reconstruction of the metabolic network in Oenococcus oeni to assess wine malolactic fermentation. Front Microbiol. 8:534. doi: 10.3389/fmicb.2017.00534
Mohedano Mde, L., Russo, P., de Los Ríos, V., Capozzi, V., Fernández de Palencia, P., Spano, G., et al. (2014). A partial proteome reference map of the wine lactic acid bacterium Oenococcus oeni ATCC BAA-1163. Open Biol. 4:130154. doi: 10.1098/rsob.130154
Olguín, N., Bordons, A., and Reguant, C. (2009). Influence of ethanol and pH on the gene expression of the citrate pathway in Oenococcus oeni. Food Microbiol. 26, 197–203. doi: 10.1016/j.fm.2008.09.004
Olguín, N., Bordons, A., and Reguant, C. (2010). Multigenic expression analysis as an approach to understanding the behaviour of Oenococcus oeni in wine-like conditions. Int. J. Food Microbiol. 144, 88–95. doi: 10.1016/j.ijfoodmicro.2010.08.032
Olguín, N., Champomier-Vergès, M., Anglade, P., Baraige, F., Cordero-Otero, R., Bordons, A., et al. (2015). Transcriptomic and proteomic analysis of Oenococcus oeni PSU-1 response to ethanol shock. Food Microbiol. 51, 87–95. doi: 10.1016/j.fm.2015.05.005
Palombella, S., Pirrone, C., Cherubino, M., Valdatta, L., Bernardini, G., and Gornati, R. (2017). Identification of reference genes for qPCR analysis during hASC long culture maintenance. PLoS ONE 12:e0170918. doi: 10.1371/journal.pone.0170918
Pfaffl, M. W., Tichopad, A., Prgomet, C., and Neuvians, T. P. (2004). Determination of stable housekeeping genes, differentially regulated target genes and sample integrity: bestkeeper – excel-based tool using pair-wise correlations. Biotechnol. Lett. 26, 509–515. doi: 10.1023/B:BILE.0000019559.84305.47
Pombo, M. A., Zheng, Y., Fei, Z., Martin, G. B., and Rosli, H. G. (2017). Use of RNA-seq data to identify and validate RT-qPCR reference genes for studying the tomato-Pseudomonas pathosystem. Sci. Rep. 7:44905. doi: 10.1038/srep44905
Ruijter, J. M., Ramakers, C., Hoogaars, W. M., Karlen, Y., Bakker, O., van den Hoff, M. J., et al. (2009). Amplification efficiency: linking baseline and bias in the analysis of quantitative PCR data. Nucleic Acids Res. 37:e45. doi: 10.1093/nar/gkp045
Sumby, K. M., Grbin, P. R., and Jiranek, V. (2012). Validation of the use of multiple internal control genes, and the application of real-time quantitative PCR, to study esterase gene expression in Oenococcus oeni. Appl. Microbiol. Biotechnol. 96, 1039–1047. doi: 10.1007/s00253-012-4409-1
Sun, Z., Deng, J., Wu, H., Wang, Q., and Zhang, Y. (2016). Selecting stable reference genes for Real-time quantitative PCR analysis in Edwardsiella tarda. J. Microbiol. Biotechnol. 27, 112–121. doi: 10.4014/jmb.1605.05023
Tuomi, J. M., Voorbraak, F., Jones, D. L., and Ruijter, J. M. (2010). Bias in the Cq value observed with hydrolysis probe based quantitative PCR can be corrected with the estimated PCR efficiency value. Methods 50, 313–322. doi: 10.1016/j.ymeth.2010.02.003
Vandesompele, J., De Preter, K., Pattyn, F., Poppe, B., Van Roy, N., De Paepe, A., et al. (2002). Accurate normalization of real-time quantitative RT-PCR data by geometric averaging of multiple internal control genes. Genome Biol. 3, 31–34. doi: 10.1186/gb-2002-3-7-research0034
Velada, I., Ragonezi, C., Arnholdt-Schmitt, B., and Cardoso, H. (2014). Reference genes selection and normalization of oxidative stress responsive genes upon different temperature stress conditions in Hypericum perforatum L. PLoS ONE 9:e115206. doi: 10.1371/journal.pone.0115206
Wen, S., Chen, X., Xu, F., and Sun, H. (2016). Validation of reference genes for real-time quantitative PCR (qPCR) analysis of Avibacterium paragallinarum. PLoS ONE 11:e0167736. doi: 10.1371/journal.pone.0167736
Wu, Z. J., Tian, C., Jiang, Q., Li, X. H., and Zhuang, J. (2016). Selection of suitable reference genes for qRT-PCR normalization during leaf development and hormonal stimuli in tea plant (Camellia sinensis). Sci. Rep. 6:19748. doi: 10.1038/srep19748
Keywords: Oenococcus oeni, reference gene, RT-qPCR, ethanol stress, normalization
Citation: Peng S, Liu L, Zhao H, Wang H and Li H (2018) Selection and Validation of Reference Genes for Quantitative Real-Time PCR Normalization Under Ethanol Stress Conditions in Oenococcus oeni SD-2a. Front. Microbiol. 9:892. doi: 10.3389/fmicb.2018.00892
Received: 04 January 2018; Accepted: 18 April 2018;
Published: 04 May 2018.
Edited by:
Vittorio Capozzi, University of Foggia, ItalyReviewed by:
Carmen Berbegal, Universitat de València, SpainAlbert Bordons, Independent Researcher, Tarragona, Spain
Copyright © 2018 Peng, Liu, Zhao, Wang and Li. This is an open-access article distributed under the terms of the Creative Commons Attribution License (CC BY). The use, distribution or reproduction in other forums is permitted, provided the original author(s) and the copyright owner are credited and that the original publication in this journal is cited, in accordance with accepted academic practice. No use, distribution or reproduction is permitted which does not comply with these terms.
*Correspondence: Hua Wang, wanghua@nwafu.edu.cn
Hua Li, lihuawine@nwafu.edu.cn