Structural connectivity is differently altered in dementia with Lewy body and Alzheimer’s disease
 Stefano Delli Pizzi1,2
 Raffaella Franciotti1,2
 John-Paul Taylor3
Roberto Esposito2
Armando Tartaro2
John-Paul Taylor3
Roberto Esposito2
Armando Tartaro2
 Astrid Thomas1,2
Marco Onofrj1,2
Astrid Thomas1,2
Marco Onofrj1,2  Laura Bonanni1,2*
- 1Department of Neuroscience, Imaging and Clinical Sciences, Aging Research Centre (CeSI), G. d’Annunzio University, Chieti, Italy
- 2Department of Neuroscience, Imaging and Clinical Sciences, Institute for Advanced Biomedical Technologies (ITAB), G. d’Annunzio University, Chieti, Italy
- 3Institute for Ageing and Health, Newcastle University, Newcastle upon Tyne, UK
The structural connectivity within cortical areas and between cortical and subcortical structures was investigated in dementia with Lewy bodies (DLB) and Alzheimer’s disease (AD). We hypothesized that white matter (WM) tracts, which are linked to visual, attentional, and mnemonic functions, would be differentially and selectively affected in DLB as compared to AD and age-matched control subjects. Structural tensor imaging and diffusion tensor imaging (DTI) were performed on 14 DLB patients, 14 AD patients, and 15 controls. DTI metrics related to WM damage were assessed within tracts reconstructed by FreeSurfer’s TRActs Constrained by UnderLying Anatomy pipeline. Correlation analysis between WM and gray matter (GM) metrics was performed to assess whether the structural connectivity alteration in AD and DLB could be secondary to GM neuronal loss or a consequence of direct WM injury. Anterior thalamic radiation (ATR) and cingulum-cingulate gyrus were altered in DLB, whereas cingulum-angular bundle (CAB) was disrupted in AD. In DLB patients, secondary axonal degeneration within ATR was found in relation to microstructural damage within medio-dorsal thalamus, whereas axonal degeneration within CAB was related to precuneus thinning. WM alteration within the uncinate fasciculus was present in both groups of patients and was related to frontal and to temporal thinning in DLB and AD, respectively. We found structural connectivity alterations within fronto-thalamic and fronto-parietal (precuneus) network in DLB whereas, in contrast, disruption of structural connectivity of mnemonic pathways was present in AD. Furthermore, the high correlation between GM and WM metrics suggests that the structural connectivity alteration in DLB could be linked to GM neuronal loss rather than by direct WM injury. Thus, this finding supports the key role of cortical and subcortical atrophy in DLB.
Introduction
Dementia with Lewy bodies (DLB) is the second most common form of neurodegenerative dementia after Alzheimer’s disease (AD) (Vann Jones and O’Brien, 2014).
Clinically, DLB patients present with greater attentional and visuo-perceptual impairment (Calderon et al., 2001; Collerton et al., 2003) and a less prominent memory loss (Collerton et al., 2003; Ferman et al., 2006) as compared with AD patients.
Recent studies on DLB patients have reported structural and functional connectivity alteration between cortical areas (Kantarci et al., 2010; Galvin et al., 2011; Kenny et al., 2012; Watson et al., 2012; Franciotti et al., 2013) and between cortex and subcortical structures (Kenny et al., 2013; Delli Pizzi et al., 2014a,b; 2015; Peraza et al., 2014).
In particular, Diffusion Tensor Imaging (DTI) has allowed the investigation of structural connectivity between brain areas by mapping the motion of water along neural axons and providing microstructural details about the shape and integrity of white matter (WM) fibers. Commonly used DTI metrics include fractional anisotropy (FA), mean diffusivity (MD), radial diffusivity (RD), and axial diffusivity (DA). FA and MD are associated with the primary degeneration of axons; FA is higher in organized than in disorganized fascicles, which are affected by microstructural processes such as demyelination, axonal degradation, or gliosis (Pierpaoli et al., 1996). MD, in contrast, is a sensitive, albeit rather non-specific, measure that can be increased by any pathological process affecting the cell membranes (Bosch et al., 2012). RD provides more detailed information about breakdown of myelin (Song et al., 2002, 2003), whereas DA describes the underlying pathology and it is associated with secondary degeneration of axons (Pierpaoli et al., 2001). However, the use of DA and RD remain controversial because a change in RD can cause a fictitious change in DA and vice-versa in voxels characterized by crossing fibers (Wheeler-Kingshott and Cercignani, 2009; Jones et al., 2013).
Different approaches have been used to assess the structural connectivity in DLB patients. They ranged from conventional analyses, which use region of interest (ROI) (Bozzali et al., 2005) or tract-specific method (Ota et al., 2009) to voxel-based approaches, which use statistical parametrical mapping analysis (Lee et al., 2010) or tract-based spatial statistics (Hattori et al., 2012; Watson et al., 2012). However, all these approaches present limitations. The conventional analysis methods are hindered by manual interaction and in particular, the partial volume contamination from adjacent tracts may induce site selection bias, resulting in additional inter-observer variability in the measurements. The voxel-based approach is limited because: (1) no physical characteristics are measured directly; (2) it cannot ensure voxel correspondence of the same tract across subjects (Yeatman et al., 2012); (3) coregistration algorithms do not accurately align fiber tracts which are affected by variation in size and shape (Wassermann et al., 2011). Therefore, the voxel-based approach may not have sufficient precision at the individual level for dementia patient populations, given that patients with dementia are largely affected by brain deformation and substantial variability of long-range fiber tracts morphology among subjects (Wassermann et al., 2011; Yeatman et al., 2012).
TRActs Constrained by UnderLying Anatomy (TRACULA) is a recent tool for automatic reconstruction of a set of major white-matter pathways from diffusion-weighted MR images. It uses global probabilistic tractography with anatomical priors. Prior distributions on the neighboring anatomical structures of each pathway are derived from an atlas and combined with the FreeSurfer cortical parcelation and subcortical segmentation of the subject that is being analyzed to constrain the tractography solutions (Yendiki et al., 2011, 2013). TRACULA has benefits in terms of: (1) overcoming the limitations related to manual interaction, thus facilitating the application of tractography to large studies; (2) measuring, for each patient, the DTI-derived metrics from each tract of interest; (3) overcoming coregistration issues linked to voxel-based approaches (Wassermann et al., 2011; Yendiki et al., 2011, 2013).
In the current study, we used TRACULA to assess structural connectivity in a cohort of DLB and AD patients as well as healthy controls. Our hypothesis was that WM tracts linked to visual, attentional, and mnemonic functions are differentially and selectively affected in DLB and AD.
Because the axonal degeneration can be initiated either by the degeneration of the cell bodies associated with these axons, or by the direct WM injury, we also performed a correlation analysis between WM and gray matter (GM) metrics to assess whether possible structural connectivity alteration in AD and DLB could be the consequence of GM neuronal loss.
Materials and Methods
Study Sample
The current research was approved by the local Ethics Committee and was performed according to the Declaration of Helsinki (1997) and subsequent revisions. Data will be made freely available upon request. All subjects (or their caregivers, where appropriate) provided written informed consent. Fourteen DLB and 14 AD patients were recruited from our Memory Clinic and Movement Disorder Clinic. Fifteen age-matched volunteers were recruited from our non-demented case register. AD patients fulfilled the National Institute of Neurological and Communicative Diseases and Stroke/AD and Related Disorders Association criteria (McKhann et al., 1984). Probable DLB diagnosis was based on consensus guidelines (McKeith et al., 2005). As part of their clinical work up, all patients underwent Computerized Tomography or MRI and dopaminergic presynaptic ligand ioflupane SPECT (DAT scan) within 6 months before the inclusion in the study. In addition, all patients were assessed with electroencephalography (EEG) recordings as abnormalities characterized by parieto-occipital dominant frequency alterations have previously been shown to reliably differentiate probable DLB from AD (Bonanni et al., 2008).
Clinical Assessment
All participants underwent clinical and neuropsychological evaluations. Specifically, Mini Mental State Examination (MMSE) (Folstein et al., 1975), Clinical Dementia Rating (CDR) (Morris, 1993), and Dementia Rating Scale-2 (DRS-2) (Jurica et al., 2001) were used to investigate cognitive deterioration. Frontal Assessment Battery (FAB) (Dubois et al., 2000) and Clinician Assessment of Fluctuations (CAF) (Walker et al., 2000) were included to assess, respectively, the severity of frontal dysfunction and the presence and severity of cognitive fluctuations. Unified Parkinson’s Disease Rating Scale (UPDRS)-motor section III (Fahn and Elton, 1987) assessed the presence and severity of extrapyramidal signs. Neuropsychiatric Inventory (NPI) was used to determine the frequency and severity of any neuropsychiatric features (Cummings et al., 1994). In particular, the NPI item-2 hallucinations assessed the occurrence as well as severity × frequency of visual hallucinations. Presence/absence of REM sleep Behavior Disorder (RBD) was determined according to minimal International Classification of Sleep Disorders (ICSD) criteria (World Health Organization, 1992) and confirmed by polysomnography. Patients were treated with l-DOPA (all DLB patients), rivastigmine or donepezil (all AD and DLB patients with same daily dosages), quetiapine (5 DLB and 5 AD), clozapine (4 DLB), risperidone (4 AD), and clonazepam (14 DLB patients, who presented with RBD).
MR Data Acquisition
All measurements were carried out with a Philips Achieva 3 T scanner (Philips Medical System, Best, The Netherlands) equipped with eight-channel receiver coil. After scout and reference sequences, three dimensional T1-Weighted Turbo Field-Echo (3D T1-W TFE, TR/TE = 11/5 ms, slice thickness = 0.8 mm, FOV = 256 mm × 192 mm × 170 mm) and Diffusion-Weighted Image Spin-Echo (DWI-SE; TR/TE = 3691/67 ms, slice thickness of 4 mm, FOV = 230 mm × 230 mm × 139 mm, 15 diffusion-sensitive gradient directions) sequences were performed on all participants. T2-weighted fluid attenuation inversion recovery (FLAIR, TR/TE = 11000/125 ms, slice thickness of 4 mm, FOV = 240 mm × 129 mm × 222 mm) sequence was also performed to assess vascular pathology or WM abnormalities.
Leukoencephalopathy Burden Evaluation
The FLAIR image of each participant was evaluated in blind by two experienced neuroradiologists in two independent sessions. Intra- and inter-rater reliability tests were performed by non-parametric Kruskal–Wallis test, followed, respectively, by Wilcoxon and Mann–Whitney post hoc test to allow comparisons within and between groups.
The rating scale described in Fazekas et al. (1987) was used to assess the different types of hyperintense signal abnormalities in the deep white matter (DHWM). Specifically, DHWM was scored as 0 = absent, 1 = punctate foci, 2 = beginning confluence of foci, 3 = large confluent areas.
Gray Matter Morphometry
Structural T1-weighted and DWI images were processed by using Freesurfer processing stream (Fischl and Dale, 2000; Yendiki et al., 2011).1 By using recon-all command line, we performed the automated reconstruction and labeling of cortical and subcortical regions [classified by using the Desikan–Killiany Atlas (Desikan et al., 2006)] on the high-resolution anatomical T1-weighted images of each subject. Subcortical volumes and mean thickness of each cortical region were extracted by using “asegstats2table” and “aparcstats2table” command line.
Structural Connectivity Analysis
The DWI image of each subject was corrected from distortions induced by eddy currents and motion (Yendiki et al., 2013). Next, intra-subject registration between the individual’s low-b diffusion and T1 images was performed by using an affine registration method that seeks to maximize the intensity contrast of the b = 0 image across the cortical gray/white boundary, which is obtained from the T1-images. Subsequently, affine registration was carried out between each individual’s structural MRI image and MNI152-1mm atlas. WM mask was created by extracting the cerebral WM, cerebellar WM, ventral diencephalon, and brainstem from the individual’s FreeSurfer cortical parcelation and subcortical segmentation (obtained by recon-all command line). Cortical mask was obtained by mapping the cortical parcelation labels to the volume, growing them into the WM by 2 mm and combining all the grown cortical labels into a mask. Anatomical brain mask was produced by binarizing and dilating the entire cortical parcelation and subcortical segmentation. All the above masks were obtained from individual T1 space to individual diffusion space and to the template space. Least-squares tensor estimation was carried out using FSL’s (FMRIB’s Diffusion Toolbox2) and mapping all scalar output volumes of the tensor fit (FA, MD, DR, and DA) from diffusion space to the template space. Combining the atlas data with the previously obtained individual’s masks, pathways were computed in template space. The TRACULA atlas data were used to estimate a priori probabilities that each pathway intersects each of the labels in the cortical parcelation and subcortical segmentation, at each point along the pathway’s trajectory. The atlas set was also used to obtain ROIs for the two endings of each pathway, as well as an initial guess of the location of the control points of each pathway, to be used in the subsequent pathway reconstruction. After estimation of pathway priors, ball-and-stick model fitting was performed. Estimation of the a posteriori probability distribution of the location of each pathway in the individual and reconstructed volumetric distributions was performed for corticospinal tract, inferior longitudinal fasciculus, uncinate fasciculus, ATR, cingulum-cingulate gyrus (CCG) (supracallosal) bundle, cingulum-angular (infracallosal) bundle (CAB), superior longitudinal fasciculus-parietal bundle, superior longitudinal fasciculus-temporal bundle, corpus callosum-forceps major, and corpus callosum-forceps minor. With the exception of corpus callosum-forceps major and corpus callosum-forceps minor, which are inter-hemispheric connections, all other pathways were labeled for the left and right hemisphere. We therefore defined a total of 18 tracts per subject. From each one, DTI metrics (FA, MD, RD, and DA) were averaged over an entire pathway.
Target Regions Definition
For each WM tract showing significant difference among groups, we defined the its target regions. Specifically, for the right ATRs, the target regions were the right mediodorsal nuclei of thalami and the areas within the right frontal lobe (caudal-anterior cingulate gyrus, caudal-middle frontal gyrus, lateral-orbitofrontal gyrus, medial-orbitofrontal gyrus, parsopercularis, parsorbitalis, parstriangularis, rostralanteriorcingulate gyrus, rostral-middle frontal gyrus, superior frontal gyrus, frontal pole); for the left and right CABs, the target regions were the ipsilateral regions within the temporal lobe (entorhinal and parahippocampal cortices, hippocampus, inferiortemporal gyrus, middle temporal gyrus, superior temporal gyrus (STG), temporal pole, transverse temporal gyrus, insula) and ipsilateral precuneus and posterior cingulate cortex (PCC); for the left CCG bundles, the target regions were the areas within the left frontal lobe and left precuneus and PCC; for the right and left inferior longitudinal fascicles, the target regions were the ipsilateral areas within temporal and occipital (cuneus, fusiform gyrus, lateral occipital gyrus, lingual gyrus and pericalcarine cortex) lobes; for the right and left uncinate fasciculus, the target regions were the ipsilateral regions within frontal and temporal lobes. All cortical areas were defined by using the Desikan–Killiany Atlas.
Microstructural Assessment of Thalamic Regions
Microstructural assessment of the thalamic regions were performed by using Functional MRI of the Brain (FMRIB) Software Library (FSL) version 4.1 (Smith et al., 2004 3). In detail, for each subject, noise reduction was carried out using Smallest Univalue Segment Assimilating Nucleus (SUSAN) algorithm on structural images and eddy-currents correction on diffusion images. Brain Extraction Tool (BET) was carried out for brain and skull extraction of the structural and DWI images. T1-W structural image of each subject was co-registered in common space on the non-linear MNI152 template with 1 mm × 1 mm × 1 mm resolution, by means of affine transformations based on 12 degree of freedom (three translations, three rotations, three scalings, and three skews) using FMRIB’s Linear Image Registration Tool (FLIRT). FMRIB’s Integrated Registration and Segmentation Tool (FIRST) was used to automatically segment thalami (Patenaude et al., 2011). Thalami masks were obtained by binarizing the FIRST outputs. The DTI maps were registered to MNI standard space using: (1) FLIRT to register each subject’s b0 image to its native structural image, and (2) FMRIB’s non-linear registration tools to register the structural and diffusion images to MNI space (1 mm × 1 mm × 1 mm). Next, “fslroi command line” was used to overlap the thalami masks on MD maps and to minimize the misalignment between DWI and structural images. Oxford thalamic connectivity atlas (provided by FSL tool) was adapted on the thalami masks to define the medio-dorsal nuclei projecting to frontal cortex (Figure S1 in Supplementary Material). To exclude thalamic voxels that contained cerebrospinal fluid (CSF), the MD images were segmented using FMRIB’s Automated Segmentation Tool (FAST) and CSF binarized to be used as exclusion mask. To exclude voxels out of the thalamic range, manual editing was applied where needed. Finally, MD values were calculated within the connectivity-defined subregion (Delli Pizzi et al., 2015).
Statistical Analysis
One-way ANOVA and Bonferroni post hoc test was also performed on demographic and clinical data. Chi-squared test was carried out for sex. Kruskal–Wallis one-way analysis of variance by ranks was used to assess group difference on DHWM. T-Tests (independent samples) were applied on TRACULA outcomes to test the differences among groups (AD vs. controls, DLB vs. Controls and AD vs. DLB). Bonferroni’s correction was applied to adjust the p-level (corrected p threshold was set at 0.05/18 tracts = 0.003). Analysis of covariance (ANCOVA) was performed to exclude the possible effect of DHWM on DTI findings.
Within each patient group, linear regression was performed to assess the relationship between: (1) DTI metrics within tract of interest (dependent variable) and our primary clinical measures (independent variables: age, DHWM, FAB, MMSE, NPI hallucination-item, UPDRS scores); (2) DTI metrics (dependent variable) and the GM measures within target regions of each tract of interest (independent variables); age, DHWM and mean cortical thickness value of each hemisphere were added to regressor as nuisance factors. If any significant relationship exits between WM and GM metrics, we assume that the WM changes are consequence of GM neuronal loss (Huang et al., 2012).
To ensure the specific effect of GM patterns of atrophy on DTI metrics, a further regression analysis was also performed including DTI metrics as dependent variable and the thickness of non-target regions as independent variables.
Results
Demographic and Clinical Features
Demographic features and neuropsychological test scores were summarized in Table 1.
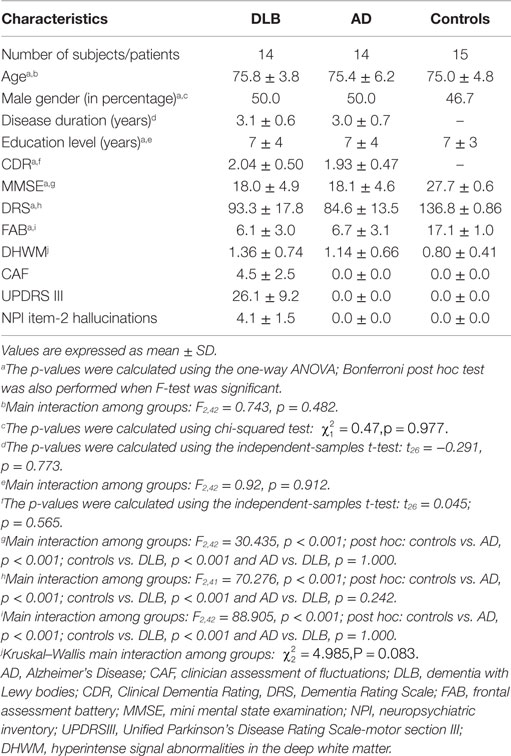
Table 1. Demographic and clinical features.
No differences in terms of age, sex, and educational level were observed among groups.
No differences on global test of cognition (DRS-2, MMSE, CDR) and on the severity of frontal dysfunction (FAB score) were found between AD and DLB patients. All DLB patients had RBD. All DLB patients had visual hallucinations and cognitive fluctuations. None of the AD patients had visual hallucinations or cognitive fluctuations, as expected given inclusion criteria. All DLB patients showed an abnormal quantitative EEG pattern profile consistent with a DLB diagnosis (Bonanni et al., 2008) and represented by slow dominant frequency (in the theta and pre-alpha band) in posterior leads and a dominant frequency variability >1.5 Hz. None of the AD patients or controls showed these DLB-specific EEG characteristics (Bonanni et al., 2008). Dopamine-transporter hypocaptation in the caudate nuclei at SPECT-DAT scan was observed in all DLB patients (bilateral in 12). SPECT-DAT scan abnormalities were not observed in AD patients or control subjects.
White Matter Hyperintensity Evaluation
Intra- and inter-rater reliability test showed no differences in the evaluation of white matter hyperintensity (p = 1.000).
No significant difference on DHWM was found among groups (Table 1).
In DLB, DHWM was absent (score = 0) in one patient, was present with punctate foci (score = 1) in eight patients, with beginning confluence of foci (score = 2) in four patients and with large confluent areas (score = 3) in one patients. In AD, DHWM was absent (score = 0) in one patient, was present with punctate foci (score = 1) in 11 patients, with the beginning confluence of foci (score = 2) in one patients and evidence of large confluent areas (score = 3) in one patient. In controls, DHWM was absent (score = 0) in three subjects and was present with punctate foci (score = 1) in 12 subjects.
Structural Connectivity
Table 2 and Figures 1 and 2 summarize significant results obtained from DTI analysis by TRACULA. Tables S1–S4 in Supplementary Material provide the complete (significant and non-significant) statistical results for each metric and tract. Table S5 in Supplementary Material shows the results of ANCOVA analyses, which excluded the possible effect of DHWM on DTI results.
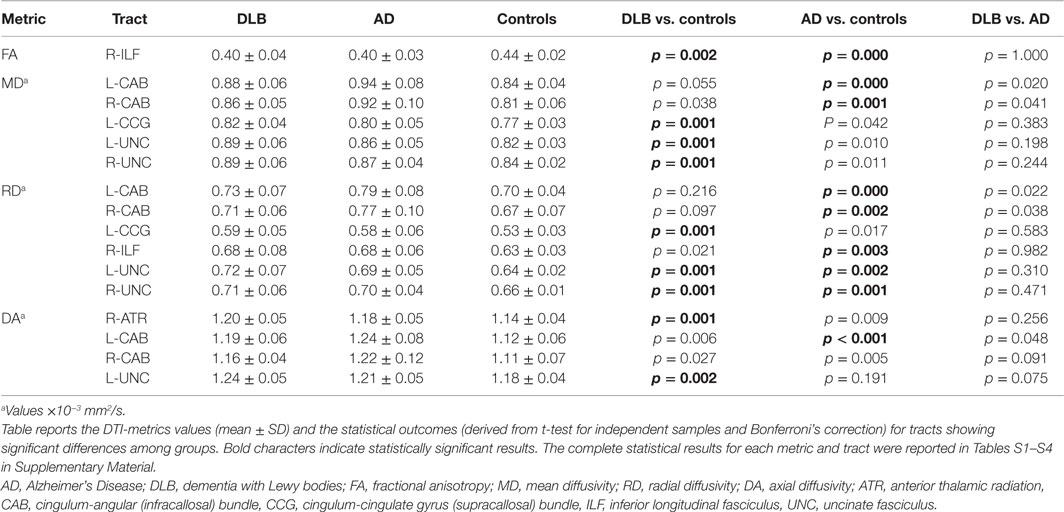
Table 2. Mean DTI-metrics values of left and right white matter tracts for each group.
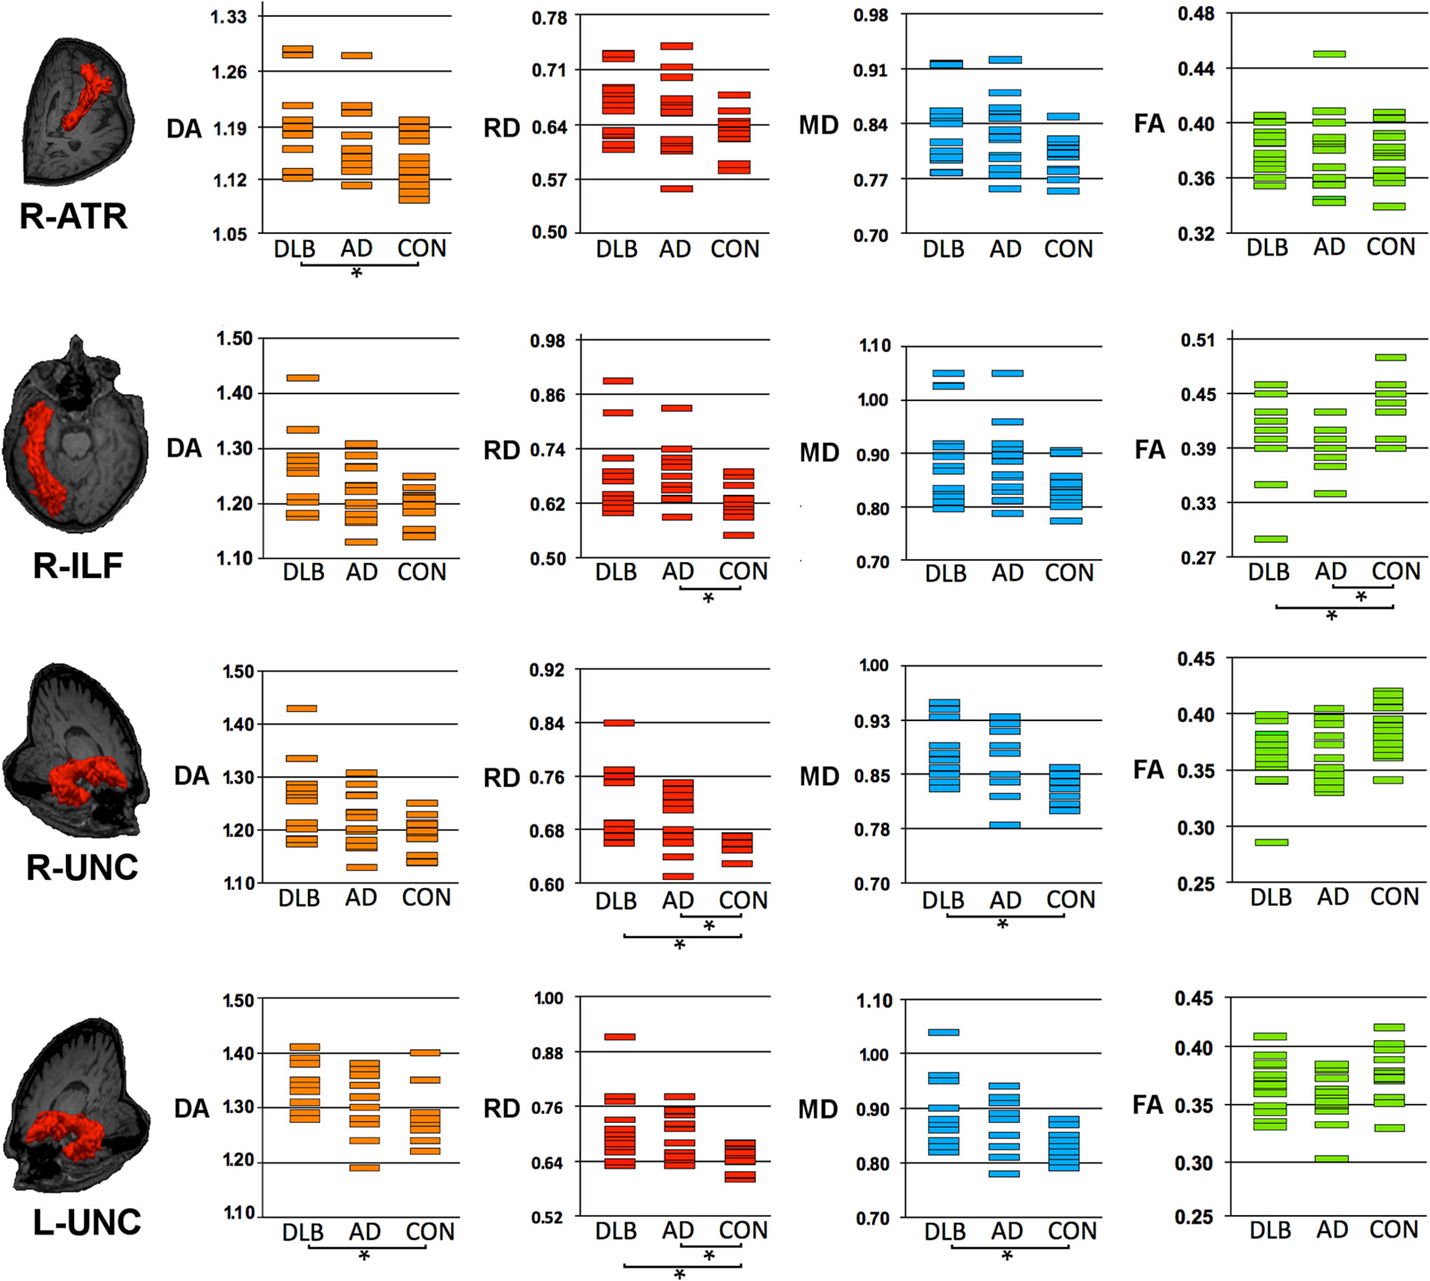
Figure 1. Structural connectivity showing DTI-metrics values within right anterior thalamic radiation (ATR), right inferior longitudinal fascicle (ILF) and right and left uncinate fasciculus (UNC). Representative images showing TRACULA output: the tract of interest is colored in red and overlaid on individual’s structural image. The distribution of DTI-metrics values within each tract of interest and within group is reported in the scatter-plots: orange, red, blue, and green rectangles represent axial diffusivity (DA), radial diffusivity (RD), mean diffusivity (MD) and fractional anisotropy (FA), respectively. Significant differences between groups are marked with dark lines and asterisks. The values of DA, RD, and MD are reported as values ×10−3mm2/s. AD, Alzheimer’s Disease; DLB, dementia with Lewy bodies; R, right; L, left.
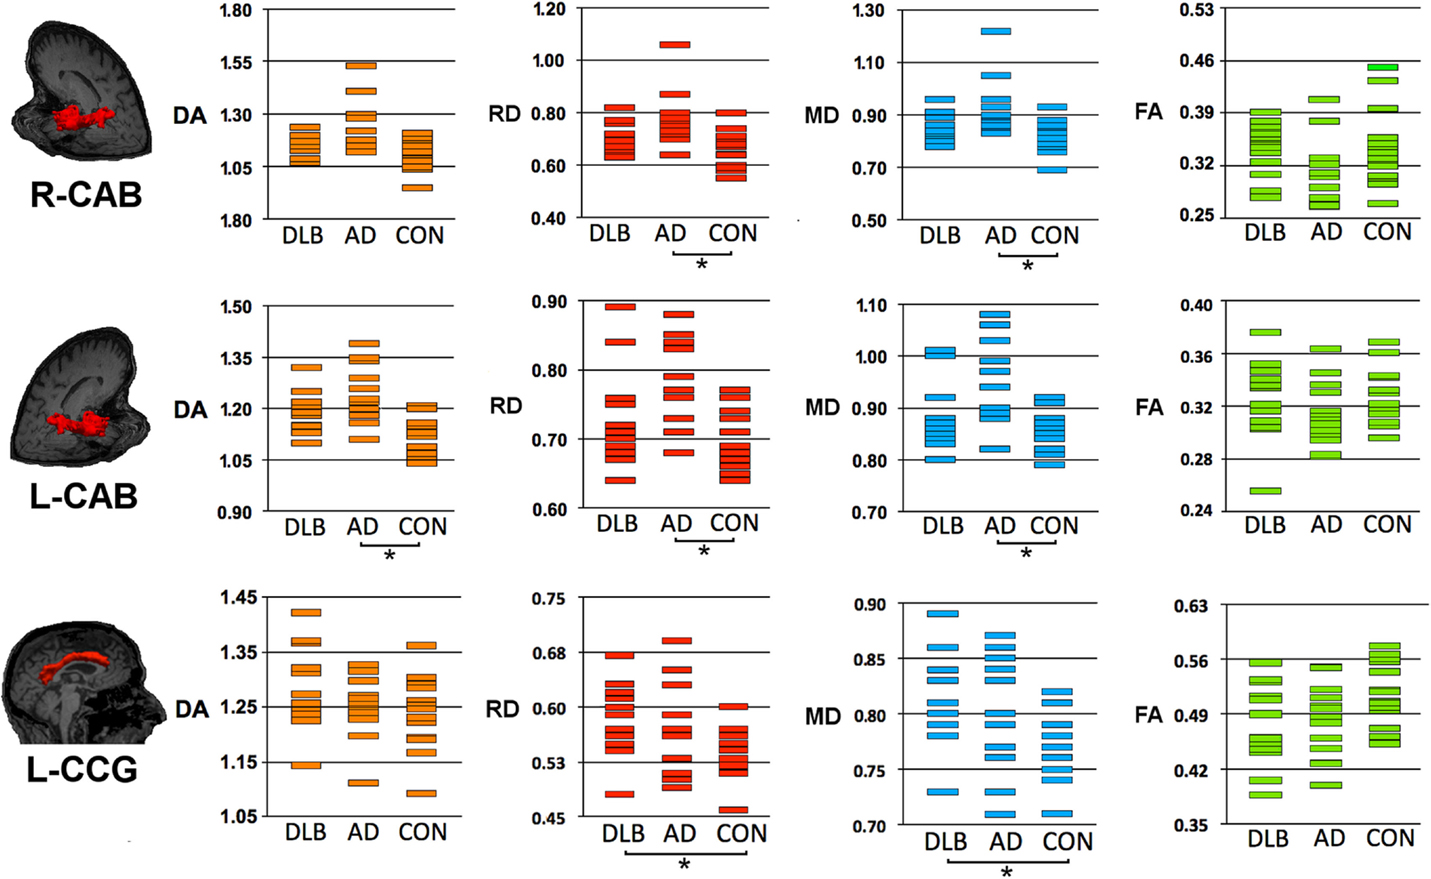
Figure 2. Structural connectivity showing DTI-metrics values for left cingulum-angular (infracallosal) cingulum-angular bundle (CAB) and bilateral cingulum-cingulate gyrus (supracallosal) bundle (CCG). Representative images showing TRACULA output: the tract of interest is colored in red and overlaid on individual’s structural image. The distribution of DTI-metrics values within each tract of interest and within group is reported in the scatter-plots: orange, red, blue, and green rectangles represent axial diffusivity (DA), radial diffusivity (RD), and mean diffusivity (MD), respectively. Significant differences between groups are marked with dark lines and asterisks. The values of DA, RD, and MD are reported as values ×10−3mm2/s. AD, Alzheimer’s disease; DLB, dementia with Lewy bodies; R, right; L, left.
As compared with controls, DTI-metric changes in DLB were found in the right ATR (DA), right inferior longitudinal fascicule (FA), left CCG bundle (RD), right (RD, MD), and left (DA, RD, MD) uncinate fasciculus.
As compared with controls, DTI-metric changes in AD were found in the right (RD, MD) and left (DA, RD, MD) CAB, right inferior longitudinal fascicule (FA, RD), and right (RD) and left (RD) uncinate fasciculus.
No significant difference was found between DLB and AD.
No correlation was found between WM metrics and clinical outcomes.
Relationship Between White Matter and Gray Matter Metrics
Figure 3 shows the relationship between white matter and GM metrics.
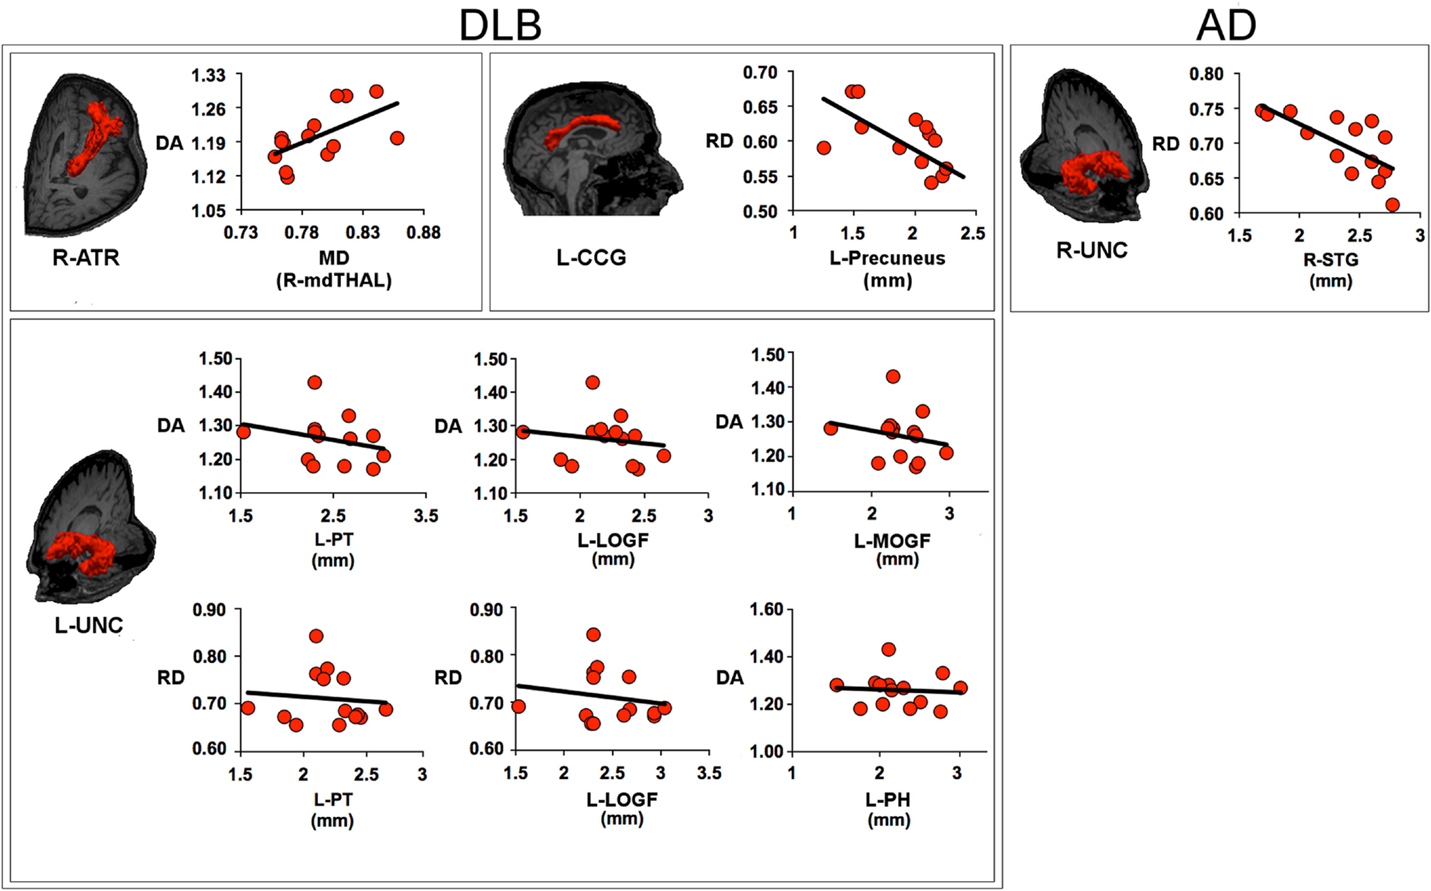
Figure 3. Scatter plots describe the relationship between the metrics within the white matter tract and the measures of gray matter within its target regions. The values of axial diffusivity (DA), radial diffusivity (RD), and mean diffusivity (MD) are reported as values ×10−3mm2/s. For DLB patients, the panels show: the relationship between DA within the right anterior thalamic radiation (ATR) and MD within the right medio-dorsal thalamic region (mdTHAL), which projects to prefrontal cortex; the relationship between RD within the left cingulum-cingulate gyrus (supracallosal) bundle (CCG) and the thickness of left precuneus; the relationship between DA within the left uncinate fasciculus (UNC) and the thickness of left pars triangularis (PT), left medial orbitalfrontal gyrus (MOFG), left lateral orbitofrontal gyrus (LOFG) and between the RD within the left UNC and the thickness of left PT and LOFG; for AD patients, the panel shows the relationship between RD within the right uncinate fasciculus and the thickness of right superior temporal gyrus (STG). AD, Alzheimer’s disease; DLB, dementia with Lewy bodies; R, right; L, left.
Within the DLB group, the increase of DA values in the right ATR was correlated to MD values in the mediodorsal nuclei of the right thalamus (t = 2.487, β = 0.583, p = 0.029); the increase of RD values in the left CCG bundle was anti-correlated to cortical thickness in the left precuneus (t = −3.028, β = −0.658, p = 0.010); the increase of DA values in the left uncinate fasciculus was anti-correlated to cortical thickness in the left mediorbitofrontal gyrus (t = −7.902, β = −1.087, p < 0.001), left laterorbitofrontal gyrus (t = 8.840, β = 1.171, p < 0.001), left pars triangularis (PT) (t = −6.712, β = −0.977, p < 0.001), left parahippocampus (t = 3.958, β = 0.466, p = 0.003); the increase of RD values in the left uncinate fasciculus was anti-correlated to cortical thickness in the left laterorbitofrontal gyrus (t = −4.719, β = −1.266 p = 0.001) and left PT (t = 2.650, β = 0.711, p = 0.023).
Within the AD group, no significant correlation was found between DTI metrics in the right and left CCG bundle and GM measure in the target regions; the increase of DA values within the right uncinate fasciculus was correlated to right STG thickness (t = −3.427, β = −0.703, p = 0.005).
No correlations were found between FA values in the right inferior longitudinal fascicule and cortical thickness within temporal and occipital lobes.
No significant relationship was found between the DTI metrics and the cortical thickness in the non-target regions.
Discussion
In this study, we found specific pattern of WM alterations in DLB and AD.
As compared with controls, the ATR was altered in DLB but not in AD.
This tract connects the dorso-medial thalamic nuclei with the prefrontal cortex (Wakana et al., 2007; Yendiki et al., 2011). The fronto-thalamic connectivity plays a relevant role in consciousness (Ward, 2011) and alertness (Tomasi et al., 2009). Recently, structural and functional alteration of fronto-thalamic loop has been described in DLB patients (Kenny et al., 2013; Delli Pizzi et al., 2014a, 2015). In the current study, we found a close relationship between microstructural GM damage within thalamic nuclei projecting to frontal lobe and secondary axonal degeneration (expressed by DA) within ATR. In addition, we did not find any correlation between frontal thickness and fronto-thalamic tract alterations. Thus, we suggest that the secondary axonal degeneration within the ATR could be linked by GM neuronal loss in the thalami. Of note, the synchronized activity of the thalamo-cortical pathway modulates the information flow necessary for conscious cognitive processes (León-Domínguez et al., 2013). However, we did not find a significant correlation between the ATR degeneration in DLB patients and the CAF scores. Although the CAF questionnaire remains validated as a measure of the frequency and duration of the cognitive fluctuations and has been used in numerous studies as a metric to examine the pathophysiological basis of cognitive fluctuations (McKeith et al., 2005; Bonanni et al., 2008; Taylor et al., 2012), it has been superseded by recent scales which may have better diagnostic utility in distinguishing flCog in DLB compared with AD (e.g., dementia cognitive fluctuation scale, Lee et al., 2014). Therefore, further studies by using more recent neuropsychological tests are warranted to investigate whether the fronto-thalamic structural connectivity alteration in DLB could be relevant to explain the impairment of the cognitive processes (necessary for consciousness) in DLB.
In line with literature (Bozzali et al., 2005; Kantarci et al., 2010; Lee et al., 2010), the inferior longitudinal fascicle was affected in both forms of dementia as compared with controls. This tract is a ventral associative bundle transmitting visual information from occipital areas to the temporal lobe (Catani et al., 2012). It plays an important role in visual object recognition and it is strongly implicated in disorder of visual perception (Catani et al., 2012). The degeneration of inferior longitudinal fascicle has been related to visual hallucinations in DLB patients (Kantarci et al., 2010). However, in the current study, we did not observe a significant relationship between WM damage within inferior longitudinal fascicle and the frequency and severity of visual hallucinations. Recent models and different neuroimaging studies on DLB have suggested that visual hallucinations could be more reliant upon dorsal network impairment (Taylor et al., 2012; Delli Pizzi et al., 2014b; Shine et al., 2014) and further investigation of this in DLB patients is warranted and whether these possible alterations were related to visual hallucinations. However, a limitation of our study, TRACULA does not allow the assessment of the dorsal visual pathway in its entirety. In particular, it is not able to detect the first and second branches of superior longitudinal fascicle (Yendiki et al., 2011), which are involved in visuo-spatial attention (Thiebaut de Schotten et al., 2011).
As compared to controls, the CCG (supracallosal bundle) was damaged in DLB but not in AD. The CCG bundles wrap around the corpus callosum from medial frontal cortex and anterior cingulate cortex to dorsal PCC (Greicius et al., 2009). Input from the frontal lobes modulates the level of dorsal posterior cingulated cortex activity, and consequently the top-down and bottom-up attentional signals (Bonnelle et al., 2012). In this way, the CCG bundles regulates the attentional focus, influencing the “metastability” of the brain as a whole and shifting the balance of attention along an internal/external and broad/narrow dimension (Leech and Sharp, 2014). Furthermore, the loss of the normal top-down cortico-cortical communication from the dorsal anterior cingulate cortex to the dorsal PCC has been associated to alterations in arousal and awareness (Horovitz et al., 2008, 2009; Larson-Prior et al., 2009; Boly et al., 2012). In this study, we found a relationship between the secondary processes of neurodegenration with supracallosal bundle (expressed by RD) and the thickness of the dorsal precuneus. Hence, the axonal neurodegeration of supracallosal bundle, probably related to demyelination process, could be linked to neuronal loss in the posterior cortical regions, which are relevant in DLB (Delli Pizzi et al., 2014b) and attention processing (Leech and Sharp, 2014).
As compared to controls, the angular (infracallosal) bundle was damaged in AD but not in DLB. The CAB connects the ventral PCC to temporal structures including the perforant path (the main input to the hippocampus, extending from the entorhinal cortex to dentate gyrus) and several other fibers reaching entorhinal cortex, parahippocampal gyrus, and associated areas (Thiebaut de Schotten et al., 2011; Leech and Sharp, 2014). The temporal structures (Jack et al., 1999; Janke et al., 2001) and the ventral PCC are highly affected in AD (Buckner et al., 2008). Particularly, metabolic abnormalities within these regions are related to amyloid deposition and to brain atrophy in a spatial distribution that reflects the default-mode network (Greicius et al., 2009). Furthermore, it was also observed that the functional connectivity within the default-mode network is reduced between PCC and hippocampal areas and this tract is particularly involved in internally directed cognition such as memory retrieval and planning, which are prevalently and prominently affected in AD (Buckner et al., 2008; Greicius, 2008).
Although AD affects primarily GM, WM disruption is also widespread (Scheltens et al., 1995; Smith et al., 2000; Gouw et al., 2008; Huang et al., 2012). In the current study, the profiles of DTI-metric changes within infracallosal bundle of AD patients and the poor correlation between WM and GM alteration suggest that heterogeneous pathologic processes such as axonal damage and breakdown of oligodendrocytes and myelin could be independent from neuronal loss in the cortex and subcortical structures.
Uncinate fasciculus was affected in both AD and DLB as compared to controls. This tracts connects the anterior temporal lobe with the orbital and polar frontal lobe including orbitofrontal area and inferior frontal gyrus (Catani et al., 2012). Uncinate fasciculus functions are linked to episodic memory, language and social-emotional processing (Catani et al., 2012). Its disruption has been reported in both AD and DLB (Serra et al., 2012). However, its contribution to these forms of dementia is still unclear. In the current study, we found a relationship between DTI metrics within uncinate fasciculus and the cortical thickness of (1) the PT and of the medio- and lateral-orbitofrontal gyrus in DLB patients and (2) the STG in AD patients. These findings suggest that the structural alteration within uncinate fasciculus of AD and DLB could be caused by cortical neuronal loss more than by direct WM injury. This hypothesis is in agreement with a recent paper by Serra et al. (2012), suggesting that the uncinate fascicle damage could be linked to GM atrophy in the medial temporal lobe structures and to memory impairment in AD and with prominent involvement of the frontal lobes in DLB.
In conclusion, different patterns of WM alteration were found in AD and DLB. In particular, the structural connectivity is affected within fronto-thalamic and fronto-parietal attentional network in DLB and within mnemonic pathways in AD. Furthermore, the high correlation between GM and WM metrics within ATR, supracallosal bundle and uncinate fasciculus suggests that the structural connectivity alteration in DLB could be linked to GM neuronal loss rather than by direct WM injury. Thus, this finding supports the key role of cortical and subcortical atrophy in DLB.
We must acknowledge that due to low sample size the proposed structural MRI protocol cannot be applied for clinical purposes, i.e., for differential diagnosis between DLB and AD, which would require the replication of the study on larger cohorts by different centers.
Author Contributions
Study design: LB, SP, MO. Subjects and data collection: LB, SP, MO, RF. Data Analysis: SP, RE, AT. Data interpretation: LB, SP, J-PT, MO, RF. Paper Drafting: SP, LB. Paper revising: RF, J-PT, RE, AT, AT, MO. Final approval of the version to be published: SP, RF, J-PT, RE, AT, AT, MO, LB. Agreement to be accountable for all aspects of the work in ensuring that questions related to the accuracy or integrity of any part of the work are appropriately investigated and resolved: SP, RF, J-PT, RE, AT, AT, MO, LB.
Conflict of Interest Statement
The authors declare that the research was conducted in the absence of any commercial or financial relationships that could be construed as a potential conflict of interest.
Funding
The work has been funded by the Italian Ministry of Health (Ministero della Salute). Award number GR-2010-2313418 Frontal circuit dysfunction as a marker of dementia in parkinsonism.
Supplementary Material
The Supplementary Material for this article can be found online at https://www.frontiersin.org/article/10.3389/fnagi.2015.00208
Footnotes
References
Boly, M., Moran, R., Murphy, M., Boveroux, P., Bruno, M. A., Noirhomme, Q., et al. (2012). Connectivity changes underlying spectral EEG changes during propofol-induced loss of consciousness. J. Neurosci. 32, 7082–7090. doi: 10.1523/JNEUROSCI.3769-11.2012
Bonanni, L., Thomas, A., Tiraboschi, P., Perfetti, B., Varanese, S., and Onofrj, M. (2008). EEG comparisons in early Alzheimer’s disease, dementia with Lewy bodies and Parkinson’s disease with dementia patients with a 2-year follow-up. Brain 131, 690–705. doi:10.1093/brain/awm322
Bonnelle, V., Ham, T. E., Leech, R., Kinnunen, K. M., Mehta, M. A., Greenwood, R. J., et al. (2012). Salience network integrity predicts default mode network function after traumatic brain injury. Proc. Natl. Acad. Sci. U.S.A. 109, 4690–4695. doi:10.1073/pnas.1113455109
Bosch, B., Arenaza-Urquijo, E. M., Rami, L., Sala-Llonch, R., Junqué, C., Solé-Padullés, C., et al. (2012). Multiple DTI index analysis in normal aging, amnestic MCI and AD. Relationship with neuropsychological performance. Neurobiol. Aging 33, 61–74. doi:10.1016/j.neurobiolaging.2010.02.004
Bozzali, M., Falini, A., Cercignani, M., Baglio, F., Farina, E., Alberoni, M., et al. (2005). Brain tissue damage in dementia with Lewy bodies: an in vivo diffusion tensor MRI study. Brain 28, 1595–1604. doi:10.1093/brain/awh493
Buckner, R. L., Andrews-Hanna, J. R., and Schacter, D. L. (2008). The brain’s default network: anatomy, function, and relevance to disease. Ann. N. Y. Acad. Sci. 1124, 1–38. doi:10.1196/annals.1440.011
Calderon, J., Perry, R. J., Erzinclioglu, S. W., Berrios, G. E., Dening, T. R., and Hodges, J. R. (2001). Perception, attention, and working memory are disproportionately impaired in dementia with Lewy bodies compared with Alzheimer’s disease. J. Neurol. Neurosurg. Psychiatry 70, 157–164. doi:10.1136/jnnp.70.2.157
Catani, M., Dell’acqua, F., Bizzi, A., Forkel, S. J., Williams, S. C., Simmons, A., et al. (2012). Beyond cortical localization in clinico-anatomical correlation. Cortex 48, 1262–1287. doi:10.1016/j.cortex.2012.07.001
Collerton, D., Burn, D., McKeith, I., and O’Brien, J. T. (2003). Systematic review and meta-analysis show that dementia with Lewy bodies is a visualperceptual and attentional-executive dementia. Dement. Geriatr. Cogn. Disord. 16, 229–237. doi:10.1159/000072807
Cummings, J. L., Mega, M., Gray, K., Rosenberg-Thompson, S., Carusi, D. A., and Gornbein, J. (1994). The neuropsychiatric inventory: comprehensive assessment of psychopathology in dementia. Neurology 44, 2308–2314. doi:10.1212/WNL.44.12.2308
Declaration of Helsinki. (1997). Recommendation Guiding Physicians in Biomedical Research involving human subjects. JAMA 277, 925–926. doi:10.1001/jama.1997.03540350075038
Delli Pizzi, S., Maruotti, V., Taylor, J. P., Franciotti, R., Caulo, M., Tartaro, A., et al. (2014a). Relevance of subcortical visual pathways disruption to visual symptoms in dementia with Lewy bodies. Cortex 59, 12–21. doi:10.1016/j.cortex.2014.07.003
Delli Pizzi, S., Franciotti, R., Tartaro, A., Caulo, M., Thomas, A., Onofrj, M., et al. (2014b). Structural alteration of the dorsal visual network in DLB patients with visual hallucinations: a cortical thickness MRI study. PLoS ONE 9:e86624. doi:10.1371/journal.pone.0086624
Delli Pizzi, S., Franciotti, R., Taylor, J. P., Thomas, A., Tartaro, A., Onofrj, M., et al. (2015). Thalamic involvement in fluctuating cognition in dementia with Lewy bodies: magnetic resonance evidences. Cereb. Cortex 25, 3682–3689. doi:10.1093/cercor/bhu220
Desikan, R. S., Ségonne, F., Fischl, B., Quinn, B. T., Dickerson, B. C., Blacker, D., et al. (2006). An automated labeling system for subdividing the human cerebral cortex on MRI scans into gyral based regions of interest. Neuroimage 31, 968–980. doi:10.1016/j.neuroimage.2006.01.021
Dubois, B., Slachevsky, A., Litvan, I., and Pillon, B. (2000). The FAB: a frontal assessment battery at bedside. Neurology 55, 1621–1626. doi:10.1212/WNL.55.11.1621
Fahn, S., and Elton, R. L. (1987). “Members of the unified Parkinson’s disease rating scale development committee,” in Recent Development in Parkinson’s Disease. Unified Parkinson’s Disease Rating Scale, eds S. Fahn, C. D. Marsden, D. B. Calne, and M. Goldstein (Florham Park, NJ: Macmillan Healthcare Information), 153–164.
Fazekas, F., Chawluk, J. B., Alavi, A., Hurtig, H. I., and Zimmerman, R. A. (1987). MR signal abnormalities at 1.5 T in Alzheimer’s dementia and normal aging. AJR Am. J. Roentgenol. 149, 351–356. doi:10.2214/ajr.149.2.351
Ferman, T. J., Smith, G. E., Boeve, B. F., Graff-Radford, N. R., Lucas, J. A., Knopman, D. S., et al. (2006). Neuropsychological differentiation of dementia with Lewy bodies from normal aging and Alzheimer’s disease. Clin. Neuropsychol. 20, 623–636. doi:10.1080/13854040500376831
Fischl, B., and Dale, A. M. (2000). Measuring the thickness of the human cerebral cortex from magnetic resonance images. Proc. Natl. Acad. Sci. U.S.A. 97, 11044–11049. doi:10.1073/pnas.200033797
Folstein, M. F., Folstein, S. E., and McHugh, P. R. (1975). Mini-mental state. A practical method for grading the cognitive state of patients for the clinician. J. Psychiatr. Res. 12, 189–198. doi:10.1016/0022-3956(75)90026-6
Franciotti, R., Falasca, N. W., Bonanni, L., Anzellotti, F., Maruotti, V., Comani, S., et al. (2013). Default network is not hypoactive in dementia with fluctuating cognition: an Alzheimer disease/dementia with Lewy bodies comparison. Neurobiol. Aging 34, 1148–1158. doi:10.1016/j.neurobiolaging.2012.09.015
Galvin, J. E., Price, J. L., Yan, Z., Morris, J. C., and Sheline, Y. I. (2011). Resting bold fMRI differentiates dementia with Lewy bodies vs Alzheimer disease. Neurology 76, 1797–1803. doi:10.1212/WNL.0b013e31821ccc83
Gouw, A. A., Seewann, A., Vrenken, H., van der Flier, W. M., Rozemuller, J. M., Barkhof, F., et al. (2008). Heterogeneity of white matter hyperintensities in Alzheimer’s disease: post-mortem quantitative MRI and neuropathology. Brain 131, 3286–3298. doi:10.1093/brain/awn265
Greicius, M. (2008). Resting-state functional connectivity in neuropsychiatric disorders. Curr. Opin. Neurol. 21, 424–430. doi:10.1097/WCO.0b013e328306f2c5
Greicius, M. D., Supekar, K., Menon, V., and Dougherty, R. F. (2009). Resting-state functional connectivity reflects structural connectivity in the default mode network. Cereb. Cortex 19, 72–78. doi:10.1093/cercor/bhn059
Hattori, T., Orimo, S., Aoki, S., Ito, K., Abe, O., Amano, A., et al. (2012). Cognitive status correlates with white matter alteration in Parkinson’s disease. Hum. Brain Mapp. 33, 727–739. doi:10.1002/hbm.21245
Horovitz, S. G., Braun, A. R., Carr, W. S., Picchioni, D., Balkin, T. J., Fukunaga, M., et al. (2009). Decoupling of the brain’s default mode network during deep sleep. Proc. Natl. Acad. Sci. U.S.A. 106, 11376–11381. doi:10.1073/pnas.0901435106
Horovitz, S. G., Fukunaga, M., De Zwart, J. A., Van Gelderen, P., Fulton, S. C., Balkin, T. J., et al. (2008). Low frequency BOLD fluctuations during resting wakefulness and light sleep: a simultaneous EEG-fMRI study. Hum. Brain Mapp. 29, 671–682. doi:10.1002/hbm.20428
Huang, H., Fan, X., Weiner, M., Martin-Cook, K., Xiao, G., Davis, J., et al. (2012). Distinctive disruption patterns of white matter tracts in Alzheimer’s disease with full diffusion tensor characterization. Neurobiol. Aging 33, 2029–2045. doi:10.1016/j.neurobiolaging.2011.06.027
Jack, C. R. Jr., Petersen, R. C., Xu, Y. C., O’Brien, P. C., Smith, G. E., Ivnik, R. J., et al. (1999). Prediction of AD with MRI-based hippocampal volume in mild cognitive impairment. Neurology 52, 1397–1403. doi:10.1212/WNL.52.7.1397
Janke, A. L., de Zubicaray, G., Rose, S. E., Griffin, M., Chalk, J. B., and Galloway, G. J. (2001). 4D deformation modeling of cortical disease progression in Alzheimer’s dementia. Magn. Reson. Med. 46, 661–666. doi:10.1002/mrm.1243
Jones, D. K., Knösche, T. R., and Turner, R. (2013). White matter integrity, fiber count, and other fallacies: the do’s and don’ts of diffusion MRI. Neuroimage 73, 239–254. doi:10.1016/j.neuroimage.2012.06.081
Jurica, P. J., Leitten, C. L., and Mattis, S. (2001). Dementia Rating Scale-2 (DRS-2). Odessa, FL: Psychological Assessment Resources.
Kantarci, K., Avula, R., Senjem, M. L., Samikoglu, A. R., Zhang, B., Weigand, S. D., et al. (2010). Dementia with Lewy bodies and Alzheimer disease: neurodegenerative patterns characterized by DTI. Neurology 74, 1814–1821. doi:10.1212/WNL.0b013e3181e0f7cf
Kenny, E. R., Blamire, A. M., Firbank, M. J., and O’Brien, J. T. (2012). Functional connectivity in cortical regions in dementia with Lewy bodies and Alzheimer’s disease. Brain 135, 569–581. doi:10.1093/brain/awr327
Kenny, E. R., O’Brien, J. T., Firbank, M. J., and Blamire, A. M. (2013). Subcortical connectivity in dementia with Lewy bodies and Alzheimer’s disease. Br. J. Psychiatry 203, 209–214. doi:10.1192/bjp.bp.112.108464
Larson-Prior, L. J., Zempel, J. M., Nolan, T. S., Prior, F. W., Snyder, A. Z., and Raichle, M. E. (2009). Cortical network functional connectivity in the descent to sleep. Proc. Natl. Acad. Sci. U.S.A. 106, 4489. doi:10.1073/pnas.0900924106
Lee, D. R., McKeith, I., Mosimann, U., Ghosh-Nodial, A., Grayson, L., Wilson, B., et al. (2014). The dementia cognitive fluctuation scale, a new psychometric test for clinicians to identify cognitive fluctuations in people with dementia. Am. J. Geriatr. Psychiatry 22, 926–935. doi:10.1016/j.jagp.2013.01.072
Lee, J. E., Park, H. J., Park, B., Song, S. K., Sohn, Y. H., Lee, J. D., et al. (2010). A comparative analysis of cognitive profiles and white-matter alterations using voxel-based diffusion tensor imaging between patients with Parkinson’s disease dementia and dementia with Lewy bodies. J. Neurol. Neurosurg. Psychiatry 81, 320–326. doi:10.1136/jnnp.2009
Leech, R., and Sharp, D. J. (2014). The role of the posterior cingulate cortex in cognition and disease. Brain 137, 12–32. doi:10.1093/brain/awt162
León-Domínguez, U., Vela-Bueno, A., Froufé-Torres, M., and León-Carrión, J. (2013). A chronometric functional sub-network in the thalamo-cortical system regulates the flow of neural information necessary for conscious cognitive processes. Neuropsychologia 51, 1336–1349. doi:10.1016/j.neuropsychologia.2013.03.012
McKeith, I. G., Dickson, D. W., Lowe, J., Emre, M., O’Brien, J. T., Feldman, H., et al. (2005). Diagnosis and management of dementia with Lewy bodies: third report of the DLB Consortium. Neurology 65, 1863–1872. doi:10.1212/01.wnl.0000187889.17253.b1
McKhann, G., Drachman, D., Folstein, M., Katzman, R., Price, D., and Stadlan, E. M. (1984). Clinical diagnosis of Alzheimer’s disease: report of the NINCDS-ADRDA Work Group under the auspices of Department of Health and Human Services Task Force on Alzheimer’s Disease. Neurology 34, 939–944. doi:10.1212/WNL.34.7.939
Morris, J. C. (1993). The Clinical Dementia Rating (CDR): current version and scoring rules. Neurology 43, 2412–2414. doi:10.1212/WNL.43.11.2412-a
Ota, M., Sato, N., Ogawa, M., Murata, M., Kuno, S., Kida, J., et al. (2009). Degeneration of dementia with Lewy bodies measured by diffusion tensor imaging. NMR. Biomed. 22, 280–284. doi:10.1002/nbm.1321
Patenaude, B., Smith, S. M., Kennedy, D. N., and Jenkinson, M. (2011). A Bayesian model of shape and appearance for subcortical brain segmentation. Neuroimage 56, 907–922. doi:10.1016/j.neuroimage.2011.02.046
Peraza, L. R., Kaiser, M., Firbank, M., Graziadio, S., Bonanni, L., Onofrj, M., et al. (2014). fMRI resting state networks and their association with cognitive fluctuations in dementia with Lewy bodies. Neuroimage Clin. 4, 558–565. doi:10.1016/j.nicl.2014.03.013
Pierpaoli, C., Barnett, A., Pajevic, S., Chen, R., Penix, L. R., Virta, A., et al. (2001). Water diffusion changes in Wallerian degeneration and their dependence on white matter architecture. Neuroimage 13, 1174–1185. doi:10.1006/nimg.2001.0765
Pierpaoli, C., Jezzard, P., Basser, P. J., Barnett, A., and Di Chiro, G. (1996). Diffusion tensor MR imaging of the human brain. Radiology 201, 637–648. doi:10.1148/radiology.201.3.8939209
Scheltens, P., Barkhof, F., Leys, D., Wolters, E. C., Ravid, R., and Kamphorst, W. (1995). Histopathologic correlates of white matter changes on MRI in Alzheimer’s disease and normal aging. Neurology 45, 883–888. doi:10.1212/WNL.45.5.883
Serra, L., Cercignani, M., Basile, B., Spanò, B., Perri, R., Fadda, L., et al. (2012). White matter damage along the uncinate fasciculus contributes to cognitive decline in AD and DLB. Curr. Alzheimer Res. 9, 326–333. doi:10.2174/156720512800107555
Shine, J. M., O’Callaghan, C., Halliday, G. M., and Lewis, S. J. (2014). Tricks of the mind: visual hallucinations as disorders of attention. Prog. Neurobiol. 116, 58–65. doi:10.1016/j.pneurobio.2014.01.004
Smith, C. D., Snowdon, D. A., Wang, H., and Markesbery, W. R. (2000). White matter volumes and periventricular white matter hyperintensities in aging and dementia. Neurology 54, 838–842. doi:10.1212/WNL.54.4.838
Smith, S. M., Jenkinson, M., Woolrich, M. W., Beckmann, C. F., Behrens, T. E., Johansen-Berg, H., et al. (2004). Advances in functional and structural MR image analysis and implementation as FSL. Neuroimage 23, 208–219. doi:10.1016/j.neuroimage.2004.07.051
Song, S. K., Sun, S. W., Ju, W. K., Lin, S. J., Cross, A. H., and Neufeld, A. H. (2003). Diffusion tensor imaging detects and differentiates axon and myelin degeneration in mouse optic nerve after retinal ischemia. Neuroimage 20, 1714–1722. doi:10.1016/j.neuroimage.2003.07.005
Song, S. K., Sun, S. W., Ramsbottom, M. J., Chang, C., Russell, J., and Cross, A. H. (2002). Dysmyelination revealed through MRI as increased radial (but unchanged axial) diffusion of water. Neuroimage 17, 1429–1436. doi:10.1006/nimg.2002.1267
Taylor, J. P., Firbank, M. J., He, J., Barnett, N., Pearce, S., Livingstone, A., et al. (2012). Visual cortex in dementia with Lewy bodies: magnetic resonance imaging study. Br. J. Psychiatry 200, 491–498. doi:10.1192/bjp.bp.111.099432
Thiebaut de Schotten, M., Dell’Acqua, F., Forkel, S. J., Simmons, A., Vergani, F., Murphy, D. G., et al. (2011). A lateralized brain network for visuospatial attention. Nat. Neurosci. 14, 1245–1246. doi:10.1038/nn.2905
Tomasi, D., Wang, R. L., Telang, F., Boronikolas, V., Jayne, M. C., Wang, G. J., et al. (2009). Impairment of attentional networks after 1 night of sleep deprivation. Cereb. Cortex 19, 233–240. doi:10.1093/cercor/bhn073
Vann Jones, S. A., and O’Brien, J. T. (2014). The prevalence and incidence of dementia with Lewy bodies: a systematic review of population and clinical studies. Psychol. Med. 44, 673–683. doi:10.1017/S0033291713000494
Wakana, S., Caprihan, A., Panzenboeck, M. M., Fallon, J. H., Perry, M., Gollub, R. L., et al. (2007). Reproducibility of quantitative tractography methods applied to cerebral white matter. Neuroimage 36, 630–644. doi:10.1016/j.neuroimage.2007.02.049
Walker, M. P., Ayre, G. A., Cummings, J. L., Wesnes, K., McKeith, I. G., O’Brien, J. T., et al. (2000). The clinician assessment of fluctuation and the one day fluctuation assessment scale. Two methods to assess fluctuating confusion in dementia. Br. J. Psychiatry 177, 252–256. doi:10.1192/bjp.177.3.252
Ward, L. M. (2011). The thalamic dynamic core theory of conscious experience. Conscious. Cogn. 20, 464–486. doi:10.1016/j.concog.2011.01.007
Wassermann, D., Rathi, Y., Bouix, S., Kubicki, M., Kikinis, R., Shenton, M., et al. (2011). White matter bundle registration and population analysis based on Gaussian processes. Inf. Process. Med. Imaging 22, 320–332.
Watson, R., Blamire, A. M., Colloby, S. J., Wood, J. S., Barber, R., He, J., et al. (2012). Characterizing dementia with Lewy bodies by means of diffusion tensor imaging. Neurology 79, 906–914. doi:10.1212/WNL.0b013e318266fc51
Wheeler-Kingshott, C. A., and Cercignani, M. (2009). About “axial” and “radial” diffusivities. Magn. Reson. Med. 61, 1255–1260. doi:10.1002/mrm.21965
World Health Organization. (1992). The ICD-10 Classification of Mental and Behavioural Disorders. Geneva: World Health Organization.
Yeatman, J. D., Dougherty, R. F., Myall, N. J., Wandell, B. A., and Feldman, H. M. (2012). Tract profiles of white matter properties: automating fiber-tract quantification. PLoS ONE 7:e49790. doi:10.1371/journal.pone.0049790
Yendiki, A., Koldewyn, K., Kakunoori, S., Kanwisher, N., and Fischl, B. (2013). Spurious group differences due to head motion in a diffusion MRI study. Neuroimage 88, 79–90. doi:10.1016/j.neuroimage.2013.11.027
Keywords: Alzheimer’s disease, dementia with Lewy bodies, diffusion tensor imaging, magnetic resonance imaging, structural connectivity
Citation: Delli Pizzi S, Franciotti R, Taylor J-P, Esposito R, Tartaro A, Thomas A, Onofrj M and Bonanni L (2015) Structural connectivity is differently altered in dementia with Lewy body and Alzheimer’s disease. Front. Aging Neurosci. 7:208. doi: 10.3389/fnagi.2015.00208
Received: 23 August 2015; Accepted: 16 October 2015;
Published: 02 November 2015
Edited by:
Isidro Ferrer, University of Barcelona, SpainReviewed by:
Valentina Echeverria Moran, Bay Pines VA Medical Center, USAFederica Agosta, San Raffaele Scientific Institute and Vita-Salute San Raffaele University, Italy
Copyright: © 2015 Delli Pizzi, Franciotti, Taylor, Esposito, Tartaro, Thomas, Onofrj and Bonanni. This is an open-access article distributed under the terms of the Creative Commons Attribution License (CC BY). The use, distribution or reproduction in other forums is permitted, provided the original author(s) or licensor are credited and that the original publication in this journal is cited, in accordance with accepted academic practice. No use, distribution or reproduction is permitted which does not comply with these terms.
*Correspondence: Laura Bonanni, l.bonanni@unich.it