How the cortex gets its folds: an inside-out, connectivity-driven model for the scaling of mammalian cortical folding
- 1 Instituto de Ciências Biomédicas, Universidade Federal do Rio de Janeiro, Rio de Janeiro, Brazil
- 2 Instituto Nacional de Neurociência Translacional, São Paulo, Brazil
Larger mammalian cerebral cortices tend to have increasingly folded surfaces, often considered to result from the lateral expansion of the gray matter (GM), which, in a volume constrained by the cranium, causes mechanical compression that is relieved by inward folding of the white matter (WM), or to result from differential expansion of cortical layers. Across species, thinner cortices, presumably more pliable, would offer less resistance and hence become more folded than thicker cortices of a same size. However, such models do not acknowledge evidence in favor of a tension-based pull onto the GM from the inside, holding it in place even when the constraint imposed by the cranium is removed. Here we propose a testable, quantitative model of cortical folding driven by tension along the length of axons in the WM that assumes that connections through the WM are formed early in development, at the same time as the GM becomes folded, and considers that axonal connections through the WM generate tension that leads to inward folding of the WM surface, which pulls the GM surface inward. As an important necessary simplifying hypothesis, we assume that axons leaving or entering the WM do so approximately perpendicularly to the WM–GM interface. Cortical folding is thus driven by WM connectivity, and is a function of the fraction of cortical neurons connected through the WM, the average length, and the average cross-sectional area of the axons in the WM. Our model predicts that the different scaling of cortical folding across mammalian orders corresponds to different combinations of scaling of connectivity, axonal cross-sectional area, and tension along WM axons, instead of being a simple function of the number of GM neurons. Our model also explains variations in average cortical thickness as a result of the factors that lead to cortical folding, rather than as a determinant of folding; predicts that for a same tension, folding increases with connectivity through the WM and increased axonal cross-section; and that, for a same number of neurons, higher connectivity through the WM leads to a higher degree of folding as well as an on average thinner GM across species.
Introduction
Across different mammalian orders and species, adult brain cerebral cortices vary over several orders of magnitude in size, becoming more folded as their size increases. Already in the late eighteenth century, Franz Gall acknowledged that cortical folding, and thus the non-isometrical expansion of the cerebral cortical gray matter (GM), allowed a faster increase in number of neurons than would be granted by increased cranial volume alone if the cortical surface expanded isometrically, or simply as a balloon would (Gross, 1999). Later, His (1874) considered that cerebral shape could be explained by unequal growth, competing volume demands, and resulting tension of different brain structures.
Cortical folding has since been considered to increase with brain size as the GM expands laterally and supposedly pushes inward the underlying white matter (WM; Le Gros Clark, 1945), specially given the constraint imposed by the skull (Welker, 1990). Because the distribution of neurons beneath the cortical surface has traditionally been considered to be constant across species (Rockel et al., 1980), cortical folding would thus be a direct function of the number of neurons in the cortex. This is in line with the usual expectation that elephants and large cetaceans, with larger brains than humans, have larger numbers of cortical neurons in their more folded cortices than humans do.
Contrary to these traditional views, however, we have recently shown that cortical size is not a uniform function of the number of cortical neurons across mammals. Using the isotropic fractionator to determine numbers of brain neurons (Herculano-Houzel and Lent, 2005), we find that cortical mass increases much faster in rodents than in primates as the cerebral cortex gains neurons across species (Herculano-Houzel et al., 2006, 2007, 2011; Gabi et al., 2010), which is due to an increase in average neuronal cell size in larger-brained rodents while there is barely any increase in average neuronal cell size in larger-brained primates (Herculano-Houzel, 2011). As a result, neuronal densities are larger in primate cortices than in rodent cortices of a comparable size (Herculano-Houzel, 2011). Moreover, we recently showed that the number of neurons beneath the cortical surface is not constant across primate species as previously thought (Herculano-Houzel et al., 2008), and is also not constant across rodents, actually decreasing in larger brains (Ventura, Mota, and Herculano-Houzel, to be submitted), which means that there is not a single relationship that applies between cortical surface area and number of cortical neurons across mammals. The combination of these findings leaves one no longer any reason to expect cortical folding to be a simple, homogeneous function of increased numbers of cortical neurons across mammals. For instance, although large cetacean and artiodactyla brains have more folded cerebral cortices than similar sized primate brains, they probably have not more but rather far fewer neurons in the cortex than primates, due to their very low neuronal densities (Tower, 1954; Herculano-Houzel, 2009; and our unpublished observations).
This is not to say, however, that cortical folding is not driven by a shared, conserved mechanism across mammalian species. In fact, our recent work on the scaling of the subcortical WM in primates as a function of their numbers of cerebral cortical neurons unexpectedly led us to realize that cortical folding can be universally predicted as a function of not simply the total number of cortical neurons, but of the number of cortical neurons that are connected through the WM compounded with the average caliber of their axons in the WM and the tension in these axons (Herculano-Houzel et al., 2010). Cortical folding, according to this view, would not be driven by the GM, but rather primarily by tension in the WM.
A qualitative, tension-based theory of cortical morphogenesis was first proposed by Van Essen (1997), taking into consideration the patterns of connectivity between cortical areas. His connectivity-driven hypothesis for the placement of cortical folds accounts for the consistent formation of convolutions in a species-specific pattern. It does not, however, explain the increased cortical folding that accompanies increasing cortical size across species; Van Essen himself still resorted to a GM driven mechanism to account for that. There are, however, a number of other evidences against a GM driven mechanism of cortical folding. Partial removal of the skull during development does not have a dramatic effect on the fissure pattern, and lesion experiments suggest that cortical folding is not primarily dependent on a disproportionate growth between cortical and subcortical structures (reviewed in Kaas, 2009). Thus, the primary source of fissure formation must be sought in factors within the cortex itself – or underneath it.
Based on our findings on the scaling of cortical connectivity and WM volume in primates (Herculano-Houzel et al., 2010), we proposed in that paper an extension of Van Essen’s qualitative tension-based theory of cortical folding to explain quantitatively how increased folding accompanies increasing cortical size across primate species. According to our model, rather than driving the folding of the WM surface, the folding of the external surface of the GM results from folding of the WM surface, which, in turn, results from increased tension within the WM due to increased numbers of axons composing the WM depending on their physical properties of caliber and tension. Our model is quantitative; acknowledges that the cortex scales differently in size across mammalian orders as different power functions of its number of neurons; is therefore applicable, in principle, to all mammalian species; and makes easily testable predictions for all of them. The following is a description of the model, its assumptions, and a discussion of its implications and predictions, and how they can be tested.
Assumptions and Rationale
So far, we have found the size of the different brain structures, the numbers of cells that compose them, and their average densities, and therefore average cell size, to be parameters related to one another by power functions (Herculano-Houzel et al., 2006, 2007, 2011; Sarko et al., 2009; Gabi et al., 2010). Generically, one should expect brain and cortical allometric scaling rules that are valid over several orders of magnitude across species within a particular mammalian order to take the form of power laws (i.e., relating measurable quantities “x” and “y” by y = kxa). This is because relations which are expected to remain valid over many orders of magnitude should not be given in terms of parameters that specify a particular size scale, that is, they should be scale-independent. As can be easily demonstrated, a one-variable function is scale-independent if and only if it is a power law. We therefore expect to find the scaling rules that determine cortical folding to also be scale-invariant, and therefore power laws.
Even more importantly, we assume that the number of neuronal cells is the main free parameter that coordinates the scaling of every other quantity of interest, measurable, or estimated. There are several reasons for this assumption. First, neurons, rather than glia, are the first cells to populate the developing brain in large numbers, and their connectivity begins to be established at the same time as convolutions begin to form, even before the final neuronal complement is in place (Goldman-Rakic, 1980; Goldman-Rakic and Rakic, 1984). Therefore, and in contrast to most earlier studies on brain allometry that implicitly or explicitly regarded the number of neurons as a consequence of brain size, we believe instead that any biologically plausible model of brain allometry must consider brain size, in all its aspects, to be a consequence of its number of neurons, according to scaling laws that may vary across different phyla. Second, we have found that, in contrast to the order- and structure-specific neuronal scaling rules, the scaling of different brain structures seems to occur as a universally shared function of their numbers of glial cells, both across orders and structures (Herculano-Houzel, 2011). This result, combined with the late onset of gliogenesis in post-natal development (Sauvageot and Stiles, 2002), suggests that we can assume that cortical composition is determined essentially by the number of neurons and their average mass (which is itself closely related to the number of neurons by an order-specific power law); after neurogenesis, nearly invariant glia will then infiltrate the intraneuronal space in proportion to the total neuronal mass (Herculano-Houzel, 2011). The development of an adult mammalian cortex can then be viewed as a process whereby total numbers of neurons, numbers of neurons connected through the WM, their size (which includes the soma, all dendrites, and an axon of a particular caliber), and cortical folding vary in lockstep, over an invariant background of glia.
Our model thus assumes that all parameters related to cortical scaling and folding can be described as power functions of the total number of cortical neurons. Note that the fact that general allometric rules exist for cortical morphology in each order, expressible as power laws of their number of neurons, does not mean that the latter is the only significant degree of freedom in brain or cortical evolution. Rather, the power laws tell us that any other significant degrees of freedom must be present either at a substructure level, thus being erased by measurements that average over the entire structure, or at the microscopic level of detailed connectivity, which is not accessible to our methods, but also not relevant to the model at hand.
Our model, as presented for cross-species comparisons, considers total cortical volumes and areas, and average values of neuronal density and cortical thickness for the whole cortex, in line with the empirical studies that generated the numerical data used here (Herculano-Houzel et al., 2006, 2007, 2010, 2011; Sarko et al., 2009). Neuronal density is now known to vary across the cortical surface within primate species (Collins et al., 2010), and it is known that cortical thickness and gyrification also vary across the cortex (Zilles et al., 1988; Toro et al., 2008). However, comparative studies on the scaling of cortical gyrification traditionally analyze whole-brain patterns (Hofman, 1985; Pillay and Manger, 2007), and attempts to understand the scaling of cortical gyrification have similarly been directed toward whole-brain comparisons. We therefore developed our model based on average values for whole cortex that can be compared across orders, but predict that the scaling rules proposed here to govern gyrification at the level of the whole cortex might also be applicable at the local level across cortical areas.
White matter is largely composed of axons connecting neurons in the GM, mostly with each other but also with subcortical structures, along with the glial cells that support their function. The volume of each axon is simply its cross-sectional area multiplied by its length. If there is no significant correlation between these two latter quantities (which can be proven mathematically that will be the case when axon bundle volume is constrained and average signal propagation time is minimized), then the total axonal volume is the product of average axon cross-section area a, the average axonal length l, and the total number of axons present in the WM. We can assume further that the volume of the intra-axonal space, including in particular the myelin sheath and the myelinating oligodendrocytes, is proportional to axonal volume, given the experimental support for a linear relation between axon diameter and myelin sheath diameter (Sadahiro et al., 2000). Using the common assumption of a linear relation between total number of oligodendrocytes and the total axon length (Barres and Raff, 1994, 1999), then the total volume of the WM can be written to scale with the product of the total axon length (or total number of oligodendrocytes) and average axonal cross-sectional area.
We also assume that WM axons intersect the surface of the WM–GM interface in a perpendicular direction. This is a simplifying assumption, since it can observed from direct imagery that multiple fiber orientations can be present very close to each other even at the WM–GM interface. However, we believe on theoretical grounds that this is a reasonable if imperfect approximation of a somewhat more complex anatomical reality. Indeed, axons typically cross this interface in parallel bundles (Mori et al., 2002), which are the most volume-economical way of building such surface; in a growing cortex the combination of axonal longitudinal tension, WM hydrostatic pressure, and WM–GM interface surface tension should align most bundles very close to perpendicularly to the interface. We must make this assumption because we are unfortunately aware of no systematic studies of the distribution axonal incidence angles in the literature, although published diffusion tensor imaging tracing studies show a clear (but unquantified) preference for perpendicular angles of incidence (for instance, Mori et al., 2002). A systematic variation in the average incidence angle across species would alter our results somewhat, but not appreciably except for a very large range of values1.
Finally, our model assumes that connections through the WM are formed early in development, at the same time as the GM becomes folded, an assumption that is supported by experimental evidence (reviewed in Welker, 1990); that most axons in mammalian cortical WM are myelinated (Olivares et al., 2001); and that most of the WM volume amounts to myelinated axons (Wang et al., 2008), thus neglecting the contribution to the volume of (small) non-myelinated fibers in the WM.
The Model
We consider that the surface of the WM–GM interface, with total area AW, is crossed nearly perpendicularly by most axons leaving or entering the WM, of an average cross-sectional area a, and which, together with the ensheathing glial cells, comprise the entirety of the WM surface. AW can thus be quantified as the product of the number of cortical neurons, N; the fraction n of these neurons that are connected through the WM; and their cross-sectional area, a (Figure 1). Thus,

where γ is the average cosine of the incidence angle of axons at the WM–GM interface. The value of γ is of course 1 in the simplified case of perfectly orthogonal incidence, and presumably close to 1 in reality. The WM volume VW is the sum total of the volumes of all fibers and is thus equal to one half of the product of AW and the average axonal length in the WM, l, such that

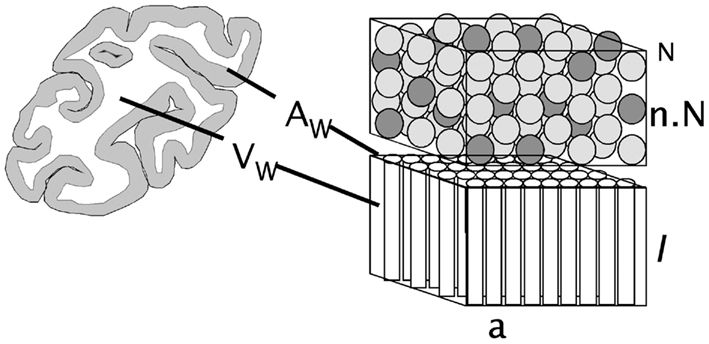
Figure 1. Schematic of the cortical layout used in the model. The two volumes on the right illustrate the cortical gray matter (top) and white matter (bottom). The gray matter is composed of an N number of neurons, a fraction n of which are connected through the white matter (darker gray), either sending or receiving axons (of an average cross-sectional area a) through it. Glial cells, which have been found to be distributed at a fairly constant density across species (Herculano-Houzel, 2011), are not shown. The surface area of the interface between the gray and white matter, AW, is given as the product nNa, and the volume of the white matter, VW, is proportional to the product of AW and the average axonal length in the white matter, l.
Note that the average value of axonal length is given by l = 2Vw/γAw. A direct measurement of γ would provide us with a direct measurement of l for each species. Assuming γ = 1, then l can be obtained from the existing measurements of Vw and Aw. Strictly speaking, these quantities are only lower bounds on the average axonal lengths; if however γ ≈ 1 as we postulate, they can be taken as good approximations of their actual values.
If the WM scales under tension, the cubic root of its volume should increase more slowly than the square root of its surface area, leading to deformation of the latter, that is, to folding of the GM–WM surface. To quantify the extent of WM folding, we define a folding index FW, which is the ratio between the actual WM surface, AW, and the exposed surface expected from its volume (9π/2)1/3VW2/3.
Thus, a FW value of exactly one implies a spherical WM, and larger values imply more convoluted forms. Importantly, notice that it is not necessary to model the cerebrum as a sphere for the 2/3 scaling relationship between its surface area and volume to hold; a volume of any shape that scaled isometrically would have the same scaling relationship of 2/3. In this case of isometric growth, which would ensue if the WM did not scale under tension, then we would expect FW to be invariant as function of N.
Now, considering that a, n, and l are themselves related to N as power functions such that a ∼ Nα, n ∼ Nc, and l ∼ Nλ, the relationships above can be entirely rewritten as power functions of N:
Note that if we took into account a systematic variation of the incidence angle of fibers at the GM–WM interface as a power law of N, we would have to introduce a (non-zero) new coefficient at the expression for Aw. There is unfortunately currently no experimental way of estimating the value of such coefficient. We have assumed throughout that it is small enough to be disregarded, but should it prove to be otherwise we will have to recalculate the other coefficients accordingly, and revisit the conclusion obtained.
Simultaneously, for cortices with average GM thickness T much smaller than the cortical characteristic length so that the internal and external areas of GM scale linearly (that is, AG ∝ AW), T can be defined as simply the ratio between the volume of the GM, VG, and area of the GM–WM interface, AW. Given that VG scales as a power function of N, with Nv, then
and therefore cortical thickness T scales with Nt, such that

Instead of v, we can use a more biologically meaningful parameter d, which is the exponent relating neuronal density D in the GM to N, given that VG = N·D−1 and that D ∼ Nd. Because VG ∼ N1−d, then v = 1 − d, and the equation above becomes

Average cortical thickness, therefore, scales a function of a GM-related variable (the scaling of neuronal density with N), and two WM-related variables that, together with N, determine WM folding (the scaling of connectivity and of axonal cross-sectional area with N). Remarkably, cortical thickness is therefore not itself a function of N, but rather of how exponents d, c, and α are interrelated.
Finally, the extent of GM folding, FG, can be expressed as the ratio between its actual surface, AG (which can be written as proportional to VG/T, or N1−d−t), and the exposed surface expected from the total volume (VG + VW)2/3:

Note that although this equation is not an exact power law, it can in practice be well approximated by one since VW and VG scale in fairly similar ways with N. Another way to express FG, now as an exact power law, is by writing the total volume VT = VG + VW itself as a measurable power function of N, varying with Nz. In this case, FG becomes
Returning to the first equation of FG, and recalling that t = −d−c−α, GM folding is thus a combined function of the number of cortical neurons; the fraction of these neurons that are connected through the WM; and the average cross-section area of the axons in the WM. Further, the thickness of the GM is thus a consequence of some of the same parameters that determine how the cortex folds, and not a determinant of it. A schematic of the model is depicted in Figure 2.
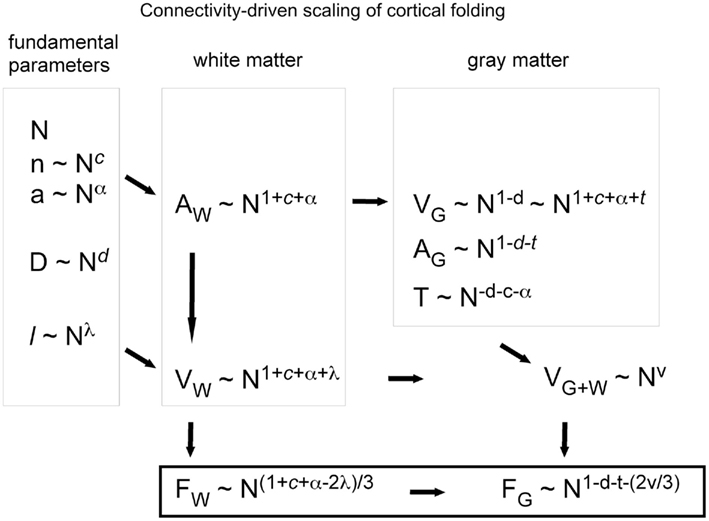
Figure 2. Schematic of our connectivity-driven model of the scaling of cortical folding with increasing numbers of cortical neurons (N). To the left are shown what we propose to be the fundamental parameters determining cortical folding, probably determined genetically, and which we postulate to vary alometrically with N: the fraction of cortical neurons connected through the gray matter (n), the average cross-sectional area of the axons in the white matter (a), the average neuronal density in the gray matter (D, which is approximately proportional to the inverse of average neuronal cell volume in the gray matter), and the average axonal length in the white matter (l). Next, white matter surface (AW) and volume (VW) are organized as shown, depending on N and the scaling exponents, and thus determine the folding of the white matter surface (FW). On top of AW, the gray matter becomes organized depending on the average size of its neurons, which, combined to a and n, determine cortical thickness, T. The degree of folding of the gray matter, FG, is thus a consequence of the folding of the white matter, which is in turn dependent on how the parameters determining cortical connectivity (c, a, and l) scale with N.
Predictions from the Model
Useful mathematical models are those that lead to a number of testable predictions. This is one major advantage of our model: it allows us to derive not only testable qualitative insights on the scaling of cortical folding, but also quantitative predictions that can be tested experimentally.
Qualitative Predictions about Cortical Folding
Our model predicts that the folding of the GM is related to the folding of the WM, and the scaling of the former across species depends on the scaling of the latter. We predict that WM folding scales across mammalian species with the number of cortical neurons; the fraction of these neurons that are interconnected through the WM; the average length of the myelinated fibers in the WM; and their average cross-sectional area. GM folding then scales depending, additionally, on the scaling of the GM thickness, which in turn is determined by the scaling of neuronal density in the GM (besides the scaling of connectivity and average axonal cross-sectional area in the WM). Figure 3 illustrates how the interplay across the scaling of these parameters determines cortical morphology and folding.
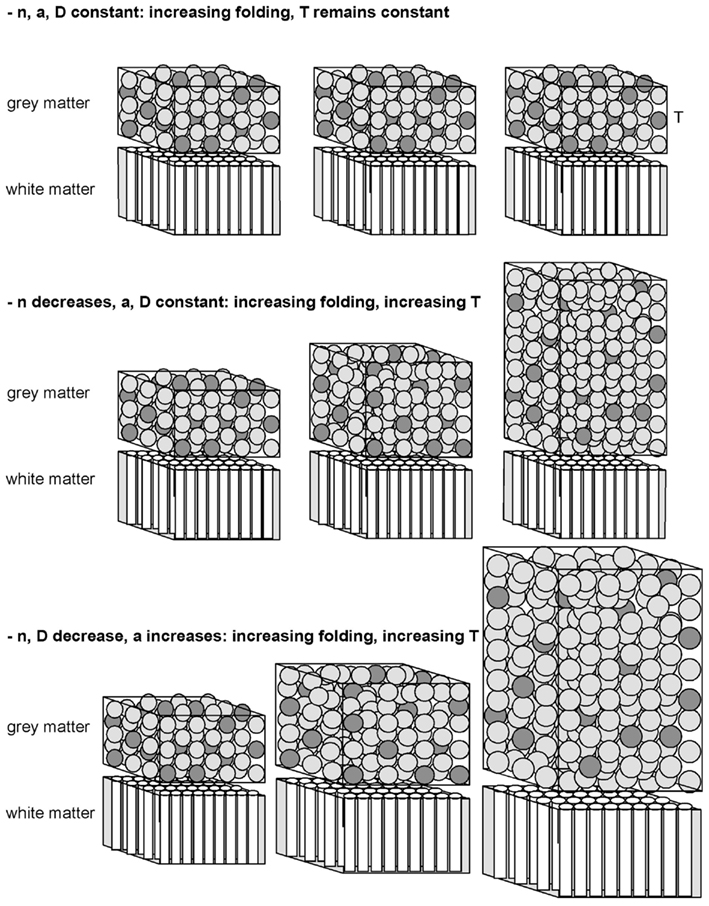
Figure 3. Schematics of various manners of cortical scaling (and folding, not shown) depending on the interplay between the scaling parameters and how they vary with the number of cortical neurons as it increases (left to right). In all three scenarios, axons in the white matter grow under enough tension to lead to cortical folding, fulfilling the condition that λ < (c + 1 + α)/2. In the top scenario, in which the connectivity fraction is unchanged (indicated by the dark gray “neurons” in the gray matter), c = α = 0; therefore λ < 0.5, and the cortex folds more and more with an unchanging thickness given that, in this scenario, d is also 0. In the middle scenario, in which the connectivity fraction decreases but α = d = 0, cortical folding will increase, with an accompanying increase in thickness that scales with N–c (from t = −c−d−α). In the bottom scenario, in which the connectivity fraction decreases (c < 0) and both average neuronal size in the gray matter and axonal cross-sectional area in the white matter increase with N (that is, d < 0 and α > 0), cortical folding increases with a rapid increase in thickness that scales with N−c−d−α.
One remarkable characteristic of our model is that, in principle, it applies universally across mammalian orders (and therefore describes the scaling of cortical folding universally), even though relationships such as those among folding index, cortical thickness, and cortical size are different across orders (Pillay and Manger, 2007). In fact, we can predict that these relationships will be different across orders depending on the particular defining exponents that apply to each order; order-specific characteristics of the scaling of cortical folding will result from combinations of these exponents. Thus, it is conceivable that cortical folding increases in larger brains with no change in connectivity and no change in the average cross-sectional area of the axons in the WM; with decreasing connectivity and increasing average cross-sectional area of the WM; and so forth.
Indeed, one of the strengths of the model is that one can predict how the different scaling exponents will be related. Because folding of the WM scales with N(1+c+α−2λ)/3, then larger cortices in a mammalian order will only be increasingly folded when (1 + c + α − 2λ)/3 > 0. This condition imposes constraints on the combinations of values of c, α, and λ that will lead to increased folding in larger cortices (that is, as N increases).
For instance, supposing that cortical scaling occurs in an order with a fixed λ of 0.5, then c + α > 0, which implies that if folding increases in larger cortices, then any decrease in connectivity (that is, a negative value of c), or even a constant connectivity (that is, c = 0) is necessarily surpassed by a positive scaling of average axonal cross-section in the WM. In these circumstances, the thickness of the GM, which scales with t = –d−c−α, will depend on the scaling of neuronal density minus the positive sum of c + α; as a consequence, the number of neurons underneath a given cortical surface will not be constant (a condition that is only met when t = −d).
By the same token, if cortical scaling occurs in an order with increasing folding in the presence of fixed connectivity (that is, with c = 0), then necessarily α > 2λ − 1. In these circumstances, the average axonal cross-sectional area in the WM will increase in larger-brained cortices for any value of λ ≥ 0.5. Consequently, the thickness of the GM will scale depending on the value of –d−α.
Likewise, it is possible for cortical scaling to occur with increased cortical folding within an order with fixed connectivity and unchanging average axonal cross-sectional area in the WM, as long as λ < 0.5. In these conditions, it can be predicted that the thickness of the GM will scale depending on the scaling of neuronal density alone, and thus occur indeed with a constant number of neurons beneath the cortical surface, as intended in some models (Rockel et al., 1980).
Cortical Thickness
Thinner mammalian cortices are usually found to be more folded than thicker cortices of a similar size (Hofman, 1985; Pillay and Manger, 2007). This finding has been attributed to thinner cortices being supposedly more pliable than thicker cortices, which would render the former less resistant to being folded (Pillay and Manger, 2007). In contrast, our model predicts that cortical thickness is actually determined by two WM-related factors that also determine the degree of cortical folding (connectivity and average axonal cross-sectional area in the WM), and a third, GM-related variable (neuronal density). Remarkably, the scaling of cortical thickness is therefore not simply a function of N, but rather of how d, c, and α are interrelated; if neuronal density, connectivity, and average axonal cross-sectional area are unchanging in a mammalian order, then larger cortices, with larger N, would be expected to have an unchanging thickness as well. In another scenario, even if neuronal densities in the GM were still constant across species in an order, cortical thickness would still increase with N as long as c + α < 0, which would be the case, for instance, if connectivity decreased (c < 0) and average axonal cross-sectional area did not change (α = 0).
Cortical Uniformity
Remarkably, the relationship between cortical thickness, connectivity, neuronal density, and axonal cross-sectional area predicts that a uniform number of neurons underneath a cortical surface area will only be found across species (Rockel et al., 1980) when a very specific condition is met. Given that VG = AW T = N/D, then the ratio N/AW will only be constant when the product D·T is constant. Written as a function of N, and remembering that D varies with Nd, and T with N−d−c−α, then this condition is met only when d + (−d−c−α) = 0, that is, when the sum of the exponents c and α is zero, or, alternatively, when cortical connectivity through the WM remains constant and simultaneously the average axonal cross-section in the WM does not scale (that is, both c and α are zero). In all other cases, the number of neurons underneath a cortical surface will scale with a non-zero combination of d and t. Notice that this prediction is valid both for the scaling of the entire cerebral cortex and for different cortical areas.
Scaling of WM with GM
Because VG can be defined as the product of AW and T, and therefore varies with Nc+1+αNt, or Nc+1+α+t, then the ratio VW/VG varies with Nc+1+α+λ/Nc+1+α+t = Nλ − t, that is, depending on which is steeper: the scaling of axonal length reduction (faster with smaller values of l) or of cortical thickening (faster with larger value of t) as a function of N. Ratios larger than 0 mean that axons shorten relative to isometry more slowly than the cortex thickens as it gains neurons. The implication here is that the ratio VW/VG will be constant across mammalian species when λ = t and that it will increase when λ > t; and may even scale similarly across orders when they share a similar relationship between λ and t. Note that a similar scaling of the VW/VG relationship across orders does not imply similar values of λ or of t, but only a similar difference between them across orders. The increase in the ratio VW/VG in larger cortices (Zhang and Sejnowski, 2000) can thus be predicted to be a consequence of a slower minimization of average axonal length relative to isometry than the thickening of the GM as a function of N.
Propagation Time
Another way of thinking about FW is to express it in terms of the average axon length l and the WM characteristic length RW (defined as the radius of a sphere with volume VW). This relationship can be written as FW = 2RW/3l, where the WM folding index is simply proportional to the ratio between the characteristic size of the WM and the average axonal length. Thus, the more axonal tension curtails the growth of l, the greater the FW and the more convoluted the WM becomes. Compared to a smooth WM surface, folding the WM results in axons having to travel shorter distances to connect GM neurons. A more folded WM will have shorter axons, as a fraction of its characteristic size.
Since the whole purpose of the axons in WM is to transmit signals, it makes sense to quantify how well and quickly they do it, in terms of the scaling rules obtained above. It is well known that an action potential impulse propagates along a myelinated axon in a time proportional to the axon length and inversely proportional to the square root of axon cross-sectional area. The average impulse propagation time should then be given by  Since l = 2VW/AW ∝ Nλ, AW ∼ Nc+1+α+λ, and VW ∼ Nc+1+α+λ, we can combine the three equations to describe how the average propagation time scales with N:
From the equation above, it is clear that, with all else being equal, increasing axonal thickness would result in smaller propagation times. However, if all axons in the WM were to grow thicker by the same factor, then a tightly packed WM would also have to expand to accommodate the extra volume. But a larger WM would mean that GM neurons would be further apart, and axons would have to be longer to connect them.
For the sake of argument, let us considering an isometric doubling of all the lengths and diameters (i.e., a fourfold increase in average cross-sectional areas) of all axons in the WM, such that the overall shape of the WM does not change. According to the formula given above, the average axon impulse propagation time in this isometrically scaled up WM would also be unchanged. Signals have to propagate further due to the doubling of l, but the propagation speed is proportionally faster due to the quadrupling of a. Thus, as far as average propagation times in the WM are concerned, there is no difference between scaled up or scaled down isometric versions of the WM. In contrast, the hypometric scaling of axonal length in the WM has the obvious consequence of decreasing propagation time: the smaller the value of l, the smaller the increase in axonal cross-sectional area required to maintain a constant average propagation time as the cortex gains neurons interconnected through the WM.
With the realization that average propagation time scales with N raised to an exponent of λ − α/2, then the folding of the WM can be written to scale as

Thus, the WM folding index can be expressed in such a way as to depend on only two quantities: The total number of axons in WM (which scales with Nc+1), and the inverse of the square of the average axonal signal propagation time (which scales as Nλ−α/2). This means that cortices in which connectivity through the WM and average propagation time scale similarly will have folding indices that also scale similarly. This also means that, for a given value of c, a faster upscaling of WM folding will be accompanied by a slower increase in propagation times. Increasing cortical folding in larger brains is thus associated with the advantage of a diminished increase in the average propagation time that would otherwise be expected if the WM grew isometrically.
Computational Capacity
Signal propagation times tell us how fast a cortex computes information, but not how effectively. To quantify computational capacity in a simple way, consider a simple neuronal circuit composed of a few neurons connected by axons passing through the WM. A discrete “operation” in such a circuit consists of a set number of signals being passed back and forth among the neurons (for instance in response to a specific external input). A typical such operation is memory retrieval: The circuit receives as input an incomplete pattern that is a partial match to a stored pattern. After a few cycles over its feedback loops, the circuit’s output eventually converges to the stored pattern. Clearly, each such computational cycle (which can be as simple as two neurons with reciprocal connections) is completed in the time it takes for a signal to propagate along the axons of its interconnected, constituting neurons. Thus, in general terms, and assuming that all propagation times in the circuit scale up similarly, then the time needed to perform one operation in this circuit is proportional to the average propagation time along its axons; conversely, the number of operations it can perform per unit time is inversely proportional to the average impulse propagation time of the circuit’s axons. In this case, C, the number of operations involving WM fibers (i.e., non-local operations) that a cortex would be able to perform per unit time, a very simple proxy for its overall computational capacity, is then proportional to the number of “circuits,” or the number of axons, and inversely proportional to the average propagation time.
Note that, like the WM folding index, the scaling of C depends only on the number of axons crossing the WM, and on the coefficient τ for the scaling of average propagation time.
We can also define a volumetric computational efficiency, that is, computational capacity per unit of WM cortical volume, Cef = C/VW,
The computational efficiency of the WM is thus predicted to scale with N−2λ − (α/2). Note that Cef is highly dependent on the scaling of axonal length, but only weakly so on the scaling of axonal cross-sectional area.
When Should the Cortex Fold?
If the WM scales isometrically, that is, without folding, then the average axonal length l will scale with VW1/3, or with AW1/2. If on the contrary the WM scales under tension, with a smaller increase in VW than expected, that implies that l is scaling more slowly than expected. Assuming that AW ∼ nNa and that a, n, and l are themselves related to N as power functions such that a ∼ Nα, n ∼ Nc, and l ∼ Nλ, then, in the case of isometric scaling of VW,

so λ = (c + 1 + α)/2 if the WM scales isometrically.
In all scenarios where λ < (c + 1 + α)/2, the WM will become convoluted as it increases in size, and one can therefore expect the cortical GM to also become more and more folded at the same time. Qualitatively, this means that, due to increasing WM folding, axons do not grow in direct proportion to the characteristic length of the brain (RW), but rather much more slowly; with cortical growth, connections become relatively shorter, as if axons resisted being “stretched” to accommodate more and more connections through the WM. As we have seen, this results in average propagation times increasing more slowly with the addition of more axons in WM.
Finally, in these scenarios where λ < (c + 1 + α)/2 and the WM becomes increasingly folded in larger cortices, it can also be predicted that τ < (c + 1)/2 (by substituting τ = λ − α/2 in the equation), which implies that there is an upper limit to the scaling exponent of propagation time in the WM determined by the connectivity fraction. This leads to the interesting realization that decreasing the fraction of cortical neurons connected through the WM (that is, more negative values of c) minimizes the upscaling of propagation times in larger cortices.
Testing the Model
There are two main ways in which our model can be tested: by designing experiments to address the prediction that cortical connectivity through the WM affects the establishment of cortical folds; and by testing the quantitative relationships predicted by the model. While we have not yet had the opportunity to design experiments specifically to test this model, earlier experiments showing that cortical folding is altered after disrupting cortical connectivity but not after partial removal of the skull during development (reviewed in Kaas, 2009) do support our proposal that cortical folding is driven by pulling on the inside of the cortex, rather than from the cortex pushing inward.
Testing the numerical relationships predicted by the current model requires quantifying, across different mammalian species, their numbers of neurons in the GM, numbers of other cells in the WM; obtaining surface and volume measurements for the GM and WM; and determining, from the scaling across these parameters, whether the exponents thus calculated match the predictions from the model. Here we discuss how the scaling exponents can be obtained; in the next section, we will address how well the model’s predictions are matched by experimental data available so far from rodents and primates.
Measuring l and λ
We showed above how, given that l = 2VW/AW ∝ Nλ, the allometric exponent λ for scaling of l with N can be determined experimentally from the relationship between the ratio between the measureable values VW/AW and N. Additionally, the same relationship also allows the average value of l to be estimated for each species, as the quotient 2VW/AW. The factor of 2 is due to the fact that we expect the vast majority of fibers in the WM to be cortico-cortical (Braitenberg and Schüz, 1998) and thus cross the WM–GM interface twice, coming in and out of the WM as they connect different areas of the cortical GM. Notice that because any deviation of the true factor will be in the direction of being smaller than 2, the value of l thus determined can be considered an upper limit of the average axon length in the WM for that species; moreover, deviations from this value of 2 do not affect the exponent, λ.
Determining c and α
Experimentally, one can obtain the sum c + α from plotting AW as a function of N, but not the individual values of these exponents. A simple, well-fundamented assumption, however, allows the exponents c and α to be determined empirically using the isotropic fractionator (Herculano-Houzel and Lent, 2005) to count the number of non-neuronal (other) cells in WM, O, most of which are oligodendrocytes myelinating neighboring axons. According to Barres and Raff(1994, 1999), it is reasonable to assume that the total length L of all axons in WM, given by L = n·N·l, is proportional to the total number of oligodendrocytes found in the WM. Thus, O ∼ L.
Now, because VW amounts to total axon length L multiplied by a, then VW ∼ O·a. Because the power law relating O to N, O ∼ Nω, can be determined empirically (Herculano-Houzel et al., 2010), VW may be rewritten as

This is a power function that allows the exponent α to be determined, given that ω is known. The exponent c can next be calculated simply from the scaling relationship above between AW and N, now that has been determined.
Testing the Predictions
Once the values of exponents λ, c, and α are obtained from the measurements of VW, AW, N, and O, it becomes possible to predict if the WM should become increasingly folded in larger brains from the comparison between λ and (c + 1 + α)/2. If these quantities are equal, then the WM should scale isometrically. If, on the other hand, λ < (c + 1 + α)/2, the WM will become convoluted as it increases in size, and one can therefore expect the cortical GM to also become more and more folded at the same time.
The actual folding of the WM, FW, is easily determined experimentally for each species as being proportional to AW/VW2/3; the exponent of the experimentally obtained scaling of FW with N can thus be compared to the predicted exponent given by FW ∼ N(1+c+α−2λ)/3.
Next, once the average thickness of the GM is determined for each species as the ratio VG/AW, the exponent t of its scaling with N can be determined experimentally, as can the exponent d of the scaling relationship between neuronal density and number of cortical neurons. Once these exponents are available, it can be tested whether, as predicted, t = −d−c−α; and whether the extent of GM folding, FG, expressed as the ratio AG/(VG + VW)2/3, scales as predicted, with
Experimental Findings
This model has so far been applied to a primate dataset containing 11 species, including humans (Herculano-Houzel et al., 2010), and more recently to a dataset of 5 rodent species (Ventura, Mota, and Herculano-Houzel, to be submitted). Experimentally, we find that the average cross-section area remains nearly invariant in primates as a function of N, while it increases sharply with N across rodents. This is qualitatively very similar to what happens with average neuron size in both orders: It increases significantly with N in rodents, but increases very slowly with N across primate species (Herculano-Houzel, 2011), suggesting there is a connection between average neuron size and axon caliber.
As for the fraction of GM neurons projecting axons through the WM, we find that it decreases with N in both orders, but at a rate that is more pronounced in primates than in rodents. As a result, the WM becomes increasingly folded in larger primate brains, but less rapidly in larger rodent brains.
Using the experimental method described above to determine the values of the scaling exponents that appear in the model, we obtained, in rodents and in primates, the values listed in Table 1.
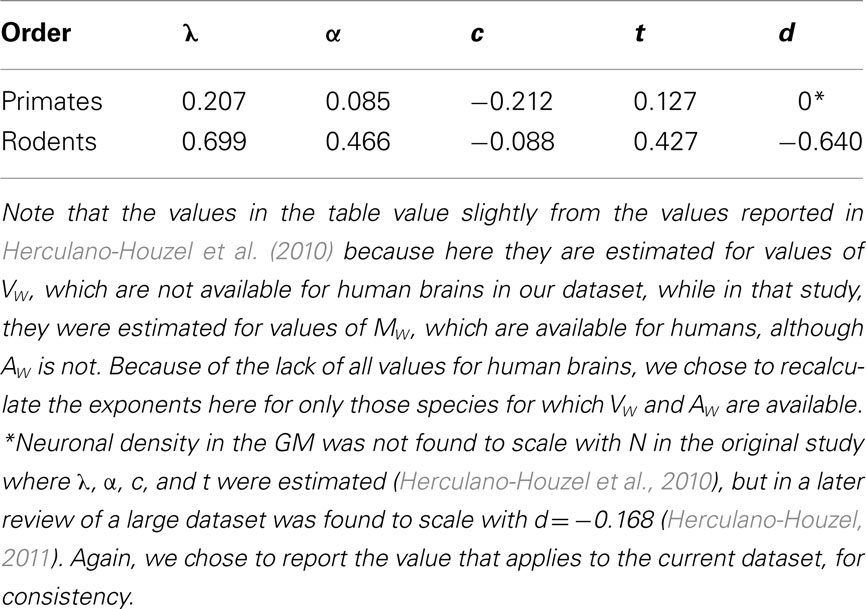
Table 1. Experimentally determined exponents for, respectively, the scaling of average axonal length in the WM (l), average axonal cross-sectional area in the WM (a), fraction of GM neurons connected through the WM (n), average GM thickness (t), and neuronal density in the GM (d) as power functions of the number of cortical neurons (N).
In both orders, l scales sublinearly with N, which is a significant finding given that any increase in average axon length implies an increase in volumetric and propagation time costs. However, while the rodent λ closely matches the value of 0.689 expected in case of isometric scaling of VW of λ = (c + 1 + α)/2, the primate λ = 0.207 is significantly smaller than the value of 0.436 expected in the case of isometric scaling of the WM. This is a strong indication that in primates, the increase in distance between interconnected cortical regions is minimized by effective shortening of the axons, as would be expected to happen if they grew under longitudinal tension (Van Essen, 1997).
As a consequence of these exponents, the folding of the WM is predicted to scale as the cortex gains neurons with N0.153 in primates, which matches precisely the observed scaling of the WM calculated as AW/VW2/3; and is predicted to scale with N0, that is, not to increase in larger rodents cortices. Notice that this prediction apparently contradicts the finding that large rodent cortices, such as those of the agouti and capybara, are indeed folded. We believe, however, that the apparent failure of the model to predict the folding of large rodent cortices is due to the fact that in our sample, three of the five species (mouse, rat, and guinea pig) are small-brained and practically lissencephalic. Thus, rodent cortices seem to scale without becoming folded only up to a certain point, beyond which larger cortices do become increasingly folded. This is actually circumstantial evidence in favor of the push–pull model that we propose, in which the WM only begins to fold once the traction that it exerts upon the GM exceeds the resistance of the latter to becoming folded inward.
Number of Cortical Neurons Connected through the WM
Our model predicts that GM connectivity n (the fraction of GM neurons that sends an axon through the WM) decreases as the GM gains neurons, in a manner that we estimate in primates as n ∝ N−0.212. Although we do not dispose of estimates of the actual number of cortical neurons connected through the WM, it is illuminating to consider the following exercise scenario. Supposing, for the sake of argument, that 50% of all cortical neurons were connected through the WM in the marmoset, then a scaling of n with N−0.212 would imply that in a monkey-sized cortex with 10 times more neurons than the marmoset, WM connectivity would fall to 10−0.212 = 0.61 × 50% = 30% of all neurons; and a human-sized cortex with about 100 times more neurons than a marmoset would have only 19% of its neurons interconnected through the WM.
Note that decreased connectivity occurs in the face of an increased total number of axons in the WM, which is proportional to n·N, or N1+c. In the exercise scenario above, the total number of axons in the WM would increase from about 122 million in the marmoset, to 510 million in the macaque, to 3.0 billion in the human cortex. Larger primate cortices, therefore, increase in size proportionally to N1 neurons in the GM, of which a number proportional to N0.788 send axons into the WM.
A Constant Number of Neurons Beneath the Cortical Surface?
As observed above, our model predicts that the ratio N/AG will only be constant, as assumed in several models (e.g., Prothero, 1997; Zhang and Sejnowski, 2000), under particular circumstances, when d = −t, that is, when both c or α are zero, or so is their sum. Indeed, we have recently found that the ratio N/AG (which is similar to the ratio N/AW), far from being constant across primate species, varies threefold across primate species, and actually scales with variations in neuronal density across the species (Herculano-Houzel et al., 2008).
In primates, the predicted value of t = 0.127 agrees nicely with a measured value of 0.109 ± 0.025 SE. In rodents, the predicted value of t = 0.262 is well below the measured value of 0.427 ± 0.048, possibly because our current estimate of d for the GM is not as accurate as in primates for methodological reasons (Ventura, Mota, and Herculano-Houzel, to be submitted). In both cases, however, cortical thickness clearly does not scale as the inverse of neuronal density (because either c or α or both are significantly different from zero, and non-canceling), thus explaining why the number of neurons underneath a given cortical surface does not remain constant as cortical size varies (Herculano-Houzel et al., 2008; Ventura, Mota, and Herculano-Houzel, to be submitted).
Scaling of VW/VG
It has been proposed that larger cortices scale with a ratio between the volumes of the WM and GM that increases homogeneously across all mammalian species, with VW scaling with VG1.22 to VG1.33 depending on the study (reviewed in Zhang and Sejnowski, 2000). We find that VW scales with VG1.184±0.054 in primates, and with VG1.250±0.057 in rodents. Thus, VW appears to scale as not significantly different functions of VG across the two orders.
These volume relationships, however, mask the finding that the ratio VW/VG increases much more rapidly in rodents than in primates as their cortices gain neurons, varying experimentally with N0.421±0.087 in the former and with N0.162±0.057 in the latter. Remembering that VW/VG varies with Nc+1+α+λ/Nc+1+α+t = Nλ − t, the scaling exponents above 0 indicate that in both rodents and primates, λ > τ. The increase in the ratio VW/VG in larger cortices can thus be explained by the slower minimization of average axonal length relative to isometry than the rate of thickening of the GM as a function of N – but with axonal length minimization lagging behind cortical thickening more pronouncedly in rodents than in primates.
Propagation Times
As detailed above, the average propagation time in WM axons can be described to scale proportionally to average axon length and inversely proportionally to the square root of the average axonal cross-sectional area, varying as a function of Nτ where τ = λ − α/2. Given the values of λ and α found for rodents and primates (above), we have that

This suggests that average signal propagation time through the WM increases far more steeply with N in rodent brains than in primate brains. Indeed, a recent study of the corpus callosum in primates suggested that the expected conduction delays between the hemispheres for different cortical areas doubles from macaque to man (Caminiti et al., 2009). Interestingly, although propagation time could in theory scale similarly across orders (which would offer evidence of a common trend toward minimization of propagation time in brain evolution), our initial results suggest that it not only increases in larger primate cortices, but it also increases faster in rodents than in primates. The faster scaling of WM folding in primate than in rodent brains, which we propose to result from the stronger minimization of axonal lengths under tension in the former, thus bestows upon primate cortices the advantage over rodents of gaining neurons without having signal propagation through the WM slowed down as much.
Computational Capacity
As described above, the computational capacity of the WM (the number of operations involving WM axons that a cortex would be able to perform per unit time) is proportional to the number of axons in the WM, and inversely proportional to the average propagation time. In this manner, computational capacity through the WM scales with N raised to the power of þeta = 1 + c − τ. Given the values of c and α calculated above, then we can estimate

Like for propagation times, we find that the total computational capacity of the cortex through the WM also scales faster in primates than in rodents, although increasing more slowly than the rate at which the cortex gains neurons.
Finally, the computational efficiency of the WM, predicted to scale with N−2λ − (α/2), is thus estimated to scale with N−1.631 in rodents, and with N−0.584 in primates. In both orders, thus, the increase in number of cerebral cortical neurons is accompanied by a decrease in the computational efficiency of the WM – a decrease that is faster in rodents than in primates.
Comparison with Other Models
Outside-In or Inside-Out?
One influential hypothesis for the formation of cortical folds is the differential growth hypothesis, which considers that the faster growth of the outer cortical layers compared to the inner layers cause the cortical GM to fold (Richman et al., 1975). That hypothesis, however, assumes that cortical GM is much stiffer (by an unrealistic factor of 10) than the underlying WM. Our model, in contrast, is aligned with the opposite view that cortical folding is driven by tension generated by axonal connectivity in the WM (Van Essen, 1997), which posits that differences in cortical growth might be a result, and not the cause of cortical folding (Hilgetag and Barbas, 2005).
Another previous model of cortical folding acknowledged a radial pull on the cortical GM by elastic axonal fibers in the WM (Toro and Burnod, 2005). That model, however, attributed the source of cortical folding to a growing cortical surface, depending simply on cortical thickness and mechanical properties of the cortical GM. Although the model showed cortical convolutions to form as a natural consequence of cortical growth, it was largely descriptive, not predictive, since cortical thickness does not appear as an independent parameter; did not take numbers of neurons, of fibers in the WM, nor neuronal size into consideration; nor did it acknowledge that the cerebral cortex may scale as different functions of its number of neurons and connectivity across mammalian groups.
Recently, a study of the distribution of stress in the subcortical WM of the developing ferret brain found that axons are indeed under tension, although the majority of them are located circumferentially in the WM, radially in the subplate, and in the cores of outward folds (Xu et al., 2010). While the authors took this distribution as evidence against Van Essen’s tension-driven model of cortical folding (because of the failure to find tension across the walls of gyri), we believe that it actually provides direct evidence that confirms that the WM grows under considerable axonal tension, which should make its growth deviate from allometry and thus, according to our model, suffice to cause its surface to fold.
Evidence that induced, abnormal cortical growth induces convolutions in the normally lissencephalic mouse brain (Haydar et al., 1999; Chenn and Walsh, 2002; Kingsbury et al., 2003) seems to favor models of cortical folding driven by cortical growth like that of Toro and Burnod (2005). However, our model, which attributes no major determinant role to the thickness of the WM, also predicts increased folding as a consequence of a larger number of cortical neurons, depending simply on there being enough internal tension in the WM, even if cortical connectivity remains unchanged. One of the key features of our connectivity-based model, then, is that it shows that changes in the properties of the GM are not necessarily a factor driving cortical folding; rather, they may occur as a consequence of WM folding, depending on other, possibly unrelated factors such as the average neuronal size, number of neurons in the GM and the fraction connected through the WM, determining for instance the resulting average cortical thickness. Note that, according to our model, local variations in cortical thickness do not affect the WM volume and folding index. Such variations in thickness across the cortical surface, which are known to be exist, may however in some cases create discrepancies between our expected and observed values of the GM folding.
Notice that our model does not predict where cortical folds should occur. Gyral placement might be directed by tension patterns (Van Essen, 1997) and/or by differential GM growth patterns (Richman et al., 1975; Xu et al., 2010). Our model does not deny the influence of differential growth in cortical patterning; it simply predicts that the extent of these folds should scale as the cortex gains neurons depending on the connectivity fraction, the average cross-sectional area of the axons in the WM, and their tension.
In the end, we envision cortical patterning as the result of a mechanical phenomenon, probably involving a tug-of-war or push–pull effect of GM and WM on each other during development – maybe as the GM is nudged into curving by its expanding outer layers, at the same time as the WM pulls onto it. The organization (anisotropy) of the WM seems to come into being via stretch growth, in which it is pulled outward as the diameter of the growing cortex increases (Smith, 2009) – and, therefore, as it necessarily resists this outward pull, due to intrinsic tension (or axons would continue to grow in a disorganized fashion). In culture, stretch growth transforms random axonal projections formed via outgrowth from central nervous system explants into uniform parallel fascicles (Smith et al., 2001; Pfister et al., 2004). The same process is likely to occur in the brain, as the expanding ensemble of the growing cortex physically pulls the WM into long organized tracts during development. Our finding that the volume of the WM grows hypometrically relative to its surface (Herculano-Houzel et al., 2010) provides strong evidence that the axons composing the WM not only resist towing, but also produce a net opposite force on the GM, which we propose that contributes to folding the GM into gyri – and determines the increasing folding of the cortical surface in larger brains across species.
Cortical Thickness: Cause or Consequence?
Qualitatively, thinner cerebral cortices are usually found in more convoluted brains, whether across species or in pathological conditions. In schizophrenia, for example, the cortex may be found to be thinner than usual, with a reduced volume of the superficial layers, and also more folded (Sallet et al., 2003); lissencephalic cortices, on the contrary, are often found to be thicker than normal (Olson and Walsh, 2002). These findings are often interpreted as evidence of a thicker cortex resisting buckling. Our model, however, offers an alternative interpretation: that cortical thickness increases as a consequence of a smaller fraction of neurons connected through the WM, in combination or not to an increased average neuronal size in the WM. This can be intuitively understood as the stacking of a larger number of neurons on top of the GM/WM interface when smaller proportions of cortical neurons send or receive axons from the WM; combined to a thinner spreading of cortical neurons over the GM/WM interface when the average axonal cross-sectional area leaving or entering the WM is larger (Figure 3). According to our model, then, more highly folded cortices are those that have larger connectivity fractions and/or larger average axonal cross-sectional areas, which for the said reasons lead to a thinner cortex. Similarly, the thicker lissencephalic cortex is predicted to be a result of abnormal (insufficient) cortical connectivity through the WM, possibly due to abnormal neuronal migration (Olson and Walsh, 2002), and not simply a cortex that became too thick to be folded.
Cortical Folding and Number of Cortical Neurons
One last and very important aspect of cortical folding is that is has often been considered a means of making more neurons fit into a space-limited brain, as the larger-than-expected cortical surface supposedly allows a larger-than-expected number of neurons for a given cranial volume. However, this would only be the case if cortical expansion occurred mostly laterally, and with a homogeneous number of neurons per surface area. In contrast, as we have shown previously, cortical expansion can no longer be considered to occur homogeneously across species, nor with a homogeneous number of neurons beneath a unit surface area. This means that it is no longer necessarily true that more convoluted cortices have more neurons than less convoluted cortices. Indeed, the elephant cortex, which has a larger surface area and is more convoluted than the human brain, has been estimated to have fewer neurons than the letter (Roth and Dicke, 2005; Herculano-Houzel, 2009).
Conclusion
Here we show that cortical folding in mammals can be predicted to happen as a consequence of the folding of the underlying WM under tension of its axons, and not as a simple, linear function of its number of neurons. Moreover, we show that the scaling of cortical folding with larger numbers of cortical neurons can be predicted, and possibly determined, in different groups of mammals by the scaling of a small number of parameters: (1) the fraction of cortical neurons connected through the WM; (2) the average cross-sectional area of axons in the WM; and (3) the shrinkage, under tension, of average axonal length relative to isometry. Just one further parameter, the scaling of (4) neuronal density, is required next to predict, or determine, both how the thickness of the GM varies, and how the folding of the GM itself scales. This of course assumes near perpendicular (or at least invariant across species) incidence of axonal fibers at the WM–GM interface. This is a plausible hypothesis for fibers under longitudinal tension; but the lack of actual systematic measurement of incidence angles that could confirm this hypothesis must be takes as a limitation of the present work. Such a measurement would be most welcome, allowing us extend our model by introducing another measured coefficient (relating the average incidence angle as a power law of N), to recalculate the values of the various coefficients with a source of uncertainty removed, and to independently test our underlying hypothesis (since we expect a cortex grown subject to axonal longitudinal tensions to show a marked tendency toward orthogonal incidence).
Importantly, while the model is potentially universal, applying across the different orders of mammals, it does not at all imply that there is a single way for the cortex to scale. Rather, we show that, according to the same model, there are many possible combinations of exponents c, α, and λ that lead to cortices that become increasingly folded as they gain neurons – as long as λ < (c + 1 + α)/2. Again, our model predicts that cortical thickness is not a determinant of cortical folding, but rather a consequence, depending on the scaling of neuronal density as well as of the connectivity fraction and average cross-sectional area of the axons in the WM.
Even in the case that experimental testing eventually shows that causality in cortical folding is not as proposed in our model without the introduction of further variables, the latter has the enormous advantage of allowing one to deduce the scaling of cortical connectivity, axonal length, cross-sectional area, and thus to infer propagation time and computational capability and efficacy, from readily measurable values of AW, VW, N, OW, and DN.
Conflict of Interest Statement
The authors declare that the research was conducted in the absence of any commercial or financial relationships that could be construed as a potential conflict of interest.
Acknowledgments
Suzana Herculano-Houzel is supported by FAPERJ-Cientista do Nosso Estado, CNPq – Edital Universal, INNT/MCT, and the James McDonnell Foundation; Bruno Mota is supported by a FAPERJ/CAPES postdoctoral grant.
Abbreviations
a, average cross-section area of myelinated axons in WM; AE, Exposed surface area of cerebral cortex; AT, Total surface area of cerebral cortex; AW, White–gray matter interface surface area; C, Cortical estimated computational capacity; FG = AT/AE, Cortical folding index; FW = AI/4πRW2, white matter folding index; GM, cerebral cortical gray matter; l, average length of myelinated axons in WM; L = l n·NN, total length of myelinated axons in WM; MG, mass of cerebral cortex GM; MW, mass of cerebral cortex subcortical WM; n, GM connectivity through the WM, defined as the fraction of neurons in GM with myelinated axon in WM; N, Number of neurons in GM; O, number of other (non-neuronal) cells in WM; RW(3VW/4π)1/3, WM “radius” (or, more properly, length scale); T = VG/AT, average thickness of cerebral cortex GM; V, volume of cerebral cortex (GM + WM); VG, volume of cerebral cortex gray matter (GM); VW, volume of cerebral cortex white matter (WM); WM, subcortical white matter.
Footnote
- ^ A deviation from perpendicular incidence would be reflected on a proportional discrepancy in the estimation of axonal lengths; but only a systematic variation (with N) of incidence angle would alter the calculated power law coefficients. Unfortunately we cannot at this point rule out or numerically constraint such variation, and must therefore recognize this fact as a limitation of our model as it stands.
References
Barres, B. A., and Raff, M. C. (1994). Control of oligodendrocyte number in the developing rat optic nerve. Neuron 12, 935–942.
Barres, B. A., and Raff, M. C. (1999). Axonal control of oligodendrocyte development. J. Cell Biol. 147, 1123–1128.
Braitenberg, V., and Schüz, A. (1998). Cortex: Statistics and Geometry of Neuronal Connectivity, 2nd Edn. Berlin: Springer Verlag.
Caminiti, R., Ghaziri, H., Galuske, R., Hof, P. R., and Innocenti, G. M. (2009). Evolution amplified processing with temporally dispersed slow neuronal connectivity in primates. Proc. Natl. Acad. Sci. U.S.A. 106, 19551–19556.
Chenn, A., and Walsh, C. (2002). Regulation of cerebral cortical size by control of cell cycle exit in neural precursos. Science 297, 365–369.
Collins, C. E., Airey, D. C., Young, N. A., Leitch, D. B., and Kaas, J. H. (2010). Neuron densities vary across and within cortical areas in primates. Proc. Natl. Acad. Sci. U.S.A. 107, 15927–15932.
Gabi, M., Collins, C. E., Wong, P., Kaas, J. H., and Herculano-Houzel, S. (2010). Cellular scaling rules for the brain of an extended number of primate species. Brain Behav. Evol. 76, 32–44.
Goldman-Rakic, P. (1980). Morphological consequences of prenatal injury to the primate brain. Prog. Brain Res. 53, 3–19.
Goldman-Rakic, P., and Rakic, P. (1984). “Experimental modification of gyral patterns,” in Cerebral Dominance: The Biological Foundation, eds N. Geschwind, and A. Galaburda (Cambridge: Harvard University Press), 179–192.
Gross, C. G. (1999). Brain, Vision, Memory: Tales in the History of Neuroscience. Cambridge: MIT Press.
Haydar, T., Kuan, C., Flavell, R., and Rakic, P. (1999). The role of cell death in regulating the size and shape of the mammalian forebrain. Cereb. Cortex 9, 621–626.
Herculano-Houzel, S. (2009). The human brain in numbers: a linearly scaled-up primate brain. Front. Hum. Neurosci. 3:31. doi: 10.3389/neuro.09.031.2009
Herculano-Houzel, S. (2011). Not all brains are made the same: new views on brain scaling in evolution. Brain Behav. Evol. 78, 22–36.
Herculano-Houzel, S., Collins, C. E., Wong, P., and Kaas, J. H. (2007). Cellular scaling rules for primate brains. Proc. Natl. Acad. Sci. U.S.A. 104, 3562–3567.
Herculano-Houzel, S., Collins, C. E., Wong, P., Kaas, J. H., and Lent, R. (2008). The basic non-uniformity of the cerebral cortex. Proc. Natl. Acad. Sci. U.S.A. 105, 12593–12598.
Herculano-Houzel, S., and Lent, R. (2005). Isotropic fractionator: a simple, rapid method for the quantification of total cell and neuron numbers in the brain. J. Neurosci. 25, 2518–2521.
Herculano-Houzel, S., Mota, B., and Lent, R. (2006). Cellular scaling rules for rodent brains. Proc. Natl. Acad. Sci. U.S.A. 103, 12138–12143.
Herculano-Houzel, S., Mota, B., Wong, P., and Kaas, J. H. (2010). Connectivity-driven white matter scaling and folding in primate cerebral cortex. Proc. Natl. Acad. Sci. U.S.A. 107, 19008–19013.
Herculano-Houzel, S., Ribeiro, P. F. M., Campos, L., da Silva, A. V., Torres, L. B., Catania, K., and Kaas, J. H. (2011). Updated neuronal scaling rules for the brains of Glires (rodents/lagomorphs). Brain Behav. Evol. 78, 302–314.
Hilgetag, C. C., and Barbas, H. (2005). Developmental mechanics of the primate cerebral cortex. Anat. Embryol. 210, 411–417.
His, W. (1874). Unsere Körperform und das physiologische Problem ihrer Enstellung. Leipzig: FCW Vogel.
Hofman, M. (1985). Size and shape of the cerebral cortex in mammals. I. The cortical surface. Brain Behav. Evol. 27, 28–40.
Kingsbury, M., Rehen, S., Contos, J., Higgins, C., and Chun, J. (2003). Non-proliferative effects of lysophosphatidic acid enhance cortical growth and folding. Nat. Neurosci. 6, 1292–1299.
Le Gros Clark, W. (1945). “Deformation patterns on the cerebral cortex,” in Essays on Growth and Form, eds. W. Le Gros Clark, and P. B. Medawar. (Oxford: Oxford University Press), 1–23.
Mori, S., Kaufmann, W. E., Davatzikos, C., Stieltjes, B., Amodei, L., Fredericksen, K., Pearlson, G. D., Melhem, E. R., Solaiyappan, M., Paymond, G. V., Moser, H. W., and van Sizj, P. C. (2002). Imaging cortical association tracts in the human brain using diffusion-tensor-based axonal tracking. Magn. Reson. Med. 47, 215–223.
Olivares, R., Montiel, J., and Aboitiz, F. (2001). Species differences and similarities in the fine structure of the mammalian corpus callosum. Brain Behav. Evol. 57, 98–105.
Olson, E. C., and Walsh, C. A. (2002). Smooth, rough and upside-down neocortical development. Curr. Opin. Genet. Dev. 12, 320–327.
Pfister, B. J., Iwata, A., Meaney, D. F., and Smith, D. H. (2004). Extreme stretch growth of integrated axons. J. Neurosci. 24, 7978–7983.
Pillay, P., and Manger, P. R. (2007). Order-specific quantitative patterns of cortical gyrification. Eur. J. Neurosci. 25, 2705–2712.
Prothero, J. (1997). Scaling of cortical neuron density and white matter volume in mammals. J. Hirnforsch. 38, 513–524.
Richman, D., Stewart, R., Hutchunson, J., and Caviness, V. Jr. (1975). Mechanical model of brain convolution development. Science 189, 18–21.
Rockel, A. J., Hiorns, R. W., and Powell, T. P. S. (1980). The basic uniformity in the structure of the neocortex. Brain 103, 221–244.
Roth, G., and Dicke, U. (2005). Evolution of the brain and intelligence. Trends Cogn. Sci. (Regul. Ed.) 9, 250–257.
Sadahiro, S., Yoshikawa, H., Yagi, N., Yamamoto, Y., Yanagihara, T., Kimura, M., and Sakoda, S. (2000). Morphometric analysis of the myelin-associated oligodendrocytic basic protein-deficient mouse reveals a possible role for myelin-associated oligodendrocytic basic protein in regulating axonal diameter. Neuroscience 98, 361–367.
Sallet, P. C., Elkis, H., Oliveira, J. R., Sassi, E., de Castro, C. C., Busatto, G. F., and Gattaz, W. F. (2003). Reduced cortical folding in schizophrenia: an MRI morphometric study. J. Anat. Physiol. 36, 309–319.
Sarko, D. K., Catania, K. C., Leitch, D. B., Kaas, J. H., and Herculano-Houzel, S. (2009). Cellular scaling rules of insectivore brains. Front. Neuroanat. 3:8. doi: 10.3389/neuro.05.008.2009
Sauvageot, C. M., and Stiles, C. D. (2002). Molecular mechanisms controlling cortical gliogenesis. Curr. Opin. Neurobiol. 12, 244–249.
Tower, D. B. (1954). Structural and functional organization of mammalian cerebral cortex; the correlation of neurone density with brain size; cortical neurone density in the fin whale (Baleanoptera physalus L.) with a note on the cortical neurone density in the Indian elephant. J. Comp. Neurol. 101, 19–51.
Smith, D. H. (2009). Stretch growth of integrated axon tracts: extremes and exploitations. Prog. Neurobiol. 89, 231–239.
Smith, D. H., Wolf, J. A., and Meaney, D. F. (2001). A new strategy to produce sustained growth of central nervous system axons: continuous mechanical tension. Tissue Eng. 7, 131–139.
Toro, R., and Burnod, Y. (2005). A morphogenetic model for the development of cortical convolutions. Cereb. Cortex 15, 1900–1913.
Toro, R., Perron, M., Pike, B., Richer, L., Veillette, S., Pausova, Z., and Paus, T. (2008). Brain size and folding of the human cerebral cortex. Cereb. Cortex 18, 2352–2357.
Van Essen, D. C. (1997). A tension-based theory of morphogenesis and compact wiring in the central nervous system. Nature 385, 313–318.
Wang, S. S. H., Shultz, J. R., Burish, M. J., Harrison, K. H., Hof, P. R., Towns, L. C., Wagers, M. W., and Wyatt, K. D. (2008). Functional trade-offs in white matter axonal scaling. J. Neurosci. 28, 4047–4056.
Welker, W. (1990). “Why does cerebral cortex fissure and fold? A review of determinants of gyri and sulci,” in Cerebral Cortex Vol. 8B, Comparative Structure and Evolution of Cerebral Cortex, Part II, eds E. G. Jones, and A. Peters (New York: Plenum Press), 3–136.
Xu, G., Knutsen, A. K., Dikranian, K., Kroenke, C. D., Bayly, P. V., and Taber, L. A. (2010). Axons pull on the brain, but tension does not drive cortical folding. J. Biomech. Eng. 132, 071013–71011.
Zhang, K., and Sejnowski, T. J. (2000). A universal scaling law between gray matter and white matter of cerebral cortex. Proc. Natl. Acad. Sci. U.S.A. 97, 5621–5626.
Keywords: allometry, brain size, evolution, white matter, cortical folding, connectivity, axon caliber, cortical thickness
Citation: Mota B and Herculano-Houzel S (2012) How the cortex gets its folds: an inside-out, connectivity-driven model for the scaling of mammalian cortical folding. Front. Neuroanat. 6:3. doi: 10.3389/fnana.2012.00003
Received: 02 August 2011; Accepted: 15 January 2012;
Published online: 02 February 2012.
Edited by:
Julian Budd, University of Sussex, UKReviewed by:
Charles F. Stevens, The Salk Institute for Biological Studies, USADavid C. Van Essen, Washington University in St. Louis, USA
Copyright: © 2012 Mota and Herculano-Houzel. This is an open-access article distributed under the terms of the Creative Commons Attribution Non Commercial License, which permits non-commercial use, distribution, and reproduction in other forums, provided the original authors and source are credited.
*Correspondence: Suzana Herculano-Houzel, Instituto de Ciências Biomédicas, Universidade Federal do Rio de Janeiro, Av. Brigadeiro Trompowski, s/n, Ilha do Fundão, Rio de Janeiro, Rio de Janeiro 21941-590, Brazil. e-mail: suzanahh@gmail.com