Two Subpopulations of Noradrenergic Neurons in the Locus Coeruleus Complex Distinguished by Expression of the Dorsal Neural Tube Marker Pax7
 Nicholas W. Plummer
 Erica L. Scappini
 Kathleen G. Smith1
  Charles J. Tucker
 Patricia Jensen
- 1Neurobiology Laboratory, National Institute of Environmental Health Sciences, National Institutes of Health, United States Department of Health and Human Services, Durham, NC, United States
- 2Signal Transduction Laboratory, National Institute of Environmental Health Sciences, National Institutes of Health, United States Department of Health and Human Services, Durham, NC, United States
Central noradrenergic neurons, collectively defined by synthesis of the neurotransmitter norepinephrine, are a diverse collection of cells in the hindbrain, differing in their anatomy, physiological and behavioral functions, and susceptibility to disease and environmental insult. To investigate the developmental basis of this heterogeneity, we have used an intersectional genetic fate mapping strategy in mice to study the dorsoventral origins of the En1-derived locus coeruleus (LC) complex which encompasses virtually all of the anatomically defined LC proper, as well as a portion of the A7 and subcoeruleus (SubC) noradrenergic nuclei. We show that the noradrenergic neurons of the LC complex originate in two different territories of the En1 expression domain in the embryonic hindbrain. Consistent with prior studies, we confirm that the majority of the LC proper arises from the alar plate, the dorsal domain of the neural tube, as defined by expression of Pax7Cre. In addition, our analysis shows that a large proportion of the En1-derived A7 and SubC nuclei also originate in the Pax7Cre-defined alar plate. Surprisingly, however, we identify a smaller subpopulation of the LC complex that arises from outside the Pax7Cre expression domain. We characterize the distribution of these neurons within the LC complex, their cell morphology, and their axonal projection pattern. Compared to the broader LC complex, the newly identified Pax7Cre-negative noradrenergic subpopulation has very sparse projections to thalamic nuclei, suggestive of distinct functions. This developmental genetic analysis opens new avenues of investigation into the functional diversity of the LC complex.
Introduction
Collectively defined by their synthesis of the neurotransmitter norepinephrine, central noradrenergic neurons are heterogeneous. In addition to varying in their anatomical location, morphology, axonal projection pattern, electrophysiological characteristics, and gene expression (Dahlström and Fuxe, 1964; Swanson, 1976; Holets et al., 1988; Robertson et al., 2013; Chandler et al., 2014; Li et al., 2016), noradrenergic neurons exhibit differential susceptibility to neurodegenerative disease and toxicant exposure (German et al., 1992; Mohideen et al., 2011; Theofilas et al., 2017). Determining the molecular basis of this heterogeneity is therefore likely to have important clinical implications, in addition to shedding light on how noradrenergic neurons regulate behaviors and physiological functions as diverse as attention, emotion, appetite, memory, and response to stress (Berridge and Waterhouse, 2003).
The organization of central noradrenergic neurons was initially defined over fifty years ago by their rostrocaudal position in the adult brainstem (Dahlström and Fuxe, 1964). This mature anatomical organization is still the primary means by which the noradrenergic system is studied, but evidence of heterogeneity within anatomically defined noradrenergic nuclei indicates that other approaches will be required to fully explain functional diversity. An alternative strategy for understanding this heterogeneity is the study of genetic neuroanatomy, correlating gene expression with brain structure and function (Joyner and Sudarov, 2012). To this end, we have recently used a recombinase-mediated intersectional genetic fate mapping approach to subdivide the mature noradrenergic system based on gene expression differences along the anteroposterior axis of the embryonic hindbrain (Robertson et al., 2013, 2016). We identified genetically defined noradrenergic subpopulations originating in different rhombomeres (r), transient segments of the embryonic hindbrain with distinct gene expression profiles (Krumlauf et al., 1993; Chambers et al., 2009). The population arising from the isthmus (r0) and r1, as defined by early expression of En1, comprises the majority of the locus coeruleus (LC), the largest anatomically defined noradrenergic population and a major source of norepinephrine released in the cortex, as well as part of the dorsal subcoeruleus (SubC) and A7 noradrenergic nuclei in the pons. More recently, fate mapping on the basis of Fgf8Cre expression in r0 has demonstrated that the LC is divided between r0- and r1-derived subpopulations (Watson et al., 2017). A dorsal subpopulation is derived from the Fgf8Cre expression domain encompassing r0, and by inference, the remaining ventral subpopulation is derived from r1.
In addition to the anteroposterior axis, developmental gene expression in the embryonic neural tube also varies on the dorsoventral axis (Echelard et al., 1993; Liem et al., 1995, 1997; Moreno-Bravo et al., 2014; Di Bonito and Studer, 2017). This second axis of developmental gene expression is likely a source of functional heterogeneity in the mature LC and adjacent noradrenergic neuron populations. The developmental progression of Phox2a and Phox2b expression during LC development suggests that the neurons of the LC originate in the alar plate, the dorsal subdivision of the neural tube, and migrate to their final position in the basal plate (Aroca et al., 2006). In chick, the alar origin of the LC was confirmed experimentally by fate mapping with quail/chick chimeras and immunohistochemical analysis using Pax7 as a marker of the alar plate (Aroca et al., 2006). The dorsoventral origins of SubC and A7 noradrenergic neurons derived from the En1 expression domain were not assessed.
In the current study, we use an intersectional genetic fate mapping strategy in mice to directly assess the dorsoventral origins of all the noradrenergic neurons derived from the En1 expression domain encompassing r0 and r1. We confirm that the majority of LC neurons originate in the alar plate, as defined by expression of Pax7Cre, and demonstrate that this region is also the source of a large proportion of r0- and r1-derived SubC and A7 cells. Surprisingly, we also find that a small subpopulation of noradrenergic neurons distributed throughout the mature LC, SubC, and A7 does not have a history of Pax7Cre expression, indicating an origin outside the Pax7-defined alar plate. Consistent with the hypothesis that different developmental origins imply different functions, this subpopulation has a distinct axonal projection pattern.
Materials and Methods
Animals
This study was performed in accordance with the recommendations in the Guide for the Care and Use of Laboratory animals of the National Institutes of Health. The protocols were approved by the Animal Care and Use Committee (ACUC) of the National Institute of Environmental Health Sciences.
All mouse lines used in this study are listed in Table 1 and were maintained by back-crossing to C57BL/6J mice. To generate the new RC::LTG fluorescent indicator line, RC::RFLTG mice were crossed with the CAG-dre and ACT-Flpe recombinase driver lines to permanently remove the rox- and FRT-flanked transcriptional stop cassettes. To label single-recombinase expression domains in embryos, we crossed En1Dre with RC::RLTG mice, and Pax7Cre with RC::LTG mice. To label subpopulations of noradrenergic neurons derived from r0 and r1, RC::RFLTG mice were intercrossed with En1Dre, Pax7Cre, and DbhFlpo, generating mice heterozygous for RC::RFLTG and all three recombinase driver alleles. Littermates heterozygous for one or two recombinase drivers served as controls.
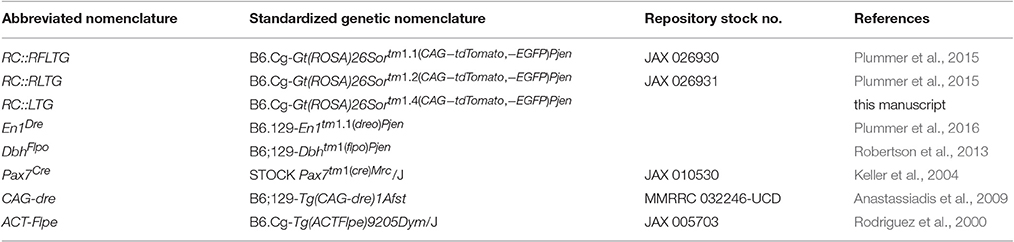
Table 1. Mouse lines used in this study.
Tissue Collection
For timed matings, noon of the day on which mating plugs were identified was taken to be embryonic day (E) 0.5. Embryos were fixed by immersion in 4% paraformaldehyde (PFA) in 0.01 M phosphate buffered saline (PBS) at 4°C overnight. Following equilibration in 10, 20, and 30% sucrose in PBS, embryos were embedded in Tissue Freezing Medium (General Data Company, Cincinnati, OH), and 14-μm cryosections were mounted on Superfrost Plus microscope slides (Thermo Scientific, Waltham, MA), air dried and stored at −80°C.
For collection of adult brain tissue, mice were anesthetized with sodium pentobarbital and transcardially perfused with 4% PFA. After dissection, brains were post-fixed by immersion in 4% PFA at 4°C overnight. Following rinse with PBS, brains to be processed for immunohistochemistry were equilibrated in 30% sucrose for 48 h at 4°C, and embedded in Tissue Freezing medium. Free-floating 40-μm cryosections were collected and stored at −80°C in 30% sucrose/30% ethylene glycol in PBS. Brains to be cleared by the passive clarity technique were processed according to the protocol below.
Immunohistochemistry
For immunofluorescent labeling, EGFP-expressing cells in slide-mounted embryo sections and free-floating adult brain sections were detected with chicken anti-GFP primary antibody (1:10,000; Cat.# ab13970, Abcam, Campridge, MA) and Alexa Fluor 488 goat anti-chicken secondary antibody (1:1,000; Cat.# A11039, Life Technologies, Grand Island, NY). tdTomato-expressing cells were detected with rabbit anti-dsRed primary antibody (1:1,000; Cat.#632496, Clontech Laboratories, Mountain View, CA) and Alexa Fluor 568 goat anti-rabbit secondary antibody (1:1,000; Cat.# A11036, Life Technologies). Noradrenergic neuron cell bodies were detected with mouse monoclonal anti-tyrosine hydroxylase (1:500; clone 185, Cat.# GTX10372, GeneTex, Irvine, CA) and Alexa Fluor 633 goat anti-mouse secondary antibody (1:1,000; Cat.# A21052, Life Technologies). After immunolabeling, adult brain sections were mounted on Superfrost Plus slides. Both embryo and adult sections were incubated with TrueBlack reagent (Biotium, Fremont, CA) to quench autofluorescence, and coverslipped with VectaShield plus DAPI (4′,6-diamidino-2-phenylindol) Hard Set mounting medium (Vector Laboratories, Burlingame, CA).
For highest sensitivity detection of EGFP and tdTomato-expressing axons, we used immunoperoxidase labeling of 40-μm free-floating sections (n = 8 mice). The chicken anti-GFP antibody (1:10,000) was used in conjunction with a biotinylated goat anti-chicken secondary antibody (1:500; Cat.# BA-9010, Vector Laboratories), and rabbit anti-dsRed (1:1,000) was used with biotinylated goat anti-rabbit secondary antibody (1:500; Cat.# BA-1000; Vector Laboratories). Immunoreactivity was detected with the Vectastain Elite ABC kit and DAB Peroxidase Substrate Kit (both Vector Laboratories), and slides were coverslipped with Permount mounting medium (Fisher Scientific, Waltham, MA).
Passive Clarity Tissue Clearing
The passive clarity technique (PACT) (Yang et al., 2014) and immunofluorescent labeling of cleared tissue were performed as previously described (Plummer et al., 2015) except for the following modifications. Following the fixation protocol described above, 2 or 3 mm-thick coronal brain slices were embedded in 4% polyacrylamide gel (A4P0). Lipids were extracted by incubation in 8% SDS in PBS at 37°C for 6 days. During the incubation, the SDS was replaced with fresh solution every other day. For immunohistochemistry, tissue was incubated with chicken anti-GFP (1:1,000; Cat.# ab13970, Abcam) and rabbit anti-dsRed (1:500; Cat.#632496, Clontech Laboratories) primary antibodies, followed by incubation with Alexa Fluor 488 donkey anti-chicken F(ab')2 fragments (1:500; Cat.# 703-546-155, Jackson ImmunoResearch Laboratories, West Grove, PA) and Alexa Fluor 568 donkey anti-rabbit F(ab')2 fragments (1:500; Cat.# Ab175694, Abcam), for 6 days each, with buffer and antibody replaced with fresh solution after 3 days. To inhibit bacterial growth, 0.03% sodium azide was included in all antibody solutions, not 0.01% as previously published (Plummer et al., 2015).
Digital Image Collection and Processing
Tile scan images of fluorescently labeled sections were collected on a Zeiss LSM 780 or 880 inverted confocal microscope (Carl Zeiss Microscopy, Thornwood, NY), and z-stacks were converted to maximum intensity projections using Zen 2012 Black Software (Carl Zeiss). Images were modified only by using Photoshop (Adobe Systems, San Jose, CA) or ImageJ software (US National Institutes of Health) to adjust brightness and contrast across the entire image. Tile scan images of tissue cleared by PACT were collected on an LSM 880 confocal microscope using an EC Plan-Neofluar 10x/0.3 M27 objective (Carl Zeiss). Due to the thickness of the samples, the Auto Z Brightness Correction was used for both the 488 nm laser line from an Argon laser (2–20% power range) and 561 nm laser line from a DPSS laser (2–12% power range). The pinhole was set to yield an optical z-thickness of 14 μm, and a z-stack was collected at 10 μm interval between images. z-stacks were viewed with Imaris Software (Bitplane, Concord MA) for three-dimensional rendering of the entire region and surface rendering of individual cells.
Cell Counts
EGFP- and tdTomato-labeled neurons were counted in the z-stacks encompassing the entire population of r0- and r1-derived noradrenergic neurons in PACT cleared brain tissue from En1Dre; DbhFlpo; Pax7Cre; RC::RFLTG mice (n = 6). Images were cropped, and a subset consisting of a z-slice every 60 μm (the thickness of a cell body on the z axis in the cleared tissue) was made in Zen 2012 Black Software (Carl Zeiss). We compared several adjacent z-slices with the full z-stack to confirm that this separation distance does not result in missed neurons or double counting of the same neuron in adjacent z-slices. The individual images were then imported into FIJI software (Schindelin et al., 2012) for smoothing and application of the eliminate maxima filter from the Fast Filters plugin. Labeled neurons were counted using the Cell Counter plugin in FIJI. Cell counts are reported as mean ± standard error. Cell numbers in left and right hemispheres were compared by unpaired t-test using Graphpad Prism software (Graphpad, La Jolla, CA).
Results
Using intersectional genetic fate-mapping, we have previously shown that noradrenergic neurons derived from the En1 expression domain of the embryonic hindbrain populate 99.8% of the locus coeruleus (LC) and a portion of the dorsal subcoeruleus and A7 nuclei (Robertson et al., 2013) according to an adult mouse brain atlas (Paxinos and Franklin, 2013). These neurons (hereafter designated the LC complex) form a continuum extending from the compact LC proper to the more dispersed cells of the SubC and A7 nuclei (Plummer et al., 2015). An earlier study using in situ hybridization of chick and mouse embryos and quail/chick grafting experiments demonstrated that the LC is derived from the alar plate (Aroca et al., 2006), but these embryonic analyses did not distinguish the LC proper from the SubC and A7, structures more clearly delineated in the adult brain. To determine if all noradrenergic neurons of the LC complex originate from the alar plate, we therefore employed a recombinase-based intersectional and subtractive genetic fate mapping strategy that allows labeled neurons to be mapped into the adult brain (Jensen and Dymecki, 2014).
Mapping noradrenergic neurons derived from the alar plate of r0 and r1 required three recombinase driver alleles and a triple recombinase-responsive indicator allele. DbhFlpo (Robertson et al., 2013) is a noradrenergic-specific Flp recombinase driver controlled by the promoter of dopamine β-hydroxylase (Dbh), the enzyme required for the final step in norepinephrine synthesis. En1Dre (Plummer et al., 2016) expresses Dre recombinase in the embryonic midbrain, r0, and r1 (Figure 1A), and Pax7Cre (Keller et al., 2004) expresses Cre in the alar plate (Figure 1A). The indicator allele, RC::RFLTG (Plummer et al., 2015), expresses tdTomato after Dre-mediated deletion of a rox-flanked transcriptional stop cassette and Flp-mediated deletion of a FRT-flanked stop cassette. EGFP is expressed following Dre-, Flp-, and Cre-mediated deletion of all stop cassettes and the loxP-flanked tdTomato.
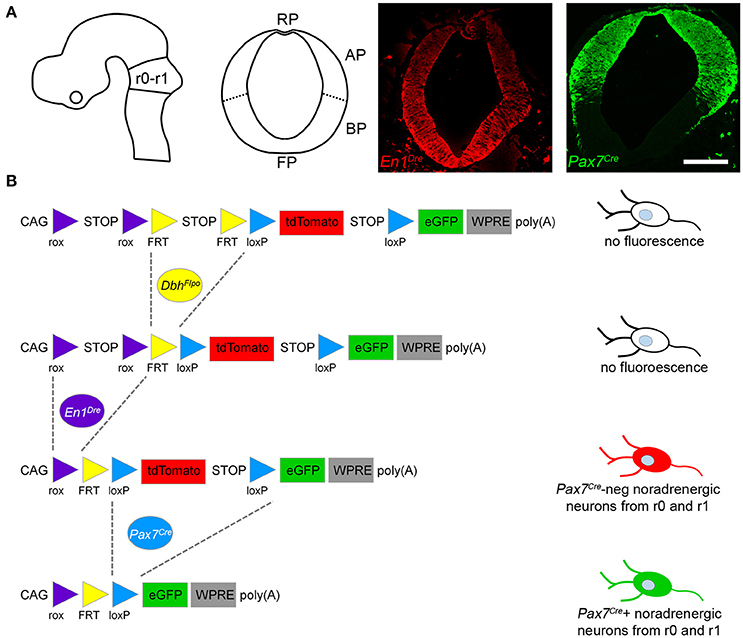
Figure 1. Recombinase driver lines expressed in the embryonic hindbrain permit intersectional genetic fate mapping of noradrenergic neuron subpopulations. (A) Schematic diagrams show the mouse neural tube at E10.5 (Left, sagittal view; Right, coronal view) at the level of rhombomeres 0 and 1 (r0-r1). In E10.5 embryos a fluorescent Dre indicator reveals En1Dre expression throughout the dorsoventral axis, while a fluorescent Cre indicator shows Pax7Cre restricted to the alar plate (AP). BP, Basal plate; FP, floor plate; RP, roof plate. Scale bar: 200 μm. (B) Schematic diagram of the RC::RFLTG indicator allele (Plummer et al., 2015). En1Dre and DbhFlpo recombinase activity deletes rox- and FRT-flanked stop cassettes, permitting tdTomato expression in noradrenergic neurons originating in r0 and r1 outside the Pax7Cre domain. En1Dre, DbhFlpo, and Pax7Cre expression deletes the stop cassettes and tdTomato, permitting EGFP expression in noradrenergic neurons from the Pax7Cre domain of r0 and r1. Schematic does not represent chronological order of recombinase expression.
In mice heterozygous for all three recombinase driver alleles and the indicator allele, noradrenergic neurons derived from the Pax7Cre-defined alar plate of r0 and r1 (the intersectional population) will be selectively labeled with EGFP (Figure 1B). Any noradrenergic neurons derived from r0 and r1 outside of the Pax7Cre domain (the subtractive population) will be labeled with tdTomato, and noradrenergic neurons originating outside of r0 and r1 will not be labeled due to the presence of the rox-flanked stop cassette (Figure 1B). Co-labeling of the same neuron with EGFP and tdTomato is not possible, because of the order in which driver expression occurs. Pax7Cre activity can be detected at E10.5 (Figure 1A), prior to the detection of DbhFlpo activity (Robertson et al., 2013). Therefore, Pax7Cre-mediated recombination will delete the tdTomato cassette in progenitor cells before DbhFlpo-mediated recombination in postmitotic noradrenergic neurons permits fluorescent protein expression.
In the developing hindbrain of E15.5 embryos heterozygous for all three recombinase drivers and the indicator allele, we observed predominantly EGFP-labeled Pax7Cre-positive noradrenergic neurons (Figure 2), consistent with the prior observation that the locus coeruleus is derived from the alar plate (Aroca et al., 2006). However, we consistently observed a small population of tdTomato-labeled Pax7Cre-negative noradrenergic neurons intermingled with the EGFP-labeled neurons (Figure 2). As expected, in control littermates heterozygous for En1Dre and DbhFlpo, but not Pax7Cre, all r0- and r1-derived noradrenergic neurons were labeled with tdTomato, and no labeling was observed in other genotypes. These results indicate that a subpopulation of r0- and r1-derived noradrenergic neurons originates outside the Pax7Cre-defined alar plate.
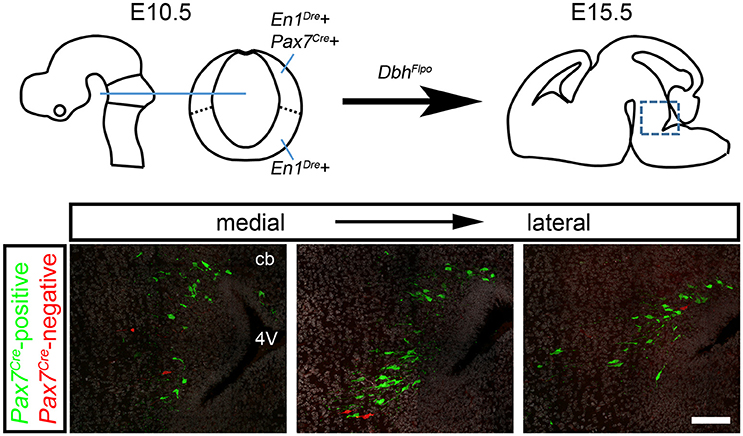
Figure 2. A subpopulation of r0- and r1-derived noradrenergic neurons does not come from the Pax7Cre-defined alar plate. Schematic diagrams show the mouse brain at E10.5 and E15.5. On the sagittal schematic of E15.5 brain, the box indicates the approximate position of immunofluorescent images shown below. In fluorescently labeled parasagittal sections of an E15.5 En1Dre; DbhFlpo; Pax7Cre; RC::RFLTG quadruple heterozygous embryo, the majority of r0- and r1-derived noradrenergic neurons are labeled with eGFP, indicating a history of Pax7Cre expression. At several different points along the mediolateral axis, a few neurons are labeled with tdTomato, indicating an origin outside the Pax7Cre-defined alar plate. DAPI staining (false colored gray) reveals tissue that is not otherwise stained. cb, Cerebellum; 4V, fourth ventricle. Scale bar: 100 μm.
To determine whether this subpopulation contributes to all three regions of the LC complex, we tracked r0- and r1-derived noradrenergic neurons into the adult brain (n = 10 mice) where the LC, SubC, and A7 noradrenergic nuclei can be readily identified. To confirm that fluorescent labeling was restricted to noradrenergic neurons, we immunolabeled with an antibody against tyrosine hydroxylase (TH). We consistently observed Pax7Cre-negative noradrenergic neurons (tdTomato+, TH+) intermingled with Pax7Cre-positive noradrenergic neurons (EGFP+, TH+) in all three regions of the LC complex (Figure 3). As expected, in Pax7Cre-negative controls heterozygous for En1Dre and DbhFlpo, we observed tdTomato in all r0- and r1-derived noradrenergic neurons, and no noradrenergic neurons were labeled in other controls. Thus, we have uncovered two distinct populations within the noradrenergic primordium of En1-defined r0 and r1 that contribute to the adult LC complex.
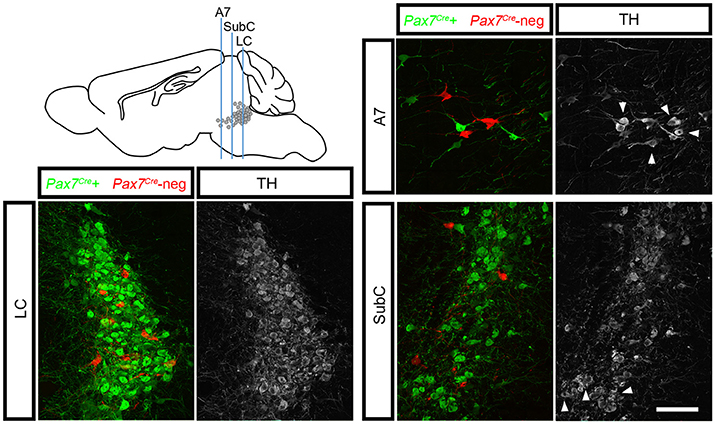
Figure 3. Pax7Cre-negative noradrenergic neurons are distributed throughout the LC complex. Sagittal schematic of the adult mouse brain shows approximate position of coronal sections from the brain of a 3-month old adult En1Dre; DbhFlpo; Pax7Cre; RC::RFLTG quadruple heterozygote. In the locus coeruleus (LC), subcoeruleus (SubC), and A7 nuclei, Pax7Cre-negative noradrenergic neurons (tdTomato) are intermingled with Pax7Cre-positive noradrenergic neurons (EGFP). Anti-tyrosine hydroxylase (TH) immunostaining (gray) confirms the noradrenergic identify of labeled neurons. Noradrenergic neurons in SubC and A7 that originate outside En1Dre-defined r0 and r1 are TH-positive but are not labeled by the indicator allele (arrowheads). Scale bar: 100 μm.
To fully visualize the three-dimensional distribution of these two populations of noradrenergic neurons, we used the passive clarity technique (Yang et al., 2014) to clear adult brain tissue. Imaging and three-dimensional rendering of the intact LC complex (n = 6 mice) demonstrated that Pax7Cre-negative (tdTomato-labeled) and Pax7Cre-positive (EGFP-labeled) noradrenergic neurons are intermingled throughout the rostrocaudal and dorsoventral axes (Figure 4A and Supplementary Video 1). Next, we performed counts of tdTomato and EGFP-labeled neurons (n = 6 mice) to determine the relative contribution of the two subpopulations (Figure 4B). In the bilateral LC complex, we counted 2,326 ± 36 labeled neurons, a value intermediate between two previous estimates of cell numbers in the LC, including an undefined portion of the SubC, from C57BL/6 mice (Berger et al., 1979; Touret et al., 1982). Of that total, 208 ± 18 neurons were Pax7Cre-negative (tdTomato-labeled) and 2,118 ± 36 were Pax7Cre-positive (eGFP-labeled). Thus, the Pax7Cre-negative population constitutes 8.93 ± 0.74% of the full LC complex. Because the LC complex was imaged bilaterally, we were able to compare left and right sides. We observed no significant difference in the number of Pax7Cre-negative (p = 0.755, unpaired t-test) or Pax7Cre-positive neurons (p = 0.677, unpaired t-test).
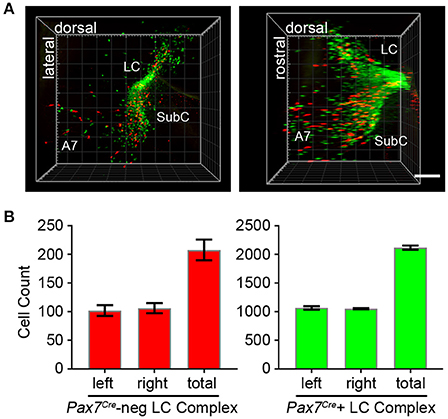
Figure 4. Quantification of Pax7Cre-negative and Pax7Cre-positive noradrenergic neurons in the LC complex. (A) Left LC complex from the brain of an adult En1Dre; DbhFlpo; Pax7Cre; RC::RFLTG quadruple heterozygote cleared via the passive clarity technique (PACT) shows the spatial relationship of the r0- and r1-derived LC, SubC, and A7 nuclei. Immunolabeling of the intact tissue permits counting of Pax7Cre-negative (red) and Pax7Cre-positive (green) noradrenergic neurons throughout the LC complex. Left, view from anterior surface; Right panel, view from medial surface; scale bar, 300 μm. See also Supplementary Video 1. (B) Bilateral cell counts of Pax7Cre-negative and Pax7Cre-positive LC complex noradrenergic neurons from PACT-cleared brains of 4 to 5-month old mice.
To determine if the Pax7Cre-negative population defines a morphologically distinct subset of LC complex neurons, we examined the tissue cleared by PACT. Studies of LC neuron morphology in the rat have previously indicated the existence of three main cell types: medium sized multipolar neurons, medium-sized fusiform neurons, and a few small ovoid neurons (Swanson, 1976; Shimizu et al., 1978; Cintra et al., 1982). Retrograde tracing and immunolabeling has demonstrated that both classes of medium-sized neurons are noradrenergic projection neurons (Loughlin et al., 1986). The identity of the small ovoid cells is uncertain, and different studies disagree as to whether they are noradrenergic (Shimizu et al., 1979; Loughlin et al., 1986). Because the tdTomato-labeled, Pax7Cre-negative neurons were dispersed in the LC complex, we could assess the shape of individual cells, similar to previous studies utilizing Golgi staining (Shimizu et al., 1978; Cintra et al., 1982). Roughly one quarter of the neurons examined were fusiform, and three quarters were multipolar (Figure 5). We did not observe any neurons that could be unequivocally assigned to the small ovoid category. Thus, the subpopulation of LC complex neurons originating outside the Pax7Cre domain appears to include both morphologies of medium sized noradrenergic projection neurons.
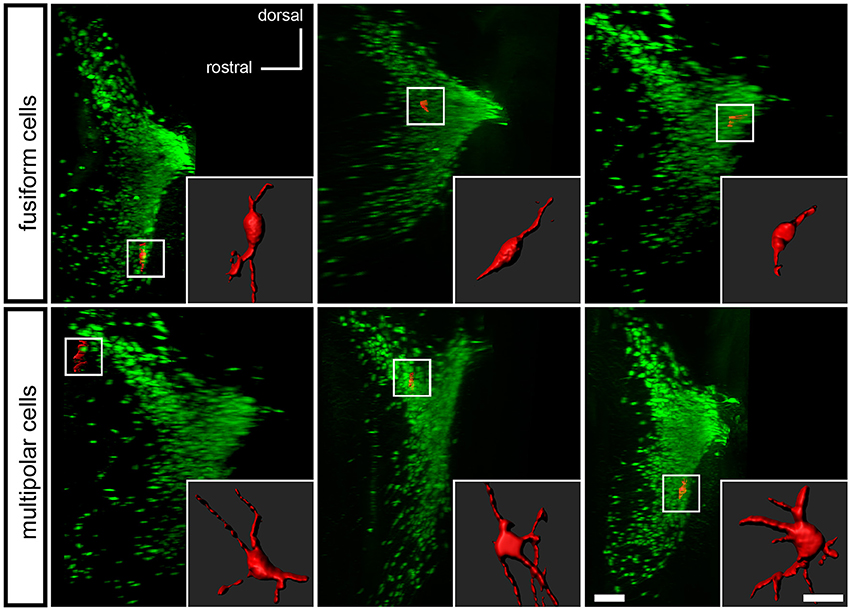
Figure 5. Morphology of Pax7Cre-negative noradrenergic neurons in the LC complex. In the PACT-cleared LC complex of 4–5-month old mice, the Pax7Cre-negative noradrenergic neurons are fusiform, generally with one or more processes at each end of the long axis (top), or multipolar (bottom). A surface rendering of each neuron shown in coronal view is inset on a sagittal view of the LC complex indicating the location of the neuron. Scale bar: 200 μm (LC), 40 μm (individual cells).
Despite its relatively small size, this Pax7Cre-negative subpopulation is likely functionally significant if its axon projection profile differs from that of the larger Pax7Cre-positive subpopulation. To begin to address this question, we compared the axon projection profiles of the two subpopulations by exploiting the unique ability of the RC::RFLTG indicator allele to label axons of both the Pax7Cre-negative (tdTomato+) and Pax7Cre-positive (EGFP+) populations. For the most sensitive detection of axons, we labeled Pax7Cre-positive (EGFP+) and Pax7Cre-negative (tdTomato+) axons separately in sections from adult brain (n = 8 mice) using a horse radish peroxidase-linked secondary antibody and 3,3′-diaminobenzidine (DAB) staining. Axons from the LC complex project throughout the brain and provide the major source of norepinephrine to the cortex and thalamus (Robertson et al., 2013). Upon examination of sections labeled for the Pax7Cre-negative population, we observed a striking absence of axonal inputs to the thalamus (Figure 6). In contrast, inputs from the Pax7Cre-positive population were consistently present in thalamus, and we observed axons from both populations throughout the cortex, although there were fewer Pax7Cre-negative axons, as expected for a smaller population (Figure 6). This axonal projection pattern suggests that the Pax7Cre-negative neurons may be functionally distinct from the larger population of Pax7cre-positive LC complex neurons, highlighting the importance of early gene expression in generating differences in the neuronal circuitry.
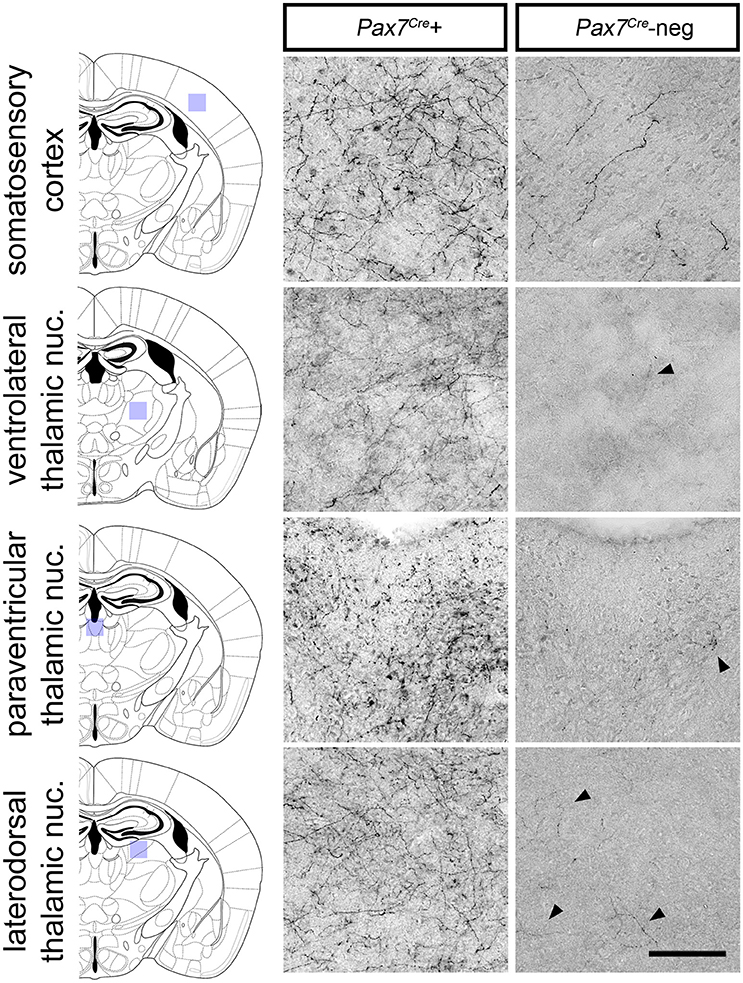
Figure 6. Axonal projections of Pax7Cre-negative and Pax7Cre-positive LC complex noradrenergic neurons. In representative coronal sections from the brain of a 3-month old adult En1Dre; DbhFlpo; Pax7Cre; RC::RFLTG quadruple heterozygote, dense innervation by axons of Pax7Cre-positive (EGFP-labeled) neurons in the LC complex is observed in cortex and thalamus. Axons from the smaller Pax7Cre-negative (tdTomato-labeled) subpopulation are consistently observed in cortex, but they are very sparse in thalamus. Black arrowheads indicate occasional tdTomato-labeled axons in representative sections from thalamic nuclei. Scale bar: 100 μm.
Discussion
Previous studies have clearly shown that neurons of the locus coeruleus are heterogeneous with respect to anteroposterior origin. Our initial intersectional fate mapping experiments demonstrated that the LC is primarily derived from the En1 expression domain encompassing r0 and r1, with a very small subpopulation derived from r2 (Robertson et al., 2013). The more recent single-gene fate mapping using Fgf8Cre showed that noradrenergic neurons derived from r0, as defined by Fgf8 expression, contribute to the dorsal LC while those derived from r1 contribute to the ventral LC (Watson et al., 2017). Our results here reveal that the LC is also developmentally and genetically heterogeneous with respect to dorsoventral origin. Furthermore, the portions of the SubC and A7 nuclei included within the En1-derived LC complex are similarly composed of Pax7Cre-positive and Pax7Cre-negative subpopulations. The projection patterns of the two Pax7Cre-defined subpopulations of the LC complex may point to functional differences; the virtual absence of projections to the thalamus suggests that the Pax7Cre-negative subpopulation does not directly participate in the modulation of thalamic neuron activity performed by the broader LC complex (Berridge and Waterhouse, 2003). Taken together, these new data revealing (1) further heterogeneity within the anatomically defined LC, and (2) genetically defined subpopulations spanning several anatomically defined noradrenergic nuclei, offer further support for the idea that the anatomical divisions of the noradrenergic system are artificial constructs overlaid on natural genetic neuroanatomy arising from developmental history.
Limitations of the current study are the inability to overlay our Pax7Cre-defined noradrenergic fate map on the recently described Fgf8-defined subpopulations of the LC (Watson et al., 2017), and uncertainty regarding the precise dorsoventral origin of the Pax7Cre-negative subpopulation. We observe Pax7Cre-negative noradrenergic neurons throughout the dorsoventral extent of the adult LC complex, suggesting that they originate in both r0 and r1. However, it is possible that they originate in one domain and then migrate among the neurons derived from the other. A subpopulation as small as the Pax7Cre-negative noradrenergic neurons could easily be overlooked in single-gene fate-mapping experiments such as that which defined the dorsal r0-derived and ventral r1-derived LC subpopulations. Additional intersectional fate mapping experiments will be required to answer this question.
We are also unable to determine the precise dorsoventral level of the neural tube that is the source of the Pax7Cre-negative subpopulation of the LC complex, but the basal plate is a likely candidate. Ascl1 (Mash1), a basic helix-loop-helix transcription factor required for noradrenergic neuron differentiation (Hirsch et al., 1998), is expressed in both alar and basal domains (Pattyn et al., 2004). It seems plausible that the basal Ascl1 expression domain could give rise to a small population of noradrenergic neurons. Other possibilities include the floor plate, known to be the origin of dopaminergic neurons in the En1-expressing mesencephalon (Kittappa et al., 2007; Ono et al., 2007; Bonilla et al., 2008; Joksimovic et al., 2009; Blaess et al., 2011), or an as yet undetected alar microdomain which does not express Pax7Cre. We cannot fully rule out mosaic Cre expression within the alar Pax7 expression domain as the source of the Pax7Cre-negative subpopulation, but the consistent size of the subpopulation and its distinct projection profile argue against this interpretation of the data. Efficient Pax7Cre-mediated recombination of a fluorescent Cre indicator that is a direct derivative of RC::RFLTG (Figure 1A) also indicates that the Pax7Cre-negative population is not an artifact of incomplete recombination. Regardless of origin, however, differential Pax7Cre expression reveals two subpopulations of the LC complex that are molecularly distinct and experimentally separable.
Without a marker for the precise dorsoventral domain in which the Pax7Cre-negative subpopulation arises, its function cannot be experimentally assessed using genetic tools that depend on recombinase expression to drive intersectional expression of effector molecules such as hM3Dq (Sciolino et al., 2016). However, our ability to fluorescently label these two LC complex subpopulations would permit transcriptional profiling to identify differentially expressed genes, and subsequent generation of a recombinase driver expressed in the Pax7Cre-negative subpopulation. These future investigations promise to extend our knowledge of how embryonic cells with different developmental origins combine to give rise to the molecular and cellular heterogeneity of the mature LC complex. Such knowledge will be required for an understanding of how heterogeneity within the LC complex contributes to its regulation of diverse behaviors in the adult, and the roles that its dysfunction plays in neurological disease.
Author Contributions
PJ and NP designed and planned the experiments. PJ, NP, ES, KS, and CT performed the experiments. PJ, NP, KS, and ES analyzed the data. NP and ES prepared the figures. PJ and NP wrote the manuscript with input from co-authors.
Funding
This research was supported by the Intramural Research Program of the US National Institutes of Health, National Institute of Environmental Health Sciences (ZIA-ES-102805).
Conflict of Interest Statement
The authors declare that the research was conducted in the absence of any commercial or financial relationship that could be construed as a conflict of interest.
Acknowledgments
We thank G. Jones for technical assistance. Valuable support was provided by the NIEHS Comparative Medicine Branch and Dr. G. Kissling of the Biostatistics and Computational Biology Branch.
Supplementary Material
The Supplementary Material for this article can be found online at: https://www.frontiersin.org/article/10.3389/fnana.2017.00060/full#supplementary-material
Supplementary Video 1. The intact structure of the LC complex and the spatial relationship of PaxCre-positive and Pax7Cre negative subpopulations are revealed in brain tissue cleared by the passive clarity techinque. After PACT clearing and immunostaining of En1Dre; DbhFlpo; Pax7Cre; RC::RFLTG quadruple heterozygous brain, the noradrenergic neurons of the LC complex are observed to form a continuum. Pax7Cre-negative (tdTomato-labeled) neurons are intermingled with Pax7Cre-positive (EGFP-labeled) neurons throughout the dorsoventral and anteroposterior axes of the LC complex. At the beginning of the movie, the LC complex is viewed from the anterior, with the lateral surface to the left.
References
Anastassiadis, K., Fu, J., Patsch, C., Hu, S., Weidlich, S., Duerschke, K., et al. (2009). Dre recombinase, like Cre, is a highly efficient site-specific recombinase in E. coli, mammalian cells and mice. Dis. Model. Mech. 2, 508–515. doi: 10.1242/dmm.003087
Aroca, P., Lorente-Canovas, B., Mateos, F. R., and Puelles, L. (2006). Locus coeruleus neurons originate in alar rhombomere 1 and migrate into the basal plate: studies in chick and mouse embryos. J. Comp. Neurol. 496, 802–818. doi: 10.1002/cne.20957
Berger, B., Herve, D., Dolphin, A., Barthelemy, C., Gay, M., and Tassin, J. P. (1979). Genetically determined differences in noradrenergic input to the brain cortex: a histochemical and biochemical study in two inbred strains of mice. Neuroscience 4, 877–888. doi: 10.1016/0306-4522(79)90172-6
Berridge, C. W., and Waterhouse, B. D. (2003). The locus coeruleus-noradrenergic system: modulation of behavioral state and state-dependent cognitive processes. Brain Res. Brain Res. Rev. 42, 33–84. doi: 10.1016/S0165-0173(03)00143-7
Blaess, S., Bodea, G. O., Kabanova, A., Chanet, S., Mugniery, E., Derouiche, A., et al. (2011). Temporal-spatial changes in Sonic Hedgehog expression and signaling reveal different potentials of ventral mesencephalic progenitors to populate distinct ventral midbrain nuclei. Neural Dev. 6:29. doi: 10.1186/1749-8104-6-29
Bonilla, S., Hall, A. C., Pinto, L., Attardo, A., Götz, M., Huttner, W. B., et al. (2008). Identification of midbrain floor plate radial glia-like cells as dopaminergic progenitors. Glia 56, 809–820. doi: 10.1002/glia.20654
Chambers, D., Wilson, L. J., Alfonsi, F., Hunter, E., Saxena, U., Blanc, E., et al. (2009). Rhombomere-specific analysis reveals the repertoire of genetic cues expressed across the developing hindbrain. Neural Dev. 4:6. doi: 10.1186/1749-8104-4-6
Chandler, D. J., Gao, W. J., and Waterhouse, B. D. (2014). Heterogeneous organization of the locus coeruleus projections to prefrontal and motor cortices. Proc. Natl. Acad. Sci. U.S.A. 111, 6816–6821. doi: 10.1073/pnas.1320827111
Cintra, L., Diaz-Cintra, S., Kemper, T., and Morgane, P. J. (1982). Nucleus locus coeruleus: a morphometric Golgi study in rats of three age groups. Brain Res. 247, 17–28. doi: 10.1016/0006-8993(82)91023-X
Dahlström, A., and Fuxe, K. (1964). Evidence for the existence of monoamine-containing neurons in the central nervous system. I. demonstration of monoamines in the cell bodies of brain stem neurons. Acta Physiol. Scand. Suppl. 62, 1–55.
Di Bonito, M., and Studer, M. (2017). Cellular and molecular underpinnings of neuronal assembly in the central auditory system during mouse development. Front. Neural Circuits 11:18. doi: 10.3389/fncir.2017.00018
Echelard, Y., Epstein, D. J., St-Jacques, B., Shen, L., Mohler, J., McMahon, J. A., et al. (1993). Sonic hedgehog, a member of a family of putative signaling molecules, is implicated in the regulation of CNS polarity. Cell 75, 1417–1430. doi: 10.1016/0092-8674(93)90627-3
German, D. C., Manaye, K. F., White, C. L. III., Woodward, D. J., McIntire, D. D., Smith, W. K., et al. (1992). Disease-specific patterns of locus coeruleus cell loss. Ann. Neurol. 32, 667–676. doi: 10.1002/ana.410320510
Hirsch, M. R., Tiveron, M. C., Guillemot, F., Brunet, J. F., and Goridis, C. (1998). Control of noradrenergic differentiation and Phox2a expression by MASH1 in the central and peripheral nervous system. Development 125, 599–608.
Holets, V. R., Hokfelt, T., Rokaeus, A., Terenius, L., and Goldstein, M. (1988). Locus coeruleus neurons in the rat containing neuropeptide Y, tyrosine hydroxylase or galanin and their efferent projections to the spinal cord, cerebral cortex and hypothalamus. Neuroscience 24, 893–906. doi: 10.1016/0306-4522(88)90076-0
Jensen, P., and Dymecki, S. M. (2014). Essentials of recombinase-based genetic fate mapping in mice. Methods Mol. Biol. 1092, 437–454. doi: 10.1007/978-1-60327-292-6_26
Joksimovic, M., Yun, B. A., Kittappa, R., Anderegg, A. M., Chang, W. W., Taketo, M. M., et al. (2009). Wnt antagonism of Shh facilitates midbrain floor plate neurogenesis. Nat. Neurosci. 12, 125–131. doi: 10.1038/nn.2243
Joyner, A. L., and Sudarov, A. (2012). “Genetic Neuroanatomy” in The Mouse Nervous System, eds C. Watson, G. Paxinos and L. Puelles (San Diego, CA: Academic Press), 36–50.
Keller, C., Hansen, M. S., Coffin, C. M., and Capecchi, M. R. (2004). Pax3:Fkhr interferes with embryonic Pax3 and Pax7 function: implications for alveolar rhabdomyosarcoma cell of origin. Genes. Dev. 18, 2608–2613. doi: 10.1101/gad.1243904
Kittappa, R., Chang, W. W., Awatramani, R. B., and McKay, R. D. (2007). The foxa2 gene controls the birth and spontaneous degeneration of dopamine neurons in old age. PLoS Biol. 5:e325. doi: 10.1371/journal.pbio.0050325
Krumlauf, R., Marshall, H., Studer, M., Nonchev, S., Sham, M. H., and Lumsden, A. (1993). Hox homeobox genes and regionalisation of the nervous system. J. Neurobiol. 24, 1328–1340. doi: 10.1002/neu.480241006
Li, Y., Hickey, L., Perrins, R., Werlen, E., Patel, A. A., Hirschberg, S., et al. (2016). Retrograde optogenetic characterization of the pontospinal module of the locus coeruleus with a canine adenoviral vector. Brain Res. 1641(Pt. B), 274–290. doi: 10.1016/j.brainres.2016.02.023
Liem, K. F. Jr., Tremml, G., and Jessell, T. M. (1997). A role for the roof plate and its resident TGFbeta-related proteins in neuronal patterning in the dorsal spinal cord. Cell 91, 127–138. doi: 10.1016/S0092-8674(01)80015-5
Liem, K. F. Jr., Tremml, G., Roelink, H., and Jessell, T. M. (1995). Dorsal differentiation of neural plate cells induced by BMP-mediated signals from epidermal ectoderm. Cell 82, 969–979. doi: 10.1016/0092-8674(95)90276-7
Loughlin, S. E., Foote, S. L., and Grzanna, R. (1986). Efferent projections of nucleus locus coeruleus: morphologic subpopulations have different efferent targets. Neuroscience 18, 307–319. doi: 10.1016/0306-4522(86)90156-9
Mohideen, S. S., Ichihara, G., Ichihara, S., and Nakamura, S. (2011). Exposure to 1-bromopropane causes degeneration of noradrenergic axons in the rat brain. Toxicology 285, 67–71. doi: 10.1016/j.tox.2011.04.005
Moreno-Bravo, J. A., Perez-Balaguer, A., Martinez-Lopez, J. E., Aroca, P., Puelles, L., Martinez, S., et al. (2014). Role of Shh in the development of molecularly characterized tegmental nuclei in mouse rhombomere 1. Brain Struct. Funct. 219, 777–792. doi: 10.1007/s00429-013-0534-6
Ono, Y., Nakatani, T., Sakamoto, Y., Mizuhara, E., Minaki, Y., Kumai, M., et al. (2007). Differences in neurogenic potential in floor plate cells along an anteroposterior location: midbrain dopaminergic neurons originate from mesencephalic floor plate cells. Development 134, 3213–3225. doi: 10.1242/dev.02879
Pattyn, A., Simplicio, N., van Doorninck, J. H., Goridis, C., Guillemot, F., and Brunet, J. F. (2004). Ascl1/Mash1 is required for the development of central serotonergic neurons. Nat. Neurosci. 7, 589–595. doi: 10.1038/nn1247
Paxinos, G., and Franklin, K. B. J. (2013). The Mouse Brain in Stereotaxic Coordinates. San Diego, CA: Academic Press.
Plummer, N. W., de Marchena, J., and Jensen, P. (2016). A knock-in allele of En1 expressing dre recombinase. Genesis 54, 447–454. doi: 10.1002/dvg.22954
Plummer, N. W., Evsyukova, I. Y., Robertson, S. D., de Marchena, J., Tucker, C. J., and Jensen, P. (2015). Expanding the power of recombinase-based labeling to uncover cellular diversity. Development 142, 4385–4393. doi: 10.1242/dev.129981
Robertson, S. D., Plummer, N. W., de Marchena, J., and Jensen, P. (2013). Developmental origins of central norepinephrine neuron diversity. Nat. Neurosci. 16, 1016–1023. doi: 10.1038/nn.3458
Robertson, S. D., Plummer, N. W., and Jensen, P. (2016). Uncovering diversity in the development of central noradrenergic neurons and their efferents. Brain Res. 1641(Pt. B), 234–244. doi: 10.1016/j.brainres.2015.11.023
Rodriguez, C. I., Buchholz, F., Galloway, J., Sequerra, R., Kasper, J., Ayala, R., et al. (2000). High-efficiency deleter mice show that FLPe is an alternative to Cre-loxP. Nat. Genet. 25, 139–140. doi: 10.1038/75973
Schindelin, J., Arganda-Carreras, I., Frise, E., Kaynig, V., Longair, M., Pietzsch, T., et al. (2012). Fiji: an open-source platform for biological-image analysis. Nat. Methods 9, 676–682. doi: 10.1038/nmeth.2019
Sciolino, N. R., Plummer, N. W., Chen, Y. W., Alexander, G. M., Robertson, S. D., Dudek, S. M., et al. (2016). Recombinase-dependent mouse lines for chemogenetic activation of genetically defined cell types. Cell Rep. 15, 2563–2573. doi: 10.1016/j.celrep.2016.05.034
Shimizu, N., Katoh, Y., Hida, T., and Satoh, K. (1979). The fine structural organization of the locus coeruleus in the rat with reference to noradrenaline contents. Exp. Brain Res. 37, 139–148. doi: 10.1007/BF01474260
Shimizu, N., Ohnishi, S., Satoh, K., and Tohyama, M. (1978). Cellular organization of locus coeruleus in the rat as studied by Golgi method. Arch. Histol. Jpn. 41, 103–112. doi: 10.1679/aohc1950.41.103
Swanson, L. W. (1976). The locus coeruleus: a cytoarchitectonic, Golgi and immunohistochemical study in the albino rat. Brain Res. 110, 39–56. doi: 10.1016/0006-8993(76)90207-9
Theofilas, P., Ehrenberg, A. J., Dunlop, S., Di Lorenzo Alho, A. T., Nguy, A., Leite, R. E., et al. (2017). Locus coeruleus volume and cell population changes during Alzheimer's disease progression: a stereological study in human postmortem brains with potential implication for early-stage biomarker discovery. Alzheimer. Dement. 13, 236–246. doi: 10.1016/j.jalz.2016.06.2362
Touret, M., Valatx, J. L., and Jouvet, M. (1982). The locus coeruleus: a quantitative and genetic study in mice. Brain Res. 250, 353–357. doi: 10.1016/0006-8993(82)90430-9
Watson, C., Shimogori, T., and Puelles, L. (2017). Mouse Fgf8-Cre-LacZ lineage analysis defines the territory of the postnatal mammalian isthmus. J. Comp. Neurol. 525, 2782–2799. doi: 10.1002/cne.24242
Keywords: intersectional fate mapping, recombinases, locus coeruleus, norepinephrine, Pax7, En1, Dbh, rhombomeres
Citation: Plummer NW, Scappini EL, Smith KG, Tucker CJ and Jensen P (2017) Two Subpopulations of Noradrenergic Neurons in the Locus Coeruleus Complex Distinguished by Expression of the Dorsal Neural Tube Marker Pax7. Front. Neuroanat. 11:60. doi: 10.3389/fnana.2017.00060
Received: 31 May 2017; Accepted: 07 July 2017;
Published: 20 July 2017.
Edited by:
Sandra Blaess, University of Bonn, GermanyReviewed by:
Carlos A. Mejias-Aponte, National Institute on Drug Abuse (NIH), United StatesClaude Brodski, Ben-Gurion University of the Negev, Beersheba, Israel
Copyright © 2017 At least a portion of this work is authored by Plummer, Scappini, Smith, Tucker and Jensen on behalf of the U.S. Government and, as regards. Plummer, Scappini, Smith, Tucker and Jensen and the US government, is not subject to copyright protection in the United States. Foreign and other copyrights may apply. This is an open-access article distributed under the terms of the Creative Commons Attribution License (CC BY). The use, distribution or reproduction in other forums is permitted, provided the original author(s) or licensor are credited and that the original publication in this journal is cited, in accordance with accepted academic practice. No use, distribution or reproduction is permitted which does not comply with these terms.
*Correspondence: Patricia Jensen, patricia.jensen@nih.gov