Theta motion processing in fruit flies
- 1 Department of Integrative Biology and Physiology, Howard Hughes Medical Institute, University of California Los Angeles, Los Angeles, CA, USA
- 2 Tanner Research, Inc., Monrovia, CA, USA
- 3 Departments of Psychology and Neurobiology, David Geffen School of Medicine, Jules Stein Eye Institute, University of California Los Angeles, Los Angeles, CA, USA
The tiny brains of insects presumably impose significant computational limitations on algorithms controlling their behavior. Nevertheless, they perform fast and sophisticated visual maneuvers. This includes tracking features composed of second-order motion, in which the feature is defined by higher-order image statistics, but not simple correlations in luminance. Flies can track the true direction of even theta motions, in which the first-order (luminance) motion is directed opposite the second-order moving feature. We exploited this paradoxical feature tracking response to dissect the particular image properties that flies use to track moving objects. We find that theta motion detection is not simply a result of steering toward any spatially restricted flicker. Rather, our results show that fly high-order feature tracking responses can be broken down into positional and velocity components – in other words, the responses can be modeled as a superposition of two independent steering efforts. We isolate these elements to show that each has differing influence on phase and amplitude of steering responses, and together they explain the time course of second-order motion tracking responses during flight. These observations are relevant to natural scenes, where moving features can be much more complex.
Introduction
A fly carries in its tiny brain all the neural circuitry necessary to detect and respond to important features of its environment. Features such as small moving targets generated by predators and panoramic optic flow fields generated by self movement are signaled specifically by relative motion cues. But detecting even simple, so-called first-order visual motion (i.e., with coherent space-time correlations in luminance) (Figure 1A) requires nonlinear neural processing downstream of luminance detecting photoreceptors (Borst and Egelhaaf, 1989). Furthermore, there exist higher-order classes of more complex motion signals. Humans and several other animals can see motion that does not contain first-order space-time correlations in luminance and which requires them to track higher-order features of the scene, such as pattern or contrast (Figure 1B) (Chubb and Sperling, 1988). This is called drift-balanced motion, and although it may be present in nature, it lacks the spatial and temporal luminance correlations found in first-order motion, and so requires additional neural processing to extract from a scene. Taking this concept one step further, a motion signal may even include negative correlations with luminance (Figure 1C). This is called paradoxical or theta motion (Zanker, 1990, 1993) and because the first- and second-order cues are oriented in opposite directions it might be expected to require still more computational overhead to detect.
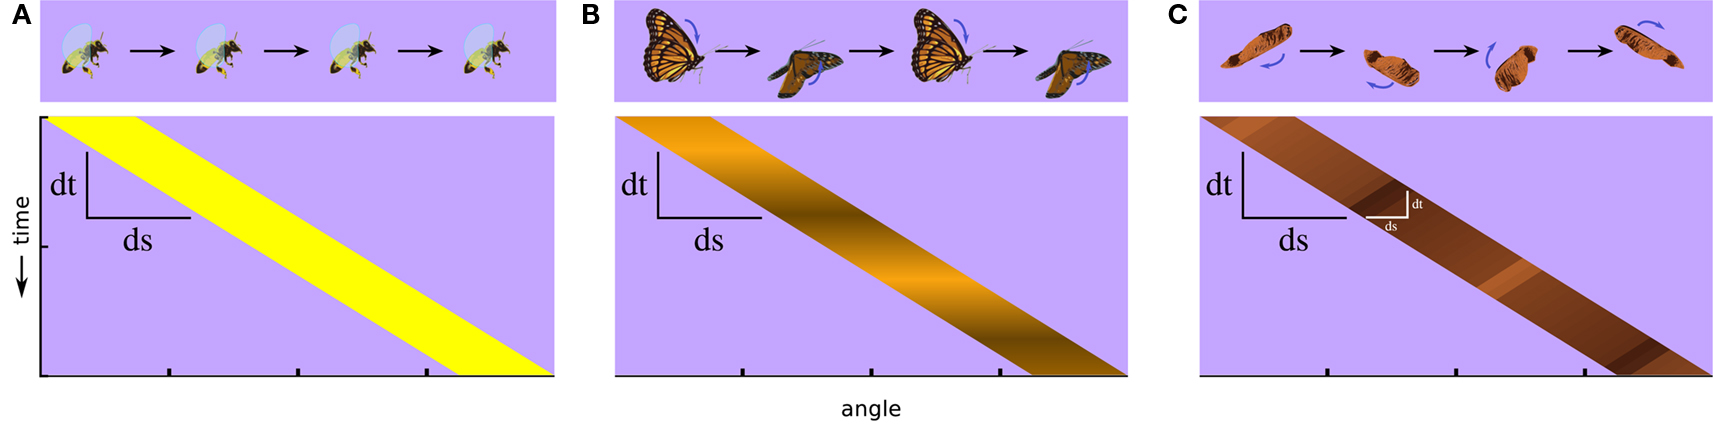
Figure 1. Classes of visual motion and their corresponding space-time plots of luminance. (A) A simple moving object, such as a flying bee, produces for viewers approximate first-order motion, luminance in one position that correlates with luminance at an offset position and a later time. (B) If the luminance flickers, such as with fluttering butterfly wings, the luminance correlation can break down, and luminance-related signals can end up uncorrelated or negatively correlated after a spatial and temporal offset. This illustrates a case of second-order motion. (C) If the internal motion of an object is opposite to its motion as a whole, as with the wing of this maple fruit when it is twirling in the opposite direction of its trajectory, it produces another type of second-order motion called theta motion, in which the first-order luminance correlations and second-order motion cues occur in opposite directions. Whereas stimuli in both (B,C) contain some first-order motion, it is weak by comparison to the higher-order cues.
Previous work has shown that flies tethered in two different electronic visual flight simulator configurations track both first- and second-order motion, including theta motion (Figure 1C) (Theobald et al., 2008). However, when flies are presented with a wide-field yaw stimulus, such as a drum of stripes rotating around their body, they adjust their wing kinematics to steer with it (Götz, 1968, 1975; Theobald et al., 2010). In a closed feedback loop, this optomotor response minimizes visual retinal slip, and is thus functionally analogous to the human optokinetic response (Miles and Wallman, 1993). For example, when surrounded with a wide-field grating of vertical bars drifting to the right, a fly attempts to follow the motion by steering to the right. A similar but weaker response is evident for a stimulus that does not surround the fly, but rather comprises a small, restricted field of moving vertical bars. On the other hand, flies also track small contrasting features that sweep over a wide fraction of the visual field. If the small field grating sweeps coherently across the retina as a cohesive feature, then a fly actively fixates its position on the frontal retina as if it were a solid object (Reichardt et al., 1989; Egelhaaf and Borst, 1993; Kimmerle et al., 1996).
Theta motion is the combination of these two types of motion in a paradoxical way. It consists of a small field stimulus, but one in which the small field window is itself an object that sweeps in one direction, while the pattern inside the window moves in the opposite direction. So when flies track theta motion, they do not minimize retinal slip associated with the first-order motion, but rather maximize it with respect to the direction of bar motion. In order to track theta motion, the fly brain must somehow suppress or bias the small field optomotor response.
The brains of dipteran insects house wide-field neurons that respond robustly to patterns of first-order motion via spatial integration of local elementary motion detectors (EMDs, Hausen, 1982a,b; Egelhaaf et al., 1989). At least one such wide-field neuron, however, does show sensitivity to higher-order motion (Quenzer and Zanker, 1991) – although it cannot explain the flies’ ability to track theta stimuli. In one experiment, blowflies were exposed in the right eye to random dot patterns that implemented first- and second-order types of motion, while extracellular recordings were made of H1, a spiking neuron located in the lobula plate region, on the ipsilateral side. The results reiterated that these neurons are directionally selective to first-order motion. Large field, small field, and moving target first-order motion all excited H1 when moving in the preferred direction back to front, and slightly suppressed spike rate when moving in the null front to back direction (Quenzer and Zanker, 1991). Drift-balanced second-order motion produced a similar response, despite lacking a first-order luminance motion component, exciting the cell in the preferred direction and inhibiting it in the null. Curiously, theta motion excited H1 in either direction; however, the response was strongest to null direction movement of the theta object (i.e., preferred direction motion of the internal dots). In other words, when viewing theta motion the H1 neuron responds more strongly to the first-order small field component than to the than the directional motion of the whole feature (Quenzer and Zanker, 1991). Indeed, the classical delay-and-correlate elementary motion detection model is sensitive only to the first-order small field grating motion, not higher-order theta motion (Theobald et al., 2008). In order to explain the H1 response, Quenzer and Zanker (1991) thus proposed that additional nonlinear processing may be present in the visual pathway, and in particular they simulated the consequences of rectifying nonlinearities prior to motion detection, and of cascaded correlational motion detector stages, as possible mechanisms for sensitivity to drift-balanced and theta stimuli.
In order to determine how a fruit fly successfully tracks theta motion, we dissected the stimulus into two parts: motion of the object, and motion within the object. By measuring wing beat kinematics while manipulating these two components independently, we find that object tracking can be explained as the superposition of two responses, a high-order feature detection response and a first-order wide-field response. The two subsystems are discernible in part because they show different phase relationships to the stimuli used to evoke responses, consistent with significant differences in the temporal characteristics, including time latencies, of the processing involved.
Materials and Methods
Subject Preparation
We collected adult female Drosophila melanogaster (Meigen) 3–5 days after eclosion. The colony was kept on a 16:8 h light/dark cycle, and fed a standard media diet. Each fly was cold anesthetized, glued by the dorsal thorax to a short segment of 0.1 mm rigid tungsten wire (tethered), and then allowed to recover for approximately an hour. A fly was then suspended in the center of a cylindrical arena of blue (emissions maximum at 465 nm) light emitting diodes (Figure 2A), 88 diodes wrapping around 330 horizontal degrees by 24 diodes spanning 120 vertical degrees (Duistermars et al., 2007; Reiser and Dickinson, 2008). From the perspective of the fly, diodes are spaced about 3.5° apart, finer than the roughly 5° interommatidial angle in Drosophila eyes (Heisenberg and Wolf, 1984), a cover about 79% of possible viewing angles. When fully lit, the diodes produce 72 Cd/m2, and a contrast measured at 93% between on and off diodes in a dark room.
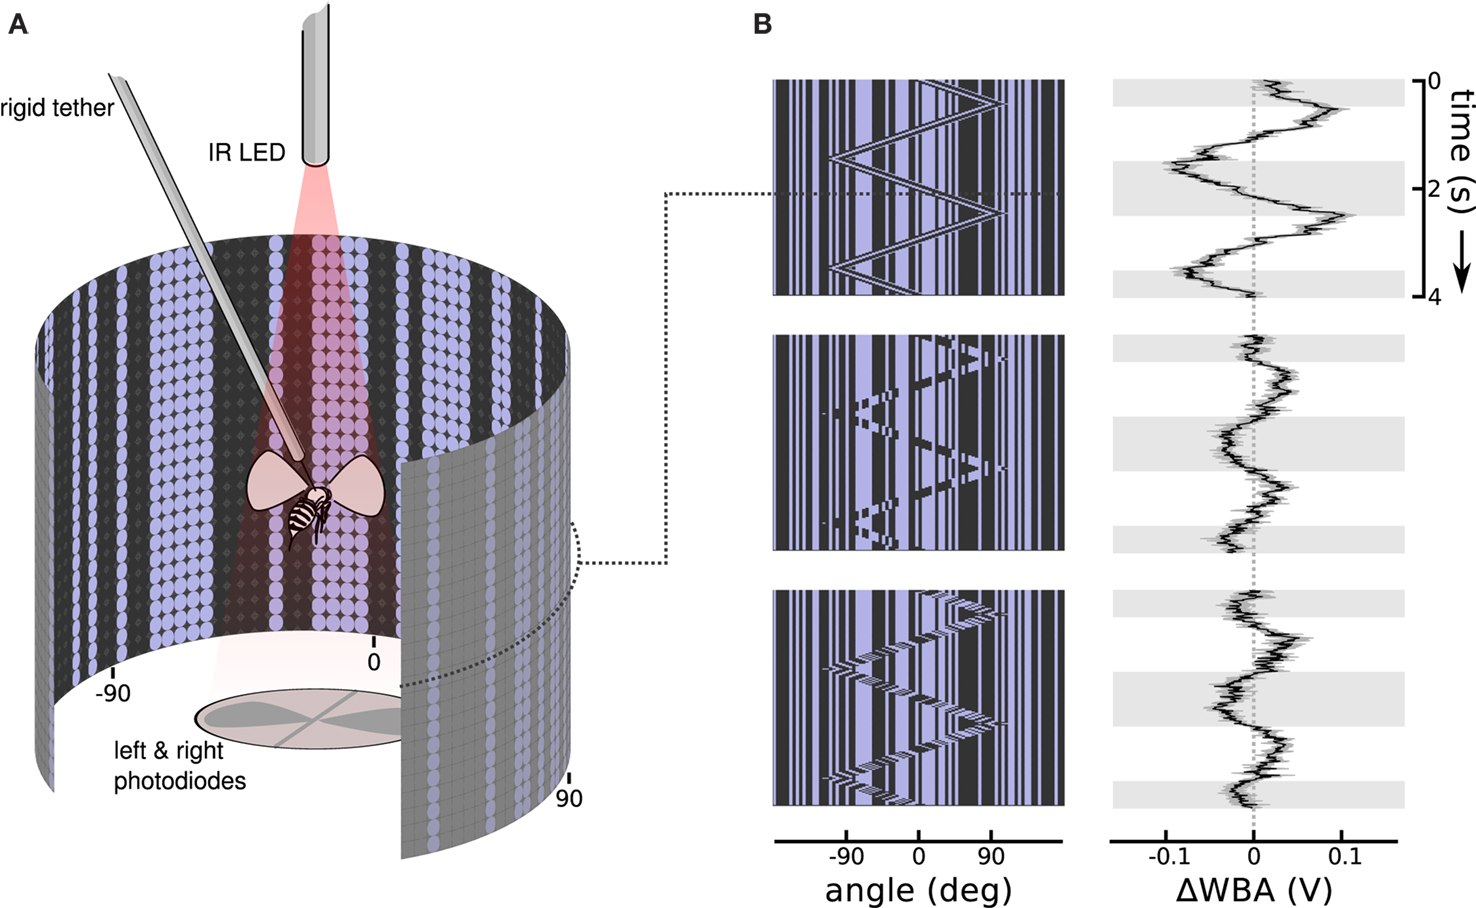
Figure 2. Stimulus and response patterns of a flying fruit fly. (A) A rigid tether suspends a fruit fly in the middle of a cylindrical display of random vertical stripes, while an infrared light casts shadows of the left and right wing beats onto photodiodes below. The dot pattern on the cylinder wall illustrates the matrix of on and off LEDs. Angles at −90°, 0°, and 90° relative to the fly’s forward orientation are labeled below. (B) Space time plots illustrate the moving images in the arena by collapsing the instantaneous vertical stripe pattern into a single row, then stacking the updated rows downward as time progresses. To the right, response plots show the steering response, ΔWBA (left minus right wing beat amplitude), superimposed onto gray and white shading that indicate when bar moved right and left, respectively. The top row shows that flies strongly track a first-order Fourier bar, in which the bar is coherent 30° wide vertical pattern of pixels moving right and left. The center row shows flies respond, but more weakly, to a second-order stimulus in which the bar moves but the pattern within it does not, in other words the bar is a sort of moving window revealing a second random pattern behind the first. The bottom row shows that flies also respond, but with a noticeable lag, to theta motion, in which the bar and pattern within the bar move in opposite directions. Each response trace is the mean of 75 flies in black flanked by the standard error in gray.
Stimuli
The stimuli during experiments consisted of vertical columns, each one either lit or unlit at random to produce a static background (except in the cases where the background flickered). Because these columns did not vary vertically, we could implement row compression in the arena controllers and produce a maximum frame rate of 372Hz. A 30° vertical bar (8 LEDs wide by 24 high) was then superimposed on the static background pattern, and was defined by some sort of relative motion within the bar (Figure 2B). The motion of the bar itself, distinct from the motion of the pixels within, followed a triangle wave, usually at 0.5 Hz for 4 s (two cycles), with a maximum displacement of 90° left and right of the forward facing (0°) fly. Because at any moment each row in the arena is identical, we can represent the state of the whole visual display with just one row, showing which columns are lit and unlit. Stacking these individual pixel rows, each below the previous screen in time, creates space-time plots that show the progression of the animated display (Figure 1B) with viewing angles relative to the fly extending left and right on the horizontal axis and time progressing downwards on the vertical axis.
Response Measurements
An infrared light emitting diode, invisible to the fly, projected shadows of the flapping wings onto a pair of photodiodes, which then measured the stroke to stroke wing beat amplitude (Figure 2A). The dorsal tungsten tether immobilizes the fly without interfering with wing strokes. A fly in good condition could flap its wings and respond to visual stimuli for tens of minutes without pause. The photodiode signals are conditioned to produce time varying voltages proportional to the position of each wing. The peak voltages are proportional to the amplitude of the left and right wing stroke. To measure steering responses we used the difference of the maximum extent of left and right wing beat amplitudes, ΔWBA, a metric that is proportional to yaw torque (Götz, 1987; Frye and Dickinson, 2004; Tammero et al., 2004). A healthy Drosophila makes over 200 wing beats per second, and the estimate of left and right wing beat amplitudes updates with each stroke and is digitally sampled at 500 Hz. Response plots are shown next to the space time stimulus plots, with time plotted vertically downward, and ΔWBA plotted left and right on the horizontal axis. When ΔWBA is negative (left of the dotted line at 0) the right wing beat amplitude is greater than the left, and the fly is attempting to steer left; when it is positive (right of the dotted line) the left wing beat amplitude is greater and the fly is attempting to steer right.
Each fly was presented with each trial only a single time, and different types of stimuli in an experiment were always presented in a random order. Between each trial, flies were presented with a bright, six pixel (22.5°) wide vertical bar for 4 s, which they could move through different angular positions in closed loop with their wing beats. This kept them in a state of active flight control and object fixation between trials (Reichardt and Wenking, 1969; Heisenberg and Wolf, 1979) and ensured they began each trial in a similar behavioral state. The only criterion for eventual inclusion in the results was that a fly continued to flap its wings for the duration of the trials.
Results
Theta Motion Tracking Against a Random Flickering Background
The theta motion tracking previously documented took place against a static background (Theobald et al., 2008), and this protocol generates the same second-order motion cues at the boundary between object and the background as do drift-balanced stimuli – in other words, leaving open the possibility that rather than tracking the object based on the paradoxical motion, flies were instead steering toward the relative flicker of the bar against the background. (Indeed, we confirmed with similar unpublished trials that flies do in fact track bars that are defined only by random flicker.) To establish that flies can track theta bars independently from the flicker that they may contain, we designed two stimuli that added flicker to the background while simultaneously presenting the theta bar. In the first design, a single random background pattern was displayed, but reversed contrast with each time step (typically 20 ms). In the second design, a new random background pattern appeared at each time step. In both conditions, the background did not contain any systematic motion information, and the theta bar was superimposed to produce a stimulus that was nearly invisible to human observers. The results show that the distracting background flicker reduces, but does not eliminate, flies’ tracking response to the theta bar (Figure 3). Even in the most challenging case of random background flicker, in which transient motion cues may be manifest locally in the background pattern, the flies persisted in tracking the theta bar (Figure 3B).
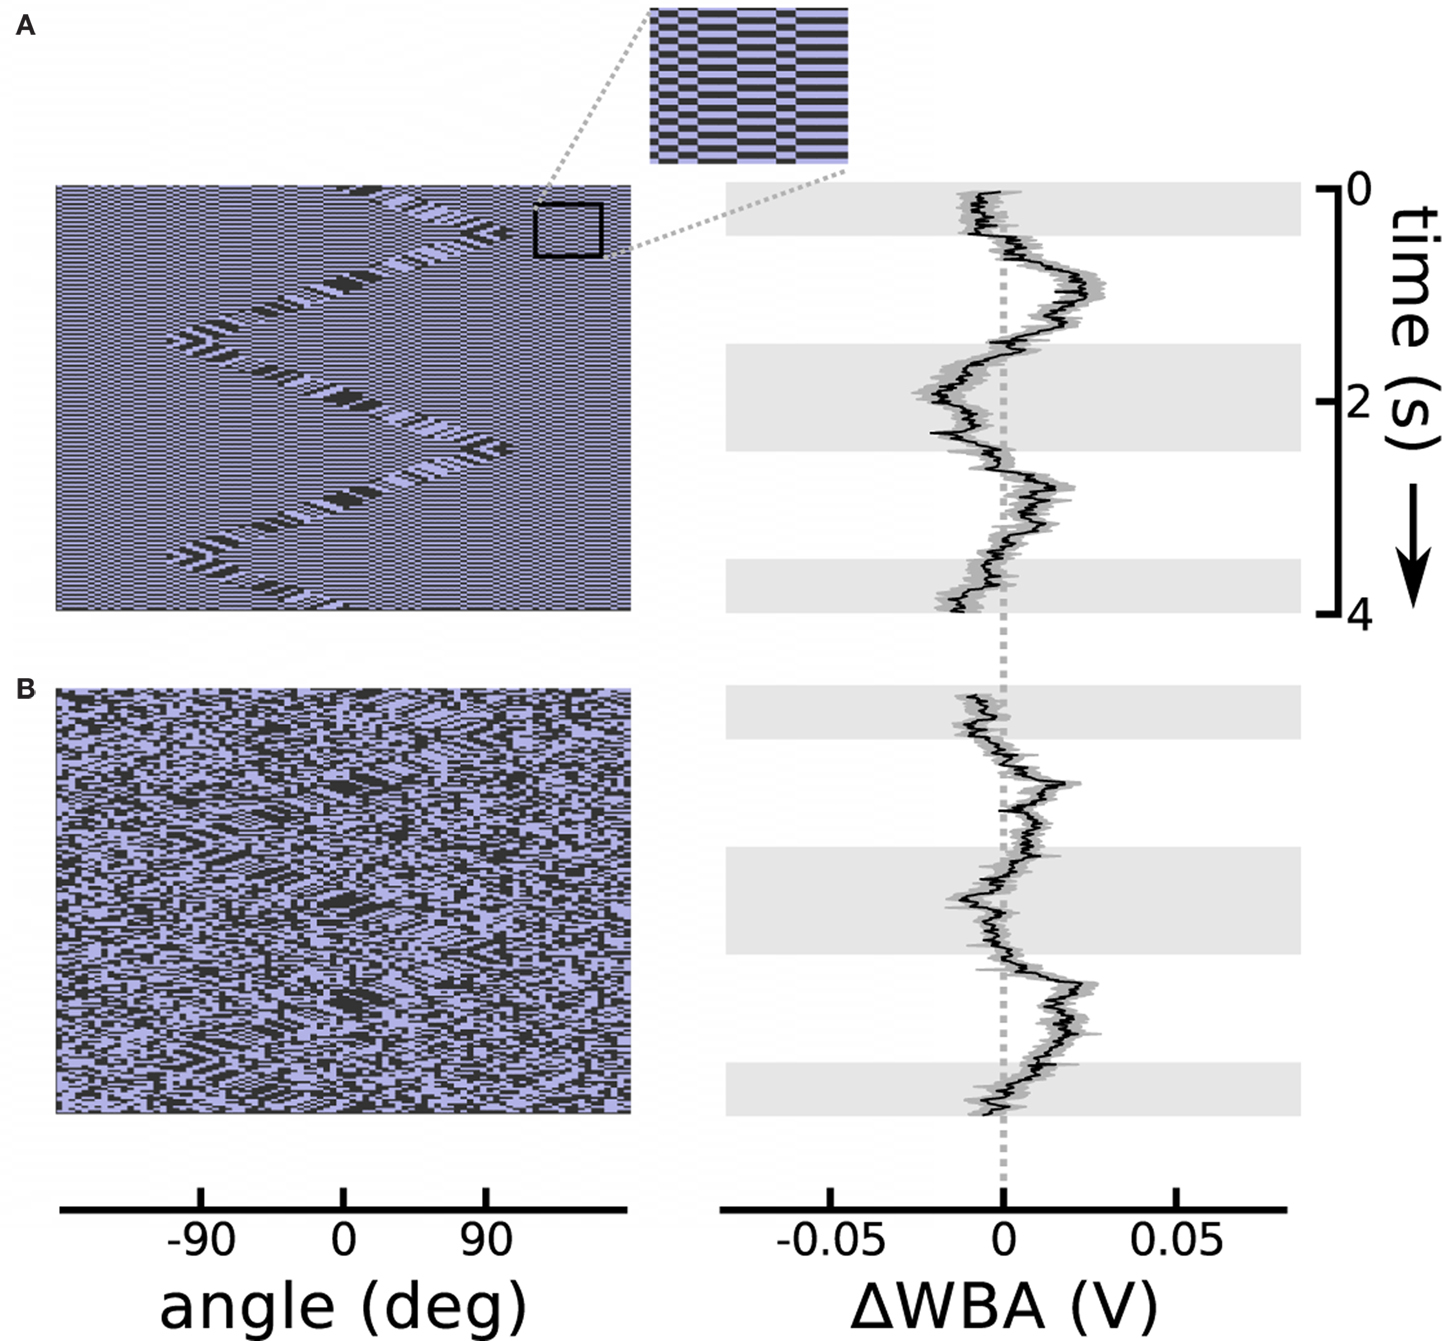
Figure 3. Theta motion with dynamic backgrounds. (A) Repeating the theta motion experiment in Figure 2, but with a background in which each pixel changes sign each time step and creates luminous flicker. An outset shows a segment of the background magnified 300% for clarity. The response follows the bar rather than the first-order within-bar motion with a delay similar to the bar alone. (B) The background pixels take on random values in each time step. In this case the response is weaker, as this is a very noisy stimulus, but the flies’ mean response is still clearly visible. The response plots show the means of 74 flies each flanked in gray by one standard error in each direction. Horizontal gray shading indicates time epochs when the bar was moving left to right, white shading indicates motion right to left.
Responses to Compound Position and Velocity Signals
A consistent characteristic of theta bar tracking, which persisted under all experimental conditions, is a substantial phase lag compared to the nearly instantaneous responses to the first-order bar. The phase lag is such that the initial steering response appears to transiently track just the first-order component of small field motion within the theta bar (see Figure 2B). This robust result motivated the hypothesis that there are two separable response components, one faster than the other. Therefore, to characterize the contribution of the first-order component of theta bar tracking, we explored the small field effect as a function of angular position across the fly’s wide-field of view. In this experiment, we held the bar still, but presented small field motion within the bar. We repeated this at seven equidistant azimuthal positions in the frontal 180° visual field (Figure 4A illustrates the space time plots of three offsets). This class of stimulus therefore consists of a small vertical field placed in front of the animal or displaced to the right or left, with a grating moving internally along a triangle wave trajectory; this is a first-order stimulus, but one in which the stationary bar assumes the positions and internal motion characterized by the moving theta bar during its excursions.
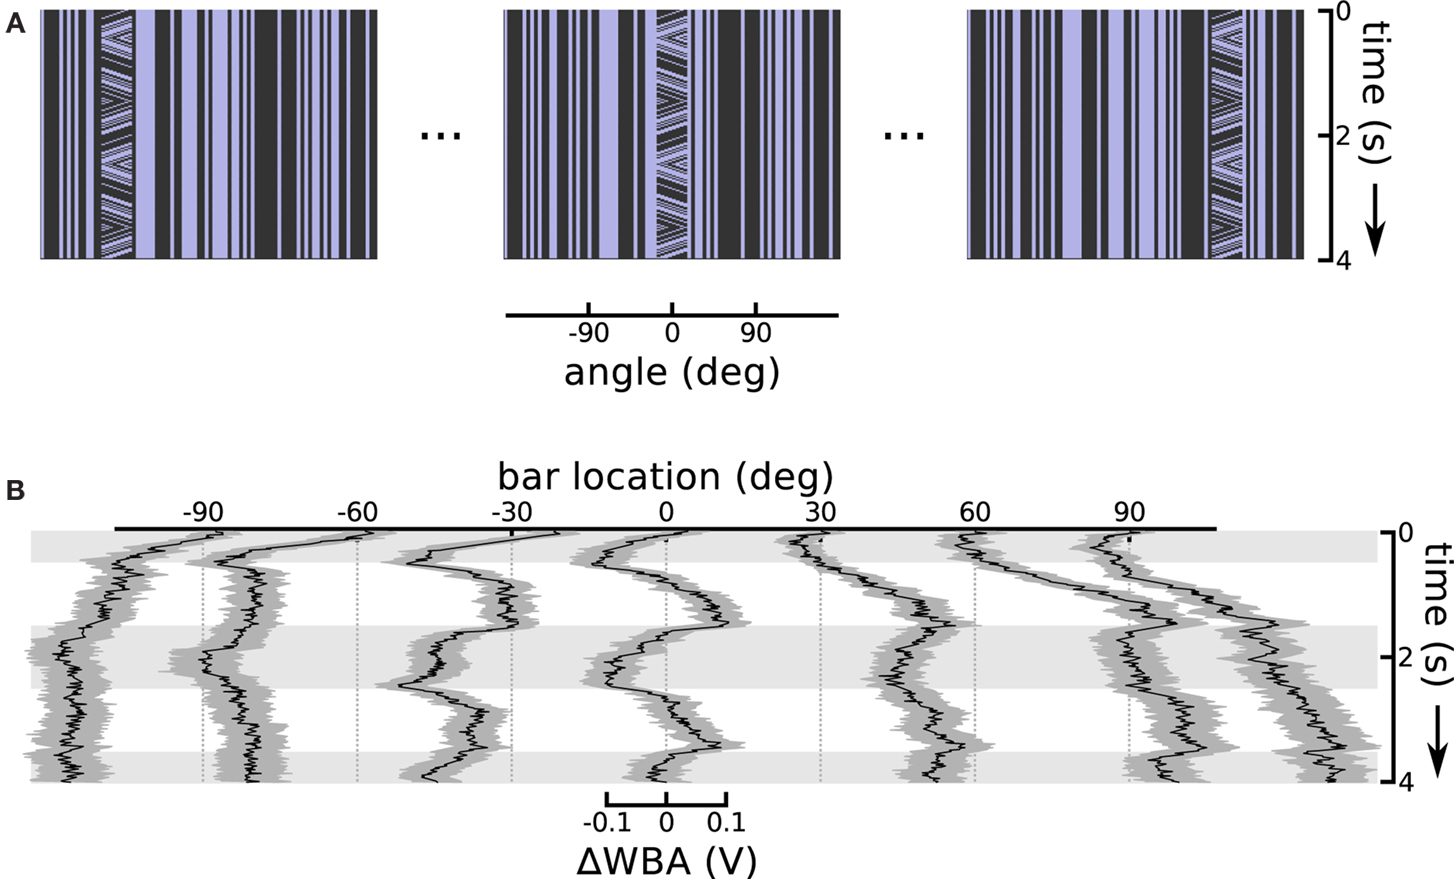
Figure 4. Small field motion offset from centerline. (A) Space time plots show the small field motion occurring in different positions, 90° left, in front of, and 90° right relative to the flies body axis, sampled from the sequence of seven offsets used. (B) Each of the seven traces shows the ΔWBA responses to small field (bar) of moving stimuli at a different horizontal displacement. Horizontal gray shading indicates time epochs when small field motion is to the left, white shading indicates motion to the right.
When the bar appeared in the center, steering responses simply followed the small field motion with a classical optomotor response that is neither purely velocity- nor displacement-related (Figure 4B, at 0°). We interpreted this response as reflecting the presence of some degree of temporal integration applied to velocity-dependent signals – such as those produced by the EMDs assumed to underlie visual motion processing in insects (Borst and Egelhaaf, 1989) – at a subsequent stage in the optomotor pathway. This interpretation is consistent with past analyses of optomotor responses in flies (Reichardt and Egelhaaf, 1988). That the response reflects temporal integration rather than feature tracking is supported by the fact that isolated elements of the grating pattern pass entirely out of view when they leave the small field window during motion in one direction or the other, rendering it impossible to track any single feature over the excursions represented by the integral of grating velocity.
Shifting the small field stimulus to off-center angular positions revealed compound position and velocity control responses (Figure 4B). Flies invariably turn tonically toward the position of the bar, even when the motion of the grating within it would cause the fly to steer away if the classic optomotor response were the only reflex in operation. For instance, when the bar appeared to either side of midline, the flies steered tonically in the direction of the offset. This response had a larger magnitude and slower risetime than the small field response, indicating that response saturation in the case of the frontal bar was not imposed by some absolute limit on wing kinematics. The flies do show some control effort in response to the small field motion within the bar, but this response appears to be superimposed on a larger effort to turn toward the position of the stimulus.
The superposition of the small field velocity and object position responses is qualitatively similar to results obtained with the onset of figure motion against a moving background in tethered house flies (Egelhaaf, 1987). But in this case, the different time lags of two seemingly superimposed responses are reminiscent of the substantially different time lags associated with tracking bars of first- and second-order motion (Figure 2B). The only difference between the stimuli in Figure 2B is the activity of the grating motion inside the bar. To specifically examine the effect of this internal motion parameter, we varied it in a series of steps, characterized by the ratio of internal grating velocity to bar velocity (Figure 5A). When the two are identical (the ratio is 1), the bar and pattern within it move coherently, which corresponds to simple first-order motion as in Figure 2B (top). When the internal pattern is revealed by the bar motion, but does not itself move (the ratio is 0), this is one type of drift-balanced second-order motion, as in Figure 2B (middle). Finally, when the two are opposed, (and the ratio is −1), the bar becomes a theta object, displaying paradoxical motion, as in Figure 2B (bottom). The ratios in between these steps display an internal pattern moving, but more slowly than the bar itself.
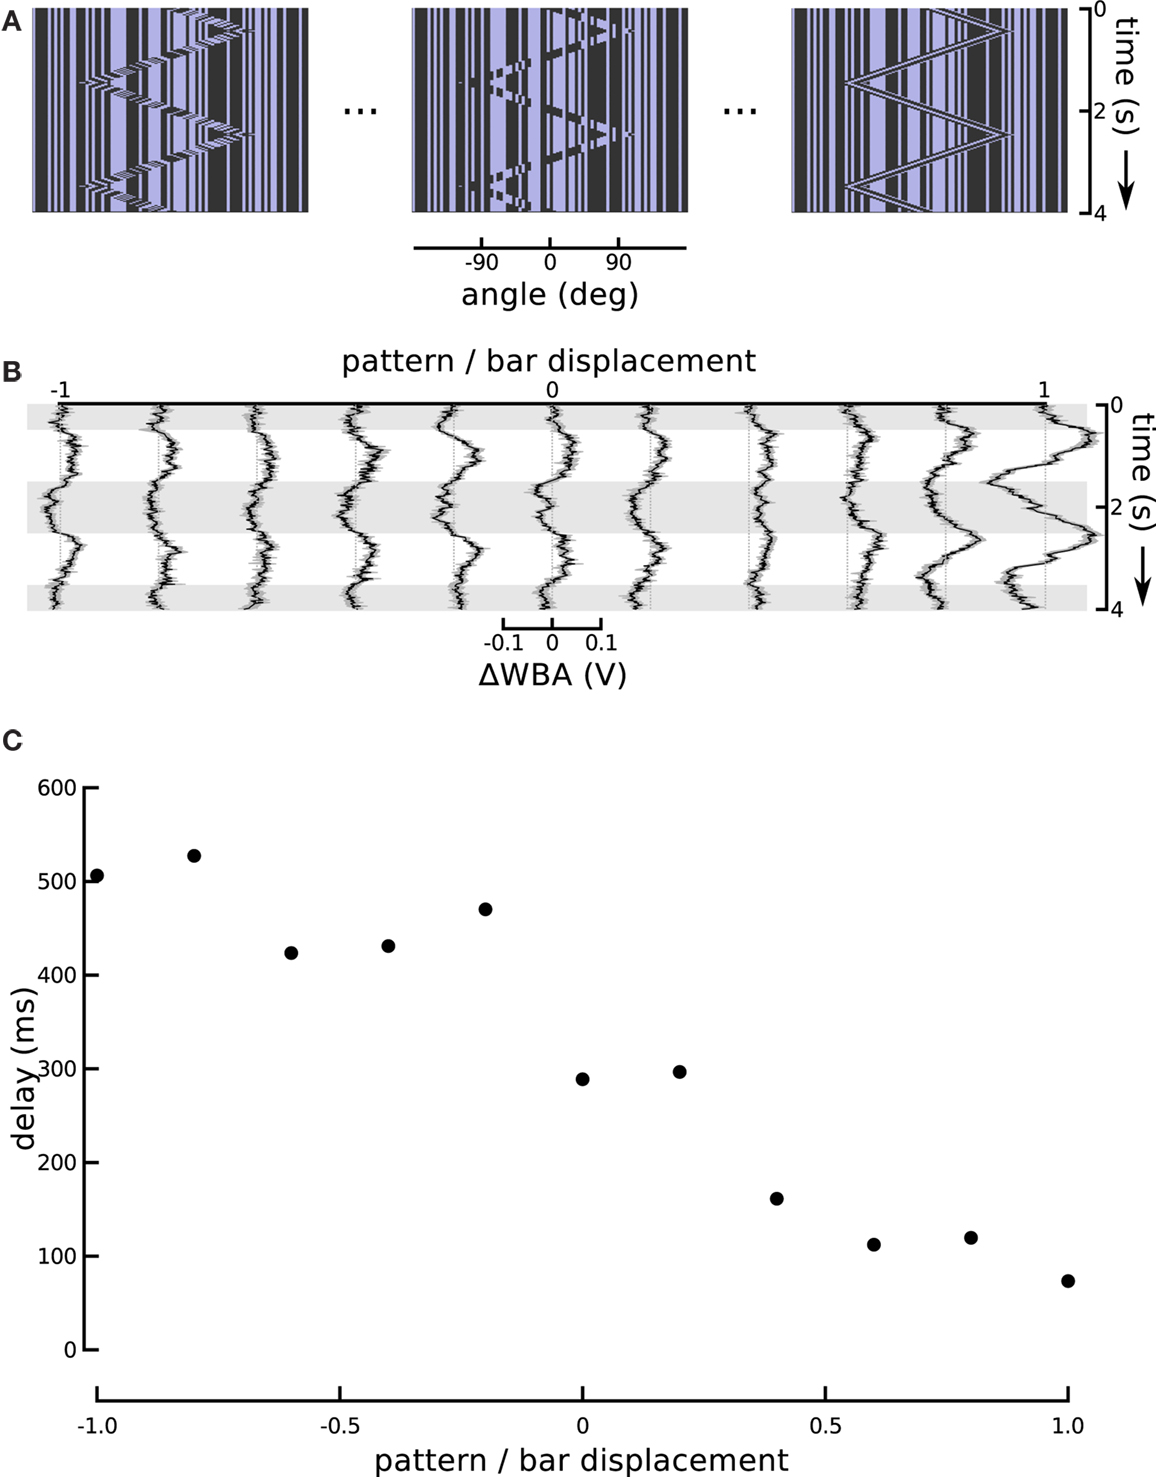
Figure 5. Changing the internal bar motion. (A) In this series, the speed of the moving pattern inside the bar changed while the excursions of the bar itself were held constant. When this ratio is at −1, the internal motion is opposite and equal to the external motion which produces a theta bar. When the internal motion slows it produces a sort of “sub-theta” motion, until, at 0, the background pattern is static. Positive internal motion is in the same direction as the bar, and at a ratio of 1, this produces a simple Fourier bar. (B) Responses to the entire sequence of internal motion gain show the positive gains produces greater amplitude responses, as well as much shorter delays. The figure shows the means of 72 flies flanked by one standard error of the mean. Horizontal gray shading indicates time epochs when the bar moves left to right, white shading indicates motion right to left. (C) An estimate of the tracking delay produced by taking the maximal value of the cross-correlation of the bar position and steering response. With a gain of 1, Fourier bar tracking lags the bar motion by under 100 ms, and this delay gradually increases to, with a gain of −1, theta bar tracking which lags by over 500 ms.
Differential Phase Lags for First-Order and Theta Motion
The responses to these graded steps between coherent first-order motion and paradoxical theta motion show a steady increase in lag (Figure 5B). Flies track the first-order bar with high response magnitude and a lag of less than 100 ms, but as the internal motion slows and finally reverses, the response magnitude decreases and the lag increases, until it is over 500 ms for classical theta motion. The magnitude of the response delay in this particular set of results is somewhat larger than in other experiments using the same stimulus (i.e., that reported in Section “Modeling High-order Feature Tracking from Independent Positional and Velocity Control Efforts”). However, we attribute this to an unrelated variation in fly performance, which may reflect some change in environmental factors, such as temperature or humidity, or some other quality of the flies in the lab that week. Larger and smaller steering responses are frequent, and an inspection of other experiments performed the same week as these reveals some extent of similar high amplitude responses. To characterize the response lags we calculated cross-correlation between the time course of the bar position and wing beat response. This quantifies the similarity between the input and output signals as a function of time lag, and the location of the maximal value is an estimate of the flies’ response lag. Although cross-correlation is a linear operation, identifying the position of its peak is not. In our data, as a result, this analysis is highly sensitive to between trial variation, and thus we averaged the trials for each experimental condition (Figure 5B) before calculating the lags, rather than calculating lags for each individual fly. These lags (Figure 5C) suggest a monotonic relationship between the internal motion speed and behavioral tracking delay.
One might expect that the increase in response magnitude would be trivially coupled to a decrease in response latency or lag, as is common in sensory systems, without indicating an underlying association between visual subsystems. We therefore turned the ratio around and altered the amplitude of bar displacement relative to internal pattern. This produces a stimulus that varies systematically in the degree of second-order excursion while holding the first-order signal constant. This experiment enabled us to further evaluate the hypothesis that responses to the small field motion and the displacement of a moving object represent independent components that superpose in the total response. To reduce the effect of the positional response, we decreased the sweep speed of the theta bar, correspondingly reducing its angular displacement, while maintaining the internal small field motion at a constant speed and in a direction opposite to that of the bar (Figure 6A). As a result, the steering responses varied smoothly between two extremes (Figure 6B). When the gain G of bar motion relative to internal grating motion was −1 (corresponding to standard theta motion), the wing beat response tracked the position of the bar with some appreciable phase lag, as in Figure 1. When G was 0, the bar did not move and the stimulus was equivalent to the centered small field motion in Figure 3. Between these two extremes, there was no stimulus for which the net response was 0; instead, as the gain of the bar motion relative to internal small field grating motion varied from 0 to −1, the amplitude of the response first diminished and then increased, with an apparent smooth variation of phase.
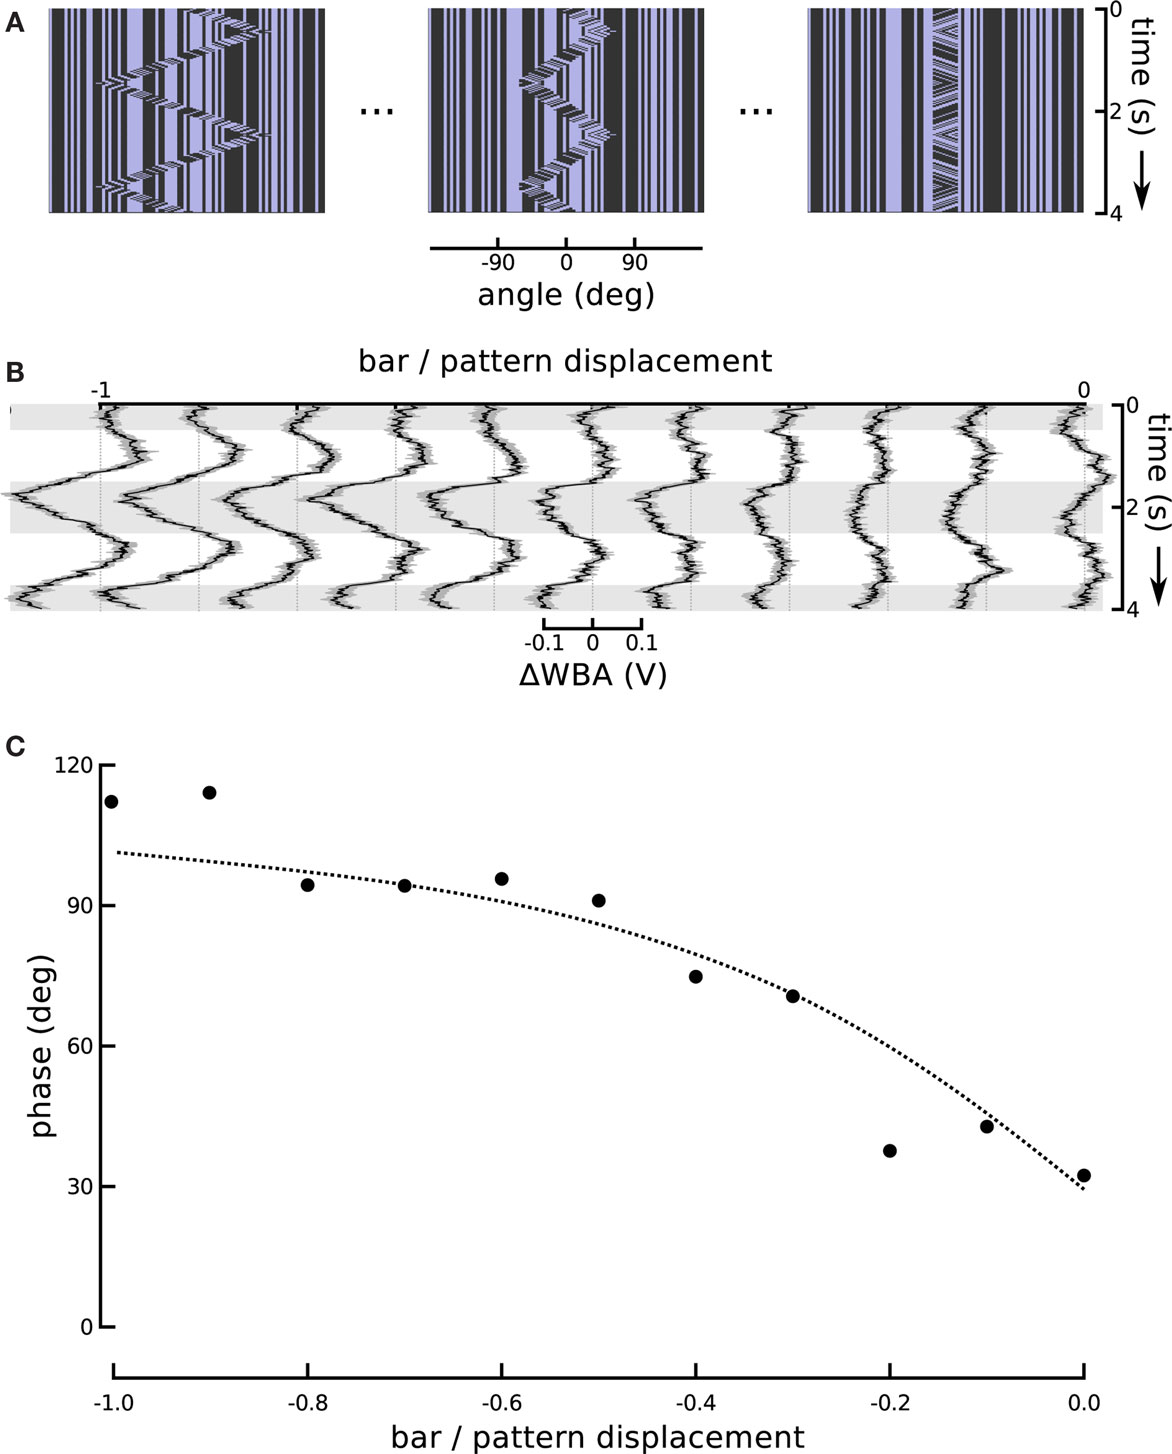
Figure 6. Changing the motion of the bar. (A) In this series we held the internal grating motion constant, but changed the speed of bar motion (and therefore its excursion angle) in steps. A ratio of bar motion to internal pattern motion of −1 produces theta motion. The bar excursion decreases with decreasing steps in the ratio, but the internal motion remains the same. A ratio of 0 produces a stationary bar with internal grating motion, replicating the centered small field motion experiment from Figure 3. (B) The ΔWBA responses to the series of visual stimuli illustrated above. The traces change smoothly from the characteristic theta motion response to small field motion response as the gain G is varied from −1 to 0. (C) The measured and predicted phases of the ΔWBA responses to theta motion with varying gain of bar amplitude to internal motion amplitude. The points are measured phase relationships between stimuli and responses in (B), ranging from theta motion and a gain of −1, to small field motion with a gain of 0. The dotted line shows the predictions of a linear superposition model, described in the text.
Modeling High-Order Feature Tracking from Independent Positional and Velocity Control Efforts
As a formal test of the superposition hypothesis, we analyzed the phases of the experimental responses for the different bar motion gains, and compared them with phases predicted by a linear superposition model. Experimental phase was quantified using cross-correlation, as in Figure 5C, and we again performed it on the mean response signals rather than individual traces. The cross-correlation between the experimental response and the “displacement” associated with the internal motion – i.e., the integral of the velocity of the internal grating – was computed over the final cycle of the stimulus:
where M indicates the number of data samples taken over the two cycles of motion in each experimental trial, Δt the sample period, r(t) response, and d(t) internal displacement. Writing phase in degrees as an explicit independent variable
ɸm = −360°τm/T,
where T is the period of the motion, allows the cross-correlation to be written in terms of the phase:

The phase Φ of a particular response waveform is then computed as
In practice, computed phases with values less than −180° were wrapped around into the interval (0°, +180°), i.e., were regarded as phase leads rather than lags.
Extracting the phase of the stimulus with the stationary frontal bar (gain G = 0) gave a phase lead of about 30° with respect to grating displacement. This phase lead is consistent with some degree of, but not pure, temporal integration of the grating velocity (and, we note, does not reflect any “anticipation” of the grating position). Extracting the phase of the theta stimulus (G = −1) gave a phase lead of just under 120° with respect to internal displacement, corresponding to a phase lag of about −60° with respect to the antiphase motion of the bar. This is roughly consistent with the phase lags seen in prior experiments with theta motion. The RMS amplitude of the response to the theta stimulus was found to be about three times that of the response to the frontal bar.
Based on these three parameter estimates, obtained from the results for G = 0 and −1 only, we constructed a linear superposition model as follows. Two sinusoids representing the fundamentals of the responses, with phases +30° for the first-order component and −60° for the bar-tracking component, were added together. The bar-tracking component was assumed to have three times the amplitude of the first-order component when the amplitudes of the respective stimuli were the same (i.e., at G = −1), and to scale linearly with the amplitude of the stimulus for values of the gain G between 0 and −1. The phase ΦS of the sum relative to the internal displacement, computed as
ΦS = atan {[sin(30°) + 3Gsin(−60°)]/[cos(30°) + 3Gcos(−60°)]}
was compared to the phases extracted from the experimental responses. The results of the model and the experiments are in strong agreement and are depicted in Figure 6C.
Discussion
In previous work we found that flies track a theta motion bar against a static background, in contrast to a neuronal study which indicated that the best studied circuits of the fly visual system do not encode the second-order component of theta motion (Quenzer and Zanker, 1991; Theobald et al., 2008). In this study we extended this result to show that flies are able to track theta motion even when it is masked by substantial background flicker (Figure 3), indicating that flies respond to the paradoxical motion of this stimulus rather than just the position of time varying flicker. Since the coherent luminance mediated motion is in the opposite direction of the fly’s response, we examined the positional effect of the small field component, and found that the optomotor response is present (steering to follow the direction of first-order motion), but superimposed onto a larger turning response toward the motion of the object itself (Figure 4). Systematically varying the relative internal motion of the stimulus showed that the response magnitude decreased, and the delay increased, as internal motion progressively contradicted bar motion (Figure 5). These results suggested that we might be able to experimentally counter the effects of first-order motion and feature detection by varying the extent of bar motion and produce a moving stimulus that evoked no net steering response, but this did not happen. In trials that systematically varied bar motion but kept internal pattern motion constant, the fly’s response simply reaches a nonzero minimum, even though it varies between tracking the theta motion of a bar to tracking motion inside the bar, two stimuli that are 180° out of phase (Figure 6). The contributions of the wide-field and object tracking components never precisely cancel, which can be seen to be the result of their differing phase relationships to the stimulus, arising from their different temporal characteristics.
The Superposition of Two Systems
The neuronal studies in the blowfly found that the H1 neurons were most sensitive to the second-order direction of drift-balanced motion, but the first-order direction of theta motion. A basic Hassenstein–Reichardt EMD (Hassenstein and Reichardt, 1956) cannot account for responses to drift-balanced motion. Because of this, the investigators were able to capture the behavior of these neurons by adding a front end nonlinearity (rectifying the receptor input) to a standard EMD model. However, they elaborated on a more complex model, one that put two EMDs in series, that would also respond to the second-order direction of theta motion (Quenzer and Zanker, 1991).
Other investigators have suggested that the outputs of several motion-processing subsystems could be superposed to account for flight behavior (Egelhaaf et al., 1988; Hausen and Wehrhahn, 1990). Here we note that our data also suggest the superposition of the outputs of separate subsystems with different dynamical properties: one displaying a short latency and proportional-plus-integral response to the velocity of first-order motion within any area of the visual field, and a second displaying a longer-latency and position-dependent response, elicited by differences in local spatiotemporal statistics, which render it responsive to drift-balanced and theta motion. A model that explicitly accounts for the dynamics of velocity-dependent optomotor and position-dependent feature tracking accounts for the behavioral responses of flies (Figure 6).
The conceptual framework of superposition of two subsystems has important implications for future analysis of underlying neuronal circuits. Recent studies have met with some success on illuminating structure–function relationships between structural circuits and behavioral outputs in fruit flies (Rister et al., 2007; Gao et al., 2008; Zhu et al., 2009). It would seem that the results presented here would be highly amenable to genetic analysis because they are highly robust, repeatable, and the superposition of phase lags clearly distinguishes second-order responses.
Limits to the Superposition Model
Whereas the model of this response as a simple sum of two independent parts works well in this experiment, there are limits to this conceptual framework. A moving small field stimulus centered in front of the fly can drive steering to the left or right, and small field stimulus to one side can increase and reduce the magnitude of the of the steering as the fly turns toward the feature (Figure 4). This implies that if a feature were, for example, just slightly off-center to the left, but with strong internal motion to the right, the combination might induce a rightward steering response. However we do not see evidence for this. In Figure 4B, it appears that the fly is initially driven to steer leftward when the bar is right of center, such as at the 30°, 60°, and 90° displacements. However, this is a case of a mean response that does not reflect the behavior of any single individual. Before a trial begins, flies may be already steering (as they are in closed loop fixating a bar), and the direction of this steering is in a somewhat random state, with a mean of 0. When the trial begins, flies that happen to be turning right reduce their steering (in response to the internal bar motion to the left) more so than flies that happen to be turning left (in response to the feature to the right). The result is that the mean trace appears to start at 0 and then steer left, which is a “proper” mean response, but not representative. A better measure is provided by the bar at −30° (just left of center) after the first reversal of internal bar motion. In this condition the flies are in a much more common steering state at the start of the trial, and the trace looks at one point as if this left of center feature might nearly drive a rightward steering response. Instead the response reached a minimum of no turning, violating the strict superposition prediction. Future analyses will need to pursue these noteworthy deviations from superposition, as it may inform the underlying mechanisms and functional circuits.
Detecting an Object with Fourier, Flicker and Motion Cues
Although we have an intuitive notion of what constitutes an object, it is difficult to define in the real world, and computing object motion is particularly challenging for fruit flies given the limited spatial resolution of their visual world. However, the fly informs us what constitutes a visual object with its steering behavior, and presumably neural characteristics that influence active object tracking in the arena have some connection to natural selection and ecologically relevant objects in the environment.
Flies will steer toward vertical features that provide contrast, lighter or darker, against the background. However in our experiments the random stripe pattern of the background was statistically the same as the bars, meaning that a stationary bar contained no discernable features and was invisible. Therefore only spatiotemporal cues, not spatial brightness cues, could induce tracking responses. In the case of Fourier motion, flies’ tracking responses fit in well with existing models of insect motion processing. The same EMD that underlie wide-field motion detection would respond to Fourier motion, and in the proper direction for steering. All that remains then is a level of processing that discriminates the stimulus as small-field. In contrast, drift-balanced bars have no net Fourier motion to drive directionally selective EMDs. But these bars do have flickering elements, either within an object or at the borders, which transiently stimulate motion detectors. Because of this, a nonlinear preprocessing step, such as rectification, added to an EMD produces a model sensitive to drift-balanced motion (Chubb and Sperling, 1988; Quenzer and Zanker, 1991). Theta motion, however, contains net Fourier motion and therefore drives basic EMDs, but in the opposite direction to the bar motion. A two layer EMD model, in which motion detectors feed into motion detectors, has been shown to account well for human experimental responses (Zanker, 1993, 1996). Such models hold promise for explaining the results reported herein, but further experimental and theoretical analysis is required to qualify their potential.
Higher-Order Motion in Nature
Theta motion in a pure form may be difficult to find in natural scenes, so why do flies and other animals, including humans and other primates, track it in the lab? First-order motion is certainly common, such as wide flow fields from self motion, and objects moving in the environment. Examples of drift-balanced second-order motion are also easy to find, such as objects changing brightness as they move between sun and shade under a leafy tree. However, other than somewhat contrived examples such as in Figure 1C, it is difficult to imagine a real selective advantage for the ability to track paradoxical motion. Considering the laboratory response as a sum of two different responses helps make sense of these computations in flies, since steering responses both to motion fields and features against a static background are well described in flies (Reichardt et al., 1989; Egelhaaf and Borst, 1993; Kimmerle et al., 1996). Our results show that “features” or “objects” can be defined by a local difference in spatiotemporal statistics relative to background. Stimuli meeting this criterion are of course very common in the natural environment, and might include either the flapping wings of a moving bird or insect, or the countermotion due to rotation of a maple fruit (Figures 1B,C). The combination of course-stabilizing wide-field motion responses with robust object-detecting responses yields computations sensitive to paradoxical theta motion.
Flying insects are remarkable examples of miniaturization, as they require the processing abilities that support flight to be packed into a small nervous system. Flies have especially impressive flight abilities, and fruit flies are fairly tiny insects, making this challenge particularly pronounced. Here we have examined how flies display a fairly sophisticated visual ability by combining two simpler processes.
Conflict of Interest Statement
The authors declare that the research was conducted in the absence of any commercial or financial relationships that could be construed as a potential conflict of interest.
Acknowledgments
Mark Frye is a Howard Hughes Medical Institute Early Career Scientist. This work was supported by grants from the NSF (IOS-0718325) to Mark A. Frye, NIH (EY-12816 and EY-18322) to Dario L. Ringach, Air Force Office of Scientific Research (FA9550-09-1-0116) to Patrick A. Shoemaker and Mark A. Frye, and Air Force contract FA8651-07-C-0099 to Patrick A. Shoemaker.
References
Borst, A., and Egelhaaf, M. (1989). Principles of visual motion detection. Trends Neurosci. 12, 297–306.
Chubb, C., and Sperling, G. (1988). Drift-balanced random stimuli: a general basis for studying non-Fourier motion perception. J. Opt. Soc. Am. A 5, 1986–2007.
Duistermars, B., Reiser, M., Zhu, Y., and Frye, M. (2007). Dynamic properties of large-field and small-field optomotor flight responses in Drosophila. J. Comp. Phys. A Neuroethol. Sens. Neural Behav. Physiol. 193, 787–799.
Egelhaaf, M. (1987). Dynamic properties of two control systems underlying visually guided turning in house-flies. J. Comp. Physiol. A 161, 777–783.
Egelhaaf, M., and Borst, A. (1993). A look into the cockpit of the fly: visual orientation, algorithms, and identified neurons. J. Neurosci. 13, 4563–4574.
Egelhaaf, M., Borst, A., and Reichardt, W. (1989). Computational structure of a biological motion-detection system as revealed by local detector analysis in the fly’s nervous system. J. Opt. Soc. Am. 6, 1070–1087.
Egelhaaf, M., Hausen, K., Reichardt, W., and Wehrhahn, C. (1988). Visual course control in flies relies on neuronal computation of object and background motion. Trends Neurosci. 11, 351–358.
Frye, M. A., and Dickinson, M. H. (2004). Motor output reflects the linear superposition of visual and olfactory inputs in Drosophila. J. Exp. Biol. 207, 123–131.
Gao, S., Takemura, S., Ting, C. Y., Huang, S., Lu, Z., Luan, H., Rister, J., Thum, A. S., Yang, M., Hong, S. T., Wang, J. W., Odenwald, W. F., White, B. H., Meinertzhagen, I. A., and Lee, C. (2008) The neural substrate of spectral preference in Drosophila. Neuron 60, 328–342.
Götz, K. G. (1968). Flight control in Drosophila by visual perception of motion. Biol. Cybern. 4, 199–208.
Götz, K. G. (1975). The optomotor equilibrium of the Drosophila navigation system. J. Comp. Phys. A Neuroethol. Sens. Neural Behav. Physiol. 99, 187–210.
Götz, K. G. (1987). Course-control, metabolism and wing interference during ultralong tethered flight in Drosophila melanogaster. J. Exp. Biol. 128, 35–46.
Hassenstein, B., and Reichardt, W. (1956) Systemtheoretische analyse der zeit-, reihenfolgen- und vorzeichenauswertung bei der bewegungsperzeption des rüsselkäfers Chlorophanus. Zeitschrift fur Naturforschung B 11, 513–524.
Hausen, K. (1982a). Motion sensitive interneurons in the optomotor system of the fly. I. The horizontal cells: structure and signals. Biol. Cybern. 45, 143–156.
Hausen, K. (1982b). Motion-sensitive interneurons in the optomotor system of the fly. II. The horizontal cells: receptive field organization and response characteristics. Biol. Cybern. 46, 67–79.
Hausen, K., and Wehrhahn, C. (1990) Neural circuits mediating visual flight control in flies. II. Separation of two control systems by microsurgical brain lesions. J Neurosci. 10, 351–360.
Heisenberg, M., and Wolf, R. (1979). On the fine structure of yaw torque in visual flight orientation of Drosophila melanogaster. J. Comp. Phys. A Neuroethol. Sens. Neural Behav. Physiol. 130, 113–130.
Heisenberg, M., and Wolf, R. (1984). “Vision in Drosophila,” in Studies of Brain Function, ed. V. Braitenberg (Berlin: Springer Verlag), p. 11–25.
Kimmerle, B., Egelhaaf, M., and Srinivasan, M. V. (1996). Object detection by relative motion in freely flying flies. Naturwissenschaften 83, 380–381.
Miles, F. A., and Wallman, J. (1993). Visual Motion and Its Role in the Stabilization of Gaze. Amsterdam: Elsevier Science and Technology.
Quenzer, T., and Zanker, J. M. (1991). Visual detection of paradoxical motion in flies. J. Comp. Phys. A Neuroethol. Sens. Neural Behav. Physiol. 169, 331–340.
Reichardt, W., and Egelhaaf, M. (1988). Properties of individual movement detectors as derived from behavioural experiments on the visual system of the fly. Biol. Cybern. 58, 287–294.
Reichardt, W., Egelhaaf, M., and Guo, A. (1989). Processing of figure and background motion in the visual system of the fly. Biol. Cybern. 61, 327–345.
Reichardt, W., and Wenking, H. (1969). Optical detection and fixation of objects by fixed flying flies. Naturwissenschaften 56, 424.
Reiser, M. B., and Dickinson, M. H. (2008). A modular display system for insect behavioral neuroscience. J. Neurosci. Methods 167, 127–139.
Rister, J., Pauls, D., Schnell, B., Ting, C. Y., Lee, C. H., Sinakevitch, I., Morante, J., Strausfeld, N. J., Ito, K., and Heisenberg, M. (2007). Dissection of the peripheral motion channel in the visual system of Drosophila melanogaster. Neuron 56, 155–170.
Tammero, L. F., Frye, M. A., and Dickinson, M. H. (2004). Spatial organization of visuomotor reflexes in Drosophila. J. Exp. Biol. 207, 113–122.
Theobald, J., Duistermars, B., Ringach, D., and Frye, M. (2008). Flies see second-order motion. Curr. Biol. 18, R464–R465.
Theobald, J. C., Ringach, D. L., and Frye, M. A. (2010). Dynamics of optomotor responses in Drosophila to perturbations in optic flow. J. Exp. Biol. 213, 1366–1375.
Zanker, J. M. (1993). Theta motion: a paradoxical stimulus to explore higher order motion extraction. Vision Res. 33, 553–553.
Zanker, J. M. (1990). Theta motion: a new psychophysical paradigm indicating two levels of visual motion perception. Naturwissenschaften 77, 243–246.
Zanker, J. M. (1996) On the elementary mechanism underlying secondary motion processing. Phil Trans R Soc Lond B 351, 1725–1736.
Keywords: second-order motion, Fourier motion, optomotor, flight control, Drosophila vision, visuomotor
Citation: Theobald JC, Shoemaker PA, Ringach DL and Frye MA (2010) Theta motion processing in fruit flies. Front. Behav. Neurosci. 4:35. doi: 10.3389/fnbeh.2010.00035
Received: 09 April 2010;
Paper pending published: 04 May 2010;
Accepted: 27 May 2010;
Published online: 22 July 2010
Edited by:
Paul S. Katz, Georgia State University, USAReviewed by:
Sean Humbert, University of Maryland, USAJohannes Zanker, University of London, UK
John A. Bender, Case Western Reserve University, USA
Copyright: © 2010 Theobald, Shoemaker, Ringach and Frye. This is an open-access article subject to an exclusive license agreement between the authors and the Frontiers Research Foundation, which permits unrestricted use, distribution, and reproduction in any medium, provided the original authors and source are credited.
*Correspondence: Mark A. Frye, Department of Integrative Biology and Physiology, University of California Los Angeles, 621 Charles Young Dr, Los Angeles, CA 90095, USA. e-mail: frye@ucla.edu