Representation of non-spatial and spatial information in the lateral entorhinal cortex
- 1 Krieger Mind/Brain Institute, Johns Hopkins University, Baltimore, MD, USA
- 2 Department of Neurobiology and Anatomy, University of Texas Medical School at Houston, Houston, TX, USA
- 3 Solomon H. Snyder Department of Neuroscience, Johns Hopkins University School of Medicine, Baltimore, MD, USA
Some theories of memory propose that the hippocampus integrates the individual items and events of experience within a contextual or spatial framework. The hippocampus receives cortical input from two major pathways: the medial entorhinal cortex (MEC) and the lateral entorhinal cortex (LEC). During exploration in an open field, the firing fields of MEC grid cells form a periodically repeating, triangular array. In contrast, LEC neurons show little spatial selectivity, and it has been proposed that the LEC may provide non-spatial input to the hippocampus. Here, we recorded MEC and LEC neurons while rats explored an open field that contained discrete objects. LEC cells fired selectively at locations relative to the objects, whereas MEC cells were weakly influenced by the objects. These results provide the first direct demonstration of a double dissociation between LEC and MEC inputs to the hippocampus under conditions of exploration typically used to study hippocampal place cells.
Introduction
The hippocampus is critically involved in episodic memory in humans (Scoville and Milner, 1957; O’Keefe and Nadel, 1978; Vargha-Khadem et al., 1997; Squire et al., 2004) and “episodic-like” memory in animals – memory that requires an integration of the what, where, and when components of a memory (Clayton and Dickinson, 1998; Eichenbaum and Fortin, 2005). The most salient firing correlate of hippocampal neurons in freely moving rats is the location of the animal, which led to the notion that the hippocampus provides a spatial framework to organize and interrelate the items and events of experience and to allow flexible memory storage (O’Keefe and Nadel, 1978). Non-spatial inputs also influence the activity of hippocampal cells (Wiener et al., 1989; Hampson et al., 1999; Wood et al., 1999; Rivard et al., 2004; Lenck-Santini et al., 2005), often by modulating the underlying place field of the cell (O’Keefe, 1976; Moita et al., 2003; Komorowski et al., 2009; Manns and Eichenbaum, 2009). The creation of such context-specific, “item + place” conjunctive representations may be the key contribution of the hippocampus to episodic memory.
Understanding the computations involved in the creation of hippocampal representations requires a detailed knowledge of the information that is encoded in its afferent structures. There are two major cortical inputs to the hippocampus, the medial entorhinal cortex (MEC) and the lateral entorhinal cortex (LEC). The MEC conveys highly specific spatial information to the hippocampus in the form of grid cells, boundary cells, and head direction cells. Grid cells fire in multiple locations as a rat explores an environment, and the firing locations are arranged as the vertices of an exquisitely regular grid of equilateral triangles that tessellate the floor of the environment (Hafting et al., 2005). A subset of grid cells are also modulated by the head direction of the animal (Sargolini et al., 2006). Boundary cells fire when the rat is located near a wall or edge of an environment, and they may provide information to align the grid cells to the boundaries of an apparatus (Savelli et al., 2008; Solstad et al., 2008). Anatomically, the MEC is connected strongly to other regions that demonstrate similar spatial firing properties, such as the subiculum, presubiculum, parasubiculum, and retrosplenial cortex (Chen et al., 1994; Taube, 1995; Sharp, 1997; Cho and Sharp, 2001; Hargreaves et al., 2007; Lever et al., 2009; Boccara et al., 2010; Knierim and Hamilton, 2011).
In contrast to the MEC, neurons in the LEC do not show strong spatial firing (Hargreaves et al., 2005; Yoganarasimha et al., 2010) or movement-related theta (Deshmukh et al., 2010). Some studies have demonstrated that LEC neurons respond to individual items, such as odors, pictures of objects, or views of three-dimensional objects (Zhu et al., 1995a,b; Young et al., 1997; Wan et al., 1999). Anatomically, the LEC receives major input from the perirhinal cortex, which is involved in object-recognition and familiarity (Aggleton and Brown, 1999; Murray et al., 2007).
Based on anatomical arguments that the MEC is part of the brain’s dorsal (“where”) processing stream and the LEC is part of the ventral (“what”) stream (Figure 1), a number of investigators have proposed that place cells in the hippocampus derive their spatial selectivity from their MEC input and their non-spatial modulation from the LEC input (Suzuki et al., 1997; Burwell, 2000; Witter and Amaral, 2004; Knierim et al., 2006; Manns and Eichenbaum, 2006). However, although prior studies of LEC have shown responsiveness to individual items, these studies took place under conditions that were different from the conditions typically used to study hippocampal place cells and they did not explicitly distinguish MEC and LEC (Zhu et al., 1995a,b; Young et al., 1997; Wan et al., 1999), limiting the ability to compare LEC firing directly with place cell activity and MEC grid cell activity. The present study thus investigated the responses of MEC and LEC neurons while freely moving rats foraged for food in an open field that contained a number of discrete objects, to test whether LEC and MEC neurons differentially conveyed information about objects and spatial location to the hippocampus. We report here that LEC cells were more strongly influenced by local objects than MEC cells, firing preferentially at the locations of objects as well as at locations at a distance from the objects.
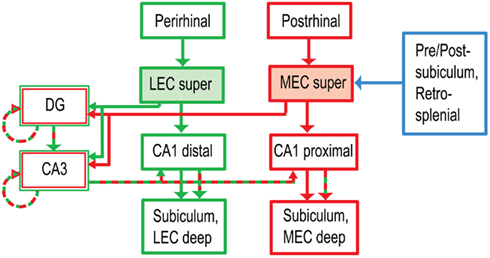
Figure 1. Anatomical segregation of cortical inputs to hippocampus (Burwell, 2000; Witter and Amaral, 2004). The LEC receives major input from the perirhinal cortex, part of the brain’s ventral (“what”) pathway. The MEC receives input from the postrhinal (parahippocampal) cortex, part of the dorsal (“where”) pathway. The MEC also receives major spatial inputs from the presubiculum, postsubiculum, and retrosplenial cortex, all of which show stronger spatial tuning than the postrhinal cortex (Knierim, 2006). The projections of LEC and MEC to CA1 remain segregated along the transverse (proximal–distal) axis of the hippocampus, whereas the projections to the DG and CA3 converge onto the same anatomical regions. (For simplicity, a number of anatomical connections have been excluded from this diagram. super: superficial layers II and III, the inputs to the hippocampus. deep: deep layers V and VI, which receive feedback from the hippocampus.)
Materials and Methods
Animals and Surgery
Seven male Long–Evans rats, aged 5–6 months, were housed individually on a 12:12-h reversed light–dark cycle. All experiments were performed in the dark portion of the cycle. Animal care, surgical procedures, and euthanasia were performed in accordance with the National Institutes of Health (NIH) and the University of Texas Health Sciences Center at Houston Institutional Animal Care and Use Committee (IACUC) guidelines.
Under surgical anesthesia, 2 animals were implanted with a hyperdrive with 18 tetrodes directed at the LEC of the right hemisphere, and 5 rats were implanted with a hyperdrive with 9 tetrodes each directed at LEC and MEC (MEC units were recorded from 3 of these rats). LEC bundles were centered at 7.7–8.1 mm posterior to bregma and 3.2–3.5 mm lateral to midline. The electrodes were angled at 25° medio-laterally to allow them to access the lateral to medial extent of LEC. MEC bundles were positioned with the most posterior tetrode at 600–800 μm anterior to the transverse sinus and 4.8–5 mm lateral to the midline. The MEC tetrodes traveled vertically. This allowed us to record from neurons along the dorsal to ventral axis of MEC.
Training and Experimental Protocol
Rats were allowed to recover for 5–6 days after surgery. During the training and recording sessions the rats were maintained at 80–90% of their free feeding weights. The rats were trained to forage for irregularly distributed chocolate sprinkles in a 1.2-m × 1.5-m box with 0.3 m high walls. The box had 34 irregularly distributed anchoring positions where objects could be placed. No objects were present during the training sessions. The box was placed 6′′ above the floor in a room with numerous visual cues, such as other behavioral apparatus, open curtains, and doors (Figure 2). Once the rats were trained to forage for six consecutive 15-min sessions with the preamplifier headstages plugged in, and the electrodes were deemed to be in the target regions (Deshmukh et al., 2010), the object-related recording sessions commenced. The first session of the first day of recording was identical to the training sessions without objects, but sessions 2–6 had four objects in a configuration that was fixed for each rat. This is referred to as the standard object configuration. All six sessions on the second day had objects in the standard configuration. Starting on day 3, two object-manipulation sessions (sessions 3 and 5) were interspersed with standard object configuration sessions. Object-manipulations consisted of either (a) introducing a novel object or (b) moving one (or sometimes, two) objects from their standard location. Sessions 3 and 5 alternated as novel and misplaced object sessions on consecutive days, to minimize order effects. Different object configurations served as standard configurations for different rats, but the same objects and their spatial configuration served as the standard on all days of recording for a given rat. For two of the rats, an additional (seventh) session was run in a similar box in an adjacent room with numerous visual cues, but no objects in the box. One of the rats failed to run six consecutive sessions on most days. The protocol was modified to include only one manipulation session (session 3) each day for this rat. Even for other rats, if they showed a tendency to forage poorly in a session or two, the recording was stopped before completion of the six-session sequence. The sessions that were subjectively judged to have poor coverage of the box were excluded from analysis, without regard to the activities of the neurons recorded in these sessions. The box was cleaned with 70% ethanol at the end of the day’s recording sequence for each rat. After training, the rats did not usually defecate or urinate in the box during foraging. In the rare instances in which urination or defecation occurred, the feces or urine was removed immediately, and the area wiped down to spread the odor over a substantial portion (more than 1/4th) of the box. The approximate position and time of these events were noted. After session 1, units were quickly assessed to determine which objects to manipulate in the misplaced object session (i.e., to move an object for which at least one cell fired in session 1). Thus there was a 30- to 45-min gap between the first and the second sessions. All other sessions had a variable 5–7 min interval. The rats had access to water between sessions.
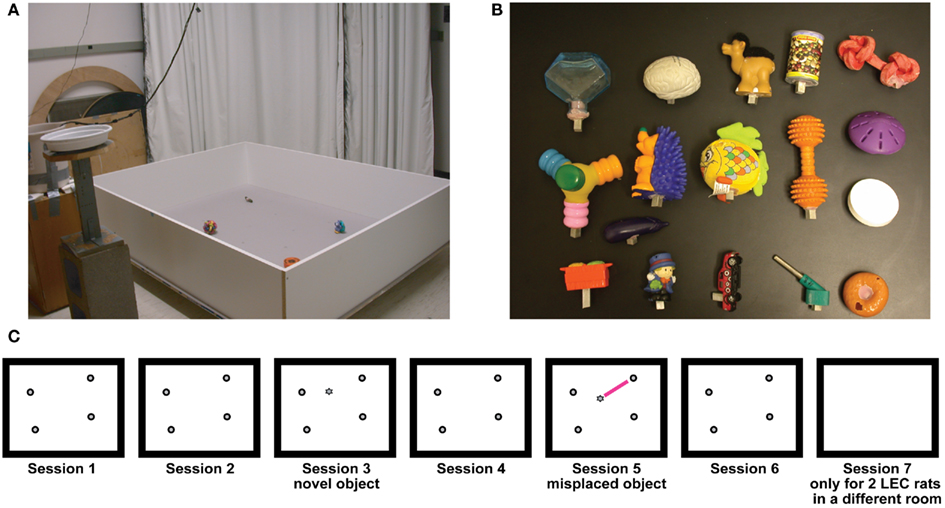
Figure 2. Experimental protocol. (A) Recording environment. (B) Representative objects used in the experiments. (C) Typical experimental protocol. Rats foraged for chocolate sprinkles for 15 min each in six consecutive sessions in the presence of objects. Sessions 3 and 5 were object-manipulation sessions in which either a novel object was introduced (session 3, here) or one of the objects was misplaced (session 5 here); the type of object-manipulation was counterbalanced between sessions 3 and 5 across days. Session 7, in which rats explored a box in a different room with no objects, was run in only the last two rats.
Tetrodes were advanced at least 100 μm while listening to the changing activity starting on the third day of recording to sample different units on different days. On most days, there was at least a 16-h gap between the time when tetrodes were last moved and the start of recordings. On some days, when no neurons were present at the start of the day, some tetrodes were moved a little (20–200 μm) until units were obtained. On these days, there was at least a 4-h delay between moving the tetrodes and the recording session. Recordings were terminated when all tetrodes were deemed to be in layer I of the cortex using functional landmarks described previously (Deshmukh et al., 2010). The number of recording days in all but one rat ranged from 12–14 (median: 12 days, outlier: 6 days).
Objects
Objects used in this experiment were mostly small toys and had a variety of textures, shapes, colors, and sizes (Figure 2). The smallest dimension for any object was 2.5 cm, and the largest was 15 cm.
Recording Hardware
Tetrodes were made from either 12.5 μm nichrome wire or 17 μm 90% platinum- 10% iridium wire (California Fine Wire, Grover Beach, CA, USA). Nichrome tetrodes were gold plated to bring their impedance down to approximately 200 kΩ. Pt–Ir wires were not plated, and their impedances were approximately 700 kΩ. Recordings were performed with the Cheetah Data Acquisition System (Neuralynx, Bozeman, MT, USA) as described previously (Deshmukh et al., 2010).
Data Analysis
Unit isolation
Manual cluster cutting with custom software was used to isolate activities of single units (Deshmukh et al., 2010). Each cell was assigned an isolation quality score on a subjective scale of 1 (very well-isolated) to 5 (poorly isolated), based on how well the cluster was separated from the neighboring clusters and the background. Spatial firing characteristics of the units were not used for assigning isolation quality. Clusters with quality of 3 or better, firing at least 50 spikes in a session, were used for the subsequent analyses. Fast spiking cells with mean firing rates >10 Hz were assumed to be interneurons and were excluded from the analysis (Frank et al., 2001; Hargreaves et al., 2005).
Firing rate map
The position and head direction of the rat were recorded using LEDs connected to the hyperdrive and an overhead camera (Model 1300, Cohu Inc., San Diego, CA, USA). The area of the box was segmented into 3.4-cm square bins. The firing rate map of each cell was constructed by dividing the number of spikes in each bin with the amount of time the rat spent in that bin. These unsmoothed rate maps were used for object response calculations. The rate maps were smoothed using the adaptive binning algorithm described by Skaggs et al. (1996), for use in spatial information score calculations and for illustrations.
Spatial information
Spatial tuning of single units was quantified using the spatial information measure devised by Skaggs et al. (1996), which quantifies the amount of information (in bits) about the rat’s location conveyed by a single spike. The probability of obtaining a spatial information score for a given unit by chance was estimated using a shuffling procedure. The neuron’s spike train was shifted in time with respect to the rat’s trajectory with 1000 random time lags (minimum shift of 30 s), and the spatial information was calculated on the rate maps calculated for each random shift. The probability of obtaining the observed information score by chance is the fraction of randomly time shifted trials having spatial information equal to or greater than the observed information score. We used a significance threshold of p < 0.01 for the spatial information.
Object-responsiveness
Objects remained fixed at their spatial locations throughout a session, thus making it possible to estimate object-related firing of a given unit by comparing its firing rate when the rat occupied pixels near the objects with its firing rate when the rat occupied pixels away from the objects. Since spatial location of the objects was used as a surrogate for the objects in this analysis, only the cells with spatial information scores >0.25 bits/spike and probability of obtaining the information score by chance <0.01 were used for the purpose, unless specified otherwise. This selection process allowed the removal of cells that fired diffusely or unreliably in the environment.
To measure the relative firing rate of each neuron when the rat occupied locations close to, vs. away from, the objects, an object-responsiveness index (ORI) was calculated with the equation (On − A)/(On + A), where On is the mean of all firing rates in pixels within a 5-pixel (3.4 cm/pixel) radius of object n and A is the mean of all firing rates in pixels that were more than 5 pixels from all objects. Unsmoothed firing rate maps were used in these calculations. For sessions with the standard object configuration, the ORI was calculated five times for each neuron recorded in the session; that is, the ORI was calculated for each of the four objects individually (i.e., On was the firing rate around object n only) as well as a fifth measurement for all four-objects-together (i.e., On was the mean firing rate for all pixels within a 5-pixel radius of all four objects). The value of the largest of the five ORI measurements for each cell is referred to as ORImax in Figure 4A and corresponding text.
To test the statistical significance of the ORI, the distribution of ORIs that could be obtained by chance for a given unit was estimated using 1000 random object placements on the rate map, followed by ORI calculation for each random placement. For each simulated test run, four “objects” were located at random locations on the cell’s rate map, with the minimum and maximum distances between objects set at 12 and 34 pixels respectively (these numbers correspond to the actual minimum and maximum distances between standard objects in the seven rats in this experiment). Random object placements with less than 15 occupied pixels around the objects were also excluded from the analysis. The five ORI calculations were performed on this simulated test run. The simulation was repeated 1000 times, each with a different set of random object locations, to generate an expected distribution of ORI values that would occur by chance. The probability of obtaining the observed ORI [p(ORI)] is the fraction of ORIs for the random object placement simulations that were equal to or more than the observed ORI. For example, if the observed ORI was greater than every 1 of the 1000 simulated values, the p(ORI) value would be 0.001. Each neuron generated five p(ORI) values (one for each ORI value), and the smallest of the five probabilities was referred to as the pmin(ORI). [Note that pmin(ORI) is not always the probability of ORImax, due to differences in the shapes of the control distributions for single-object vs. four-objects-together conditions.]
Because the ORI value depends both on the firing rate of neurons near objects and the firing rate away from objects, comparison between brain areas is tenuous if the regions differ in the firing rate away from objects (variable A in the ORI equation). However, because the p(ORI) measure is calculated with simulated data from each region, it effectively normalizes this confound. Thus, to compare the LEC to the MEC, we performed statistical tests on the pmin(ORI) values, rather than the ORI values themselves. χ2 with correction for continuity was used to analyze 2 × 2 contingency tables comparing proportions of putative object-responsive neurons in LEC and MEC. ORI and p(ORI) were also calculated for misplaced and novel objects in the misplaced and novel object sessions and for the corresponding locations of these objects in the standard object configuration sessions that flanked them. For these object-manipulation sessions, the ORI was calculated only for individual objects, not for all objects together.
LEC place fields away from objects
We observed place fields in LEC at some distance from objects that were stable across multiple sessions in the presence of objects. To objectively classify these units using session 1 rate maps, we used the following criteria: (1) the rate maps had to show a pixel by pixel correlation coefficient with the following session greater than 0.71, which was the mean correlation coefficient for the LEC population +1 SD; (2) the spatial information scores had to be significant at p < 0.01, and higher than 0.4 bits/spike; and (3) the p(ORI) for the 4-objects-together had to be >0.4 (0.319 was the maximum value for the ORI p-value for the 4-objects-together for any neuron which showed object-responsiveness to a single object in any standard session). These criteria identified neurons that had stable spatial firing fields away from objects.
Histology
Locations of isolated single units were determined at the end of an experiment by localizing tetrode tracks on coronal sections of the rat brains, as described previously (Deshmukh et al., 2010).
Results
Selectivity of LEC and MEC Neurons in the Presence of Objects
Multiple single units were recorded from the superficial layers of LEC and MEC (i.e., the layers that project to the hippocampus; Figure 1) while rats foraged for food reward in a 1.2-m × 1.5-m box in the presence of objects (Figures 2A,B). On a typical day, four sessions in which the objects were placed in a standard configuration were interleaved with two sessions in which a subset of the objects was moved to new locations or a novel object was introduced into the box (Figure 2C). Because the objects occupied fixed positions in the standard sessions, a common measure of spatial information content (Skaggs et al., 1996) was used to initially characterize the firing of LEC and MEC neurons in the first session of the day. The distributions of spatial information scores from 75 LEC and 49 MEC neurons were not statistically different under these conditions (Figure 3A; LEC median = 0.34 bits/spike; MEC median = 0.36 bits/spike; Wilcoxon rank sum test, p = 0.947). This result is in stark contrast to previous studies that showed that, in the absence of objects, MEC conveyed much more spatial information than LEC in both simple (Hargreaves et al., 2005) and complex (Yoganarasimha et al., 2010) environments. In particular, the distribution of information scores from LEC was qualitatively different from the distributions reported in the previous studies, with a skew toward high values that was absent in the previous studies (Hargreaves et al., 2005; Yoganarasimha et al., 2010).
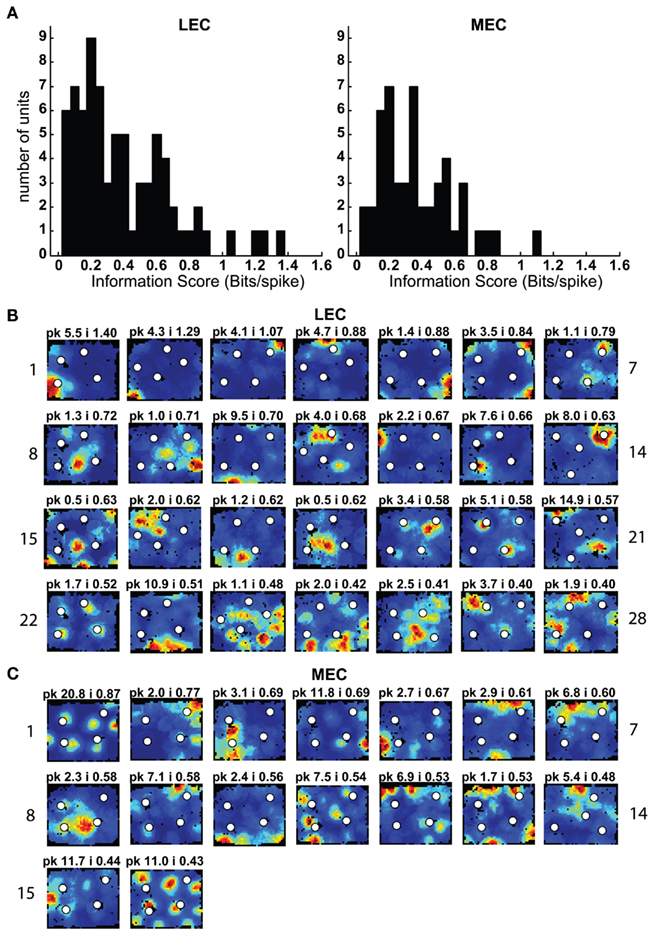
Figure 3. Spatial information scores in LEC are comparable to those in MEC in the presence of objects. (A) Distributions of spatial information scores in LEC and MEC in session 1 with objects in their standard configuration. (B,C) Firing rate maps of LEC (B) and MEC (C) neurons with statistically significant (p < 0.01) spatial information scores greater than 0.4 bits/spike in the first session. White circles mark locations of objects. Blue corresponds to no firing while red corresponds to the peak firing rate. Numbers at the top of each rate map indicate peak firing rate (pk) in Hz and spatial information score (i) in bits/spike. Numbers at the left and right of the figure indicate unit numbers.
The stability of LEC and MEC rate maps between two consecutive sessions with the standard object configuration (sessions 1 and 2) was estimated using pixel by pixel correlation coefficients between the two sessions for each cell. The distribution of these coefficients in LEC was not significantly different from that in MEC (LEC median = 0.53; MEC median = 0.56; Wilcoxon rank sum test, p = 0.479; Kolmogorov–Smirnov test, p = 0.916).
Both the MEC and LEC histograms in Figure 3A showed a dip around 0.4 bits/spike; the firing rate maps of neurons with spatial information scores higher than this value are shown in Figures 3B,C. Some LEC neurons fired selectively when the rat was located close to one or more objects (e.g., units 7, 13, 14, 19, 20, and 22) whereas other neurons fired selectively in locations at a distance from the objects, such as corners, walls, or locations near the center of the box (e.g., units 2, 8, 10, 12, 17, 21, and 23). In order to test whether the increased LEC selectivity compared to previous studies was an artifact of the recording conditions of the current study, an additional session without objects was administered to the last two rats (Figure 2C). To ensure that any spatial selectivity seen without objects was not confounded by potential effects of the animal’s memory of the objects, these additional sessions were performed in a different room. Figure A1 in Appendix shows that the spatial information scores of LEC neurons in the presence of objects were higher than the scores in the absence of objects, in agreement with prior reports that spatial information is low for LEC in the absence of objects. (Note that the overall decrease in spatial selectivity cannot be interpreted as similar to hippocampal place field remapping between environments, as such remapping would result in a combination of both increases and decreases in spatial selectivity across cells.)
As expected, MEC neurons showed a number of units with spatially selective responses (Figure 3C), and the distribution of spatial information scores (Figure 3A) resembled the distributions from previous studies (Hargreaves et al., 2005; Yoganarasimha et al., 2010). (As with LEC, it was not possible to directly compare the spatial information scores between studies, as the spatial information measure is sensitive to differences between studies in the size of the apparatus and in the size of the occupancy bins of the rate maps.) A number of MEC units were grid cells (Hafting et al., 2005; e.g., units 1, 4, 11, and 16) and boundary-related cells (Savelli et al., 2008; Solstad et al., 2008; e.g., units 6, 7, and 10). Other cells fired in apparently arbitrary locations, both near and away from the object locations (e.g., units 3 and 14), with no obvious tendency to concentrate firing near the objects (see below).
To quantify the responsiveness to objects, an ORI was defined as (On − A)/(On + A), where On is the mean firing rate within a 17 cm (5-pixel) radius of object n and A is the mean firing rate of all pixels outside the 5-pixel radius of all four objects. The ORI was also calculated for all objects together (i.e., On was the mean firing rate for all pixels within a 5-pixel radius of all four objects); thus each cell produced five different ORI values (see Materials and Methods). Only neurons with statistically significant (p < 0.01) spatial information scores greater than 0.25 bits/spike were used for this and subsequent analyses. The distributions of the highest of the five ORI values for each cell (ORImax) in LEC and MEC in session 1 are shown in Figure 4Ai. The LEC distribution shows a wider spread of ORImax than MEC. A direct statistical comparison of ORImax between MEC and LEC is tenuous, as the differences in the spatial firing characteristics of LEC and MEC neurons away from the objects (variable A in the ORI equation) may affect the value of ORI. For example, because MEC cells are known to fire in spatial patterns that do not depend on objects (e.g., grid cells in MEC), their firing rates away from objects might be higher than LEC neurons and thereby decrease the magnitude of the ORI. To address this problem, we calculated independently for each neuron the probability that its ORI was due to chance [p(ORI)] using a randomization procedure (see Materials and Methods). Each cell generated five p(ORI) values (one for each of the five ORI calculations done per neuron), and the lowest p(ORI) was denoted pmin(ORI).The distribution of pmin(ORI) for LEC was wider than MEC in session 1 (Figure 4Bi; Siegel–Tukey, p = 0.0018), although there was no significant difference between the median values of the distributions (LEC median = 0.165, MEC median = 0.197; Wilcoxon rank sum, p = 0.6867). Moreover, LEC (11/41) had a significantly larger number of neurons with a pmin(ORI) < 0.05 than MEC (1/28; χ2 = 4.75, one tailed p = 0.0148). Subsequent sessions with objects in the standard configuration (Sessions 2, 4, and 6) showed a similar trend (Figure 4; Figures A2 and A3 in Appendix). These data indicate that LEC cells were more responsive to objects than MEC cells.
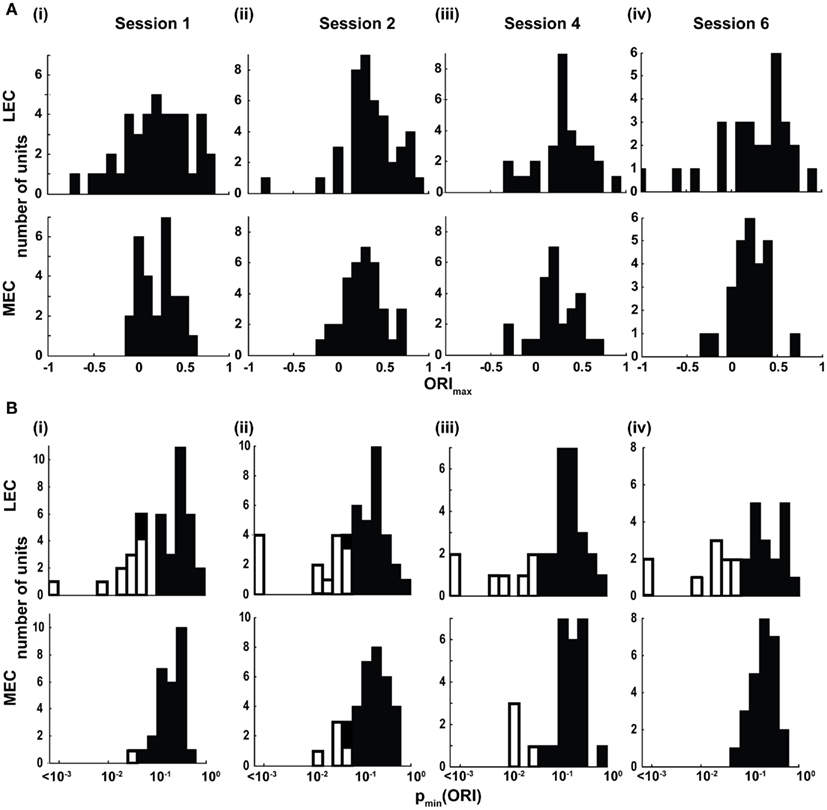
Figure 4. Lateral entorhinal cortex (LEC) neurons display higher object-responsiveness than MEC neurons. (A) Distribution of the ORImax of LEC (top) and MEC (bottom) neurons in the four standard sessions. (B) Distribution of the pmin(ORI). White bars indicate cells that showed statistically significant (p < 0.05) object-related firing. LEC showed a significantly larger proportion of neurons with object-related firing in three of the four standard sessions compared to MEC (session 1 LEC:11/41, MEC:1/28, χ2 = 4.75, one tailed p = 0.0148; session 2 LEC:14/43, MEC:5/36, χ2 = 3.74, one tailed p = 0.027; session 4 LEC: 7/31, MEC: 4/27, χ2 = 0.174, one tailed p = 0.308, n.s.; session 6 LEC 10/28, MEC 0/26, χ2 = 9.15, one tailed p = 0.0015).
Responses to Object Novelty and Translocation
The previous analyses were performed on the standard sessions, in which familiar objects were located in their standard positions, in order to measure baseline firing properties of the neurons relative to the objects. Object-manipulation sessions, in which novel objects were introduced or a standard object was translocated, were interleaved with the standard sessions. LEC cells often fired at multiple objects, and the firing was not always consistent across sessions. For example, unit 1 of Figure 5A fired at all 4 objects in standard sessions 1, 2, 4, and 6, but the relative firing rates at each object were variable. Moreover, in session 3, the cell fired at a novel object that was introduced into the environment, but fired only very weakly at 2 of the 4 standard objects. When 2 objects were moved in session 5, the cell fired strongly at one of the new object locations (the top left corner of the box) and weakly at the other object location. The cell was silent at both of these locations in the standard object sessions. To quantify the number of cells that responded consistently to the objects across the first two standard sessions, we considered whether each cell had the same pattern of significant pORI values across both sessions. For example, if a cell had a significant pORI for object 1, object 3, and all objects combined (or any subset of the 5 ORI measures) in both sessions, it was considered stable. Of the 15 cells that had at least one significant pORI in either session, only 3 had the same pattern of significant pORI measures across the two sessions. Across all standard sessions, none of the 22 cells with a significant pORI in at least one session had the same pattern across all sessions. Thus, the pixel by pixel correlation coefficients between rate maps reported earlier do not capture the variability in response to individual objects shown here, as the rate map correlations take into account locations away from objects and are less sensitive to firing rate differences confined to small locations around the objects. We did not attempt to create rate map correlations using only the pixels around objects, because the reduced number of pixels is likely to make such measurements noisy and difficult to interpret on their own, in the absence of an absolute standard correlation score against which to measure response stability.
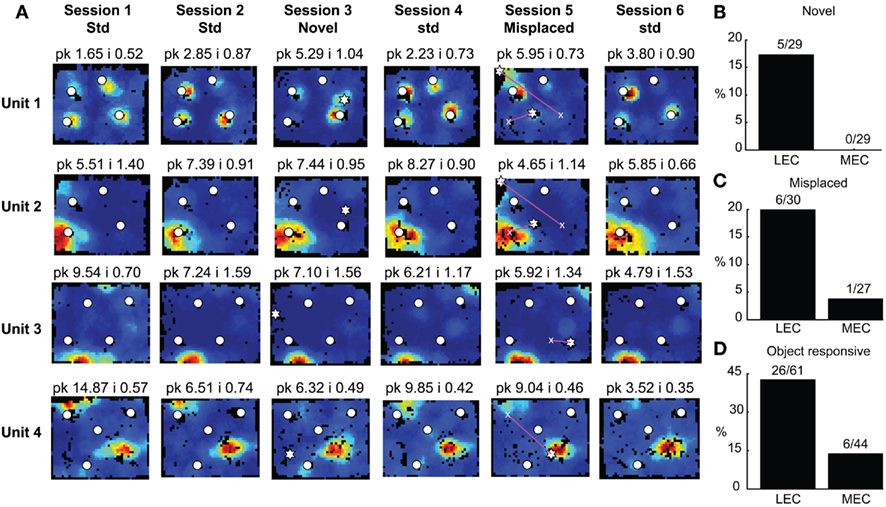
Figure 5. Responses of entorhinal cortical neurons to object manipulations. (A) Object-responsive (units 1–2) and spatially selective (units 3–4) neurons in LEC. White circles mark the standard locations of objects and stars represent the locations of novel (session 3) and misplaced (session 5) objects. Magenta lines connect the standard (marked by x) and misplaced locations of objects in session 5. The firing of units 3 and 4 did not depend on the animals’ head direction being pointed toward the objects. (B) A significantly larger proportion of LEC neurons respond to novel objects. (C) A similar trend is seen in response to misplaced objects. (D) A significantly larger proportion of LEC neurons shows object-related activity in at least one session.
A few LEC units showed selective firing at a subset of the objects. Unit 2 was recorded simultaneously with unit 1 (on a separate tetrode). In contrast to unit 1, this cell fired strongly and consistently around only one of the objects, and it did not fire at either the novel (session 3) or the misplaced (session 5) objects. Interestingly, in session 5, the cell continued to fire at the location where the lower left object had been in the standard sessions, acting more like a “place cell” than an object cell (although it is possible that the presence of objects is required to generate this apparent spatial firing; see below). Rate maps for all neurons recorded in LEC and MEC are shown in Figures A2 and A3 in Appendix, respectively.
In LEC, 5 of the 29 neurons that met analysis criteria showed significantly higher firing at the novel object than regions away from the novel and standard objects, which is a higher proportion than expected by chance at an alpha level of 0.05 (test for proportions, z = 3.0, p = 0.0013). All 5 neurons also showed pmin(ORI) < 0.05 in at least one session with the standard object configuration, indicating that these neurons were not exclusively coding for novelty. In contrast, none of the 29 MEC neurons showed elevated firing in response to novel objects, a result that was significantly different from LEC (Figure 5B; χ2 = 3.50, one tailed p = 0.0308).
Responses to misplaced objects were similar to novel objects. In LEC, 6/30 cells responded significantly to the misplaced object (z = 3.75, p = 8.9 × 10⁻⁵), whereas in MEC only 1 of 27 cells did so (z = –0.325, p = 0.63, n.s.). However, the difference between LEC and MEC was not significant for this comparison, perhaps due to the small numbers of cells (Figure 5C; χ2 = 2.15, one tailed p = 0.069). When returned to their original position, misplaced objects did not exert a stronger influence on LEC neurons than objects that had not been misplaced. Of the 10 LEC neurons with pmin(ORI) < 0.05 in standard sessions immediately following the misplaced object session, only two of the previously misplaced objects showed the lowest pORI among the four standard objects. This proportion is not significantly different from the 25% expected by chance (test of proportions z = −0.3651, p = 0.35). Moreover, unit 2 in Figure 5 is one of these two units. This unit fires selectively at a standard location of one standard object even before it is misplaced, as well as when the object is not at its standard position, thus showing that the object having been misplaced in the previous session is not the cause for this neuron to fire more at the misplaced object in the following session.
Three LEC neurons showed object–place conjunctive responses, in which they fired at an object only when it was moved to a new location and/or maintained the firing at the new location when the object was returned to its standard location (Figure A2 in Appendix, units 3, 23, 28; Weible et al., 2009). In total, a larger proportion of LEC neurons (26/61, or 43%) showed object-related activity in at least one session (including standard as well as object-manipulation sessions) compared to MEC neurons (6/44, or 14%; χ2 = 8.81, one tailed p = 0.0017; Figure 5D). Object-responsive neurons were recorded from multiple rats, and the proportion of object-responsive neurons within LEC and MEC was similar in different rats (Table 1).
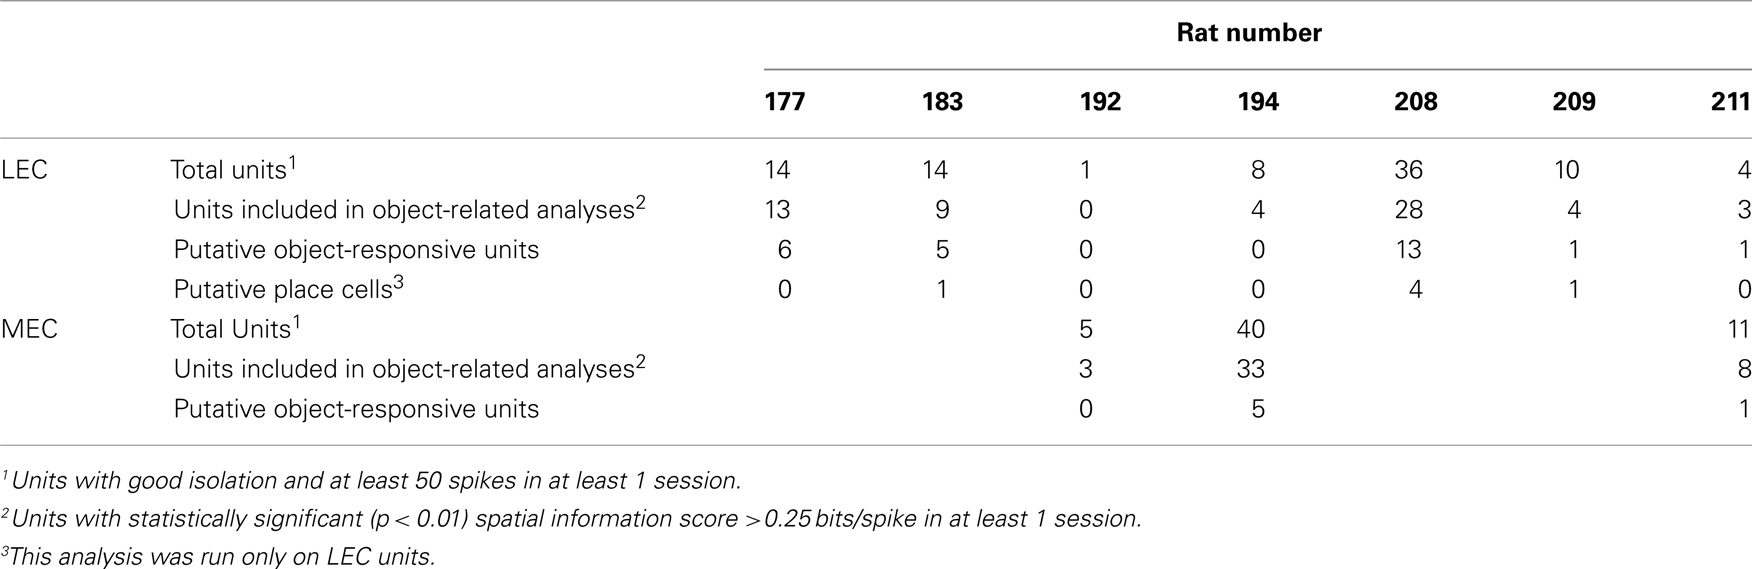
Table 1. Distribution of cells with putative object-related activity across rats.
LEC Place-Like Activity in the Presence of Objects
In addition to the neurons that fired at objects, a number of superficial LEC neurons had spatial firing fields away from objects (Figure 5A). Unit 3 had a small firing field at the south wall, whereas unit 4 had a strong field toward the middle of the box (but away from any standard object location) and a weaker field near one of the objects. In both cases, the fields were stable across sessions. These putative spatial fields were not present in the sessions without objects (Figure A1 in Appendix). Previous recordings from LEC did not report these cells (Hargreaves et al., 2005; Yoganarasimha et al., 2010), adding further evidence that objects may be required for place-like activity to be present in LEC. We used a conservative set of criteria to identify a LEC cell as a putative place-related cell: (1) it had a statistically significant (p < 0.01) spatial information score >0.4 bits/spike; (2) the rate maps of the cell in consecutive sessions were highly correlated; and (3) its p(ORI) for all 4-objects-together was >0.4. Rate maps for the six neurons classified as putative place cells with fields away from objects are shown in Figure A2 in Appendix (Units 24, 43, 50, 66, 73, and 80). In light of this place-related activity contingent on the presence of objects, two other neurons that were classified as object-related (unit 2 of Figure 5 and unit 74 of Figure A2 in Appendix) may actually be place-related neurons that happened to have fields at the objects.
Histological Locations of Recording Sites
Projections from entorhinal cortex to hippocampus are topographically organized, such that dorsal hippocampus receives inputs from lateral LEC and dorso-caudal MEC while ventral hippocampus receives inputs from medial LEC and ventral MEC (Witter and Amaral, 2004). LEC neurons in the present study were spread over the entire lateral to medial extent of LEC, while MEC neurons were confined to the dorso-caudal to intermediate parts of MEC (Figure 6). Object-responsive neurons were detected along the entire medial–lateral extent of LEC. To confirm that the difference in the sampling from LEC and MEC did not contribute to the higher proportion of object-responsive neurons in LEC reported in this study, we compared the proportions of object-responsive neurons in the lateral half of LEC and the dorsal half of MEC (dorsolateral projection band), which project to the dorsal half of hippocampus. The dorsolateral projection band of LEC had a higher proportion of object-responsive neurons than the corresponding region of MEC (LEC: 17/41, or 41%; MEC:4/27, or 15%; χ2 = 4.24, one tailed p = 0.02), confirming the main results of this paper. It remains to be determined whether neurons in ventral MEC (which were not sampled here) show a higher proportion of object-responsiveness than neurons in dorso-caudal MEC.
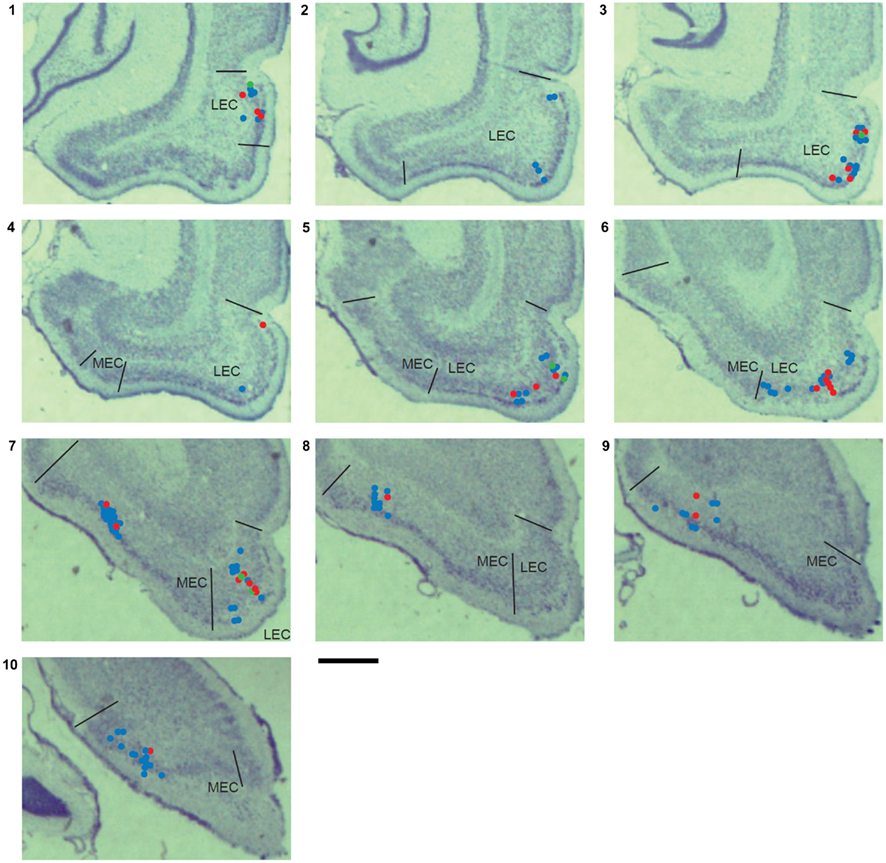
Figure 6. Single unit recording locations. The locations of units recorded from all rats are marked on coronal sections from one of the rats used in this study. Red dots indicate the locations of units with pmin(ORI) < 0.05 shown in Figures A2 and A3 in Appendix. Green dots indicate the locations of LEC putative place cells firing away from objects shown in Figure A2 in Appendix. Blue dots show the locations of unclassified units. These sections are 470 μm apart (assuming a 15% histological shrinkage factor), and approximately correspond to the following plates in the Paxinos and Watson (1998) rat brain atlas: section 1: plate 42 (bregma −5.6 mm) to section 10: plate 55 (bregma −8.8 mm). Scale bar is 1 mm.
Object-responsive neurons were found in both layer II and layer III in LEC. Because of the small number of object-responsive neurons confirmed in each layer (6 in layer II, 13 in layer III, and 7 near the layer II/III border) and the confound introduced by the tendency for layer II neurons to be recorded on later days than layer III neurons on average, any quantitative differences in object-responsiveness between the layers could not be estimated.
Discussion
A longstanding debate on the nature of hippocampal encoding in rats has centered on whether hippocampal neurons are specialized for encoding space, or whether they encode non-spatial variables as well (O’Keefe, 1999; Shapiro and Eichenbaum, 1999). A consensus is emerging that these cells encode conjunctive representations of individual items within a spatial location or context (O’Keefe and Nadel, 1978; Wiebe and Staubli, 1999; Moita et al., 2003; Komorowski et al., 2009; Manns and Eichenbaum, 2009). It is often hypothesized that parallel processing streams convey spatial and non-spatial information to the hippocampus through the MEC and LEC, respectively (Burwell, 2000; Hargreaves et al., 2005; Knierim et al., 2006; Manns and Eichenbaum, 2006; Ranganath, 2010; Yoganarasimha et al., 2010). Although single neurons in monkey entorhinal cortex have been shown to respond to pictures of objects and their location on a monitor (Suzuki et al., 1997), and single neurons in rat LEC respond to objects (Zhu et al., 1995a) and odors (Young et al., 1997), these experiments were performed under conditions that prevent a direct comparison to the spatial firing properties of hippocampal place cells and MEC grid cells. The present results provide the first direct confirmation of this hypothesis in the context of the navigation/foraging tasks typically used to study spatial encoding in the hippocampus. In conjunction with previous results that show strong spatial selectivity of MEC neurons and little selectivity of LEC neurons in the absence of objects (Hargreaves et al., 2005; Yoganarasimha et al., 2010), we show here a double dissociation between these areas, as LEC neurons are much more strongly responsive to objects than are MEC neurons. In contrast, we observed a number of obvious grid cells in MEC (e.g., units 18, 23, and 45 in Figure A3 in Appendix), which were not present in LEC (Figures A1 and A2 in Appendix).
Object Selectivity in LEC
The nature of the object representations in LEC is not yet clear, as there was a wide variety of responses to objects. A number of LEC neurons fired at multiple objects, in multiple sessions (e.g., units 1, 7, 23, 48, 58, and 71 in Figure A2 in Appendix), suggesting that they are encoding object location or perhaps generalized attention to external landmarks. The latter suggestion might explain why many cells did not fire consistently at the same objects over sessions, as the animal’s attention to a particular object may have varied across sessions. This interpretation is consistent with the idea that the LEC gates sensory input from perirhinal cortex to the hippocampus, allowing only behaviorally relevant or attended stimuli to gain access to the hippocampus. Along these lines, Morris and Frey (1997) have suggested that the hippocampus automatically records only “attended” experience. In slices, electrical stimulation of perirhinal cortex does not activate LEC when the stimulation is restricted to perirhinal cortex, but it causes a strong activation of LEC when paired with stimulation of the amygdala (Kajiwara et al., 2003; de Curtis and Pare, 2004). Thus, some type of salience signal may be critical to allow the sensory input from perirhinal cortex to drive LEC neurons. This notion is consistent with recent results suggesting that the temporal or spatial stability of hippocampal place fields may be modulated by changes in the animal’s attention to external landmarks (Kentros et al., 2004; Muzzio et al., 2009; Fenton et al., 2010).
The foregoing discussion raises the possibility that LEC is encoding salience, rather than a salience-gated sensory input. That is, the LEC neurons might fire whenever the animal pays attention to what it perceives as a salient sensory stimulus without regard to the actual properties of the stimulus. This would imply that simultaneously recorded object-responsive neurons would show similar object selectivity (i.e., if neuron 1 prefers objects 1 and 4, so should neuron 2) and coordinated changes from session to session (i.e., if neuron 1 changes preference from object 1 in session 1 to object 2 in session 2, so should neuron 2). We did not see such an effect in object-responsive neurons recorded simultaneously (e.g., units 44 and 45; 47 and 48), making it unlikely that all LEC object-responsive neurons encode a salience signal without regards to the properties of the stimulus.
A few cells appeared to show some selectivity for subsets of objects (e.g., units 5, 12, 45, 47, 49, 64, and 74 in Figure A2 in Appendix), suggesting that there may be a distributed, population code for object identity in the LEC. Such a code is consistent with the weak object-identity signal identified in the hippocampus under similar conditions of undirected exploration (Lenck-Santini et al., 2005; Manns and Eichenbaum, 2009). Under other conditions in which the animals performed behavioral tasks related to individual items, hippocampal cells showed greater selectivity for the items (Wood et al., 1999; Komorowski et al., 2009). It is thus possible that LEC neurons can show greater, more stable, individual object selectivity under similar behavioral conditions. Furthermore, even under the conditions of the present study (conditions that are similar to those employed in standard object-recognition tasks, which measure differential investigation of novel objects or misplaced objects in the absence of an overt behavioral task; Mumby et al., 2002), there may be a very sparse representation of individual objects that we did not detect. Given the small number of objects used in this study (each neuron was tested on four standard objects and one novel object), we cannot eliminate the possibility that there are neurons in the LEC that respond to individual objects with high specificity, similar to the sparse code for individual items reported in human medial temporal lobe neurons (Quiroga et al., 2005). Although these open questions do not diminish the importance of the dissociation shown here between LEC and MEC in terms of overall object-responsiveness, they indicate future directions that are necessary to determine the precise nature of the object-related code in LEC and, subsequently, the nature of the computations performed by the hippocampus on this input.
Place-Related Activity in LEC in the Presence of Objects
The consistent firing of LEC neurons at spatial locations in the arena away from the objects was an unexpected finding. While it is possible that this apparent place-related activity is merely a representation of “unidentified objects” such as odors and specific walls, this is unlikely for the following reasons: 1. If the place-related cells were really just object-responsive cells responding to “unidentified objects,” they would be expected to show a session to session variability similar to the known object-responsive cells. One of the criteria for classifying a neuron as a putative place-related cell was that its intersession rate map correlation had to be >0.71. All 6 of the place-related cells had correlation coefficients >0.81, while the only object-responsive cell that had a correlation coefficient >0.81 was a cell (Cell 2 of Figure 5) that fired at a single object, and continued doing so at its standard location after the object was moved (and hence might be a putative place-related cell itself). 2. In the rare sessions in which the rats produced strong olfactory stimuli like urine or feces, the urine or feces were removed and the area wiped with paper towels to spread the odor over a large area, making it less likely that a strong sensory stimulus with a very small spatial spread remained in the box from session to session. 3. Previous experiments had conditions that should have given rise to similar responses to “unidentified objects,” such as textures on the circular track, from which it would be impossible to eliminate odors (Yoganarasimha et al., 2010), and walls (Hargreaves et al., 2005; Yoganarasimha et al., 2010). Putative place-related activity was not observed in LEC under these experimental conditions.
Influence of Objects on Functional Populations in MEC
None of the MEC neurons with pmin(ORI) < 0.05 could be identified as grid or border cells, even though some of the vertices of high resolution grid cells were at or near the objects (e.g., units 18, 23, and 45 in Figure A3 in Appendix). However, the influence of objects on grid cells may not be limited to increasing their propensity to fire at the objects. For example, the objects, as landmarks, may play a role in anchoring the phase and orientation of grid cells. Individual object-manipulations, as done in the current experiment, are inadequate to test this possibility. The control of grid phase and orientation by objects can be tested in future studies by coherent translation or rotation of all the objects relative to the box (and distal landmarks) as has been done with hippocampal place cells (Cressant et al., 1999).
Implications for the Computational Functions of LEC and MEC: External Sensory Input vs. Path Integration
A key finding of this study is the demonstration of both object-responsive neurons and putative place-responsive neurons in LEC in the presence of local objects, suggesting that the distinction between MEC and LEC may not be purely spatial vs. non-spatial. Rather, distinctions between these areas may be best described in terms of computations based on internally based, path integration mechanisms in MEC vs. computations based on the processing of external sensory input in LEC. The former requires external sensory input to keep the path integration computation stable relative to the external world, a function that may be performed by boundary cells in MEC (Savelli et al., 2008; Solstad et al., 2008). This requirement is consistent with the small amount of object-related activity seen in MEC in the present study. In contrast, the LEC may primarily represent non-spatial information, such as objects, and may also create sparse, spatial representations based on configurations of external, local landmarks (but not distal landmarks; Yoganarasimha et al., 2010). The three-dimensional objects used in the present study had a stronger influence on the activity of LEC neurons compared to textures on the track (Yoganarasimha et al., 2010) or a cue card in a box (Hargreaves et al., 2005), indicating that three-dimensionality and prominence of objects might be important correlates of LEC activity. However, distal objects are not sufficient to give rise to the putative place cell like activity seen in the presence of objects (Yoganarasimha et al., 2010), indicating that local three-dimensional objects may affect LEC processing differently from distal landmarks. Although the spatial selectivity of LEC is low in the absence of local landmarks, the external sensory input from LEC may nonetheless be a contributing factor that allows some hippocampal cells to retain place fields when the MEC is lesioned or when grid cells are disrupted by abolishing the theta rhythm (Miller and Best, 1980; Van Cauter et al., 2008; Brandon et al., 2011; Koenig et al., 2011). Thus, the double dissociation between LEC and MEC is strong but not absolute, which is expected given the anatomical connectivity between the LEC and MEC pathways and the feedback connections from the hippocampus. Nonetheless, the clear differences between these areas support the notion that they perform different computations and/or provide different types of information to the hippocampus: external sensory input from LEC and path-integration-based, spatial input from MEC. The convergence of these two signals in the hippocampus might allow the formation of context-dependent, conjunctive representations of “what happened where” that can be later retrieved during episodic memory recall.
Author Contributions
James J. Knierim conceived the study. Sachin S. Deshmukh and James J. Knierim designed the experiments and wrote the manuscript. Sachin S. Deshmukh performed the experiments and analyzed the data.
Conflict of Interest Statement
The authors declare that the research was conducted in the absence of any commercial or financial relationships that could be construed as a potential conflict of interest.
Acknowledgments
We thank Geeta Rao for technical help; Dr. Francesco Savelli for helpful discussions, comments on the manuscript, and assistance with the mutual information analysis; and Drs. Kimberly Christian and Raghav Rajan for comments on the manuscript. This work was supported by NIH grant RO1 NS039456.
References
Aggleton, J. P., and Brown, M. W. (1999). Episodic memory, amnesia, and the hippocampal-anterior thalamic axis. Behav. Brain Sci. 22, 425–444.
Boccara, C. N., Sargolini, F., Thoresen, V. H., Solstad, T., Witter, M. P., Moser, E. I., and Moser, M. B. (2010). Grid cells in pre- and parasubiculum. Nat. Neurosci. 13, 987–994.
Brandon, M. P., Bogaard, A. R., Libby, C. P., Connerney, M. A., Gupta, K., and Hasselmo, M. E. (2011). Reduction of theta rhythm dissociates grid cell spatial periodicity from directional tuning. Science 332, 595–599.
Burwell, R. D. (2000). The parahippocampal region: corticocortical connectivity. Ann. N. Y. Acad. Sci. 911, 25–42.
Chen, L. L., Lin, L. H., Green, E. J., Barnes, C. A., and McNaughton, B. L. (1994). Head-direction cells in the rat posterior cortex. I. Anatomical distribution and behavioral modulation. Exp. Brain Res. 101, 8–23.
Cho, J., and Sharp, P. E. (2001). Head direction, place, and movement correlates for cells in the rat retrosplenial cortex. Behav. Neurosci. 115, 3–25.
Clayton, N. S., and Dickinson, A. (1998). Episodic-like memory during cache recovery by scrub jays. Nature 395, 272–274.
Cressant, A., Muller, R. U., and Poucet, B. (1999). Further study of the control of place cell firing by intra-apparatus objects. Hippocampus 9, 423–431.
de Curtis, M., and Pare, D. (2004). The rhinal cortices: a wall of inhibition between the neocortex and the hippocampus. Prog. Neurobiol. 74, 101–110.
Deshmukh, S. S., Yoganarasimha, D., Voicu, H., and Knierim, J. J. (2010). Theta modulation in the medial and the lateral entorhinal cortices. J. Neurophysiol. 104, 994–1006.
Eichenbaum, H., and Fortin, N. J. (2005). Bridging the gap between brain and behavior: cognitive and neural mechanisms of episodic memory. J. Exp. Anal. Behav. 84, 619–629.
Fenton, A. A., Lytton, W. W., Barry, J. M., Lenck-Santini, P. P., Zinyuk, L. E., Kubik, S., Bures, J., Poucet, B., Muller, R. U., and Olypher, A. V. (2010). Attention-like modulation of hippocampus place cell discharge. J. Neurosci. 30, 4613–4625.
Frank, L. M., Brown, E. N., and Wilson, M. A. (2001). A comparison of the firing properties of putative excitatory and inhibitory neurons from CA1 and the entorhinal cortex. J. Neurophysiol. 86, 2029–2040.
Hafting, T., Fyhn, M., Molden, S., Moser, M. B., and Moser, E. I. (2005). Microstructure of a spatial map in the entorhinal cortex. Nature 436, 801–806.
Hampson, R. E., Simeral, J. D., and Deadwyler, S. A. (1999). Distribution of spatial and nonspatial information in dorsal hippocampus. Nature 402, 610–614.
Hargreaves, E. L., Rao, G., Lee, I., and Knierim, J. J. (2005). Major dissociation between medial and lateral entorhinal input to dorsal hippocampus. Science 308, 1792–1794.
Hargreaves, E. L., Yoganarasimha, D., and Knierim, J. J. (2007). Cohesiveness of spatial and directional representations recorded from neural ensembles in the anterior thalamus, parasubiculum, medial entorhinal cortex, and hippocampus. Hippocampus 17, 826–841.
Kajiwara, R., Takashima, I., Mimura, Y., Witter, M. P., and Iijima, T. (2003). Amygdala input promotes spread of excitatory neural activity from perirhinal cortex to the entorhinal-hippocampal circuit. J. Neurophysiol. 89, 2176–2184.
Kentros, C. G., Agnihotri, N. T., Streater, S., Hawkins, R. D., and Kandel, E. R. (2004). Increased attention to spatial context increases both place field stability and spatial memory. Neuron 42, 283–295.
Knierim, J. J. (2006). Neural representations of location outside the hippocampus. Learn. Mem. 13, 405–415.
Knierim, J. J., and Hamilton, D. A. (2011). Framing spatial cognition: neural representations of proximal and distal frames of reference and their roles in navigation. Physiol. Rev. 91. doi: 10.1152/physrev.00021.2010. (in press).
Knierim, J. J., Lee, I., and Hargreaves, E. L. (2006). Hippocampal place cells: parallel input streams, subregional processing, and implications for episodic memory. Hippocampus 16, 755–764.
Koenig, J., Linder, A. N., Leutgeb, J. K., and Leutgeb, S. (2011). The spatial periodicity of grid cells is not sustained during reduced theta oscillations. Science 332, 592–595.
Komorowski, R. W., Manns, J. R., and Eichenbaum, H. (2009). Robust conjunctive item-place coding by hippocampal neurons parallels learning what happens where. J. Neurosci. 29, 9918–9929.
Lenck-Santini, P. P., Rivard, B., Muller, R. U., and Poucet, B. (2005). Study of CA1 place cell activity and exploratory behavior following spatial and nonspatial changes in the environment. Hippocampus 15, 356–369.
Lever, C., Burton, S., Jeewajee, A., O’Keefe, J., and Burgess, N. (2009). Boundary vector cells in the subiculum of the hippocampal formation. J. Neurosci. 29, 9771–9777.
Manns, J. R., and Eichenbaum, H. (2009). A cognitive map for object memory in the hippocampus. Learn. Mem. 16, 616–624.
Miller, V. M., and Best, P. J. (1980). Spatial correlates of hippocampal unit activity are altered by lesions of the fornix and entorhinal cortex. Brain Res. 194, 311–323.
Moita, M. A., Rosis, S., Zhou, Y., LeDoux, J. E., and Blair, H. T. (2003). Hippocampal place cells acquire location-specific responses to the conditioned stimulus during auditory fear conditioning. Neuron 37, 485–497.
Morris, R. G., and Frey, U. (1997). Hippocampal synaptic plasticity: role in spatial learning or the automatic recording of attended experience? Philos. Trans. R. Soc. Lond. B Biol. Sci. 352, 1489–1503.
Mumby, D. G., Gaskin, S., Glenn, M. J., Schramek, T. E., and Lehmann, H. (2002). Hippocampal damage and exploratory preferences in rats: memory for objects, places, and contexts. Learn. Mem. 9, 49–57.
Murray, E. A., Bussey, T. J., and Saksida, L. M. (2007). Visual perception and memory: a new view of medial temporal lobe function in primates and rodents. Annu. Rev. Neurosci. 30, 99–122.
Muzzio, I. A., Levita, L., Kulkarni, J., Monaco, J., Kentros, C., Stead, M., Abbott, L. F., and Kandel, E. R. (2009). Attention enhances the retrieval and stability of visuospatial and olfactory representations in the dorsal hippocampus. PLoS Biol. 7, e1000140. doi: 10.1371/journal.pbio.1000140
O’Keefe, J. (1976). Place units in the hippocampus of the freely moving rat. Exp. Neurol. 51, 78–109.
O’Keefe, J. (1999). Do hippocampal pyramidal cells signal non-spatial as well as spatial information? Hippocampus 9, 352–364.
Paxinos, G., and Watson, C. (1998). The Rat Brain in Stereotaxic Coordinates. San Diego: Academic Press.
Quiroga, R. Q., Reddy, L., Kreiman, G., Koch, C., and Fried, I. (2005). Invariant visual representation by single neurons in the human brain. Nature 435, 1102–1107.
Ranganath, C. (2010). A unified framework for the functional organization of the medial temporal lobes and the phenomenology of episodic memory. Hippocampus 20, 1263–1290.
Rivard, B., Li, Y., Lenck-Santini, P. P., Poucet, B., and Muller, R. U. (2004). Representation of objects in space by two classes of hippocampal pyramidal cells. J. Gen. Physiol. 124, 9–25.
Sargolini, F., Fyhn, M., Hafting, T., McNaughton, B. L., Witter, M. P., Moser, M. B., and Moser, E. I. (2006). Conjunctive representation of position, direction, and velocity in entorhinal cortex. Science 312, 758–762.
Savelli, F., Yoganarasimha, D., and Knierim, J. J. (2008). Influence of boundary removal on the spatial representations of the medial entorhinal cortex. Hippocampus 18, 1270–1282.
Scoville, W. B., and Milner, B. (1957). Loss of recent memory after bilateral hippocampal lesions. J. Neurol. Neurosurg. Psychiatr. 20, 11–21.
Shapiro, M. L., and Eichenbaum, H. (1999). Hippocampus as a memory map: synaptic plasticity and memory encoding by hippocampal neurons. Hippocampus 9, 365–384.
Sharp, P. E. (1997). Subicular cells generate similar spatial firing patterns in two geometrically and visually distinctive environments: comparison with hippocampal place cells. Behav. Brain Res. 85, 71–92.
Skaggs, W. E., McNaughton, B. L., Wilson, M. A., and Barnes, C. A. (1996). Theta phase precession in hippocampal neuronal populations and the compression of temporal sequences. Hippocampus 6, 149–172.
Solstad, T., Boccara, C. N., Kropff, E., Moser, M. B., and Moser, E. I. (2008). Representation of geometric borders in the entorhinal cortex. Science 322, 1865–1868.
Squire, L. R., Stark, C. E., and Clark, R. E. (2004). The medial temporal lobe. Annu. Rev. Neurosci. 27, 279–306.
Suzuki, W. A., Miller, E. K., and Desimone, R. (1997). Object and place memory in the macaque entorhinal cortex. J. Neurophysiol. 78, 1062–1081.
Taube, J. S. (1995). Place cells recorded in the parasubiculum of freely moving rats. Hippocampus 5, 569–583.
Van Cauter, T., Poucet, B., and Save, E. (2008). Unstable CA1 place cell representation in rats with entorhinal cortex lesions. Eur. J. Neurosci. 27, 1933–1946.
Vargha-Khadem, F., Gadian, D. G., Watkins, K. E., Connelly, A., Van Paesschen, W., and Mishkin, M. (1997). Differential effects of early hippocampal pathology on episodic and semantic memory. Science 277, 376–380.
Wan, H., Aggleton, J. P., and Brown, M. W. (1999). Different contributions of the hippocampus and perirhinal cortex to recognition memory. J. Neurosci. 19, 1142–1148.
Weible, A. P., Rowland, D. C., Pang, R., and Kentros, C. (2009). Neural correlates of novel object and novel location recognition behavior in the mouse anterior cingulate cortex. J. Neurophysiol. 102, 2055–2068.
Wiebe, S. P., and Staubli, U. V. (1999). Dynamic filtering of recognition memory codes in the hippocampus. J. Neurosci. 19, 10562–10574.
Wiener, S. I., Paul, C. A., and Eichenbaum, H. (1989). Spatial and behavioral correlates of hippocampal neuronal activity. J. Neurosci. 9, 2737–2763.
Witter, M. P., and Amaral, D. G. (2004). “Hippocampal formation,” in The Rat Nervous System, 3rd Edn, ed. G. Paxinos (Amsterdam: Elsevier), 635–704.
Wood, E. R., Dudchenko, P. A., and Eichenbaum, H. (1999). The global record of memory in hippocampal neuronal activity. Nature 397, 613–616.
Yoganarasimha, D., Rao, G., and Knierim, J. J. (2010). Lateral entorhinal neurons are not spatially selective in cue-rich environments. Hippocampus. doi: 10.1002/hipo.20839. [Epub ahead of print].
Young, B. J., Otto, T., Fox, G. D., and Eichenbaum, H. (1997). Memory representation within the parahippocampal region. J. Neurosci. 17, 5183–5195.
Zhu, X. O., Brown, M. W., and Aggleton, J. P. (1995a). Neuronal signalling of information important to visual recognition memory in rat rhinal and neighbouring cortices. Eur. J. Neurosci. 7, 753–765.
Zhu, X. O., Brown, M. W., McCabe, B. J., and Aggleton, J. P. (1995b). Effects of the novelty or familiarity of visual stimuli on the expression of the immediate early gene c-fos in rat brain. Neuroscience 69, 821–829.
Appendix
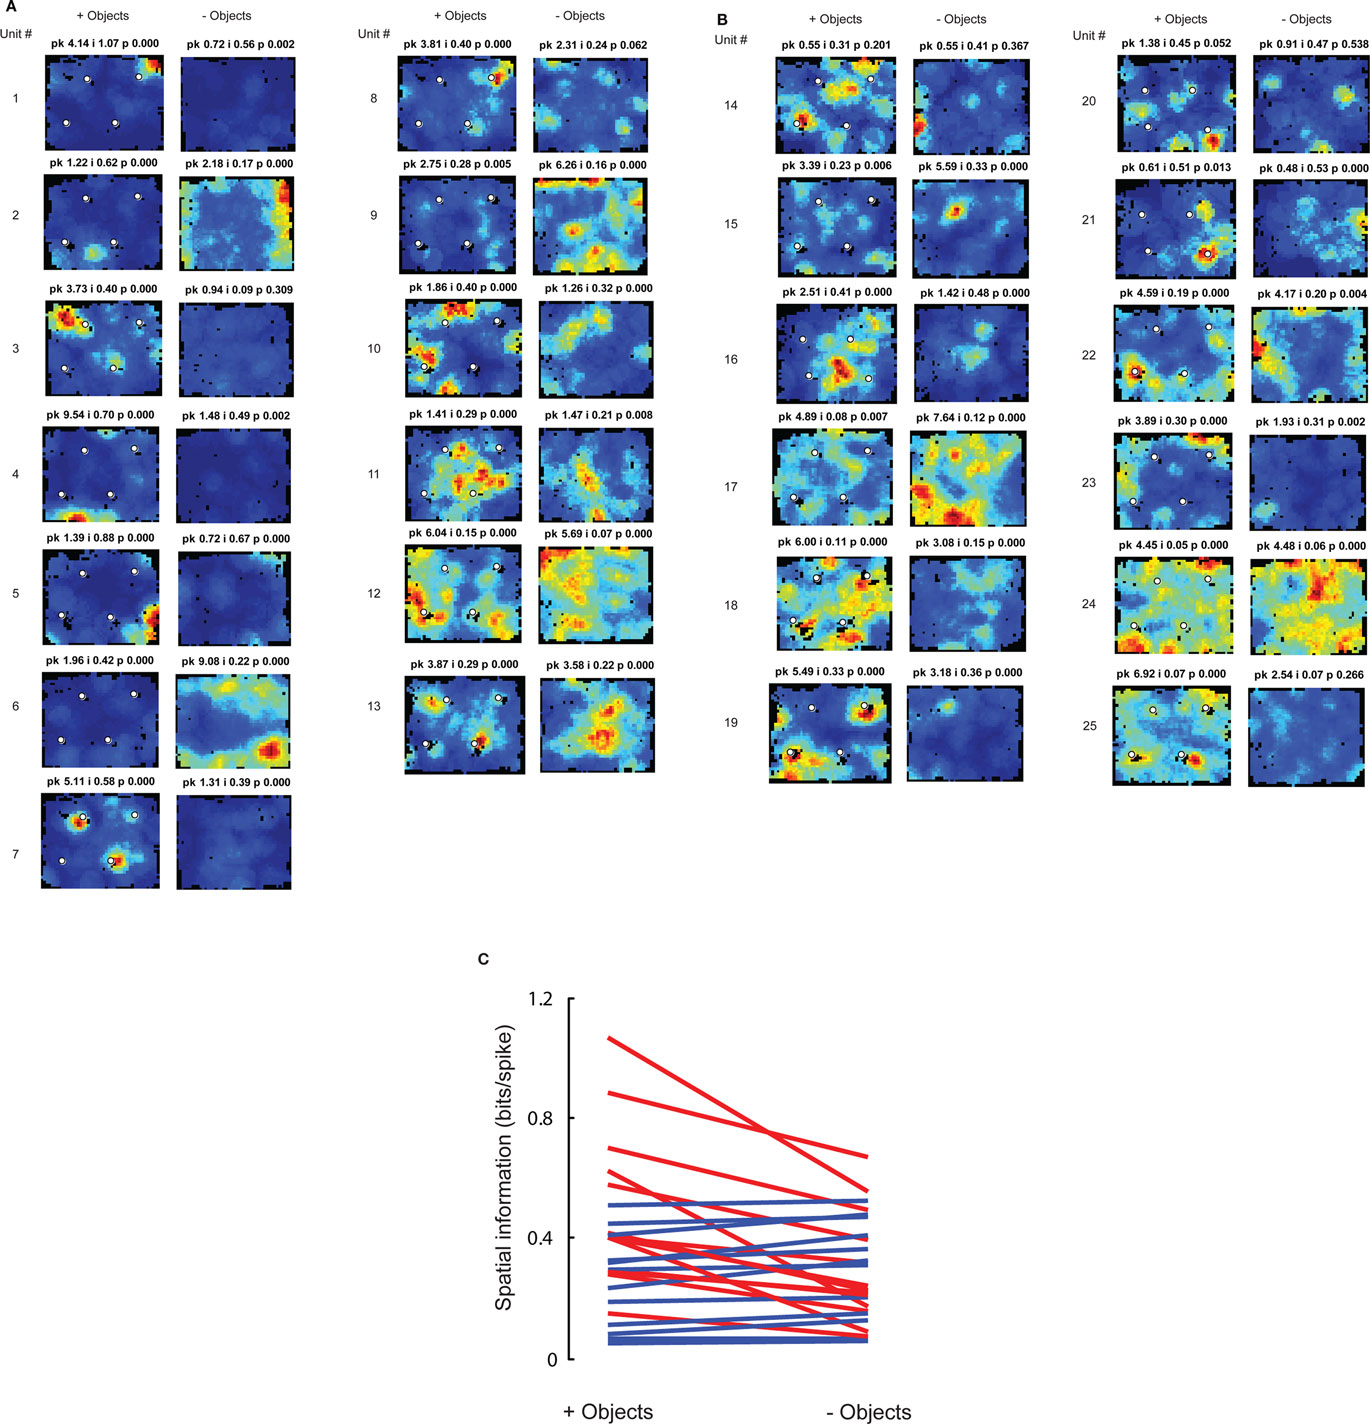
Figure A1. Spatial information in LEC is higher in an open field containing objects compared to an empty field. To test whether the higher spatial information recorded with objects in the present study, compared to previous studies (Hargreaves et al., 2005; Yoganarasimha et al., 2010), was an artifact of uncontrolled differences between the studies, 25 LEC units in two rats were recorded in sessions with (session 1) and without (session 7) objects. Because the LEC firing patterns might have been affected by a prior history of the presence of objects, the session without objects was conducted in a similar box in a different room to minimize such a confound. (A) Firing rate maps of the neurons with higher spatial information scores in the presence of objects than in the absence of objects, sorted in decreasing order of the difference. Note that a number of cells (units 1, 3, 4, 5, 7, and 8) had highly localized, high-rate firing fields in the presence of objects but weaker, more diffuse firing in the absence of objects. Two cells (units 2 and 6) fired at higher rates in the session without objects, but they fired along multiple walls, not in restricted locations. Similar activity along walls has been shown previously (Hargreaves et al., 2005). Peak firing rate (pk, Hz), spatial information score (i, bits/spike) and probability of getting the information score by chance (p) are shown at the top of each plot. Unlike the firing rate maps shown elsewhere in the paper, which were autoscaled between 0 Hz and maximum firing rates within the individual rate maps, the firing rate maps in (A,B) were scaled such that blue corresponds to 0 Hz while red corresponds to the larger of the peak firing rates in the with- and without-object sessions for the given neuron. This cross-session scaling makes it easy to see rate remapping as well as the locations of firing fields. Note that in some cases, the scaling masks low-rate firing that still results in moderate spatial information scores (e.g., units 1 and 4 without objects show information scores of 0.56 and 0.49, respectively, although the peak firing rates and information scores are less than they are with objects). (B) Firing rate maps of the neurons with lower spatial information scores in the presence of objects than in the absence of objects, sorted in decreasing order of the difference. Note the lack of a pronounced difference in spatial firing selectivity between the with-object and without-object sessions in these cells, in contrast with the numerous examples in (A). This contrast argues strongly against a generalized “remapping” interpretation of these data, as such an explanation would predict the number of cells having higher spatial information in the with-objects session to be approximately equal to the number of cells having higher information score in the without-objects environments. On average, the firing rate maps without objects in (A,B) resemble those shown in prior reports of LEC non-spatial firing (Hargreaves et al., 2005; Yoganarasimha et al., 2010), with none of the cells showing robust, highly localized firing, indicating that the increased responsiveness when objects are present is not due to a generalized increase in spatial selectivity in the present study. Both rats included in this analysis were trained extensively in the environment with objects, and the last 2–3 days of training included one foraging session in the environment without objects. The experiments were run over multiple days, making the second room more familiar over time. Furthermore, because the prior studies recorded from highly familiar environments and showed poor spatial selectivity in LEC, the similar lack of spatial selectivity without objects in the present study is unlikely a result of the relative novelty of the environment without objects. (C) Comparison of spatial information scores of LEC neurons in the presence and absence of objects. Red lines connect spatial information scores in the presence (+) and in the absence (−) of objects for neurons that showed higher spatial information scores in the presence of objects than in the absence of objects, shown in (A). Blue lines connect spatial information scores for neurons that showed lower spatial information in the presence of objects than in the absence of objects, shown in (B). Visually, the slopes of the red lines are on average greater than the slopes of the blue lines, indicating that a number of cells that had high spatial information in the presence of objects lost this tuning in the absence of objects. There were no neurons that had high spatial information in the absence of objects and much lower information in the presence of objects (i.e., there are no blue lines with a steep slope), arguing against a general remapping explanation for differences between the environments. Across all neurons, the spatial information scores were significantly higher in the presence of objects than in the absence of objects (with-objects median = 0.33 bits/spike, without-objects median = 0.24 bits/spike; Wilcoxon signed rank test, p = 0.04).This difference was even more significant when only the 23 cells with significant information scores (p < 0.01) in at least one of the two sessions were included (with-objects median = 0.33 bits/spike, without-objects median = 0.22 bits/spike; Wilcoxon signed rank test, p = 0.017).
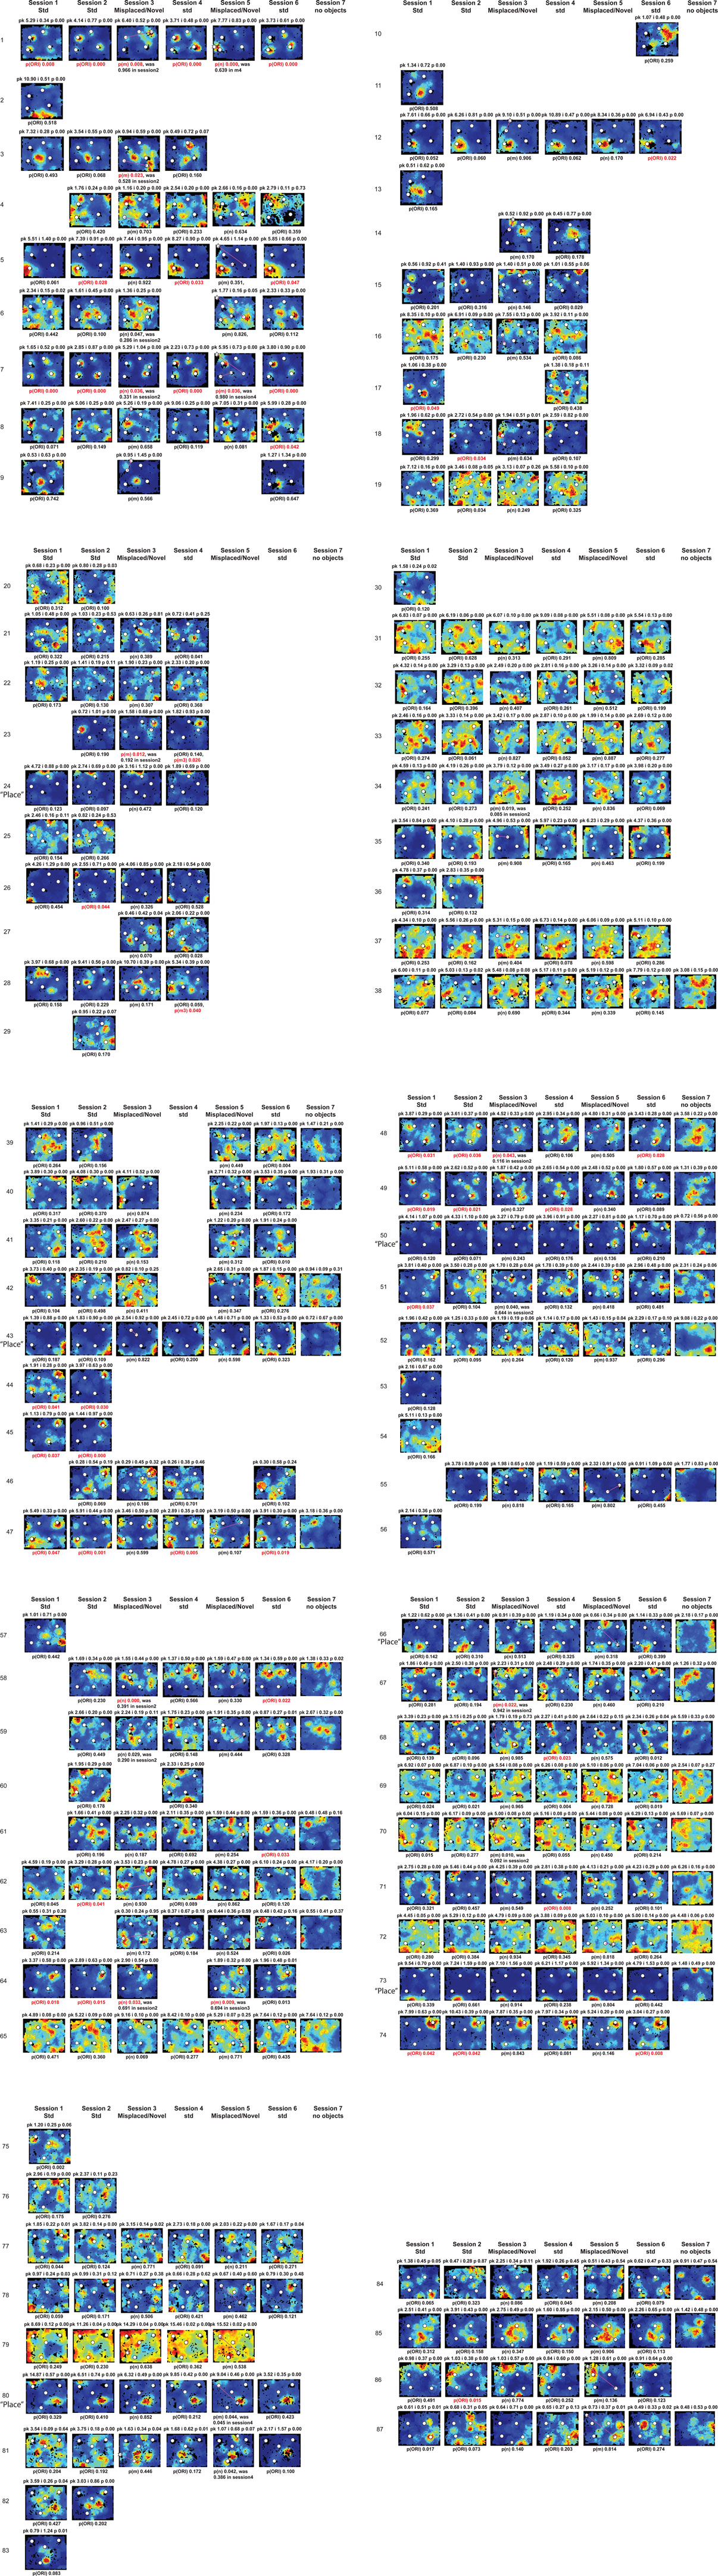
Figure A2. Rate maps of all well-isolated neurons recorded from LEC with >50 spikes in the given session. All rate maps shown were smoothed using adaptive binning (Skaggs et al., 1996), but unsmoothed rate maps were used for the analyses of object-responsiveness. The positions of familiar objects in their standard locations are marked with white circles, while misplaced and novel objects (in sessions 3/5) are marked with stars. Magenta lines connect the standard and new locations of misplaced objects. The peak firing rate (pk, spikes/second), spatial information score (i, bits/spike), and probability of obtaining the information score by chance (p) are shown at the top of each rate map. For standard object sessions (sessions 1, 2, 4, and 6), pmin (ORI) is shown at the bottom of each rate map [marked as p(ORI)]. For novel or misplaced object sessions (sessions 3 and 5), the probability of getting higher firing at the novel [p(n)] or misplaced [p(m)] object is shown. Font colors for these probabilities are red when they are <0.05 and when the rate maps have a spatial information score >0.25 bits/spike that is statistically significant at the p < 0.01 level. These are the neurons included in the χ2 statistics reported in the paper. While many LEC neurons showing object-related firing showed a lot of session to session variability in terms of firing rates as well as the subsets of objects they fired at (e.g., units 1, 7, 23, 48, 58, 71, and 86), some neurons repeatedly fired at the same subset of objects over multiple sessions (e.g., units 5, 12, 45, 47, 49, 64, and 74). Thus, a subset of LEC neurons may convey information about object identity in a distributed, population code. A number of LEC cells were identified as putative place cells, using the conservative criteria of a high spatial information score >0.4 bits/spike, high session to session stability, and a low probability of object-related activity (see Materials and Methods). These neurons are marked to the left of session 1 with a “Place” label (units 24, 43, 50, 66, 73, 80). There are other putative place cells visible, which might have failed on one on more criteria, but which show distinct firing fields away from the objects (e.g., units 2, 3, 9, 11, 53). Units 5 and 74, which fire at single objects, may also be place-related. This interpretation is supported by the continued firing of these neurons in the same locations when the objects were moved to different locations. Three LEC neurons (units 3, 23, 28) show object–place conjunctive responses. Unit 3 fires at a misplaced object in session 3. It does not fire at this object in the other three sessions when the object is in its standard position. Unit 23 fires at the misplace location of an object (and weakly at the position where it used to be) in session 3. It continues firing at this new location when the object is moved back to its standard location. It does not fire at the object in sessions 2 and 4, when the object is in its standard position. Unit 28 fires at the misplaced locations of objects in session 3 [although p(m) is greater than 0.05] and continues to fire at the new locations in session 4, after the objects have been moved back to their standard positions. All these responses cannot be explained as purely object-related or purely space-related activity, but are correlated to object and space. Similar activity has previously been shown in hippocampus (O’Keefe, 1976) and cingulate cortex (Weible et al., 2009). In addition to the probabilities shown with ratemaps for all other neurons, ratemaps for units 23 and 28 also show p(m3), which is the probability in session 4 that the ORI at the misplaced location (where the object used to be in session 3) can be obtained by chance. A variety of considerations led to the exclusion of some of the neurons recorded in some of the sessions from the analyses. If a cell fired less than 50 spikes in a given session, or showed a drop in waveform signal-to-noise in a given session so as to make its isolation quality unacceptable, the cell was eliminated from the analysis, and its rate map not shown here. In addition, sessions in which the rat foraged poorly were excluded. All the decisions about excluding cells/sessions were made without regard to spatial firing characteristics of the neurons in the given session. Behavioral biases of the rats (e.g., their tendency to run counter clockwise along the periphery, and approach objects in a stereotyped manner on the way in from the periphery) lead to unoccupied pixels near objects seen in many of the rate maps, especially in the sessions that the rats did not forage very well. These pixels often tend to be on the southwest side of the objects. Object-related calculations were performed only if there were at least 15 occupied pixels within a 5-pixel radius of the given object in a particular session. The reasons for the behavioral bias are not known, but because this bias was common to the rats with LEC as well as MEC recordings, it should not affect the comparison of spatial information as well as object-related activity between the two areas. The behavioral correlates of the rats’ interactions with the objects, beyond the purview of the current study, will shed light on the nature of object-related activity seen here.
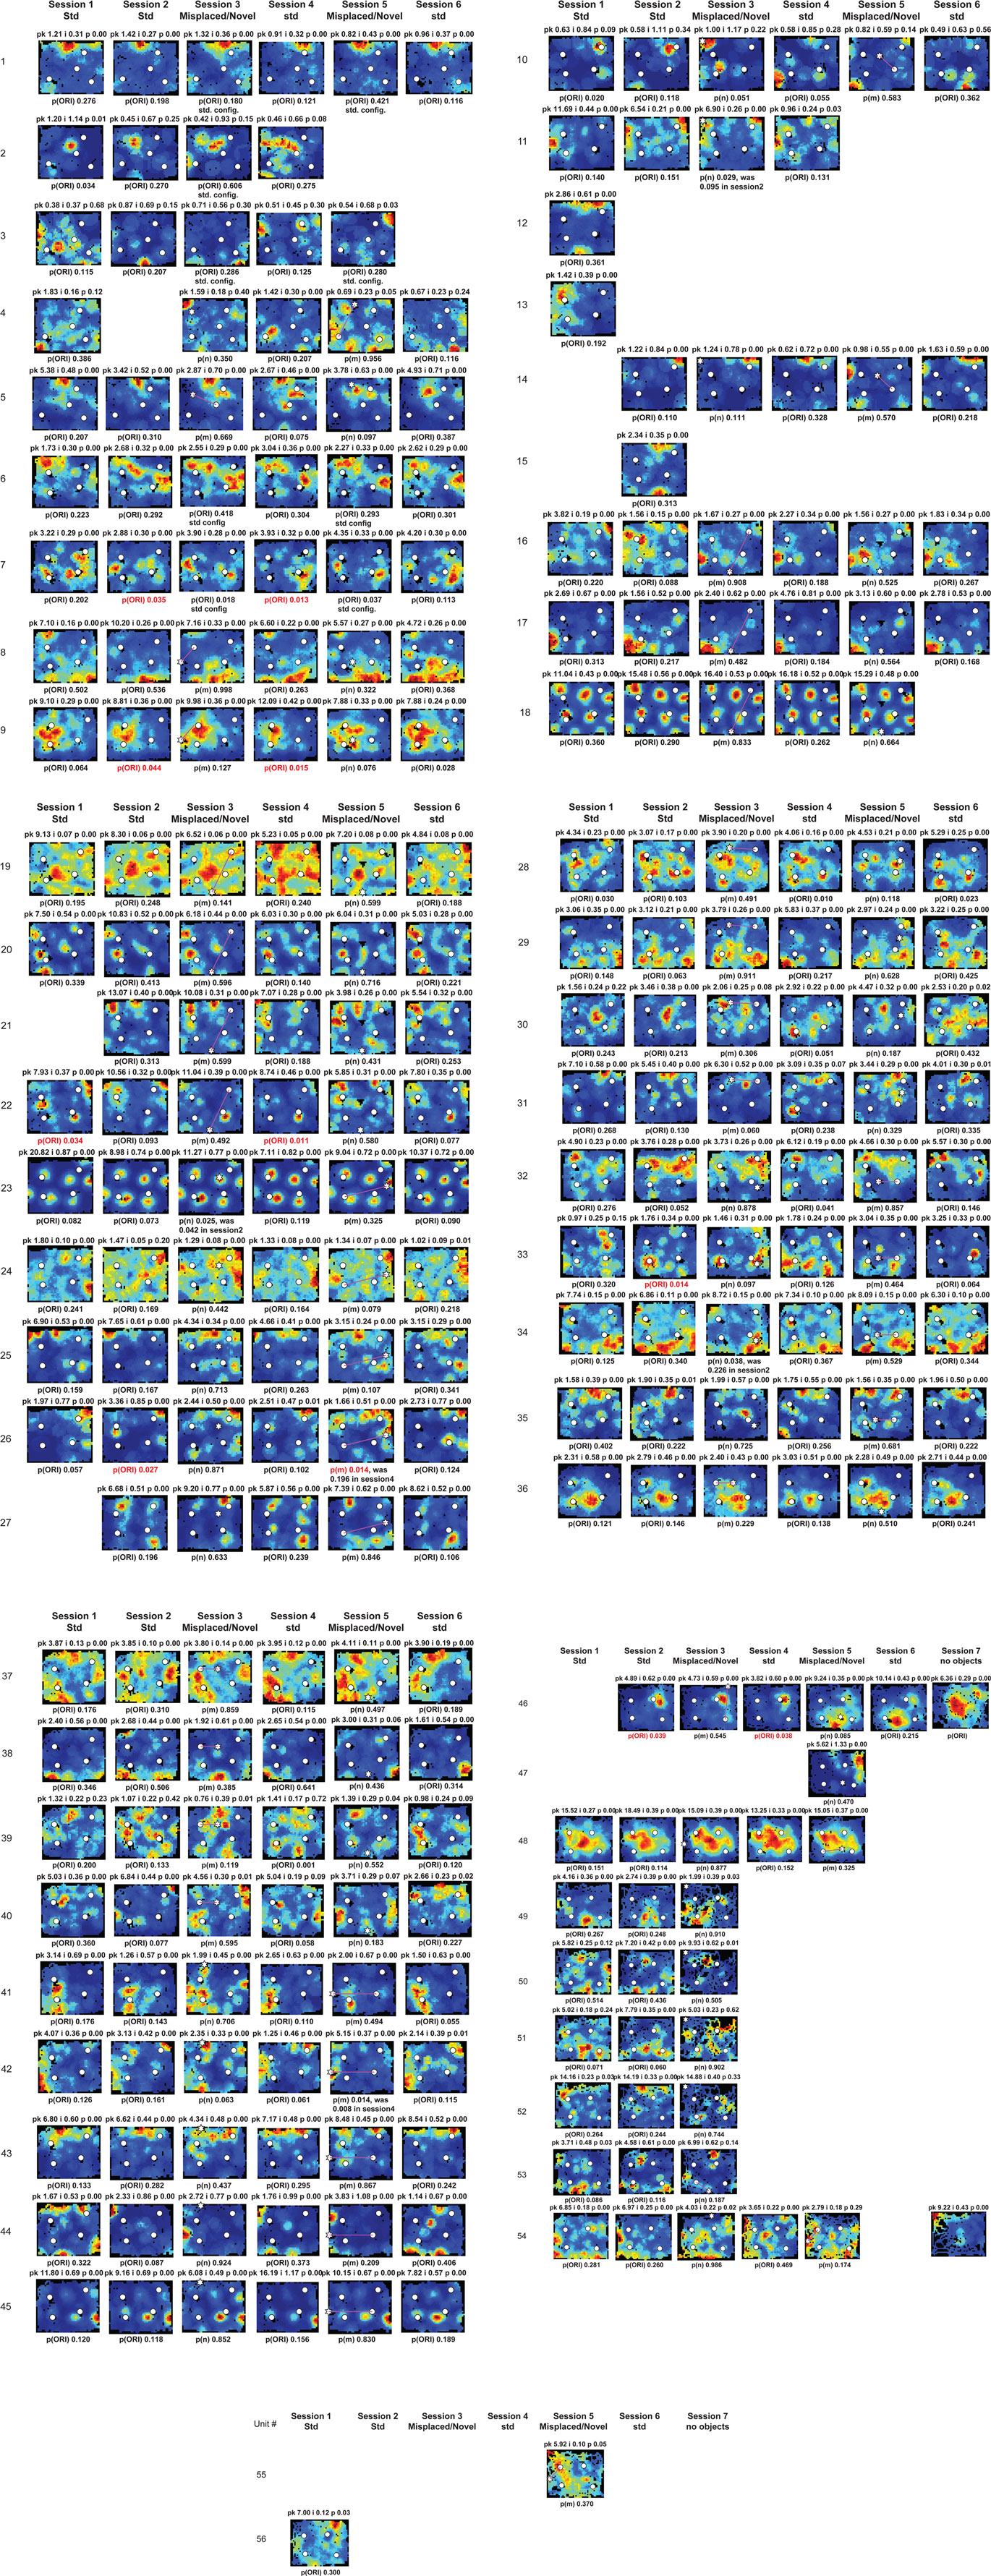
Figure A3. Rate maps of all well-isolated neurons recorded from MEC with >50 spikes in the given session. See Figure A2 caption for details.
Keywords: hippocampus, objects, navigation, memory, medial entorhinal cortex, grid cells
Citation: Deshmukh SS and Knierim JJ (2011) Representation of non-spatial and spatial information in the lateral entorhinal cortex. Front. Behav. Neurosci. 5:69. doi: 10.3389/fnbeh.2011.00069
Received: 22 August 2011; Accepted: 03 October 2011;
Published online: 28 October 2011.
Edited by:
Donald A. Wilson, New York University School of Medicine, USAReviewed by:
Rebecca D. Burwell, Brown University, USAAnne-Marie Mouly, CNRS-Université de Lyon, UMR 5020, France
Copyright: © 2011 Deshmukh and Knierim. This is an open-access article subject to a non-exclusive license between the authors and Frontiers Media SA, which permits use, distribution and reproduction in other forums, provided the original authors and source are credited and other Frontiers conditions are complied with.
*Correspondence: James J. Knierim, Krieger Mind/Brain Institute, Johns Hopkins University, 338 Krieger Hall, 3400 North Charles Street, Baltimore, MD 21218, USA. e-mail: jknierim@jhu.edu