Eye structure, activity rhythms, and visually-driven behavior are tuned to visual niche in ants
 Ayse Yilmaz
 Volkan Aksoy
 Yilmaz Camlitepe1
  Martin Giurfa
- 1Department of Biology, Faculty of Sciences, Trakya University, Edirne, Turkey
- 2Department of Behavioral Physiology and Sociobiology, University of Würzburg, Würzburg, Germany
- 3Research Centre for Animal Cognition, Université de Toulouse, Toulouse, France
- 4CNRS, Research Centre for Animal Cognition, Toulouse, France
Insects have evolved physiological adaptations and behavioral strategies that allow them to cope with a broad spectrum of environmental challenges and contribute to their evolutionary success. Visual performance plays a key role in this success. Correlates between life style and eye organization have been reported in various insect species. Yet, if and how visual ecology translates effectively into different visual discrimination and learning capabilities has been less explored. Here we report results from optical and behavioral analyses performed in two sympatric ant species, Formica cunicularia and Camponotus aethiops. We show that the former are diurnal while the latter are cathemeral. Accordingly, F. cunicularia workers present compound eyes with higher resolution, while C. aethiops workers exhibit eyes with lower resolution but higher sensitivity. The discrimination and learning of visual stimuli differs significantly between these species in controlled dual-choice experiments: discrimination learning of small-field visual stimuli is achieved by F. cunicularia but not by C. aethiops, while both species master the discrimination of large-field visual stimuli. Our work thus provides a paradigmatic example about how timing of foraging activities and visual environment match the organization of compound eyes and visually-driven behavior. This correspondence underlines the relevance of an ecological/evolutionary framework for analyses in behavioral neuroscience.
Introduction
Social insects constitute an established model for the study of visual perception and learning and have contributed important insights into the principles of vision and visual cognition (Menzel and Backhaus, 1991; Dafni et al., 1997; Giurfa and Menzel, 1997; Briscoe and Chittka, 2001; Srinivasan, 2010; Avarguès-Weber et al., 2011; Dyer, 2012; Zhang et al., 2012). Among social insects, ants offer excellent opportunities for cross-species analyses of visual performance and architectures (Menzi, 1987; Greiner et al., 2007; Narendra et al., 2011), due to their high ecological diversity and species-richness (Hölldobler and Wilson, 1990). Ant species may differ in their visual niches and light conditions and thus experience different selective pressures on their visual systems. As a consequence, their compound eyes may exhibit adaptations to specific life styles (Greiner et al., 2007; Narendra et al., 2011) where trade-offs between spatial resolution and sensitivity are expected (Kirschfeld, 1976; Land, 1997). These trade-offs may, in turn, affect visually-driven behaviors.
We studied two sympatric ant species in the northwest of Turkey, which possess apposition eyes but differ in the characteristics of their visual environments: Formica cunicularia ants are considered to be diurnal, while Camponotus aethiops ants are reported to be rather crepuscular and nocturnal (Figure 1A). Diurnal ants foraging for food during daylight hours are not confronted with limited light. Crepuscular and nocturnal ants, on the contrary, are subjected to the problem of seeing at low levels of illumination and may sacrifice visual accuracy in order to capture more light (Warrant and McIntyre, 1990; Land, 1997). To test these hypotheses using F. cunicularia and C. aethiops as models, we quantified their behavioral rhythms, performed an analysis of their eye parameters, and studied their visual pattern discrimination in controlled laboratory conditions. We provide in this way an integrative analysis of the interplay between visual niche, lifestyle (Land, 1997; Van Hateren, 1997), morphological variations in eye organization (Land and Fernald, 1992; Warrant and McIntyre, 1993), and visual discrimination capacities.
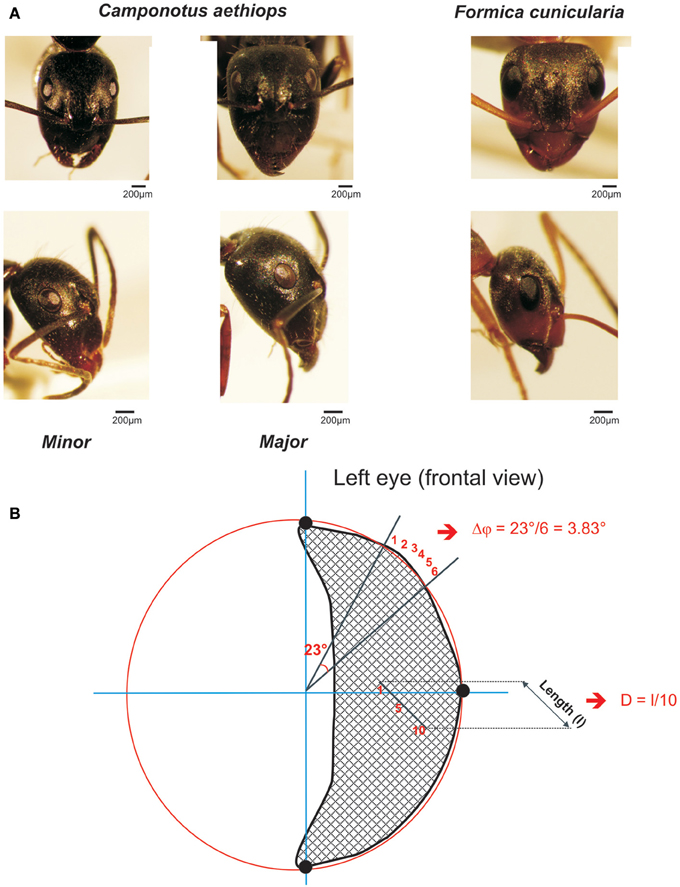
Figure 1. The two sympatric ant species used in this study. (A) Frontal (upper row) and lateral views (lower row) of the heads and compound eye of Camponotus aethiops majors and minors and Formica cunicularia. The scale is indicated in each case. (B) Drawing of a frontal view of a left compound eye to illustrate the calculation procedure for the interommatidial angle (Δφ) and the ommatidial diameter. Using the Image J software, three points (black dots) were defined on the outer visible perimeter of the eye and a circle (in red) was drawn to connect them. Two lines, one horizontal and the other vertical (in blue), that ran through the center of the circle were also drawn. In this figure the interommatidial angle (Δφ) was calculated by dividing the angle of 23° defined by two lines (black) going from the perimeter to the center of the eye by the number of ommatidia (6) on the perimeter section (i.e., Δφ = 3.83 ° in this example). The ommatidial diameter was measured by drawing and measuring the length (l) of a line going through a row of 10 ommatidia and dividing that length by 10, the number of ommatidia crossed.
Materials and Methods
Activity Rhythms
We monitored visually the activity rhythms of two sympatric nests, one of F. cunicularia and the other of C. aethiops. Both were located in the Güllapoğlu Arboretum of Trakya University, Edirne, Turkey (latitude: 41° 40′ 0" N, longitude: 26° 34′ 0" E). After defining an imaginary circle of 25-cm diameter around each nest entrance, we counted inbound and outbound worker ants on a 20 h basis (from 5:00 AM to 01:00 AM of the next day) during 10 days (May 2011). Counting of ants was performed during intervals of 3 min for F. cunicularia, and of 5 min for C. aethiops (owing to their lower activity), with 2 h spacing between consecutive measurements (11 measurements per day in total). In the case of the latter species, which is polymorph, separated counting was performed for minor- and major workers. Due to the short counting period, our goal was to provide a snapshot of the ants' activity in terms of the number of individuals present in the counting area at a given time of the day.
Temperature and illumination were measured in parallel at the nest entrances using a digital thermometer (RMR202, Oregon Scientific, Neotech Teknolojik Ürünler Dağıtım A.Ş., Turkey) and a digital light-meter (CHY-332; Centenary Materials, Taiwan), respectively.
Allometry and Eye Structure
We measured the length and width of the compound eyes (Cl and Cw, respectively) and the length of the thorax (Thl) (both in mm) in F. cunicularia and in majors and minors of C. aethiops. Compound eye structure was characterized by means of corneal replicas obtained from a thin layer of nail polish applied to the eye (Narendra et al., 2011). After drying, the polish was removed and photographed under light microscope (Olympus BH-02) equipped with a digital camera (Progress C12 Laser Optic System). Images were then digitized in a computer for quantification of the total number of ommatidia (TO), which was obtained from a direct count on a lateral view of the eye (Narendra et al., 2013). The total surface of the compound eye (A, μm2) was calculated using the formula for the area A of an ellipse with length Cl and width Cw (Moser et al., 2004) as:
To this end, length Cl and width Cwof the compound eye were measured using the Image J software (National Institute of Mental Health, Bethesda Maryland, USA).
To quantify the mean interommatidial angle (Δφ), which describes the cornea sampling density and the mean ommatidial diameter (D) (μm), which provides a measure of the sensitivity to light (Land, 1997), we used frontal photographs of compound eyes (examples frontal views are shown in Figure 1A, upper row). On these photographs, Image J software allowed us to define three points on the outer visible perimeter of each eye (left or right) and draw a circle that connected them (see example in Figure 1B: the three black dots are connected by the red circle line). The perimeter of this circle included the eye's outer perimeter (Figure 1B). Two lines, one horizontal, and the other vertical, which ran through the center of the circle were drawn (see blue axes in Figure 1B).
To calculate the interommatidial angle (Δφ), we measured the number of ommatidia on the perimeter section comprised between two lines going from the perimeter to the center of the eye; the angle between these two lines was established and the interommatidial angle was obtained by dividing the angle yielded by the software by the number of ommatidia on the perimeter section (Döring and Spaethe, 2009; see Figure 1B). The mean interommatidial angle was obtained for each ant after repeating three times this calculation in different areas of the compound eye that were chosen randomly.
The ommatidial diameter was measured by drawing and measuring a line going through a row of 5–10 ommatidia in the horizontal or the vertical plane, and dividing that length by the number of ommatidia crossed (see Figure 1B). The mean ommatidial diameter was obtained for each ant after repeating three times this calculation in different areas of the compound eye that were chosen randomly.
In addition, the eye parameter (P), which allows examining the trade-off between sensitivity and resolution of a compound eye (Snyder, 1979), was obtained by multiplying the mean interommatidial angle (Δφ) by the mean ommatidial diameter (D)(Snyder, 1979) as:
Visual Discrimination Learning
We used an appetitive conditioning protocol to assess visual-stimulus discrimination in both ant species. In the case of C. aethiops, only minors were used in these experiments because they engage more in foraging activities than majors (Laffort et al., 1991; see Figure 2B).
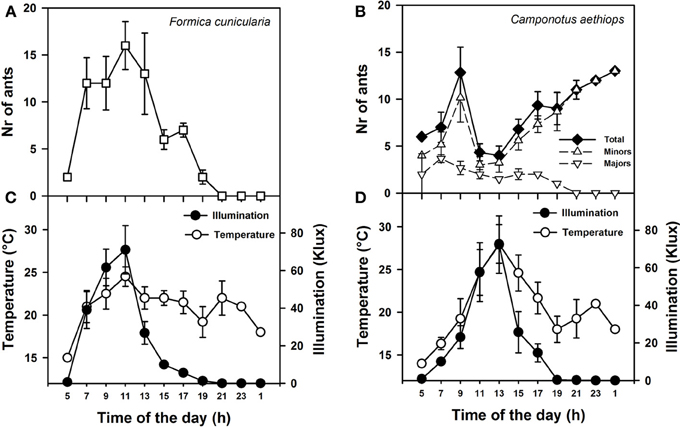
Figure 2. Activity rhythms of F. cunicularia and C. aethiops as a function of environmental daylight and temperature. (A) Activity rhythm of F. Cunicularia. (B) Activity rhythms of C. aethiops majors, minors and the sum of both (Total) are shown. (C) Temperature and daylight illumination measured in the immediate surroundings of F. cunicularia nest. (D) Temperature and daylight illumination measured in the immediate surroundings of C. aethiops nest.
Colonies were transferred to the laboratory with their original nest material and placed in plastic containers under constant laboratory conditions (50% relative humidity, 23–25°C, and 12 h/12 h light-dark regimen). Silicon pipes connected each nest to a feeding box, which the ants could freely visit. Diluted honey and dead insects were provided as carbohydrate and protein sources. Honey was removed from the box one month before the experiments to ensure high motivation for foraging.
Experimental setup
Marked ants were trained individually to enter a Plexiglas® Y-maze (Figure 5A) to collect 25% (weight/weight) sucrose solution (2 μl) on a rewarding visual stimulus that had to be discriminated from another visual stimulus punished with 5% quinine solution (2 μl). Both kinds of reinforcements have been shown to induce successful differential conditioning in ants learning olfactory discriminations in a similar maze (Dupuy et al., 2006; Josens et al., 2009). During training, the rewarded and punished stimuli were swapped pseudo-randomly between the arms of the maze to prevent ants from forming a side preference, using odor cues or to prevent room cues from playing any role in the ants' choice (Harris et al., 2005; Dupuy et al., 2006; Josens et al., 2009). Only one ant was present in the maze at a time. Solutions were provided on transparent plastic pieces (1 × 2 cm) that were adjacent to visual stimuli. All three arms of the maze were 20 cm long, with a 4 × 4 cm cross section. Once the experimental ant entered in the maze, it had to choose between two arms that formed an angle of 120° at the decision point. The maze walls were made from black opaque acrylic mounted on a white Plexiglas® plate. The maze had no ceiling. Illumination was provided by a D65 lamp (6500 K) similar in spectrum to sunlight and yielding an overall intensity of 1600 lux at the maze level, which corresponds to a partially overcast day (1000–2000 lux). Experiments were performed at a time of the day when appetitive behavior of both species was comparable.
Visual stimuli
Ants were trained to discriminate two small-field and two large-field visual stimuli. The former consisted of small black triangles (4 cm height and 4 cm base), one pointing upward and the other pointing downward, presented on a white background. Triangles were placed at a distance of 4.5 cm from the decision point of the maze and subtended a visual angle (vertical extent) of 47.9° at the decision point. The large-field stimuli were two large black-and-white gratings (35 × 40 cm), one horizontal, and the other vertical, which exceeded the extent of the maze back walls and were placed 20 cm from the decision point of the maze. Gratings had stripes 8 cm in width, each subtending a visual angle of 20.61°; an entire pattern subtended 82 × 90°. Although the ants did probably not perceive the whole pattern extent due to the presence of the lateral maze walls, they could definitely extend their visual sampling beyond the cross section of an arm's maze due to the absence of ceiling. As a consequence, even with limitations, the gratings offered a much larger area than the small triangles. Prior experiments with ants making visual discriminations in a maze have also used large-field patterns, which can be well-discriminated (Harris et al., 2005; Riabinina et al., 2011). Gratings were randomly shifted from visit to visit to prevent the exclusive learning of local cues. Horizontal gratings were shifted randomly upward and downward while vertical gratings were shifted rightward and leftward; in this way ants had to discriminate between either two white or two black areas on the back walls, thus forcing them to extend their visual sampling beyond the maze. Gratings also could be positioned with a half period centered on either back wall, thus displaying a vertical edge in one arm and a horizontal edge in the other arm.
Pre-training and training procedures
During a pre-training phase, ants were individually familiarized with the setup during four visits in which they learned to collect a drop of sucrose solution placed at the entrance arm, at the decision point (intersection of both lateral arms), and at each of the lateral arms of the maze in the absence of visual stimuli (Dupuy et al., 2006; Josens et al., 2009). Motivated ants that returned to the setup in less than 3–4 min were conserved for the training phase, which consisted of 18 consecutive visits to the maze (trials). Thus, the interval between consecutive training trials varied between 2 and 4 min. The 18 trials were grouped into three blocks of six trials each, in order to analyze the learning performance during the training. Based on the first choice performed within each training trial, an acquisition curve was established, which shows the proportion of correct choices along three consecutive training blocks.
During training, visual stimuli were associated with their respective reinforcement and swapped pseudo-randomly between visits (see above). Experiments were balanced with respect to the association between a visual stimulus and a positive/aversive reinforcement. For each ant, the whole procedure (pre-training and training) lasted usually 2–3.5 h and took place always in the same day.
Results
Activity Rhythms
We first monitored daily activity rhythms of F. cunicularia and C. aethiops in natural conditions. Weather temperature and illumination were recorded in parallel at both nest entrances. Figures 2A,B shows the mean activity rhythms (± S.E.) of F. cunicularia and C. aethiops (including the total number of ants and majors and minors, separately). While F. cunicularia started its activity early in the morning, between 05:00 and 06:00 h (Figure 2A), C. aethiops was already active at this time of the day (Figure 2B). C. aethiops majors had a relatively constant and low level activity throughout the day. In the case of F. cunicularia and C. aethiops minors, activity increased during the morning, but peaks of activity differed: while F. cunicularia exhibited maximal activity around 12:00 h, C. aethiops minors reached a maximum around 10:00 AM, after which activity dropped significantly. Thus, at the time when F. cunicularia was most active, which corresponded to a great increase in illumination levels (Figures 2C,D), C. aethiops minors were less active. Activity of F. cunicularia decreased progressively in the afternoon (from 15:00 to 20:00 h) while that of C. aethiops minors increased and extended beyond twilight into the night (from 20:00 to 01:00 h), during which higher numbers of ants were recorded (Figure 2B). At that time no C. aethiops majors were observed; yet the fact that some majors were found already at 05:00 h suggests that their activation occurred earlier, during the last hours of the night.
Thus F. cunicularia exhibited a diurnal activity rhythm that was significantly and positively correlated both with illumination (Figure 2C; Spearman rank correlation: ρ = 0.84; p < 0.0001) and temperature (Figure 2C; ρ = 0.38; p < 0.05). On the contrary, C. aethiops minors displayed a rhythm that was significantly and negatively correlated with illumination (Figure 2D; ρ = −0.59; p < 0.05) but not with temperature (Figure 2D; ρ = −0.21; NS). In the case of C. aethiops majors, the opposite trend was found: activity did not correlate with illumination (Figure 2D; ρ = 0.22; NS) but was inversely and significantly correlated with temperature (Figure 2D; ρ = −0.32; p < 0.05). Thus, whilst C. aethiops minors performed their activities during periods of lower illumination, majors were more active during periods of lower temperature. The fact that the activity of C. aethiops minors (and to a lesser extent of C. aethiops majors) occurred within both the light and dark portions of the day allows describing their rhythm as cathemeral (Tattersall, 1987). The segregated pattern of activity of both sympatric species may have evolved to avoid competition.
Allometry and Eye Structure
We obtained morphometric measurements from both ant species. Measurements were taken separately for majors and minors of C. aethiops given their important allometric differences (Figure 1A). Such differences are absent in F. cunicularia. We used thorax length (Thl) as a measure of ant size and showed that the groups differed significantly [One-factor ANOVA: Thl: F(2,27) = 93.77; p < 0.0001]. F. cunicularia ants had a significantly shorter thorax than both majors and minors of C. aethiops (Tukey test; p < 0.05 for both comparisons). C. aethiops minors, on the other hand, had a shorter thorax than C. aethiops majors (p < 0.001).
The surface area of compound eyes also varied significantly among the three ant groups [F(2,27) = 28.39, p < 0.0001]. It was significantly larger in C. aethiops majors, smaller in minors, and of intermediate size in F. cunicularia ants (p < 0.05 for all comparisons). Figure 3A shows the relationship between eye area and thorax length, the parameter used to characterize ant size. Eye area increased with thorax length in F. cunicularia (r = 0.73, p < 0.05) and C. aethiops minors (r = 0.91, p < 0.001) but not for C. aethiops majors (r = 0.16, p = 0.66). Figure 3B shows the relationship between the number of eye facets and thorax length. The number of facets increased significantly with thorax length in F. cunicularia (r = 0.90, p < 0.0001) and C. aethiops minors (r = 0.79, p < 0.005) but not in C. aethiops majors (r = 0.20, p = 0.60).
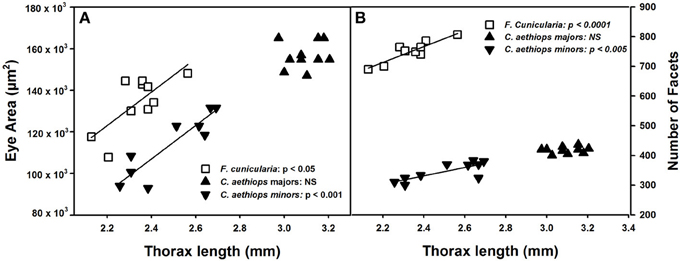
Figure 3. Eye area (μm2) and number of facets as functions of thorax length (mm). (A) Eye area increased significantly with thorax length in F. cunicularia and C. aethiops minors but not in C. aethiops majors. (B) The number of eye facets increased significantly thorax length in F. cunicularia and C. aethiops minors but not in C. aethiops majors. NS, not significant.
We then referred facet number to the area of the compound eye (μm2) in order to obtain an estimate of the resolution of the compound eyes in the three ant groups (Figure 4A). Ants differed significantly in the number of facets per unit area (μm2) of compound eye [F(2,27) = 299.66; p < 0.0001]. F. cunicularia had significantly more facets per unit area of compound eye than both C. aethiops major and minors (p < 0.001 for both comparisons); C. aethiops minors had a significantly higher number of facets per unit area than majors (p < 0.05).
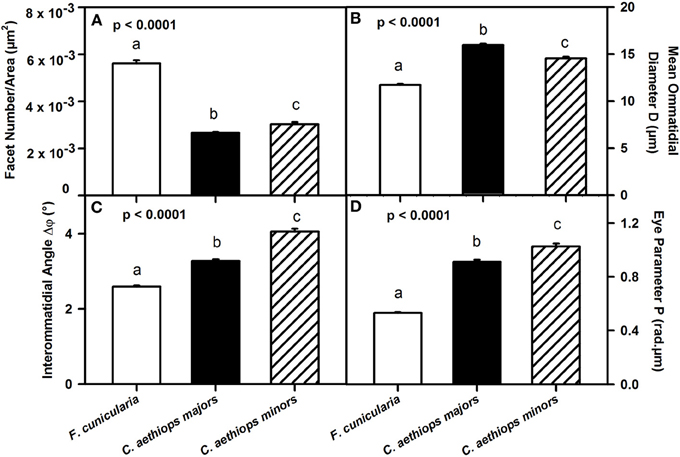
Figure 4. Comparative analysis of eye parameters between F. cunicularia and C. aethiops majors and minors. Different letters indicate significant differences. (A) Number of ommatidial facets per area (μm2) of compound eye, which provides an estimate of compound eye resolution. F. cunicularia exhibited significantly more facets per unit area of compound eye than both C. aethiops major and minors (p < 0.001 for both comparisons); C. aethiops minors had in turn a significantly higher number of facets per unit area than majors (p < 0.05). (B) Facet diameter (D) (μ m) differed significantly between the three groups of ants. It was smaller in F. cunicularia, intermediate in C. aethiops minors and larger in C. aethiops majors. All values differed significantly from each other (p < 0.001). (C) Interommatidial angle Δφ(°), which provides a measure of compound eye resolution and sampling density. F. cunicularia ants exhibit smaller interommatidial angles and thus highest resolution, while C. aethiops majors exhibit intermediate angles and thus intermediate resolution, and C. aethiops minors larger angles and thus lowest resolution. All values differed significantly from each other (p < 0.001). (D) Eye parameter P (rad.μm), which provides a measure of the sensitivity of insect eyes; F. cunicularia ants had smaller P-values, C. aethiops minors had larger P-values and C. aethiops majors had intermediate values. All three values differed from each other (p < 0.001).
To provide a finer analysis of the eye structure in the three groups of ants, we focused on the ommatidial diameter (D) and the interommatidial angle (Δφ) (see Figure 1B). The ommatidial diameter varied significantly between the three groups of ants [Figure 4B: F(2,107) = 201.52, p < 0.0001]. Specifically, F. cunicularia ants had smaller ommatidial diameters (11.72 μm ± 0.10), C. aethiops majors, larger diameters (15.95 μm ± 0.13) and C. aethiops minors intermediate values (14.53 μm ± 0.19)(Tukey test; p < 0.001 for all three comparisons).
Interommatidial angles Δφ also provide a measure of compound eye resolution and sampling density (the smaller the interommatidial angle, the higher the potential resolution and sampling density of the compound eye). The three groups of ants differed significantly in Δφ [Figure 4C: F(2,114) = 175.32, p < 0.0001], with F. cunicularia ants exhibiting smaller interommatidial angles (2.59° ± 0.03), C. aethiops majors intermediate angles (3.27° ± 0.05) and C. aethiops minors larger angles (4.05° ± 0.08). All values differed significantly from each other (p < 0.001 for all comparisons).
The eye parameter (P), which allows examination of the trade-off between sensitivity and resolution of a compound eye (Snyder, 1979), was obtained for all three groups of ants by multiplying the interommatidial angle value (Δφ) by the diameter of a single ommatidium (D). P varied significantly between ant groups [Figure 4D: F(2,114) = 265.68; p < 0.0001]. F. cunicularia ants had smaller P-values (0.53 μm.rad ± 0.008), C. aethiops minors had larger P-values (1.03 μm.rad ± 0.02) and C. aethiops majors had intermediate values (0.91 μm.rad ± 0.02) but which were nevertheless close to those of C. aethiops minors. All values differed significantly from each other (p < 0.001 for all comparisons).
Visual-Discrimination Performance
In a first visual-discrimination problem, ants were trained to discriminate two small-field black triangles, one pointing upward and the other pointing downward (Figure 5A). No difference in performance was found between the two groups of F. cunicularia ants conditioned to choose either the upright triangle or the inverted triangle as rewarded stimulus [F(1,10) = 1.82; p = 0.21] so that results were pooled and treated as a single group (Figure 5C). F. cunicularia ants learned to discriminate the two triangles during the three blocks of training [F(2,22) = 4.52; p < 0.03], in particular from the second to the third block of trials (Tukey test: p < 0.03). On the contrary, C. aethiops trained with the same discrimination problem, and whose results could also be pooled [F(1,10) = 0.00; p = 0.99], were incapable of learning this discrimination under the same experimental conditions [Figure 5C: F(2,22) = 0.21; p = 0.82]. As a consequence, the performance of both species differed significantly in this discrimination task [F(1,22) = 29.01; p < 0.0001]. Increasing the number of conditioning trials in the case of C. aethiops did not yield any improvement in discrimination (not shown).
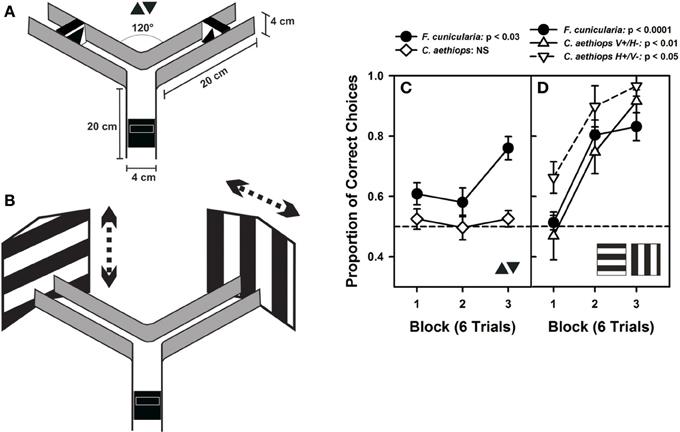
Figure 5. Visual performances of F. cunicularia and C. aethiops. (A) The Plexiglas Y-maze used for visual discrimination learning in ants. The maze presents the two small-field visual stimuli that ants had to learn to discriminate, a small black triangle pointing upward and another black triangle pointing downward, both presented on a white background. (B) Visual discrimination learning of two large-field visual stimuli in the form of two large black-and-white gratings, one horizontal and the other vertical, which exceeded the extent of the maze back walls. Gratings had stripes 8 cm in width and were randomly shifted (see dashed arrows) from visit to visit to prevent the exclusive learning of local cues. (C) Visual-discrimination learning of the two small-field visual stimuli. Proportion of correct choices along three consecutive blocks of six trials. F. cunicularia ants learned the visual discrimination while C. aethiops ants did not. (D) Visual discrimination learning of the two large-field visual stimuli. Proportion of correct choices along three consecutive blocks of six trials. Both ant species learned the visual discrimination. C. aethiops ants learned significantly better the discrimination in which the horizontal grating was rewarded and the vertical grating was non-rewarded than the reversed situation so that both experimental situations appear differentiated.
In a second discrimination problem, ants were trained to discriminate two large-field patterns whose extent surpassed largely the limits of the maze (Figure 5B); the patterns consisted of two large black and white gratings, one vertical, and the other horizontal. Gratings were shifted randomly from visit to visit to force ants to focus on global and not local cues. Vertical gratings were shifted either left- or rightward while horizontal gratings were shifted up- or downward. F. cunicularia ants behaved similarly irrespective of whether the rewarded grating was horizontal or vertical [F(1,10) = 1.34; p = 0.27], so that results of both subgroups were pooled and treated as a single group. F. cunicularia ants learned to discriminate the two large stimuli during the three blocks of training [Figure 5C: F(2,22) = 21.50; p < 0.0001]. C. aethiops ants showed differences depending on whether the vertical or the horizontal grating was rewarded [F(1,9) = 18.09; p < 0.03], so that their results were not pooled. In particular, discrimination learning was better when the rewarded pattern was the horizontal grating (Figure 5C). Despite this difference, both subgroups of C. aethiops learned the discrimination between the two large-field stimuli during the three blocks of training [Figure 5C: vertical rewarded/horizontal non-rewarded: F(2,10) = 8.46; p < 0.01; horizontal rewarded/vertical non-rewarded: F(2,8) = 8.14; p < 0.05]. Thus, all three groups (F. cunicularia and the two subgroups of C. aethiops) learned efficiently to discriminate the vertical from the horizontal edge patterns; discrimination was better in C. aethiops trained with the horizontal grating rewarded [F(2,20) = 5.09; p < 0.05].
Discussion
Our findings highlight the adaptive interplay between the optic properties of the compound eye, the visual environments, and circadian activity, and the visual-discrimination capabilities of ants. Diurnal F. cunicularia ants exhibit high optic resolution based on more ommatidia, smaller facet diameter, smaller interommatidial angles, and a small P parameter value. These features enabled them to learn both small-field and large-field pattern discriminations. By contrast, C. aethiops minor ants, which are active during twilight and night and thus exhibit an inverse correlation between their activity and illumination levels (Figure 2), favor light capture and exhibit larger interommatidial angles and a higher P parameter value, consistently with optic strategies of other nocturnal insects (McIntyre and Caveney, 1998; Warrant et al., 2004; Greiner, 2006; Somanathan et al., 2009). As a consequence, these ants only learned large-field but not small-field pattern discriminations. In C. aethiops majors, we found higher facet diameters and intermediate interommatidial angles and P-value (Figure 4). These intermediate values may result from the compromise between a larger body size and a low level of activity outside the nest, which determined a lack of correlation between activity and illumination (Figure 2). Due to this low activity, and the impossibility of ensuring a high appetitive motivation, the visual discrimination performances of C. aethiops majors were not quantified in this work.
The optical differences found between F. cunicularia and minors of C. aethiops, which reflect their differences in activity and visual niche, are consistent with results on optical specializations of compound eyes in diurnal and nocturnal insects. For instance, in a study on 15 different Apoidea species, nocturnal foraging bees had larger compound eyes and facets than diurnal ones (Jander and Jander, 2002). Similar results were found in ants: in a study on the relationship between the timing of nuptial flights of 10 species of leaf-cutter ants Atta sp. and the morphometry of their compound eyes, species flying during the night had significantly larger facets than species flying during the day (Moser et al., 2004). Also, in four congeneric sympatric species of Myrmecia ants, eye area, facet size and facet numbers increased from day- to night active species (Narendra et al., 2011).
Although larger insects usually benefit from a high spatial resolution acquired through a higher number of ommatidia and smaller interommatidial angles (Spaethe and Chittka, 2003; Kelber et al., 2006; Somanathan et al., 2009), the specializations imposed by diurnal/nocturnal life styles may modify this trend. For instance, the smaller and diurnal F. cunicularia ants had the highest spatial resolution (smaller interommatidial angles; see Figure 4C) consistently with their finer pattern-discrimination capabilities (Figure 5C). On the contrary, cathemeral C. aethiops sacrificed resolution (larger interommatidial angles; see Figure 4C) in favor of light capture (see Figure 4B for ommatidial diameter). Similar trends were found in sympatric species of Myrmecia, where the purely day active M. croslandi had the smallest facet lens, followed by the diurnal/crepuscular M. tarsata, while lens diameter was largest in the crepuscular/nocturnal species M. nigriceps and M. pyriformis (Greiner et al., 2007).
The trade-off between sensitivity and resolution of a compound eye is usually evaluated by means of the eye parameter P, which relates the mean interommatidial angle (Δφ) and the mean ommatidial diameter (D) (Snyder, 1979). Diurnal insects active in bright light usually exhibit smaller P-values reflecting an optimization of visual resolution. The fact that F. cunicularia ants, active at highest light intensities, presented the lowest P-values (0.53 μm.rad) is consistent with this trend. P-values predicted for nocturnal insects are higher (greater than 2 μm.rad; see Snyder, 1979). In our case, C. aethiops ants exhibited lower P-values of 1.03 and 0.91 μm.rad for minors and majors, respectively, which may be related to the fact that these insects were not purely nocturnal but distributed their activities during night and day.
As mentioned above, optic differences have been reported for other sympatric insect species that are phylogenetically related and that have adopted different lifestyles (Greiner et al., 2007; Gonzalez-Bellido et al., 2011; Narendra et al., 2011). Yet, here we show for the first time that these differences translate into distinct visual discrimination performances when insects are tested in a common experimental design in controlled laboratory conditions (Figure 5). Small-field visual stimuli, for which shape discrimination and thus local sampling of pattern details are necessary, was achieved by the diurnal F. cunicularia owing to its better optic resolution, and not by the cathemeral C. aethiops minors. However, when visual discrimination involved large-field visual stimuli (the large contrasting gratings employed in our experiments), both species were capable of mastering the discrimination. Despite a lower optic resolution, C. aethiops minors can use their increased light sensitivity to distinguish between differently oriented large-extent black and white areas and thus achieve the discrimination task. Differences in illumination, which are normally experienced by these species owing to their different activity rhythms, were ruled out in these experiments as insects were all studied under the same intermediate light conditions. Thus, the differences in discrimination power exhibited by F. cunicularia and C. aethiops were intrinsically determined by the properties of their respective visual systems. These differences did neither result from environmental factors nor from differences in motivation/circadian activity, as experiments were performed at times of the day in which levels of activity were comparable for both species.
Our work highlights the complex interactions that exist between visual niche exploitation, circadian activity, compound-eye structure, and visual-discrimination capabilities. Additional factors also might be similarly adapted to visual niche and light conditions; for instance, screening-pigment physiology within ommatidia, as well as phototransduction speed or crosstalk between photoreceptors within an ommatidium, could also evolve to optimize information processing and adaptive responses to ecological demands (Gonzalez-Bellido et al., 2011). In day-active ants, radial migration of retinula cell screening pigments has been reported as a light adaptation mechanism in which the pigments surround the rhabdom in the light-adapted state and move away from the rhabdom in the dark-adapted state (Brunnert and Wehner, 1973). Such a mechanism could be available in F. cunicularia. The case of C. aethiops could be more similar to that of the Australian intertidal ant Polyrhachis sokolova, which is active during low tides at both day and night and thus experiences a wide range of light intensities. A recent study on this species has shown that it has developed an extreme pupillary mechanism during which the primary pigment cells constrict the crystalline cone to form a narrow tract of 0.5 μm wide and 16 μm long. This pupillary mechanism protects the photoreceptors from bright light, making the eyes less sensitive during the day (Narendra et al., 2013; see also Menzi, 1987). A similar mechanism may be available in C. aethiops ants, which also face a wide range of light intensities due to their cathemeral activity rhythm. Furthermore, nocturnal ants have typically large rhabdoms, which increase the amount of photons that can be captured, thus increasing visual sensitivity under low illumination (Greiner et al., 2007); it is, therefore, possible that C. aethiops ants possess rhabdoms that are larger than those of F. cunicularia to cope for the dim light conditions under which the former, but not the latter, are active. Moreover, visual processing at the central level (i.e., temporal and spatial integration) also could differ between sympatric species in order to cope efficiently with the visual environment.
All in all, our results reveal the sophisticated interplay between compound-eye optics, visual niche, activity rhythms, and visual discrimination capabilities in ants. They reaffirm that behavioral and morphological traits respond to ecological pressures and lifestyle and underline the relevance of an ecological/evolutionary framework for analyses in behavioral neurosciences.
Conflict of Interest Statement
The authors declare that the research was conducted in the absence of any commercial or financial relationships that could be construed as a potential conflict of interest.
Acknowledgments
We thank two anonymous reviewers, J. G. Hildebrand (Tucson) and J. Spaethe (Würzburg) for valuable comments and corrections on previous version of the manuscript. This study was supported by a Turkish (TUBITAK)—French (EGIDE) cooperation program “PIA Bosphorus 109T588.” Martin Giurfa thanks the Institut Universitaire de France, the French Research Council (CNRS), the University Paul Sabatier of Toulouse and the French National Research Agency (project MINICOG) for support.
References
Avarguès-Weber, A., Deisig, N., and Giurfa, M. (2011). Visual cognition in social insects. Annu. Rev. Entomol. 56, 423–443. doi: 10.1146/annurev-ento-120709-144855
Briscoe, A. D., and Chittka, L. (2001). The evolution of color vision in insects. Annu. Rev. Entomol. 46, 471–510. doi: 10.1146/annurev.ento.46.1.471
Brunnert, A., and Wehner, R. (1973). Fine-structure of light-adapted and dark-adapted eyes of desert ants, Cataglyphis bicolor (Formicidae, Hymenoptera). J. Morphol. 140, 15–29. doi: 10.1002/jmor.1051400103
Dafni, A., Lehrer, M., and Kevan, P. G. (1997). Spatial flower parameters and insect spatial visions. Biol. Rev. 72, 239–282. doi: 10.1017/S0006323196005002
Döring, T. F., and Spaethe, J. (2009). Measurements of eye size and acuity in aphids (Hemiptera: Aphididae). Entomol. Gen. 32, 77–84. doi: 10.1127/entom.gen/32/2009/77
Dupuy, F., Sandoz, J. C., Giurfa, M., and Josens, R. (2006). Individual olfactory learning in Camponotus ants. Anim. Behav. 72, 1081–1091. doi: 10.1016/j.anbehav.2006.03.011
Dyer, A. G. (2012). The mysterious cognitive abilities of bees: why models of visual processing need to consider experience and individual differences in animal performance. J. Exp. Biol. 215, 387–395. doi: 10.1242/jeb.038190
Giurfa, M., and Menzel, R. (1997). Insect visual perception: complex abilities of simple nervous systems. Curr. Opin. Neurobiol. 7, 505–513. doi: 10.1016/S0959-4388(97)80030-X
Gonzalez-Bellido, P. T., Wardill, T. J., and Juusola, M. (2011). Compound eyes and retinal information processing in miniature dipteran species match their specific ecological demands. Proc. Natl. Acad. Sci. U.S.A. 108, 4224–4229. doi: 10.1073/pnas.1014438108
Greiner, B. (2006). Visual adaptations in the night-active wasp Apoica pallens. J. Comp. Neurol. 495, 255–262. doi: 10.1002/cne.20882
Greiner, B., Narendra, A., Reid, S. F., Dacke, M., Ribi, W. A., and Zeil, J. (2007). Eye structure correlates with distinct foraging-bout timing in primitive ants. Curr. Biol. 17, R879–R880. doi: 10.1016/j.cub.2007.08.015
Harris, R. A., Hempel De Ibarra, N., Graham, P., and Collett, T. S. (2005). Ant navigation: priming of visual route memories. Nature 438:302. doi: 10.1038/438302a
Hölldobler, B., and Wilson, E. O. (1990). The Ants. (Berlin, Heidelberg: Springer). doi: 10.1007/978-3-662-10306-7
Jander, U., and Jander, R. (2002). Allometry and resolution of bee eyes (Apoidea). Arthr. Struct. Dev. 30, 179–193. doi: 10.1016/S1467-8039(01)00035-4
Josens, R., Eschbach, C., and Giurfa, M. (2009). Differential conditioning and long-term olfactory memory in individual Camponotus fellah ants. J. Exp. Biol. 212, 1904–1911. doi: 10.1242/jeb.030080
Kelber, A., Warrant, E. J., Pfaff, M., Wallen, R., Theobald, J. C., Wcislo, W. T., et al. (2006). Light intensity limits foraging activity in nocturnal and crepuscular bees. Behav. Ecol. 17, 63–72. doi: 10.1093/beheco/arj001
Kirschfeld, K. (1976). “The resolution of lens and compound eyes,” in Neural Principles in Vision, eds F. Zettler and R. Weiler (Berlin, Heidelberg: Springer), 354–370. doi: 10.1007/978-3-642-66432-8_19
Laffort, B., Beugnon, G., and Fourcassie, V. (1991). Spatial orientation and polymorphism in Camponotus aethiops (Hymenoptera: Formicidae). Sociobiology 19, 363–374.
Land, M. F. (1997). Visual acuity in insects. Annu. Rev. Entomol. 42, 147–177. doi: 10.1146/annurev.ento.42.1.147
Land, M. F., and Fernald, R. D. (1992). The evolution of eyes. Annu. Rev. Neurosci. 15, 1–29. doi: 10.1146/annurev.ne.15.030192.000245
McIntyre, P., and Caveney, S. (1998). Superposition optics and the time of flight in onitine dung beetles. J. Comp. Physiol. A 183, 45–60. doi: 10.1007/s003590050233
Menzel, R., and Backhaus, W. (1991). “Colour vision in insects,” in Vision and Visual Dysfunction. The Perception of Colour, ed P. Gouras. (London: MacMillan Press), 262–288.
Menzi, U. (1987). Visual adaptation in nocturnal and diurnal ants. J. Comp. Physiol. A 160, 11–21. doi: 10.1007/BF00613437
Moser, J. C., Reeve, J. D., Bento, J. M. S., Della Lucia, T. M. C., Cameron, R. S., and Heck, N. M. (2004). Eye size and behaviour of day- and night-flying leafcutting ant alates. J. Zool. 264, 69–75. doi: 10.1017/S0952836904005527
Narendra, A., Alkaladi, A., Raderschall, C. A., Robson, S. K. A., and Ribi, W. A. (2013). Compound eye adaptations for diurnal and nocturnal lifestyle in the intertidal ant, Polyrhachis sokolova. PLoS ONE 8:e76015. doi: 10.1371/journal.pone.0076015
Narendra, A., Reid, S. F., Greiner, B., Peters, R. A., Hemmi, J. M., Ribi, W. A., et al. (2011). Caste-specific visual adaptations to distinct daily activity schedules in Australian Myrmecia ants. Proc. Biol. Sci. 278, 1141–1149. doi: 10.1098/rspb.2010.1378
Riabinina, O., De Ibarra, N. H., Howard, L., and Collett, T. S. (2011). Do wood ants learn sequences of visual stimuli? J. Exp. Biol. 214, 2739–2748. doi: 10.1242/jeb.058537
Snyder, A. W. (1979). “Physics of vision in compound eyes,” in Handbook of Sensory Physiology—Vision in Invertebrates, Vol.7/6a, ed H. J. Autrum (Berlin, Heidelberg: Springer), 225–313.
Somanathan, H., Kelber, A., Borges, R., Wallen, R., and Warrant, E. J. (2009). Visual ecology of Indian carpenter bees II: adaptations of eyes and ocelli to nocturnal and diurnal lifestyles. J. Comp. Physiol. A 195, 571–583. doi: 10.1007/s00359-009-0432-9
Spaethe, J., and Chittka, L. (2003). Interindividual variation of eye optics and single object resolution in bumblebees. J. Exp. Biol. 206, 3447–3453. doi: 10.1242/jeb.00570
Srinivasan, M. V. (2010). Honey bees as a model for vision, perception, and cognition. Annu. Rev. Entomol. 55, 267–284. doi: 10.1146/annurev.ento.010908.164537
Tattersall, I. (1987). Cathemeral activity in primates: a definition. Folia Primatol. 49, 200–202. doi: 10.1159/000156323
Van Hateren, J. H. (1997). Processing of natural time series of intensities by the visual system of the blowfly. Vision Res. 37, 3407–3416. doi: 10.1016/S0042-6989(97)00105-3
Warrant, E. J., Kelber, A., Gislen, A., Greiner, B., Ribi, W., and Wcislo, W. T. (2004). Nocturnal vision and landmark orientation in a tropical halictid bee. Curr. Biol. 14, 1309–1318. doi: 10.1016/j.cub.2004.07.057
Warrant, E. J., and McIntyre, P. D. (1990). Limitations to resolution in superposition eyes. J. Comp. Physiol. A 167, 785–803. doi: 10.1007/BF00189768
Warrant, E. J., and McIntyre, P. D. (1993). Arthropod eye design and the physical limits to spatial resolving power. Progr. Neurobiol. 40, 413–461. doi: 10.1016/0301-0082(93)90017-M
Keywords: compound eye, activity rhythm, visual learning, ant, Camponotus aethiops, Formica cunicularia
Citation: Yilmaz A, Aksoy V, Camlitepe Y and Giurfa M (2014) Eye structure, activity rhythms, and visually-driven behavior are tuned to visual niche in ants. Front. Behav. Neurosci. 8:205. doi: 10.3389/fnbeh.2014.00205
Received: 25 March 2014; Accepted: 21 May 2014;
Published online: 13 June 2014.
Edited by:
Carmen Sandi, Ecole Polytechnique Federale de Lausanne, SwitzerlandReviewed by:
Theo Mota, Federal University of Minas Gerais, BrazilWulfila Gronenberg, University of Arizona, USA
Copyright © 2014 Yilmaz, Aksoy, Camlitepe and Giurfa. This is an open-access article distributed under the terms of the Creative Commons Attribution License (CC BY). The use, distribution or reproduction in other forums is permitted, provided the original author(s) or licensor are credited and that the original publication in this journal is cited, in accordance with accepted academic practice. No use, distribution or reproduction is permitted which does not comply with these terms.
*Correspondence: Ayse Yilmaz, Department of Behavioral Physiology and Sociobiology, University of Würzburg, Am Hubland, 97072 Würzburg, Germany e-mail: ayse.yilmaz@uni-wuerzburg.de