Stress Induces Contextual Blindness in Lotteries and Coordination Games
 Isabelle Brocas
 Juan D. Carrillo
 Ryan Kendall
- 1LABEL and Department of Economics, University of Southern California, Los Angeles, CA, United States
- 2Department of Economics, University College London, London, United Kingdom
In this paper, we study how stress affects risk taking in three tasks: individual lotteries, Stag Hunt (coordination) games, and Hawk-Dove (anti-coordination) games. Both control and stressed subjects take more risks in all three tasks when the value of the safe option is decreased and in lotteries when the expected gain is increased. Also, subjects take longer to take decisions when stakes are high, when the safe option is less attractive and in the conceptually more difficult Hawk-Dove game. Stress (weakly) increases reaction times in those cases. Finally, our main result is that the behavior of stressed subjects in lotteries, Stag Hunt and Hawk-Dove are all highly predictive of each other (p-value < 0.001 for all three pairwise correlations). Such strong relationship is not present in our control group. Our results illustrate a “contextual blindness” caused by stress. The mathematical and behavioral tensions of Stag Hunt and Hawk-Dove games are axiomatically different, and we should expect different behavior across these games, and also with respect to the individual task. A possible explanation for the highly significant connection across tasks in the stress condition is that stressed subjects habitually rely on one mechanism to make a decision in all contexts whereas unstressed subjects utilize a more cognitively flexible approach.
1. Introduction
How does stress influence human behavior? While a significant amount of the work in this direction connects chronic stress with poor health outcomes, stress has also been shown to influence decision-making. The pioneering theory suggests that any stress above an optimal level unambiguously decreases performance (Yerkes-Dodson Law, Yerkes and Dodson, 1908). In spite of this Law's intuitive appeal, subsequent research has unveiled a far more subtle relationship between stress and choice, even in purely objective tasks1. In particular, the recent literature has shown a complex relationship between stress and an individual's preference to take risks (reviews in Mather and Lighthall, 2012; Starcke and Brand, 2012). Studies using incentivized lotteries find that stressed males choose more risky lotteries while stressed females choose less risky lotteries (Preston et al., 2007; Lighthall et al., 2009; Van Den Bos et al., 2009)2. In addition, compared to a one-time increase in stress, chronic stress experienced over the course of 8 days has been shown to more significantly increase risk-aversion (Kandasamy et al., 2014). Finally, cortisol has been shown to play a role in the preference of subjects to avoid ambiguity—a concept closely related to risk (Danese et al., 2017).
There is also a small literature studying the relationship between individual lotteries and two-player coordination (“Stag Hunt”) and anti-coordination (“Hawk-Dove”) strategic situations (or “games”). Results in this area are inconclusive. While some papers suggest a correlation between risk taking in individual lotteries and risk taking in Stag Hunt games (Heinemann et al., 2009; Chierchia and Coricelli, 2015), others do not find any significant relationship (Neumann and Vogt, 2009; Al-Ubaydli et al., 2013; Büyükboyacı, 2014). Imaging studies have found correlations in neural activity between choices in lotteries and Stag Hunt games but no correlation between choices in lotteries and Hawk-Dove games or between choices in the two games (Nagel et al., 2014). The authors conclude that Stag Hunt games engage brain networks associated to risk while Hawk-Dove games engage brain networks associated to strategic thinking.
Our paper lies at the intersection of these two literatures by studying the effect of stress on risk-taking in lotteries and multi-player games of strategy—Stag Hunt and Hawk-Dove3. Our laboratory experiment relies on a novel way to represent these three tasks in an identical context that differs in the minimal amount to uniquely distinguish each task (Figure 1). Using this method, differences in behavior across tasks can best be explained by cognitive flexibility in response to fundamental differences across tasks rather than spurious differences in presentations.
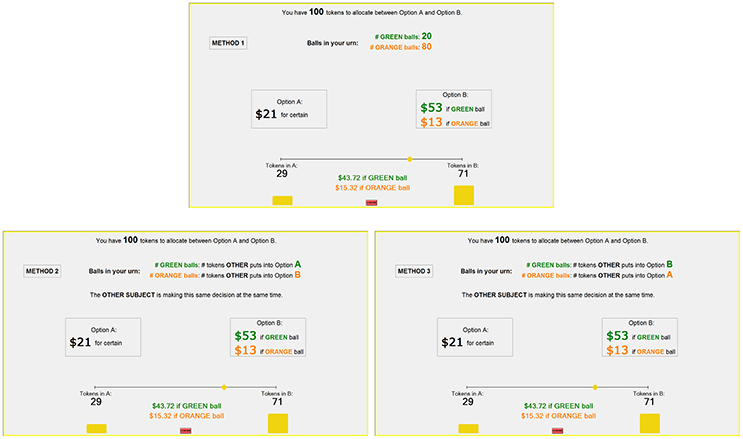
Figure 1. Screenshot of LO (Method 1), HD (Method 2), and SH (Method 3).
Our first result is to show that subjects in both the control and stress condition behave in line with our theoretical predictions. In particular, our participants take more risks in all three tasks as the value of the safe option is decreased. They also take more risks in the individual lottery choice as the probability of the high payoff is increased (Result 1). Our second and main result is that stress impairs cognitive flexibility. More precisely, the choices made by stressed subjects in lotteries, Stag Hunt and Hawk-Dove are all highly and positively correlated with each other. In contrast, control subjects show a (weak) correlation between lotteries and Stag Hunt and no significant correlation between the other pairs of tasks. A cluster analysis reveals that about one-half of the subjects under stress allocate a similar and significant fraction of their endowment to the safe option in all tasks. These subjects are responsible for strengthening the behavioral relationship between tasks (Result 2). Finally, we show that subjects take more time to respond when stakes are high, when the safe option is less attractive and in Hawk-Dove (arguably, the conceptually more difficult game). Stress also tends to increase reaction times in all tasks (Result 3).
The findings suggest that some subjects under stress are oblivious to the fundamental differences that distinguish the three tasks (objective probabilities of lotteries, strategic complementarity of risk-taking in Stag Hunt, and strategic substitutability of risk-taking in Hawk-Dove). This contextual blindness fits in with recent findings which demonstrate that stress promotes habits in humans at the expense of goal-directed performance (Schwabe and Wolf, 2009). It has been shown that people under stress have an increased reliance on automatic over controlled cognitive processes (Schwabe et al., 2012) and are less likely to adjust their initial strategies (Kassam et al., 2009). One underlying mechanism that could lead to contextual blindness is the suppressed activation in the left temporoparietal junction (TPJ) caused by a stressful environment (Engelmann et al., 2017). Impairment of the TPJ has been shown to negatively impact a subject's ability to understand and predict the behavior of others (Samson et al., 2004) which is particularly important in games such as Hawk-Dove. Taken together, the results provide a framework for stress inducing intuitive, rather than deliberative, decision-making (Yu, 2016). Interestingly, previous research on decision-making under risk and stress has made it clear that “such habitual responses do not map neatly onto risk-aversion or risk-seeking” (Buchanan and Preston, 2014). Our paper shows that, rather than a story connecting stress and risk preferences, there is a more complex relationship between stress and risk evaluation across contexts.
A main implication of contextual blindness is that subjects under stress are generally more predictable. Knowing a subject's behavior in any one task is highly predictive of his behavior in the other two tasks. In addition, stress may affect the way we view the agency of our opponent. In our experiment, the behavior of stressed subjects was similar whether they were facing an objective probability or a strategic opponent. When facing an opponent, they expected the same behavior in games that are opposite in nature. One implication from this is that stress causes people to treat others as if they have less sophistication or less agency, which may have other ramifications in social settings.
The paper is organized as follows. Section 2 describes our experimental design and predictions, with particular emphasis on the methodological contributions. Section 3 analyzes the aggregate data in each task and treatment. Section 4 studies the effect of stress on decision-making both across and within tasks, which provides our main result pertaining to contextual blindness. Section 5 investigates how stress and task complexity affect reaction times. Section 6 concludes.
2. Design and Procedures
2.1. Experimental Design
We first describe our experimental design. Further details regarding implementation, timing, and exclusion criteria are relegated to Appendix A1.
2.1.1. Stress Inducement and Hormonal Analysis
To induce a stress response in our treatment group, we closely followed the protocol of the Socially Evaluated Cold Pressor Test (SECPT, Schwabe et al., 2008). This task requires subjects to place their hand in ice water while their face is video recorded. All 72 subjects in the stress group successfully passed our requirements for completing the SECPT. To measure hormonal changes, we followed the “passive drool” protocol provided by the laboratory that ran our assay analysis (ZRT Labs). Each subject was required to submit 3 saliva samples in order to collect data on their baseline, peak, and end cortisol levels. All samples were viable and were used to measure the amount of circulating cortisol.
2.1.2. Timeline and Saliva Sample Collection
Since stress responses widely vary across individuals, we followed most of the literature on stress (Preston et al., 2007; Lighthall et al., 2009; Van Den Bos et al., 2009) and implemented a between-subjects design, with Control and Stress subjects (such method also avoids learning and endowment effects). The timeline of the experiment was the following. First, we provided detailed instructions of the tasks and performed a comprehension quiz. Subjects submitted their “Baseline” saliva sample. Subjects in the control treatment started the tasks immediately after the Baseline sample, whereas subjects in the stress treatment performed the SECPT before starting the tasks. Twenty five minutes after the Baseline saliva sample, all subjects were instructed to stop making choices in the task, and we collected the “Peak” saliva sample. Subjects completed the remaining tasks along with a brief demographic survey. They were shown all their choices and outcomes and provided the “End” saliva sample. One outcome was then randomly chosen by the computer to be used for payment. The average intra- and inter-assay coefficients of variation were no greater than 7 and 8%, respectively.
The procedure had a limitation. Indeed, due to the absence of the SECPT task, the experiment took less time in the control treatment than in the stress treatment. This is reflected in Figure 2, where the average time between the Baseline and End saliva sample is 47.6 and 56.6 min, respectively. Ideally, the control treatment should have included a “placebo” task to replace the SECPT (e.g., hand immersion in warm water during 3 min) both to equalize the length and attention demand of the experiment and to have the saliva samples taken at approximately the same intervals.
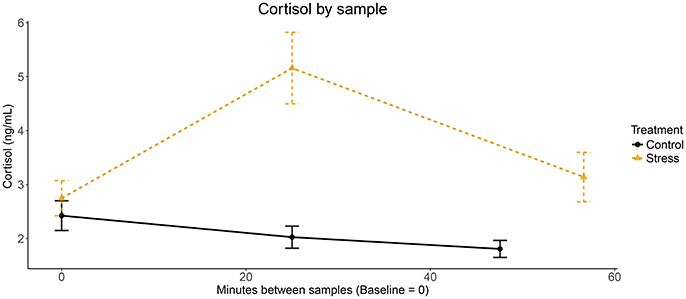
Figure 2. Cortisol levels over time.
2.1.3. Participants and Sessions
The study was reviewed by the University Park Institutional Review Board at the University of Southern California (UP-14-00663). Experiments were conducted at the Los Angeles Behavioral Economics Laboratory (LABEL) at the University of Southern California. To participate in the experiment, subjects could not eat, drink anything other than water, smoke, exercise, ingest caffeine, or chew gum within 1 h upon arriving at the laboratory. Subjects were also excluded if they had been asleep within 2 h prior to arriving at the lab or used any lip products at any time after 8 a.m. on the day of the experiment.
All sessions started at 3 p.m. and lasted no longer than 5:15 p.m. They had either 6 or 8 subjects with, at most, two more subjects of one gender in a session. We gathered data on a total of 144 subjects. One subject (stress group) was excluded due to a baseline cortisol 15 times the average of the sample, so our data is comprised of the choices of 143 subjects (71 stress, 66 female).
2.2. Tasks
Each subject made choices in three experimental tasks: individual lotteries (LO), Stag Hunt games (SH), and Hawk-Dove games (HD). All three tasks have a Safe option S and a two-state Risky option, RH and RL, so that RL < S < RH. The inherent nature of risk in each task differs. LO is an individual choice problem, where the (objective) probability of earning RH, p ≡ Pr(RH), is known before the choice is made. SH and HD are two-person, simultaneous, non-cooperative games, where the probability of earning RH depends on the choice of another subject in the room. In SH, the probability of earning RH is increasing in the level of risk chosen by the other subject (a coordination game where risk-taking is a strategic complement), whereas in SH it is decreasing in the level of risk chosen by the other subject (an anti-coordination game where risk-taking is a strategic substitute). The basic structure of the tasks is summarized in Table 14.
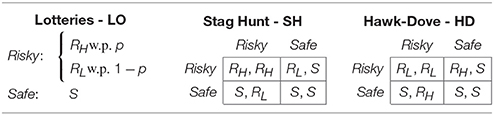
Table 1. Experimental tasks.
To implement these three tasks, we construct the following novel design. In each round, subjects are given 100 tokens, that they must allocate between the Safe and Risky options (neutrally labeled “Option A” and “Option B” in the experiment). The computer then randomly selects a ball from an urn with 100 green and orange balls (see below). For any token allocation x (∈{0, …, 100}) to Safe and 100 − x to Risky, the payoff obtained by the subject is:
In words, each token allocated to Safe yields whereas each token allocated to Risky yields either or . As x decreases, the spread between the payoff if the computer draws a green and an orange ball increases. If the subject sets x = 100, she obtains S for sure. If the subjects sets x = 0, she obtains either RH (green ball) or RL (orange ball).
As described, for each token allocated to Risky, the probability of earning payoffs and are simply the proportion of green balls and orange balls in the computer's urn, respectively. The only difference between our three tasks LO, SH, and HD is the way in which the number of green and orange balls is determined:
• In LO, the number of green and orange balls is fixed and known (given by p).
• In SH, the number of green and orange balls is equal to the number of tokens that the participant with whom the subject is matched allocates to Risky and Safe, respectively.
• In HD, the number of green and orange balls is equal to the number of tokens that the participant with whom the subject is matched allocates to Safe and Risky, respectively.
In addition, in SH and HD subjects are told that their choice affects the number of green and orange balls in the urn of the participant with whom they are matched in the exact same way. That is, in SH (HD) the more tokens a subject allocates to Risky, the more (less) likely it is that the other participant earns RH.
Figure 1 provides screenshots of the LO (top), HD (bottom left) and SH (bottom right) tasks. At the top of the screen, the subject is told the current task (neutrally labeled as “Method 1,” “Method 2,” and “Method 3,” respectively). She is also reminded how the number of green and orange balls in her urn is determined. At the center of the screen, the subject can observe the parameters of the current round. In these three tasks, S = $21, RH = $53 and RL = $13. At the bottom of the screen, there is a slider that the subject can use to allocate her 100 tokens across Safe and Risky. As the subject moves the slider to test different token allocations, the earnings for each ball color are calculated and presented in real-time on the screen. In all three screenshots, the subject has set x = 29. After the subject is satisfied with the allocation of tokens, she has to click the “CONFIRM” button to submit her choice.
Our experiment has two methodological contributions that we would like to emphasize. First, the contextual presentation of the three tasks is almost identical. Only the information concerning the determination of green and orange balls is changed. Capturing the inherently different natures of risk in such a symmetric way serves an important purpose: different behavior is likely to be only in response to the meaningful differences between these tasks, rather than to superficial differences in presentation or comprehension. Second, endowing subjects with 100 tokens that can be allocated across Safe and Risky can be used to measure “interior” behavior. In lotteries, it is analogous to portfolio diversification. In games, it is analogous to allowing subjects to play mixed strategies. In both cases, it provides more information than the standard binary choice method.
2.3. Payoff-Variants, Stakes, and Equilibria
Subjects played a total of 48 rounds, 16 rounds of each task all with different payoffs. The experiment was broken up into blocks of 4 consecutive rounds of the same task, and all sessions started with a LO block, which was arguably simpler. Before each block, subjects were shown a screen reminding them that a new block was starting. This screen ensured that subjects would be aware of which task (LO, SH, or HD) they were playing next. For the games, subjects were randomly and anonymously rematched after each round. For the lotteries, they were playing an individual decision problem (the exact experimental instructions are in Appendix B). To avoid learning effects, subjects did not see the behavior of their partner nor the color of the ball drawn by the computer in each round. At the end of the 48 rounds, subjects observed all their choices and those of their partners. One round was randomly drawn by the computer and the outcome in that round was used for payment. Subjects earned an average of $31, with a minimum of $1 (twice) and a maximum of $53 (three subjects). In addition to these earning, all subjects were paid a $5 show-up fee.
We chose the payoffs in order to provide substantial variation in monetary stakes and equilibrium predictions. First, define:
as a measure of the monetary stakes. For all tasks, we set Δ ∈ {10, 20, 30, 40}. In the analysis, we will refer to “low stakes” as Δ ∈ {10, 20} and “high stakes” as Δ ∈ {30, 40}. Second, given a triplet (RL, S, RH), the mixed-strategy Nash equilibrium of the SH game is:
where α is the probability of choosing Risky. For each Δ, we choose (RL, S, RH) so that α ∈ {0.2, 0.4, 0.6, 0.8}. This gives 16 combinations of stakes and mixed equilibrium predictions in SH. Finally, notice that once we fix Δ, then α is proportional to S the payoff of the Safe option.
Notice that for a given triplet (RL, S, RH), the mixed-strategy Nash equilibrium of HD is:
where 1−α is the probability of choosing Risky. Therefore, the same payoff-triplets as in SH provide also 16 combination of stakes (Δ ∈ {10, 20, 30, 40}) and mixed-strategy equilibria (1 − α ∈ {0.8, 0.6, 0.4, 0.2}) in HD. Last, we use the technique developed by Jessie and Kendall (2015) to select the payoffs in a way that the differences between games are only in the component that the Nash Equilibrium uses to make predictions. Table 2 provides a sample of eight games used in the experiment and Appendix A2 provides the entire list.
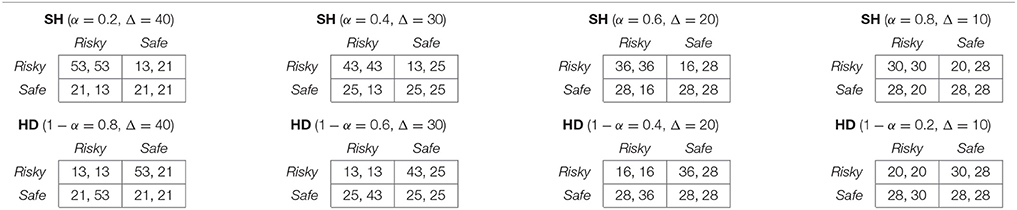
Table 2. Examples of payoff-variants in SH and HD tasks.
Finally, to create the LO tasks, we choose the payoffs (RL, S, RH) of the SH and HD games corresponding to the extreme mixed-strategy Nash equilibria of the games: α = 0.2 and α = 0.8. Using these payoffs, we set the lottery probability of the high payoff RH to p = 0.2 and p = 0.8. Creating four lotteries in this way for Δ ∈ {10, 20, 30, 40} yields a total of 16 LO tasks. Table 3 provides some examples of lotteries.
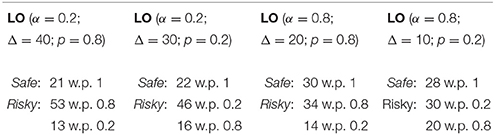
Table 3. Examples of payoff-variants in LO tasks.
2.4. Predictions
Our model has three parameters (Δ, α, p) in the LO tasks and two parameters (Δ, α) in the SH and HD tasks.
Predictions in LO are standard. Fixing the other two parameters, Risky becomes more attractive as p increases (first-order stochastic increase in the risky option) and α decreases (S closer to RL). The effect of Δ is less clear. For example, increasing Δ makes Risky more desirable when p = 0.8 and α = 0.2 and less desirable when p = 0.2 and α = 0.8.
Predictions in SH and HD are more subtle. By construction, in all 32 rounds there are two pure-strategy and one mixed-strategy equilibria. Subjects may move from one equilibrium to another, so behavior depends crucially on beliefs about the other player's action and comparative statics should be taken with a grain of salt. However, fixing the belief about the other player's constant, it seems intuitive that Risky is more attractive in both SH and HD as the sure payoff S becomes closer to RL, that is, as α decreases. Again, the effect of changes in the spread of payoffs Δ is more nuanced and depends on the position of S.
Finally, there are also interesting differences between SH and HD. SH is a coordination game, where risk-taking behavior is a strategic complement. This means that, holding constant the belief about the opponent, a decrease in α offers the subject more incentives to take risks. Furthermore, the subject realizes that the opponent also has more incentives to take risks, reinforcing the value of playing Risky. By contrast, HD is an anti-coordination game where risk-taking behavior is a strategic substitute. As α decreases, the subject has more incentives to choose Risky but realizes that the opponent has the same incentives, which decreases the value of risk-taking. Overall, strategic considerations make comparative statics significantly easier to evaluate when incentives of players are aligned (SH) than when they are not (HD).
3. Aggregate Results
3.1. Stress
Figure 2 shows the evolution of cortisol levels throughout the experimental sessions in both treatments. Each dot represents the average level of salivary cortisol samples (ng/mL) taken at baseline, peak, and end of the experiment. We report minutes on the x-axis. Note that the timing of the end sample was different across sessions and we represent the average number of minutes in each treatment. The control and stress groups start with statistically indifferent levels of average cortisol (2.42 vs. 2.75; two-sided Welch t-test, p-value = 0.133). The stress group experiences a large and statistically significant increase in average cortisol (2.75 vs. 5.16; p-value < 0.001). In comparison, the control group experiences a slight and statistically significant decrease in average cortisol (2.42 vs. 2.03; p-value = 0.022). Higher cortisol levels are also observed in the stress group in the end sample (1.81 vs. 3.14; p-value < 0.001).
3.2. Allocation between Options
The average proportion of wealth invested in Safe is 0.63 in LO, 0.53 in SH and 0.65 in HD. Results between lotteries and games are not directly comparable. By contrast, results between the two games are comparable since the 16 rounds of SH involve the same payoff triplets (RL, S, RH) as the 16 rounds of HD. We notice a significantly lower allocation to Safe in SH than in HD < 0.001).
3.3. Testing the Theory
3.3.1. Behavior in Lotteries
Choices in LO conformed to the theoretical predictions. Holding Δ constant, the proportion allocated to Safe increased as α increased and as p decreased for all stakes and in both treatments. Overall, subjects were (weakly) risk averse. They invested, on average, 97% of the endowment in Safe when the expected value of Risky was below the Safe option, against 70% when it was equal and 17% when it was above the Safe option5. Finally, the proportion in Safe was significantly lower in the low stakes rounds (Δ ∈ {10, 20}) compared to the high stakes rounds (Δ ∈ {30, 40}) under stress (p-value = 0.035) but only marginally in the control group (p-value = 0.051).
3.3.2. Behavior in Games
The proportion of wealth allocated to Safe varied with α as predicted in Section 2.4. In SH and keeping beliefs constant, increasing α makes Safe more attractive for a subject and, as the same logic applies for the partner, higher allocation rates in Safe are expected. Table 4 (left) shows that this is exactly how subjects behave for all stake levels. The average fraction allocated to Safe was significantly different between all pairs of α for all Δ (p-values < 0.05). In HD and keeping beliefs constant, increasing α (that is, decreasing 1−α) makes again Safe more attractive and should push more subjects to invest in Safe. However, they should expect their partner to also invest more in Safe, which should ultimately reduce the incentives to invest in that option. This implies that the response to an increase in α in HD should be less pronounced than in SH. Empirically, Table 4 (right) shows that increasing α made subjects invest significantly more in Safe for all pairs of α and all Δ (p-values < 0.05)6. Finally, we also computed for each individual the average increase in the fraction allocated to Safe between α = 0.2 and α = 0.8 in both SH and HD. We found a statistically higher increase in SH than in HD (0.56 vs. 0.43, p-value < 0.001), suggesting that subjects understood the difference between the strategic complementarity and the strategic substitutability of risk-taking in these two tasks. Last and as noted before, there is no particular reason to observe an aggregate effect of stakes in behavior. Empirically, we found none.
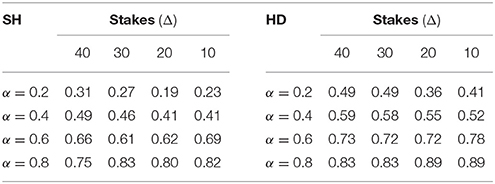
Table 4. Allocation to Safe as a function of α and Δ by game (pooled treatments).
Result 1. On aggregate, subjects behave in accordance with our predictions: the allocation to the safe option is increasing in α in all three tasks and decreasing in p in lotteries. Changes in stakes have no systematic effect on behavior.
4. Stress
4.1. Stress and Tasks
We noted a slight increase in the average proportion allocated to Safe in the stress treatment in all tasks compared to the control treatment (0.64 vs. 0.63 in LO, 0.55 vs. 0.52 in SH, and 0.65 vs. 0.65 in HD). However, the differences were not statistically significant. As presented in Figure 3, the cumulative distribution functions of the average amounts allocated to Safe were also similar across treatments in all three tasks, with no statistically significant effect according the Kolmogorov-Smirnoff test (p-value = 0.31 in LO, p-value = 0.31 in SH, and p-value = 0.97 in HD). Overall, we found no evidence that stress affected behavior within each task.
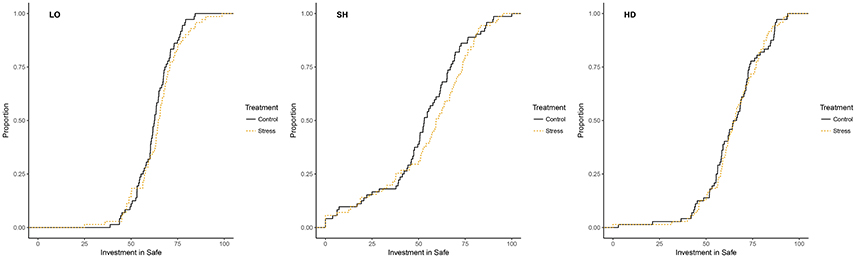
Figure 3. Distribution of average amounts in Safe by task and treatment.
The existing literature is ambiguous on this issue. Some studies have found that stress affects behavior in lotteries (Preston et al., 2007; Lighthall et al., 2009; Van Den Bos et al., 2009) whereas others found no effect of stress (von Dawans et al., 2012; Gathmann et al., 2014). Differences in responses to stress may be attributed to differences across studies in risk elicitation methods (BART, IGT, objective lotteries) and experimental procedures (presence/absence of incentives, hypothetical/real choices, different stressors). For instance, it may be that the emotional component contained in the BART experiment (anticipation of the balloon explosion and visual representation of such explosion) is responsible for shifts in behavior. Moreover, in BART and IGT subjects are typically not informed of the objective probabilities of the events. This ambiguity component may also trigger different thought processes that are differentially affected by stress (Buckert et al., 2014; Danese et al., 2017).
4.2. Stress and Gender
In Table 5 we present the differences in allocation across gender. In the control condition, females allocate significantly more to Safe than males in LO and SH but not in HD. In the stress condition we find no significant gender differences in any task.
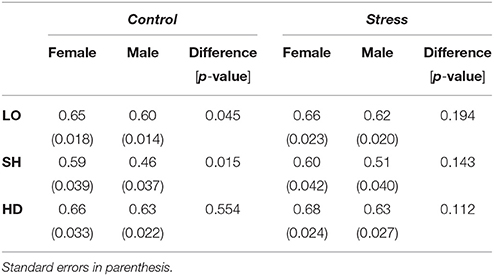
Table 5. Average allocation to Safe by gender, treatment and task.
Our data contribute to gender research in three ways. First, the fact that women take less risk in LO in the control group aligns with earlier literature (Charness and Gneezy, 2012). Second, finding males in the control group to be more cooperative in SH contributes to our understanding of gender differences in coordination games. However, we are hesitant to extrapolate about general inclinations to cooperate since, as suggested by Croson and Gneezy (2009), gender differences seem to be highly sensitive to context. Finally, since the only significant gender differences are found in the control group, we conclude that stress has the capability to diminish differences between genders.
4.3. The Effect of Stress on the Relationship between Tasks
Our next question is whether the willingness of individuals to choose Risky is correlated across tasks. On the one hand, it seems natural that subjects who are less risk-averse, that is, those who invest more in Risky in LO (individual lotteries with objective probabilities) are also expected to take more risks in games. On the other hand, this may not be necessarily true since our games have multiple equilibria, so risk-taking in SH and HD depends crucially on beliefs about the other player's behavior. Furthermore, the two games are fundamentally opposite in the optimal reaction to the other player's choice (coordination vs. anti-coordination). Table 6 presents the Pearson correlation coefficient (ρ) of the proportion allocated to Safe by individuals across tasks, both in the control (left panel) and stress (right panel) conditions.
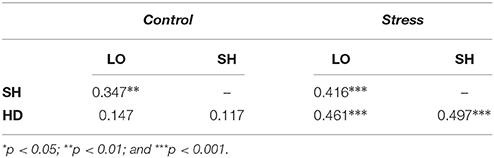
Table 6. Correlation of individual risk taking behavior across tasks by treatment.
In the control condition, the amount allocated to Safe in LO is significantly correlated with the amount allocated to Safe in SH, suggesting that risk attitude is a reasonably good predictor of behavior in the coordination game. This finding aligns with previous studies showing a correlation between LO and SH choices (Heinemann et al., 2009; Chierchia and Coricelli, 2015). By contrast, the control condition shows no significant correlation between LO and HD or between SH and HD. This may not be surprising given the previous research showing that these tasks activate different areas of the brain (Ekins et al., 2013; Nagel et al., 2014).
By contrast, in the stress condition, the amounts allocated to Safe are significantly correlated across all tasks. Correlations are also stronger, suggesting that risk-taking under stress is very similar across tasks, irrespective of the situation. This important result indicates that, even though stress did not have an effect on the overall distribution of risk taking in the population across tasks, it did affect intra-personal decisions. The result was confirmed by a set of robust regressions reported in Table 7, which suggests a stronger relationship between the amount allocated to Safe in LO, SH and HD under stress than in the control treatment. This effect will be corroborated with the trial-by-trial regression analysis.
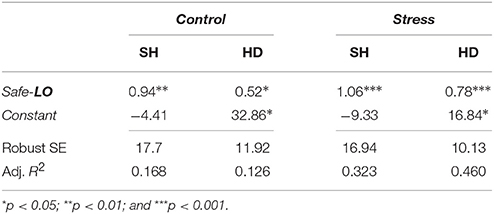
Table 7. Robust regression of the average investment in Safe in SH and HD on the average investment in the safe option in lotteries (Safe-LO) by treatment.
We then compared the correlation coefficients across conditions by assessing statistical significance of the Fisher's r to z transformations. We found that the correlation between LO and SH are not significantly different between control and stress conditions. By contrast, correlations between LO and HD and between SH and HD respectively are significantly different (with respective p-values of 0.040 and 0.012). This result further supports the finding that subjects under stress make choices that are more similar across tasks than subjects in the control treatment.
A possible explanation for this result is that subjects under stress (and only those subjects) exhibit contextual blindness, that is, they ignore the context that distinguishes these three tasks. Indeed, LO measures an individual's propensity to take risks which has no social context. SH captures a tension between risk and cooperation whereas HD captures a tension between risk and aggression. The experiment was designed so that these contexts were the only difference between tasks. Table 6 reveals that the behavior of stressed subject when faced with an objective probability over earnings was strongly and positively correlated with their behavior when faced with a strategic opponent, even if games were opposite in nature. For control subjects there was only a relationship between LO and SH. In other words, control subjects responded more to the differing contexts than stressed subjects. One implication is that the choices of subjects under stress are generally more predictable: knowing the average amount a subject invests into Safe in any one task provides significant information about behavior in the other two.
We also ran OLS regressions of the trial-by-trial amounts allocated to Safe for each game and in each condition. We used as regressors the individual average amount allocated to Safe in LO (which captures the risk attitude of each individual), and dummies for stakes (1 = High stakes), for the position of S relative to RL and RH (α), and for gender (1 = Male). We constructed a fixed effect model by including a dummy variable for each individual. The results are compiled in Table 8.
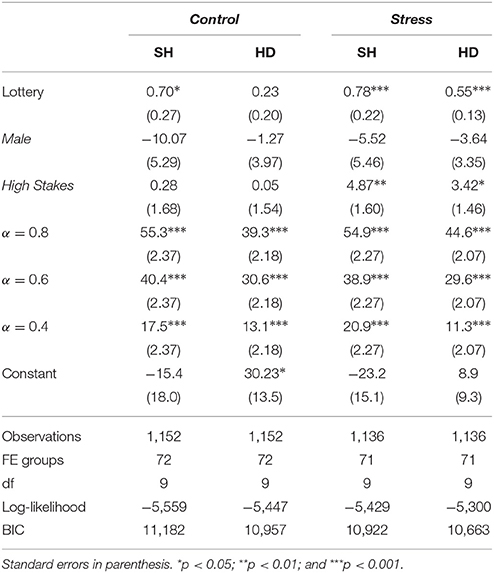
Table 8. OLS of investment in Safe in SH and HD including fixed effects.
In the Control condition, the average allocation to Safe in SH is predicted by the behavior in LO, but the average allocation in HD is not. In the Stress condition, the average amounts allocated to Safe in both SH and HD are highly predicted by behavior in LO. These regressions further confirm the contextual blindness result7. We also notice that gender has no explanatory power and that the allocation to the safe choice is increased for high stakes, but only in the Stress condition.
To better assess the significance of the effect of stress in HD, we ran a regression of the trial-by-trial amounts allocated to Safe in HD in both conditions on the same regressors as before as well as the individual difference in cortisol between baseline and peak (ΔCortisol) and an interaction term between that measure and the average allocation to Safe in LO8. For comparison, we ran the same regression for SH as well. This exercise tests directly whether the coefficients of the average allocation to Safe in LO in the previous table are significantly different across treatments. The results are reported in the first two columns of Table 9. The absence of a significant interaction in the case of SH confirms that the amount allocated to Safe in LO does not predict differentially behavior in SH across conditions. By contrast, the interaction term is significant in the case of HD, the contribution of the amount allocated to Safe in LO to behavior in HD differs across conditions. We finally ran a full regression over both games using a dummy variable for our games (1 = SH). The results are reported in the last column of Table 9. The fact that the three way interaction between the average allocation to Safe in LO, the treatment and the increase in cortisol is significant indicates that the interaction between Safe in LO and Stress is significantly different across games. The regression also shows a subtle interaction between cortisol increase and games: subjects who exhibit a higher increase in cortisol level tend to increase more their investment to Safe in HD.
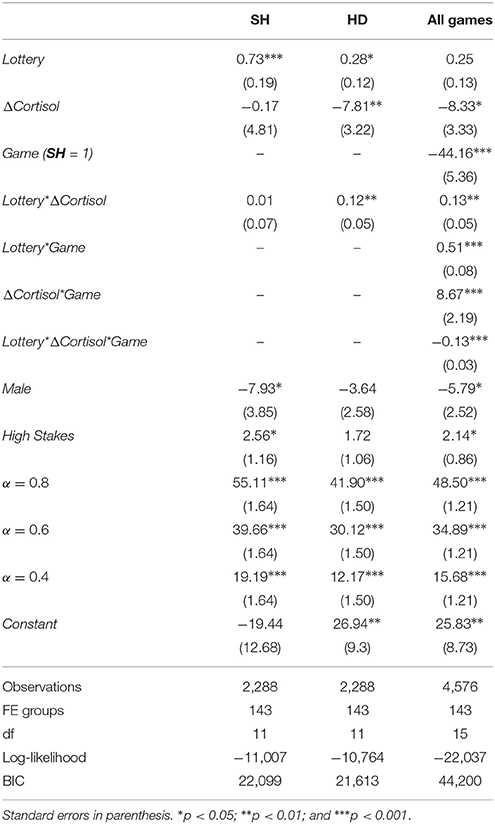
Table 9. OLS with interactions of investment in Safe in SH and HD including fixed effects.
4.4. Cluster Analysis
The fact that stress does not have any visible effect on aggregate behavior (Section 4.1) but reduces gender differences (Section 4.2) and impacts the relationship between tasks (Section 4.3) is puzzling. We therefore decided to study in more detail the behavior of individuals across the three tasks.
We conducted a cluster analysis in each condition to group subjects according to their average allocation to Safe in each task. We retained a model-based clustering method to identify the clusters present in our population. A wide array of heuristic clustering methods are commonly used but they typically require the number of clusters and the clustering criterion to be set ex-ante rather than endogenously optimized. Mixture models, on the other hand, treat each cluster as a component probability distribution. Thus, the choice between numbers of clusters and models can be made using Bayesian statistical methods (Fraley and Raftery, 2002). We implemented our model-based clustering analysis with the Mclust package in R (Fraley and Raftery, 2006). We considered ten different models with a maximum of nine clusters each, and retained the cluster combination that yielded the minimum Bayesian Information Criterion (BIC). In the Control condition, the best model consisted of three clusters (C1, C2, and C3). In the Stress condition, four different clusters best summarized behavior (S1, S2, S3, and S4). Table 10 summarizes the descriptive statistics in each cluster. Figure 4 provides a visual representation of the clusters across treatments9.
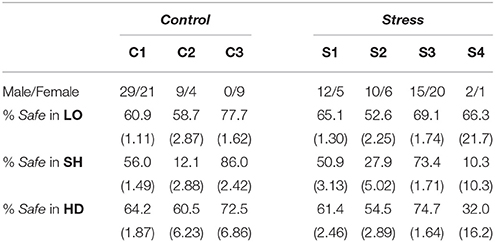
Table 10. Endogenous clusters in each condition (standard errors in parenthesis).
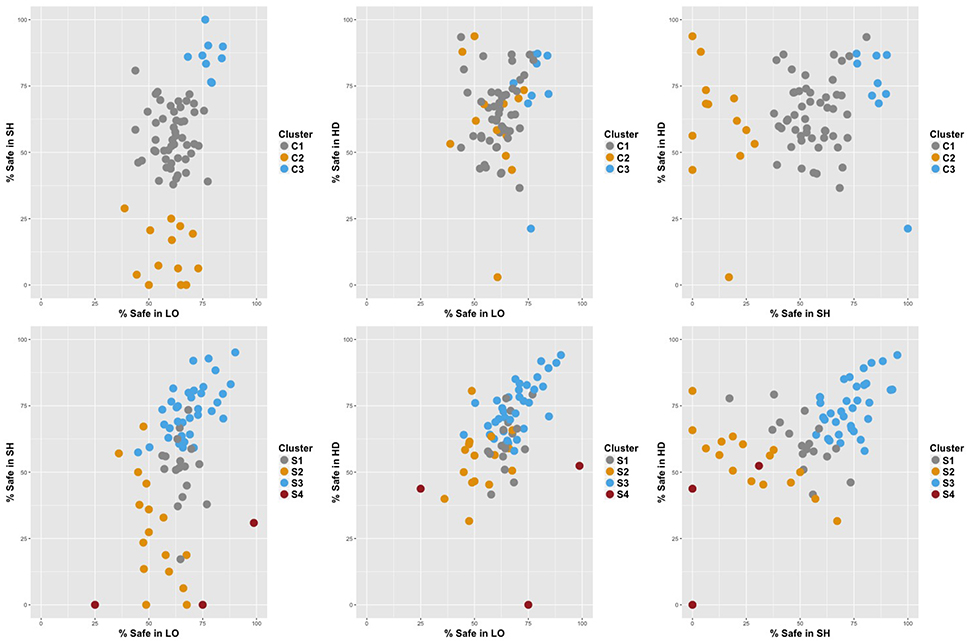
Figure 4. Representation of choices by cluster in the Control (Top) and Stress (Bottom) conditions.
In the Control condition, the majority of the subjects (C1) exhibited the typical behavior: they invested similar proportions in the Safe asset in LO and HD and less in SH, suggesting large homogeneity across subjects in this treatment. A few individuals (C2) were an extreme version of this typical play, with overly risky behavior in SH. Finally, a minority of all female subjects (C3) allocated significantly more to Safe in LO and HD, but especially in SH. This group was responsible for the gender effect detected in LO and SH in the control condition.
In the Stress condition, there were three main clusters (S4 consists of 3 outliers), similar to the clusters obtained in the control condition. Cluster S1 was the analog of C1, while S2 was similar to C2, except for a safer proportion of choices in SH. However, half of the subjects were now grouped in S3, a cluster similar to C3. These subjects allocated a large fraction of their endowment to Safe in all tasks. S3 had also the particularity that allocations were extremely similar across tasks (69.1–74.7% with low standard errors). These subjects were responsible for strengthening the relationship between tasks. Moreover, there was no gender supremacy in that cluster, causing the gender effect observed in the control condition to disappear under stress.
Result 2. Aggregate behavior is similar across treatments whereas individual choices are affected by stress. A significant fraction of participants in the stress condition are subject to contextual blindness, choosing a similar allocation independently of the task.
5. Reaction Times
5.1. Task Difficulty
In Table 11 we report the average reaction time (RT) in seconds separated by task and treatment.
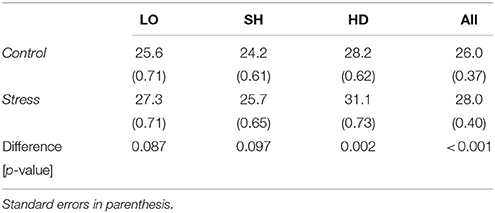
Table 11. Reaction time by task and treatment.
Making choices took more time under stress across all tasks, although the effect was mostly due to HD. We also found that RT were longer in HD compared to SH irrespective of the treatment (p < 0.001), consistent with the idea that the anti-coordination game is more complex to evaluate than the coordination game.
5.2. Attention in Lotteries
As reflected in Table 12, risky options with expected value below the safe alternative (EV < S) were quickly discarded. Subjects took significantly more time to choose when the expected value of the risky option was equal (EV = S) or greater (EV>S) than the safe option (t-test, p-value < 0.01 for all paired comparisons in Control and Stress treatments). For the more complex lotteries (EV>S), subjects took slightly more time under stress, although not significantly so.
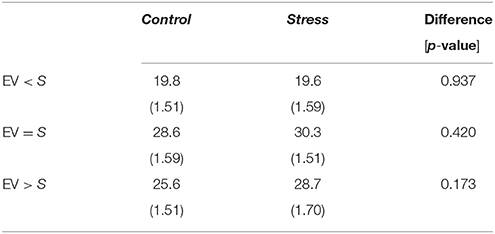
Table 12. Reaction time in lotteries by treatment and expected value of lottery (EV).
5.3. Attention in Games
Table 13 presents the reaction times in SH and HD as a function of the parameters of the games, α and Δ.
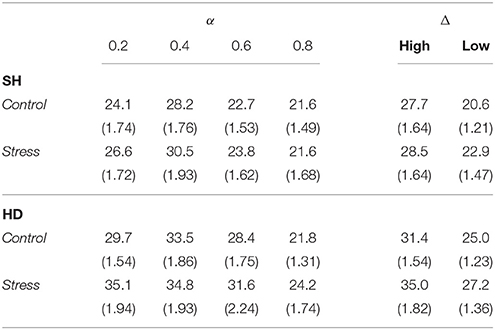
Table 13. Reaction time in games as a function of α and Δ.
In SH, we found that RT were shorter for higher α: shortest at α = 0.8 and longest at α = 0.4 in both conditions (t-tests of difference, p < 0.01 in both conditions). We also found that RT were longer in high stakes than in low stakes rounds (t-test of difference, p < 0.001 in Control and p = 0.012 in Stress). The trend was identical in HD, with shortest RT at α = 0.8 and longest at α = 0.4 in the control group and α = 0.2 in the stress group (t-tests of difference, p < 0.001 in both conditions). RT were also longest in high stakes trials (t-test of difference, p < 0.001 in both groups). It is unclear why α significantly affects reaction times in the games. In both SH and HD, increasing α makes the safe option relatively more valuable. It is plausible that Safe becomes easier to evaluate as it becomes more attractive, resulting in a quicker response. As for stakes, we conjecture that subjects find the decision to be more important (hence, more worthy of attention) when, other things being equal, the set of payoffs is more spread out. In any case, the consistency of the reaction time comparative statics across games and conditions is remarkable and deserves further investigation. Finally, in SH there was no effect of stress. In HD, there was an increase in RT under stress only when α = 0.2 (p = 0.030) and when stakes were high (p = 0.015), suggesting an interaction between game complexity and difficulty to evaluate alternatives. It is also consistent with studies showing that stress affects working memory and executive decision-making. High levels of cortisol have been associated with more errors in card sorting tasks meant to measure executive functioning (McCormick et al., 2007) as well as O-span and backwards digit-span tasks meant to measure working memory (Schoofs et al., 2009). While our finding reflects the intuition behind results showing stressed subjects performing worse on more complicated tasks (Schoofs et al., 2009), our contribution shows that more complicated decisions also take longer (in our setting, there are no right or wrong decisions). This finding illustrates an important difference between how stressed subjects reach decisions in strategic games vs. in working memory or executive functioning tasks.
We then conducted a mixed effect OLS regression to better analyze the contribution of each effect to reaction times in both games. For both SH and HD, we regressed reaction times on a Treatment dummy (1 = Stress), a Gender dummy (1 = Male), a Stakes dummy (1 = High stakes), and dummies identifying the level of α in each round. The results are reported in Table 14. They confirm the effect of high stakes and α levels reported above. Stress and gender did not have significant effects.
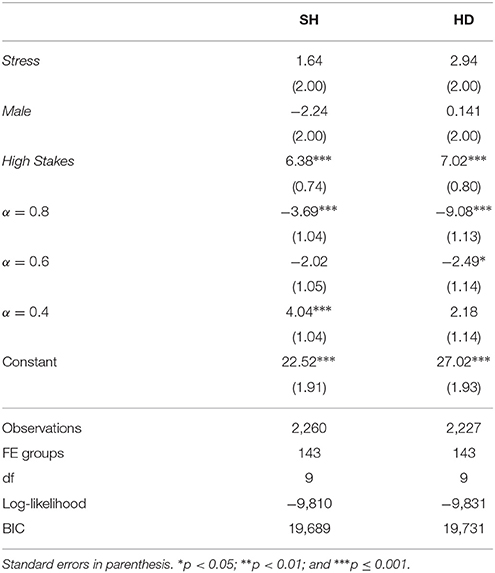
Table 14. OLS of decision time in SH and HD including fixed effects.
Result 3. Reaction times are higher in the conceptually more difficult game HD, in the more complex rounds of LO, when stakes are high and when the safe option is intrinsically less attractive in SH and HD. Stress (weakly) increases reaction times in those cases.
6. Discussion
In this paper, we examined the effect of stress on decision-making in three tasks: lotteries, Stag Hunt games, and Hawk-Dove games. Previous experiments and neuro-imaging studies suggest that people are responsive to differences in incentives across these tasks, which aligns with our control group. However, a significant portion of subjects under stress do not respond to these different incentives, which we interpret as contextual blindness.
The results contribute to our understanding of the complex relationship between stress and decision-making. In this regard, we found both conflicting and confirming evidence. Unlike some of the recent literature on lottery choice, in our study we did not find that stress had a systematic effect on any of the three tasks. However, our main finding of contextual blindness fits in well with previous work on stress inducing habituation with regard to cognitive inflexibility.
Stress-induced contextual blindness is demonstrated by a predictable pattern where subjects who choose to be relatively risk-seeking in one context also choose to be relatively risk-seeking in other, radically different ones. This predictability can be leveraged in order to reach desirable outcomes in coordination games either through directly modulating stress or by optimizing the pairing of players and games. For example, placing under stress two subjects who are risk-takers in lotteries may encourage them to be risk-seeking in Stag Hunt, therefore promoting the payoff-dominant equilibrium outcome. Alternatively, in settings where subjects need to be paired together to play coordination games, risk-preference can serve as a guide to create optimal subject-pairings in stressful circumstances. In Stag Hunt situations, optimal pairings would combine subjects with similar risk-seeking behavior in lotteries whereas in Hawk-Dove situations, optimal pairings would combine subjects with opposite risk preferences. Practical applications include team formation in military operations with limited communication.
Finally, it is surprising to observe similar attitudes when facing another individual and a lottery draw. The extent to which contextual blindness contributes to an attributed loss of opponents' agency is unclear. Subjects under stress have been shown to treat other players as less strategic decision-makers (Leder et al., 2013), but this is different from treating them as probabilistic outcomes. Further research may disentangle how stress modulates the level of autonomy attributed to other players. It may be that stress makes humans less likely to incorporate the intention of an action, which would have important implications in social contexts.
Author Contributions
IB, JC, and RK contributed to all aspects of this project equally.
Conflict of Interest Statement
The authors declare that the research was conducted in the absence of any commercial or financial relationships that could be construed as a potential conflict of interest.
Acknowledgments
We are grateful to members of the Los Angeles Behavioral Economics Laboratory (LABEL) for their insights and comments in the various phases of the project. This study was carried out in accordance with the recommendations of “University of Southern California, Institutional Review Board” with written informed consent from all subjects. All subjects gave written informed consent in accordance with the Declaration of Helsinki. The protocol was approved by the University of Southern California, Institutional Review Board, approval number UP-12-00663. We acknowledge the financial support of the National Science Foundation grant SES-1425062 and the University of Southern California's Provost's Postdoctoral Research Scholar Grant.
Supplementary Material
The Supplementary Material for this article can be found online at: https://www.frontiersin.org/articles/10.3389/fnbeh.2017.00236/full#supplementary-material
Footnotes
1. ^For example, subjects under stress are less accurate at identifying visual cues located on the periphery of their vision, but these same subjects are actually more accurate than their non-stressed counterparts at identifying cues directly in front of them (Hockey, 1970).
2. ^A differential effect across gender is not surprising since, in general, stress is theorized to affect men and women differently (Taylor et al., 2000).
3. ^There is also a literature relating stress to behavior in multi-person games. However, it is only tangentially related to our work as it focuses mainly on the effect of stress on prosocial or anti-social behavior (see Buchanan and Preston, 2014; Van Den Bos and Flik, 2015 for summaries).
4. ^As it is well-know, SH is a coordination game with two pure-strategy equilibria (Safe-Safe and Risky-Risky) and one mixed-strategy equilibrium whereas HD is an anti-coordination game with two pure-strategy equilibria (Safe-Risky and Risky-Safe) and one mixed-strategy equilibrium.
5. ^Since virtually no subject exhibited risk-loving preferences, the four LO rounds where Risky has lower expected value than the Safe option contain no extra information. As a robustness check, we conducted the entire analysis of the paper without these four rounds. All the results were statistically identical.
6. ^Recall that in SH, α is the probability of playing Risky in the mixed strategy equilibrium. In HD, 1−α is the probability of playing Risky in the mixed strategy equilibrium.
7. ^We also ran the same OLS regressions with the behavior in the other game as an extra regressor. Results and significance were very similar. Furthermore, and confirming the results in Table 6, the new variable had a positive and significant coefficient in the Stress regressions and a positive but not significant coefficient in the Control regressions. Notice that a two-censored non-linear Tobit model would allow for censoring at 0 and 100 but requires analysis at the subject-average level since it cannot account for subject-level fixed effects. The average data was rarely censored at either 0 or 100 which makes such a model inappropriate.
8. ^The previous analysis only makes a qualitative comparison of the association between the allocation to Safe in HD and SH and the average allocation to Safe in LO in the two conditions. A formal analysis of the interactions between money allocation, games and conditions within the same model allows to directly compare the strength of the across conditions and games (see Nieuwenhuis et al., 2011).
9. ^To better represent the information, we do not use three-dimensional graphs. Instead, we provide projections of each pair of tasks separately.
References
Al-Ubaydli, O., Jones, G., and Weel, J. (2013). Patience, cognitive skill, and coordination in the repeated stag hunt. J. Neurosci. Psychol. Econ. 6:71. doi: 10.1037/npe0000005
Buchanan, T. W., and Preston, S. D. (2014). Stress leads to prosocial action in immediate need situations. Front. Behav. Neurosci. 8:5. doi: 10.3389/fnbeh.2014.00005
Buckert, M., Schwieren, C., Kudielka, B. M., and Fiebach, C. J. (2014). Acute stress affects risk taking but not ambiguity aversion. Front. Neurosci. 8:82. doi: 10.3389/fnins.2014.00082
Büyükboyacı, M. (2014). Risk attitudes and the stag-hunt game. Econ. Lett. 124, 323–325. doi: 10.1016/j.econlet.2014.06.019
Charness, G., and Gneezy, U. (2012). Strong evidence for gender differences in risk taking. J. Econ. Behav. Organ. 83, 50–58. doi: 10.1016/j.jebo.2011.06.007
Chierchia, G., and Coricelli, G. (2015). The impact of perceived similarity on tacit coordination: propensity for matching and aversion to decoupling choices. Front. Behav. Neurosci. 9:202. doi: 10.3389/fnbeh.2015.00202
Croson, R., and Gneezy, U. (2009). Gender differences in preferences. J. Econ. Literat. 47, 448–474. doi: 10.1257/jel.47.2.448
Danese, G., Fernandes, E., Watson, N. V., and Zilioli, S. (2017). Testosterone and cortisol jointly predict the ambiguity premium in an ellsberg-urns experiment. Front. Behav. Neurosci. 11:68. doi: 10.3389/fnbeh.2017.00068
Ekins, W. G., Caceda, R., Capra, C. M., and Berns, G. S. (2013). You cannot gamble on others: dissociable systems for strategic uncertainty and risk in the brain. J. Econ. Behav. Organ. 94, 222–233. doi: 10.1016/j.jebo.2013.07.006
Engelmann, J. B., Meyer, F., Ruff, C. C., and Fehr, E. (2017). The neural circuitry of emotion-induced distortions of trust. bioRxiv 129130. doi: 10.1101/129130
Fraley, C., and Raftery, A. E. (2002). Model-based clustering, discriminant analysis, and density estimation. J. Am. Stat. Assoc. 97, 611–631. doi: 10.1198/016214502760047131
Fraley, C., and Raftery, A. E. (2006). Mclust Version 3: An R Package for Normal Mixture Modeling and Model-based Clustering. Technical report, University of Washington.
Gathmann, B., Schulte, F. P., Maderwald, S., Pawlikowski, M., Starcke, K., Schäfer, L. C., et al. (2014). Stress and decision making: neural correlates of the interaction between stress, executive functions, and decision making under risk. Exp. Brain Res. 232, 957–973. doi: 10.1007/s00221-013-3808-6
Heinemann, F., Nagel, R., and Ockenfels, P. (2009). Measuring strategic uncertainty in coordination games. Rev. Econ. Stud. 76, 181–221. doi: 10.1111/j.1467-937X.2008.00512.x
Hockey, G. R. J. (1970). Effect of loud noise on attentional selectivity. Q. J. Exp. Psychol. 22, 28–36. doi: 10.1080/14640747008401898
Jessie, D., and Kendall, R. (2015). Decomposing Models of Bounded Rationality. Technical report, IMBS technical reports MBS 15-06.
Kandasamy, N., Hardy, B., Page, L., Schaffner, M., Graggaber, J., Powlson, A. S., et al. (2014). Cortisol shifts financial risk preferences. Proc. Natl. Acad. Sci. U.S.A. 111, 3608–3613. doi: 10.1073/pnas.1317908111
Kassam, K. S., Koslov, K., and Mendes, W. B. (2009). Decisions under distress: stress profiles influence anchoring and adjustment. Psychol. Sci. 20, 1394–1399. doi: 10.1111/j.1467-9280.2009.02455.x
Leder, J., Häusser, J. A., and Mojzisch, A. (2013). Stress and strategic decision-making in the beauty contest game. Psychoneuroendocrinology 38, 1503–1511. doi: 10.1016/j.psyneuen.2012.12.016
Lighthall, N. R., Mather, M., and Gorlick, M. A. (2009). Acute stress increases sex differences in risk seeking in the balloon analogue risk task. PLoS ONE 4:e6002. doi: 10.1371/journal.pone.0006002
Mather, M., and Lighthall, N. R. (2012). Risk and reward are processed differently in decisions made under stress. Curr. Dir. Psychol. Sci. 21, 36–41. doi: 10.1177/0963721411429452
McCormick, C., Lewis, E., Somley, B., and Kahan, T. (2007). Individual differences in cortisol levels and performance on a test of executive function in men and women. Physiol. Behav. 91, 87–94. doi: 10.1016/j.physbeh.2007.01.020
Nagel, R., Brovelli, A., Heinemann, F., and Coricelli, G. (2014). “Neural correlates of risk and strategic uncertainty,” in Working Paper.
Neumann, T., and Vogt, B. (2009). “Do Players' beliefs or risk attitudes determine the equilibrium selections in 2x2 coordination games?,” in FEMM Working Paper.
Nieuwenhuis, S., Forstmann, B. U., and Wagenmakers, E.-J. (2011). Erroneous analyses of interactions in neuroscience: a problem of significance. Nat. Neurosci. 14, 1105–1107. doi: 10.1038/nn.2886
Preston, S., Buchanan, T., Stansfield, R., and Bechara, A. (2007). Effects of anticipatory stress on decision making in a gambling task. Behav. Neurosci. 121:257. doi: 10.1037/0735-7044.121.2.257
Samson, D., Apperly, I., Chiavarino, C., and Humphreys, G. (2004). Left temporoparietal junction is necessary for representing someone else's belief. Nat. Neurosci. 7, 499–500. doi: 10.1038/nn1223
Schoofs, D., Wolf, O. T., and Smeets, T. (2009). Cold pressor stress impairs performance on working memory tasks requiring executive functions in healthy young men. Behav. Neurosci. 123:1066. doi: 10.1037/a0016980
Schwabe, L., Haddad, L., and Schachinger, H. (2008). Hpa axis activation by a socially evaluated cold-pressor test. Psychoneuroendocrinology 33, 890–895. doi: 10.1016/j.psyneuen.2008.03.001
Schwabe, L., Joëls, M., Roozendaal, B., Wolf, O. T., and Oitzl, M. S. (2012). Stress effects on memory: an update and integration. Neurosci. Biobehav. Rev. 36, 1740–1749. doi: 10.1016/j.neubiorev.2011.07.002
Schwabe, L., and Wolf, O. T. (2009). Stress prompts habit behavior in humans. J. Neurosci. 29, 7191–7198. doi: 10.1523/JNEUROSCI.0979-09.2009
Starcke, K., and Brand, M. (2012). Decision making under stress: a selective review. Neurosci. Biobehav. Rev. 36, 1228–1248. doi: 10.1016/j.neubiorev.2012.02.003
Taylor, S. E., Klein, L. C., Lewis, B. P., Gruenewald, T. L., Gurung, R. A., and Updegraff, J. A. (2000). Biobehavioral responses to stress in females: tend-and-befriend, not fight-or-flight. Psychol. Rev. 107:411. doi: 10.1037/0033-295X.107.3.411
Van Den Bos, R., and Flik, G. (2015). Decision-making under stress: the importance of cortico-limbic circuits. Front. Behav. Neurosci. 9:203. doi: 10.3389/fnbeh.2015.00203
Van Den Bos, R., Harteveld, M., and Stoop, H. (2009). Stress and decision-making in humans: performance is related to cortisol reactivity, albeit differently in men and women. Psychoneuroendocrinology 34, 1449–1458. doi: 10.1016/j.psyneuen.2009.04.016
von Dawans, B., Fischbacher, U., Kirschbaum, C., Fehr, E., and Heinrichs, M. (2012). The social dimension of stress reactivity: acute stress increases prosocial behavior in humans. Psychol. Sci. 23, 651–660. doi: 10.1177/0956797611431576
Yerkes, R. M., and Dodson, J. D. (1908). The relation of strength of stimulus to rapidity of habit-formation. J. Comp. Neurol. 18, 459–482. doi: 10.1002/cne.920180503
Keywords: stress, contextual blindness, lotteries, coordination games, risk taking
Citation: Brocas I, Carrillo JD and Kendall R (2017) Stress Induces Contextual Blindness in Lotteries and Coordination Games. Front. Behav. Neurosci. 11:236. doi: 10.3389/fnbeh.2017.00236
Received: 18 August 2017; Accepted: 13 November 2017;
Published: 11 December 2017.
Edited by:
Monica Capra, Claremont Graduate University, United StatesReviewed by:
Jan B. Engelmann, University of Amsterdam, NetherlandsSalomon Israel, Hebrew University of Jerusalem, Israel
Copyright © 2017 Brocas, Carrillo and Kendall. This is an open-access article distributed under the terms of the Creative Commons Attribution License (CC BY). The use, distribution or reproduction in other forums is permitted, provided the original author(s) or licensor are credited and that the original publication in this journal is cited, in accordance with accepted academic practice. No use, distribution or reproduction is permitted which does not comply with these terms.
*Correspondence: Ryan Kendall, Ryan.Kendall@ucl.ac.uk