Onset of pup locomotion coincides with loss of NR2C/D-mediated cortico-striatal EPSCs and dampening of striatal network immature activity
- 1 INSERM Unité 901, Marseille, France
- 2 UMR S901 Aix-Marseille 2, Université de la Méditerranée, Marseille, France
- 3 INMD, Marseille, France
- 4 INSERM Unité 676, Hôpital Robert Debré, Paris, France
- 5 Université Paris Diderot, Paris, France
- 6 Laboratoire de Neurosciences Cognitives, INSERM Unité 960, Ecole Normale Supérieure, Paris, France
Adult motor coordination requires strong coincident cortical excitatory input to hyperpolarized medium spiny neurons (MSNs), the dominant neuronal population of the striatum. However, cortical and subcortical neurons generate during development large ongoing patterns required for activity-dependent construction of networks. This raises the question of whether immature MSNs have adult features from early stages or whether they generate immature patterns that are timely silenced to enable locomotion. Using a wide range of techniques including dynamic two-photon imaging, whole cell or single-channel patch clamp recording in slices from Nkx2.1-GFP mice, we now report a silencing of MSNs that timely coincides with locomotion. At embryonic stage (as early as E16) and during early postnatal days, genetically identified MSNs have a depolarized resting membrane potential, a high input resistance and lack both inward rectifying (IKIR) and early slowly inactivating (ID) potassium currents. They generate intrinsic voltage-gated clustered calcium activity without synaptic components. From postnatal days 5–7, the striatal network transiently generates synapse-driven giant depolarizing potentials when activation of cortical inputs evokes long lasting EPSCs in MSNs. Both are mediated by NR2C/D-receptors. These immature features are abruptly replaced by adult ones before P10: MSNs express IKIR and ID and generate short lasting, time-locked cortico-striatal AMPA/NMDA EPSCs with no NR2C/D component. This shift parallels the onset of quadruped motion by the pup. Therefore, MSNs generate immature patterns that are timely shut off to enable the coordination of motor programs.
Introduction
Adult medium spiny neurons (MSNs), the GABAergic principal neurons of the striatum, have unique features required for the appropriate selection of motor programs (Grillner et al., 2005). They are highly hyperpolarized at rest and require strong coincident excitatory glutamatergic inputs for the execution of appropriate movements (Wilson and Kawaguchi, 1996). These unique features are due to strong inward rectifying (IKIR) and slow inactivating (ID) potassium currents and feedforward and feedback afferent inhibition that confer a low input resistance, hyperpolarized resting potential, and a long delay to initial spiking (Tepper et al., 2004). In a large range of animal species and brain structures, immature neurons are highly excitable and developing networks generate network-driven patterns that are instrumental in neuronal growth, synapse formation, and the formation of functional circuits (for review Ben-Ari, 2002; Spitzer, 2006; Huberman et al., 2008; Blankenship and Feller, 2010). These observations raise the question whether MSNs differ from other neuronal types and are silent from early developmental stages and if not when and how are the early patterns switched off to enable correct motor coordination and quadruped motion.
Medium spiny neurons originate in the lateral ganglionic eminence (Deacon et al., 1994; Olsson et al., 1998) and migrate radially into the developing striatum compartments (Van Der Kooy and Fishell, 1987). To understand MSN functional maturation, we targeted embryonic and early postnatal MSNs with the use of Nk2 homeobox 1 (Nkx2.1)-GFP Mice. Nkx2.1, also known as thyroid transcription factor-1 (TTF-1), is a protein that regulates transcription of genes and is specifically expressed by interneurons but not by MSNs in the striatum (Nobrega-Pereira et al., 2008). We determined MSNs’ cellular properties using whole cell and single-channel recordings. In parallel we performed two-photon dynamic imaging that enables to determine the activity of large neuronal samples in slice preparation (Crepel et al., 2007). We then used behavioral analysis to describe posture and onset of locomotion in newborn pups. We report an abrupt switch of cellular and synaptic properties in MSNs in parallel with the initiation of locomotion.
Materials and Methods
Embryonic and Postnatal Slice Preparations
We performed experiments in embryonic (E14, E16, E18) or postnatal (P0–P45) wild type C57BL/6 mice (Janvier, France) or Nkx2.1-GFP mice of either sex obtained by crossing Nkx2.1-CRE C57BL/6 mice (Jackson lab) and the RCE:LoxP reporter strain (Sousa et al., 2009). We anesthetized pregnant mice with xylazine (Rompun 2%; used at 0.05%) and ketamine (Imalgene 1000; used at 50 g/l; Volume injected: 0.2 ml/g) and postnatal mice with isoflurane. We kept brains in ice-cold oxygenated solution containing (in mM): 110 choline, 2.5 KCl, 1.25 NaH2PO4, 7 MgCl2, 0.5 CaCl2, 25 NaHCO3, 7 glucose, and performed coronal, parasagittal, or horizontal slices (400 μm thick) using a vibratome (VT1200 Leica Microsystems Germany). During the recovery period, slices were placed at room temperature (RT) with standard artificial cerebrospinal fluid (ACSF) saturated with 95% O2/5% CO2 and containing (in mM): 126 NaCl, 3.5 KCl, 1.2 NaH2PO4, 1.3 MgCl2, 2 CaCl2, 25 NaHCO3, 11 glucose.
Calcium Imaging
Slices were incubated for 30 min in 2.5 ml of oxygenated ACSF (35–37°C) with 25 μl fura 2AM (1 mM, in DMSO + 0.8% pluronic acid; Molecular Probes). Imaging was performed with a multibeam two-photon laser scanning system (Trimscope-LaVision Biotec) coupled to an Olympus microscope with a high numerical aperture objective (20×, NA 0.95, Olympus). Images of the scan field (444 μm × 336 μm) were acquired via a CCD camera (4 × 4 binning; La Vision Imager 3QE) with a time resolution of 115–147 ms (non-ratiometric 1000–3000 images, laser at 780 nm) as previously described (Crepel et al., 2007). In slices from Nkx2.1-GFP mice, we first took images of the GFP-expressing neurons (laser at 910 nm) before acquiring spontaneous fura 2 fluorescence changes (laser at 780 nm). To patch clamp record particular neurons Fura pentapotassium salt (30 μM; Invitrogen) was added to the pipette solution to keep cells fluorescent.
Patch Clamp Recordings
Cells were visualized with infrared-differential interference optics (Axioskop2; Zeiss). We performed recordings at 35–37°C. For current clamp recordings, the pipette contained (in mM): 15 KCl, 5 NaCl, 125 KMeSO4, 10 HEPES, 2.5 Mg-ATP, 0.3 Na-GTP. For whole cell voltage-clamp recordings of postsynaptic GABAA (sIPSCs) and glutamatergic (sEPSCs) currents, the pipette (6–10 MΩ) contained (in mM): 120 Cs-gluconate, 13 CsCl, 1 CaCl2, 10 HEPES, 10 EGTA, pH 7.2–7.4 (275–285 mOsm). We recorded sIPSCs at the reversal potential of sEPSCs (+10 mV). To record sEPSCs we continuously applied a GABAA receptor antagonist (bicuculline 20 μM or Gabazine 5 μM), and maintained the membrane potential at −80 or +40 mV to separately detect AMPA/kainate (KA) and NMDA sEPSCs, respectively (Groc et al., 2002). We recorded AMPA/KA sEPSCs in the continuous presence of APV (40 μM), the selective NMDA receptor antagonist, and separated AMPA from KA sEPSCs by applying NBQX at a dose (1 μM) that preferentially blocks AMPA receptors. We identified NMDA sEPSCs at +40 mV by their kinetics (the NMDA decay time is longer than the AMPA one) or insensitivity to the AMPA/KA receptor antagonist, NBQX (10 μM).
To record unitary GABAA currents the pipette (4–5 MΩ) contained (in mM): 120 NaCl, 20 TEA-Cl (tetraethylammonium chloride), 5 KCl, 5 4-aminopyridine, 0.1 CaCl2, 10 MgCl2, 10 glucose, 5 GABA, 5 isoguvacine, 3 CsCl, 10 HEPES-NaOH buffered to pH 7.2–7.3; osmolality of 300–320 mOsm. When Gabazine 10 μM was added to the above pipette solution no unitary currents were recorded. To record unitary NMDA currents, the pipette (4–5 MΩ) contained (in mM): 140 NaCl, 3.5 KCl, 1.8 CaCl2, 10 HEPES, 10 NMDA, 10 glycine, 1 strychnine, buffered to pH 7.43; osmolality of 300–320 mOsm. When APV (40 μM) was added to the pipette solution, no unitary currents were recorded. To identify the morphology of neurons recorded in cell-attached configuration, we re-patched them with a conventional whole cell electrode containing neurobiotin (Abcys).
Identification of Immature MSNs vs. Interneurons or vs. Astrocytes
Since embryonic and early postnatal MSNs lack their characteristic adult K+ currents, they could not be identified from their electrophysiological properties. We therefore identified them as GFP-negative neurons (Sousa et al., 2009) in striatal slices from Nkx2.1-GFP mice. To quantify the proportion of Nkx2.1-positive striatal interneurons that faintly expressed GFP and were therefore considered as MSNs, we performed immunocytochemistry of Nkx2.1 (see below; Figure 1A). From a total of 2767 Nkx2.1-expressing striatal neurons labeled with TTF-1 (red), 75% were also GFP positive (yellow, n = 2077), showing that in perinatal slices from Nkx2.1-GFP mice, 25% of the Nkx2.1-positive neurons, though GFP-negative, were not MSNs. In our two-photon recordings, GFP positive/fura 2-loaded neurons represented 10–20% of all fura 2-loaded cells. Therefore instead of 10–20% interneurons, we had around 13–27% interneurons in the field. We thus overestimated the proportion of MSNs by 3–7%.
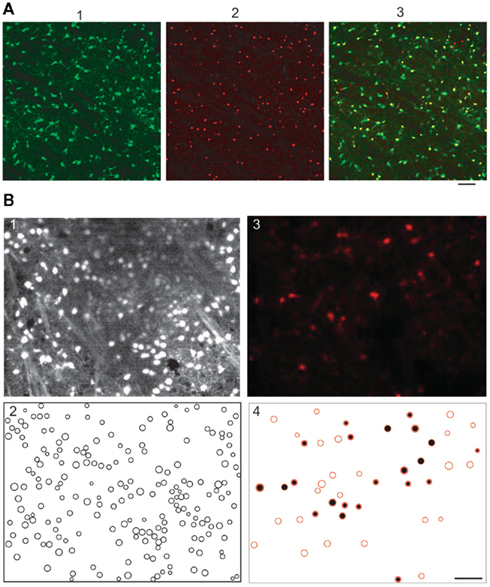
Figure 1. Quantification of percent of GFP-negative/Nkx2.1-positive neuron in perinatal striatal slices and of percent of fura 2-loaded astrocytes in the P10–P12 striatal slices. (A1) Confocal image of the GFP-expressing neurons in the dorso-lateral region of the striatum (slice from a P2 Nkx2.1-GFP mouse). (A2) Nkx2.1-expressing neurons in the same field revealed with the TTF-1/111–121 antibody (in red, see Materials and Methods). (A3) The superimposition of the two images shows that of the 161 Nkx2.1-expressing neurons 13 were GFP-negative meaning that in this field 13 striatal interneurons out of 161 could be erroneously considered as MSNs. (B) Two-photon images of a striatal slice first loaded with sulforhodamine 101 (SR101, 1 μM) and then with fura 2AM. (B1) Fura 2 fluorescent cells (n = 196) imaged with excitation wavelength and emission filter parameters specific for fura 2 (laser at 780 nm and emission filter 535 ± 25 nm, parameters that give no images of cells loaded with SR101 only). (B2) Manually detected contours of the cells from the fluorescence images (n = 196 fura 2-loaded cells). (B3) SR101 fluorescent astrocytes (n = 46) imaged with excitation wavelength and emission filter parameters adjusted for SR101 (laser at 880 nm and emission filter 610 ± 37 nm, parameters that give faint images of few cells loaded with fura 2 only); same field as in (A). (B4) Of these 46 SR101 loaded astrocytes half (n = 22) were also fura 2-loaded (black-filled red circles obtained by superimposition of 1 and 3) meaning that 22 cells out of the 196 fura 2-loaded cells were astrocytes. Scale bars 50 μm.
To quantify the proportion of fura 2-loaded cells that were astrocytes and not neurons in slices from P10 to P12 mice, and could be erroneously considered as silent neurons, we performed double loading of slices with sulforhodamine 101 (SR101, 1 μM), a specific marker of astroglia (Nimmerjahn et al., 2004) during 20 min at 35–37°C and then with fura 2AM (Figure 1B). At P12, astrocytes represented around 25% of all the imaged cells (n = 201/815 from five slices). Among these astrocytes, around 40% were also positive for fura 2 (n = 86/201). Therefore around 10% of fura 2-loaded cells were astrocytes (n = 86/815). All these fura 2-loaded astrocytes were silent and could be erroneously counted as silent neurons.
Immunocytochemistry and DiI Experiments
To reveal the neurobiotin injected during whole cell recordings, the sections were left 12 h in paraformaldehyde (3%) at 4°C, rinsed in PBS, left 12 h in PB-sucrose 20%, and then at −80°C for at least 2 h. They were thawed at RT, rinsed in PB and incubated 30 min in 1% H2O2 in PB. Slices were washed with PB and KPBS and incubated for 12 h in ABC complex at a dilution of 1:100 in KPBS + 0.3% triton (Abcys). They were rinsed in KPBS and incubated for approximately 10 min in 3,3′ diaminobenzidine (DAB 0.7 mg/ml) with peroxide (0.2 mg/ml; Sigma Fast), rinsed, mounted in Crystal/Mount (Electron Microscopy Sciences), coverslipped, and examined. Dendritic and axonal fields were reconstructed using the Neurolucida system (MicroBrightField Inc., Colchester, VT, USA).
To reveal the Nkx2.1-positive neurons we used the antibody TTF-1/111–121. Slices were cryoprotected in PB with 20% sucrose, freeze-thawed in isopentane, and rinsed in PB. Slices were then incubated in PBS Triton 0.3% normal goat serum (NGS, 2%) for 1 h and then in Nkx2.1 antibody (1:2500; TTF-1/111–121; Biopat, Italy) for 4 days at RT. After thorough rinsing, slices were incubated for 90 min at RT in alexa-488 goat anti-mouse (1:300; Molecular Probes, Leiden, the Netherlands) in PBS and NGS 2% overnight. After thorough rinsing, slices were mounted in fluoromount, coverslipped, and examined with a confocal microscope (Zeiss LSM 510). For double immunocytochemistry Neurobiotin-Nkx2.1, slices were treated as above for the revelation of Nkx2.1. Then after thorough rinsing, slices were again incubated in PBS and Cy3 streptavidin (1:300; Jackson, USA) to label the neurobiotin-loaded neuron(s) and then rinsed. After thorough rinsing, slices were mounted in fluoromount, coverslipped, and examined with a confocal microscope (Zeiss LSM 510).
To visualize cortico-striatal axons, we injected small amounts of DiI crystals diluted in ethanol in the neocortex of 400 μm thick slices from E16 to P2 brains postfixed by immersion for 2–4 weeks in 4% paraformaldehyde. Slices were then incubated in the fixative solution at 32°C for 2–3 weeks, coverslipped, and examined with a confocal microscope (Zeiss LSM 510).
Analysis of Imaging Data
We performed analysis of the calcium activity with custom-made software written in Matlab (MathWorks; Bonifazi et al., 2009). The contour of each loaded cell was semi-automatically detected and its fluorescence measured as a function of time. Active cells are neurons exhibiting any Ca2+ event of at least 5% DF/F deflection within the period of recording. Ca2+ spikes or Ca2+ plateaus cells were neurons exhibiting at least one Ca2+ spike or one Ca2+ plateau within the period of recording. Ca2+ plateaus were intrinsic correlated Ca2+ events of long duration (see Results). Giant depolarizing potentials (GDP) cells were cells generating synchronized synapse-driven Ca2+ spikes (GDPs). To compute the activity correlation of two cells, the onset of each event was represented by a Gaussian (s = 1 frame, to allow some jitter). The inner product of the resulting values was then calculated. The significance of each correlation value was estimated by direct comparison with a distribution computed from surrogate data sets, in which the events were randomly reshuffled in time.
To compare both network-wide and single-neuron activity between putative intrinsically driven activity at P2 (P2–P3 recordings) and synaptically driven activity at P6 (P5–P7 recordings), we used standard k-means clustering to determine how well event durations and frequencies distinguished P2 and P6 time-points. The k-means algorithm used minimization of city-block distance, with 30 replications from random starting positions, from which we retained the replicate with the minimum mean distance. We also sought evidence for differences in spontaneous neural ensembles in network-wide activity. Each recording’s matrix of pair-wise correlations, computed by Gaussian convolution as above was partitioned into groups using a modified community detection algorithm, detailed in Humphries (2011), which finds the number and size of groups within the matrix that maximize benefit function Qdata = (similarity within groups) − (expected similarity within groups). The resulting partition thus corresponded to groups of neurons that were more similar in activity patterns than was expected given the total similarity of each neuron’s activity to the whole data-set. We then ran a further stringent control for potentially spurious groupings, by first shuffling the inter-event intervals of each neuron in a recording, correlating the shuffled event onsets, and then running the algorithm on the shuffled data-set. This was repeated 100 times to get a distribution of Q for control data. The 95th percentile of these values was taken as the 95% confidence interval Qctrl. Any network with Qdata > Qctrl thus contained significant ensemble structure, compared to that expected from just the firing statistics of the network.
Analysis of Electrophysiological Data
We determined series resistance (Rs), membrane capacitance (Cm), and input resistance (Rinput) by on-line fitting analysis of the transient currents in response to a 5-mV pulse at −70 mV. Criteria for considering a recording included Rinput > 100 MΩ, Rs < 25 MΩ, with Rs < 30% change. We analyzed spontaneous postsynaptic currents (sPSCs) in 180 s recordings at a given membrane potential with the Mini-Analysis program (version 5.1.4; Synaptosoft, Decatur, GA, USA). Events were characterized by the following parameters: rise time (10–90%), amplitude, and decay time (τ). We discriminated mixed AMPA/KA events in the absence of specific receptor antagonists from the SD given by the fit of each event to determine whether one or two exponentials best fitted the decays (Epsztein et al., 2005). E16–P5 MSNs generating sEPSCs (61 out of 131) or sIPSCs (33 out of 79) with a frequency lower than 0.05 Hz were not included.
We filtered the single-channel currents at 1 kHz (GABAA channels) or 3 kHz (NMDA channels) and digitized them at 10 kHz. We discarded multilevel and short (2 ms) openings during the analysis. To obtain unitary current–voltage (I–V) relationships, we measured the amplitude of unitary GABA and NMDA currents evoked by steps from −120 to +40 mV. Histograms of cursor-measured amplitudes allowed determination of the mean unitary current amplitude at each voltage tested.
Measurements of Vrest and EGABA(A): to determine the action of GABA in a given neuron (depolarizing or hyperpolarizing), one must measure the reversal potential of the GABAA-mediated current [EGABA(A)] and the resting membrane potential (Vrest). However, conventional whole cell recordings introduce a number of errors in these measures in particular in developing neurons. We therefore estimated the value of Vrest from cell-attached recordings of the single-channel NMDA current (iNMDA), which is known to reverse at a membrane potential (Vm) close to 0 mV. We plotted the relationship between iNMDA and the extracellular potential applied to the patch of membrane (Vp) from experimental data (see Figure 9B). This curve [iNMDA = f(Vp)] gives the value of Vp when iNMDA = 0 pA. At this value of Vp, single-channel NMDA current is null because Vm = Vp − Vrest = 0 mV. This allows estimation of Vrest (Vrest = Vp). To estimate [EGABA(A)], we plotted the relationship between the single-channel GABAA current (iGABAA) and Vp. This curve [iGABAA = f(Vp)] gives the value of Vp when iGABAA = 0 pA (see Figure 9A), because by definition when iGABAA is null, Vm = EGABA(A). Therefore, when iGABAA = 0 pA, Vm = Vp − Vrest = EGABA(A) (i.e., EGABA(A) − Vrest = −Vp). By definition, EGABA(A) − Vrest = DFGABA, the driving force (DF) of chloride ions through the GABAA channel (Tyzio et al., 2003). Therefore, when iGABAA = 0 pA, DFGABA = −Vp. Knowing Vrest and DFGABA, it is easy to calculate EGABA(A) = DFGABA + Vrest.
To obtain whole cell current–voltage (I–V) relationships, we measured voltages at the end of each hyperpolarizing current step (950 ms). The inward rectification was detected when the I–V relationship was not linear between −90 and −120 mV. To compare immature and adult MSNs delay of firing in response to depolarizing steps, we measured the first interspike interval (ISI) of the response. We then pooled the slope values of the linear regression lines and compared their distribution as a function of time (Belleau and Warren, 2000). We estimated the threshold potential for Na+ spikes in whole cell current clamp recordings at Vrest (−70 mV for E16–P7 slices and −80 mV for the adult slices) by applying successive intracellular depolarizing steps (duration 950 ms) or in response to cortical stimulation.
Drugs
Drugs were prepared as concentrated stock solutions and diluted in ACSF for bath application: bicuculline 20 μM, Gabazine 5 μM, GABAA receptor antagonists; (2R)-amino-5-phosphonovaleric acid (APV) 40 μM, a NMDA receptor antagonist and (2S*, 3R*)-1-(Phenanthren-2-carbonyl)piperazine-2,3-dicarboxylic acid (PPDA) 100 nM, a NR2C/D subunits antagonist; 6-cyano-7-nitroquinoxaline 2,3-dione (CNQX) 10 μM, and (2,3-dihydroxy-6-nitro-7-sulfamoyl-benzo[f]quinoxaline-2,3-dione)(NBQX) 1–10 μM, AMPA/kainate receptor antagonists. Nifedipine, an L-type Ca2+ channel antagonist; Ω-Conotoxin GVIA, an N-type Ca2+ channel antagonist; Ω-Agatoxin IVA a P/Q type Ca2+ channel antagonist; Isoguvacine 100 μM, a GABAA receptor agonist, was locally pressure-applied. All drugs were purchased from Sigma (St. Louis, MO, USA) except PPDA from Tocris and N or P/Q type antagonists from Alomone Labs.
Motor Behavior
Motion development was assessed in Swiss newborn mice (n = 16) from two different litters (Janvier SAS, Le Genest Saint Isle, France) between postnatal day 2 (P2, day of birth: P0) and P12. C57BL/6 pups could not be tested because of their low weight. We used an open field test to assess overall activity. We tested each pup twice a day, with a 20-min delay between the two tests. We placed the pup on a translucid acrylic plate (24 cm × 16 cm) covered with a silicone gel. Two cameras were placed below the plate. One acquired the pup’s contact points with the floor which appeared as highly contrasted areas, based on the frustrated total internal reflection (FTIR) principle (Han, 2005). We identified the mouse abdominal contact points using custom-made software. The second camera acquired the trajectory of the pup. We calculated from this trajectory the total distance traveled, and the total distance traveled along straight line segments.
Statistics
Average values are presented as means ± SEM and we performed statistical comparisons with Student’s t-test (SigmaStat 3.1, Origin 5.0), Mann–Whitney rank sum test (SigmaStat 3.1) or one way ANOVA (Tukey’s Test as post hoc test; SigmaStat 3.1, Origin 5.0). The appropriate descriptive statistic was chosen on this basis, as denoted in the text. We set the level of significance as p ≤ 0.05. We grouped sets of data without statistical differences as follow: P2 (P0–P2), P6 (P3–P6), P8 (P7–P8), P10 (P9–P10), and P12 (P11–P12) except for Figures 2, 6, and 8 where the ages indicated correspond to the exact age (−5 = E14; −3 = E16; −1 = E18; 0 = P0; 2–30 = P2–P30).
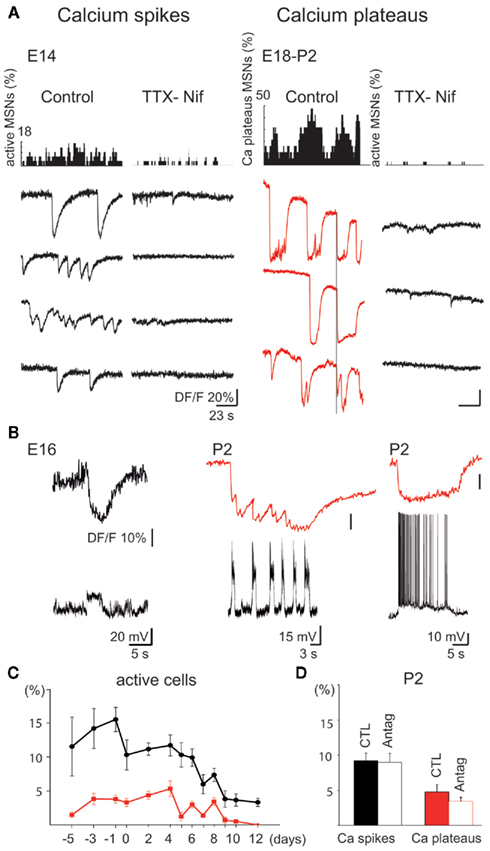
Figure 2. Intrinsically driven Ca2+ events in immature MSNs (E14–P2). (A) Representative histograms (top) indicating the fraction of MSNs evoking Ca2+ spikes (left) or Ca2+ plateaus (right) and corresponding representative calcium fluorescence traces from single MSNs (bottom; Ca2+ spikes in black, Ca2+ plateaus in red) in control ACSF or in the presence of blockers of voltage-gated channels [TTX (1 μM)-Nifedipine (Nif) 10 μM]. In control ACSF, some Ca2+ plateaus were temporally correlated (vertical line). (B) Simultaneous optical (top) and current clamp (bottom) recordings of Ca2+ spikes (Vm = −70 mV, left) and Ca2+ plateaus (Vm = −50 mV, right). (C) Mean percentage (±SEM) of fura 2-loaded cells evoking at least one Ca2+ spike (black) or one Ca2+ plateau (red) as a function of age. (D) Mean percentage (±SEM) of active cells generating at least one Ca2+ spike (black) or one Ca2+ plateau (red) at P2 in control ACSF (CTL) and in the presence of antagonists of ionotropic glutamate and GABAA receptors (APV 40 μM-CNQX 10 μM-bicuculline 10 μM; Antag).
Results
Fura 2-loaded striatal neurons were already active at E14, the youngest age tested. The percent of active cells was 16.8 ± 1.5% between E14 and P0, and did not change significantly over the first postnatal week (P0–P2: 17.5 ± 1.0% of imaged cells, P3–P6:14.4 ± 1.1%; p = 0.07). There were significantly fewer active cells at P7–P8 (8.3 ± 1.2%) and P9–P10 (4.2 ± 0.8%; p = 0.0004 between the two groups P3–P6 and P7–P8, one way ANOVA, n = a total of 177 movies covering 47062 neurons). We then focused specifically on the activity of striatal MSNs. They generated three distinct patterns of activity: Intrinsic voltage-gated Ca2+ spikes (E14–P10), correlated Ca2+ Plateaus (E14–P10) and correlated Ca2+ spikes associated with (GDPs, P5–P7; Crepel et al., 2007; Allene et al., 2008). Of these three, only the latter was sensitive to blockers of glutamate and GABA synaptic transmission.
Embryonic and Early Postnatal MSNs Spontaneously Generate Intrinsically Driven Ca2+ Events in the Absence of Subthreshold K+ Currents
Intrinsic voltage-gated Ca2+ spikes predominated between E14 (11.5 ± 4.3% of imaged cells, n = 2268 neurons in four fields, referred to as 2268/4), and P6 (10.2 ± 2.1%, 3143/12), and were significantly decreased at P10 (3.1 ± 0.9%, 2357/15; p = 0.0008, one way ANOVA; Figure 2A left, Figure 2C). Ca2+ spikes were not necessarily associated with Na+ spikes (Figure 2B left), had a low frequency (0.028 ± 0.004 Hz, 777/18), and a longer time to peak at E14–E18 (1.31 ± 0.08 s, 777/18) than at P0–P5 (0.053 ± 0.006 Hz; 0.92 ± 0.07 s, 207/7; p = 0.004 and p = 0.001 respectively, Student’s t-test) suggesting different Ca2+ channels and/or Ca2+ clearance properties. There were no cell pairs showing correlated Ca2+ spikes at any age (0.2% at E14, 0.6% at P6, and 0% at P10).
Synchronized Ca2+ Plateaus were rare at E14 (1.5 ± 0.4% of imaged cells, 2268/4), peaked at P4 (6.7 ± 1.5%, 1166/5), and absent at P11–P12 (0%, 1350/11; Figure 2A right, C). Ca2+ Plateaus were long lasting Ca2+ events (6.45 ± 2.01 s, 234/22, at E14–E18) that significantly differed from Ca2+ spikes (1.31 ± 0.08 s, 777/19, at E14–E18) in terms of duration (p = 2.2 × 10⁻⁷, Student’s t-test). The percentage of cell pairs with correlated Ca2+ plateaus was around 5% (6% at E14, 5% at P4). Ca2+ plateaus had a similar mean frequency at E18 and P4 (0.014 ± 0.003 vs. 0.017 ± 0.002 Hz; p = 0.8, Student’s t-test) and a similar mean duration (14.4 ± 1.9 vs. 14.5 ± 0.8 s; p = 0.1, Student’s t-test; 107/10 and 89/5). Patch clamp recordings revealed underlying recurrent depolarizations (22 ± 2 mV, 2.3 ± 0.6 s, at a frequency around 0.4 Hz, n = 9) or a single long lasting depolarization (23 ± 6 mV, 10.0 ± 3.7 s, n = 4) that generated Na+ spikes (Figure 2B right).
The blockers of Na+ and Ca2+ voltage-gated channels, TTX (1 μM)–nifedipine (10 μM) decreased threefold the percent of active cells (from 12.4 ± 2.9 to 4.6 ± 2.2% of imaged cells at P2 (Figure 2A). Nifedipine alone at a concentration specific for L-type Ca2+ channels (3 μM) decreased the percent of active cells by 40% (from 13.9 ± 3.6 to 8.4 ± 3.1%; p = 0.04, paired Student’s t-test, 897/4) and ω-Conotoxin GVIA (1 μM), the N-type Ca2+ channel blocker, halved the percent of active cells (from 13.5 ± 1.4%, 9682/33 to 6.4 ± 0.8%, 1321/6; p = 0.0001, Student’s t-test; not shown). In contrast, Ω-Agatoxin IVA (100 nM), the specific blocker of P/Q type channels had no significant effect. Ionotropic glutamate and GABA antagonists did not affect the percentage of Ca2+ spike cells (9.2 ± 1.1 vs. 9.0 ± 1.3% at P2, p = 0.79, paired Student’s t-test) or Ca2+ plateaus cells (Figure 2D). These antagonists also did not significantly affect the coherence between calcium plateaus (4.5% pairs of plateaus cells correlated in the presence of antagonists vs. 5% pairs in control at P2).
The time coherence between some Ca2+ plateaus could be explained by the presence of gap junctions between immature neurons (Crepel et al., 2007). Single MSN recordings with neurobiotin-containing pipettes revealed clusters of 6 ± 1 neurobiotin-labeled neurons at E14–E18 (n = 13/17 patches), but of only two MSNs at P30–P40 (n = 3/38 patches). The majority of clusters were exclusively composed of MSNs (E14–P2, n = 36/37 clusters) and were abundant until P0–P2 (Figure 3). This suggested the presence of gap junctions permeable to neurobiotin at perinatal stages as described in juvenile rodent MSNs (Tepper et al., 1998; Venance et al., 2004) and required for the formation of synaptically connected networks (Todd et al., 2010). But carbenoxolone (100 μM), like mefloquine (25 μM) applied during 10–20 min, similarly reduced the probability of occurrence of all types of immature Ca2+ activities (data not shown, E14–P4, 5653/17). This non-specific effect precluded their use for demonstrating the role of gap junctions in Ca2+ plateaus’ occurrence. These results suggested that Ca2+ spikes and Ca2+ plateaus are non-synaptic, intrinsic, voltage-gated events generated by Na+ and L and N-types Ca2+ channels. To understand how MSNs spontaneously generate intrinsically driven calcium events, we next investigated the development of their intrinsic membrane properties.
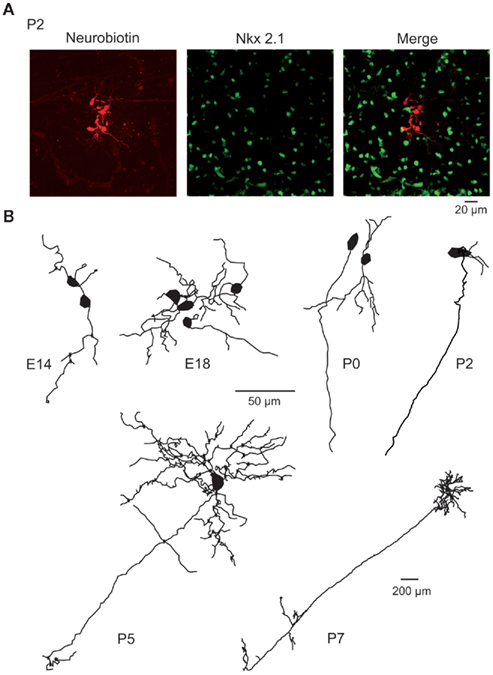
Figure 3. Morphology of embryonic and early postnatal MSNs. (A) Cluster of seven neurobiotin-filled (left) and Nkx2.1-negative (middle) MSNs (merge) revealed by double immunocytochemistry performed after whole cell recording of a single MSN in a P2 striatal slice. (B) Neurolucida reconstruction of neurobiotin-filled Nkx-negative neurons (MSNs) at the indicated ages. Dendrites and axons were MSNs had 2.8 ± 0.3 primary dendrites at E16–E18 (n = 23), 3.9 ± 0.4 at P0 (n = 19), 5.1 ± 1.1 at P2 (n = 9), and 5.8 ± 0.3 at P7 (n = 11). They gave rise to 6–25 dendritic ends (6 at E16–18, 13 at P0, 17 at P2, 18 at P5, and 25 at P7). The total dendritic length was multiplied by 5 between E16–18 and P7 (339 ± 64 μm at E16–18, 646 ± 148 μm at P0, 574 ± 123 μm at P2, 818 ± 161 μm at P5, and 1751 ± 219 μm at P7). Dendritic spines were virtually absent at all ages. Average cell capacitance progressively increased from E16 to P7 (14.3 ± 0.9 pF at P2, n = 47, compared to 51.7 ± 5.3 pF, n = 74 at P30; p < 0.001). Axons coursing down to the globus pallidus were identified in few E18 MSNs but were consistently observed for P5–P7 MSNs. Same scale bar (50 μm) from E14 to P5.
The membrane potential trajectory attributable to the activation of the inwardly rectifying K+ current (IKIR) was not detected in any MSNs at E14, was present in 17% of MSNs at P7 (n = 3/44) and in all MSNs at P10 and P30 (n = 8/8 and 6/6, respectively). It greatly increased from P10 to P30 (Figures 4A,B). Accordingly, bath application of cesium (3 mM), a blocker of IKIR, increased the proportion of active cells by 240% at P6–P10 (from 4.3 ± 1.1 to 10.4 ± 1.7%, 1349/6; p = 0.04 paired Student’s t-test; data not shown). The mean input resistance (Rm) of MSNs was high until P6 and significantly decreased by approximately 75% between P6 and P10 (from 982 ± 129 MΩ at P6, n = 21 to 263 ± 19 MΩ at P10, n = 11; p = 0.004, one way ANOVA; Figure 4C). Spiking threshold (Vthreshold) did not change from P2 to P30 (P2: −32.2 ± 1.7 mV, n = 14 and P30: −30.8 ± 0.8 mV, n = 10; p = 0.51 one way ANOVA) but the instantaneous firing frequency did. The first ISI of a firing train as a function of injected current was stable until P6 and was then significantly reduced between P6 and P10 (1.44 ± 0.14 Hz/pA, n = 11 at P6 vs. 0.91 ± 0.08 Hz/pA, n = 7 at P10; p = 0.03, one way ANOVA) showing an increased delay to spiking at P10 (Figures 4D,E). The depolarization needed to generate spikes calculated as (Vthreshold − Vrest) from whole cell recordings (Figures 4F,G) was significantly lower until P6 than after (23 ± 3 mV at P6, n = 15 and 37 ± 2 mV at P10, n = 6; p = 0.023, one way ANOVA). Vrest measured from unitary NMDA currents was also significantly hyperpolarized between P2 and P10. Using single-channel recordings of NMDARs to provide an accurate measure of Vrest in young neurons (Tyzio et al., 2003; see Results of Figure 9), we found a significant decrease in Vrest between P2 and P10 (−70.0 ± 1.7 mV at P2, −77.0 ± 1.3 mV at P10; n = 11 and 11, respectively; p = 0.009, one way ANOVA test; see Dehorter et al., 2009 for extensive discussion of the method; Figure 4G). These results suggest that until P6, MSNs lack K+ currents like KiR, KD, and probably leak K+ currents as well, including members of the KCNK class expressed in adult MSNs (Shen et al., 2007). Consequently, Rm is high (900 MΩ), Vrest is only 20 mV more hyperpolarized than Vthreshold and there is no spiking delay. Because of this, spontaneous Ca2+ channel openings may occur and give rise to spontaneous Ca2+ events.
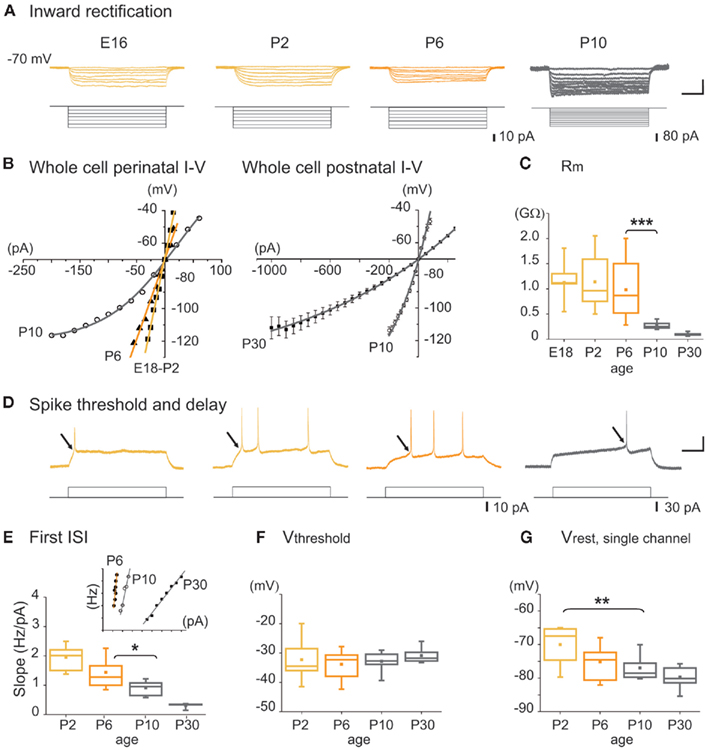
Figure 4. Intrinsic membrane properties of MSNs as a function of age. (A) Representative whole cell current clamp responses of embryonic and postnatal MSNs to intracellular hyperpolarizing steps (Vm = −70 mV). Note the absence of inward rectification before P10. Scale bars: 25 mV; 200 ms. (B) Whole cell I–V relationships at the indicated ages, obtained from experiments in (A). (C) Input membrane resistance (Rm) as a function of age obtained from experiments in a. (D) Representative whole cell current clamp responses to intracellular depolarizing steps (Vm = −70 mV). At E16–E18 few MSNs generated suprathreshold Na+ spikes (14%, n = 1/8), 50% at P0 (n = 3/6), 64% at P2 (n = 16/25), 87% at P5 (n = 21/24), and 100% at P7 (n = 12/12). Scale bars: 25 mV; 200 ms. (E) Instantaneous firing frequency to the first interspike interval (ISI) of a firing train as a function of injected current (insert, scale: 20 Hz, 100 pA). Slope values given by each linear regression lines fitted to frequency curves (correlation coefficient were all >0.9) as a function of postnatal age. (F) Threshold potential (Vthreshold) as a function of age calculated from experiments in d. (G) Resting membrane potential (Vrest) determined from the reversal potential of unitary NMDA currents in MSNs.
Early Postnatal MSNs Generate Correlated Ca2+ Spikes When They Express the NR2C/D NMDA Synaptic Current and Membrane Properties are Still Immature
The first synapse-driven pattern observed in postnatal MSNs was correlated Ca2+ spikes (GDPs), that appeared at P5–P7 (10% of the recordings, 969/5; mean frequency: 0.10 ± 0.05 Hz and mean duration: 0.70 ± 0.10 s, 102/5), and subsequently disappeared. The vast majority of active striatal neurons (84.0 ± 9.7%) were engaged in this activity with a large number of correlated cell pairs (24%), attesting to the large neuronal ensemble that fired together during these events (Figure 5A left). Electrophysiological activity underlying each GDP consisted of bursts of 2–3 Na+ spikes (Figure 5B). Ionotropic glutamate and GABA receptor antagonists abolished GDPs, but left other Ca2+ events (uncorrelated Ca2+ spikes or Ca2+ plateaus) intact (p = 0.02 and 0.52 respectively, paired Student’s t-test; Figures 5A–D). Since GDPs were also suppressed by APV (40 μM) alone, suggesting that NMDA receptors were heavily involved, we tested their sensitivity to PPDA (Feng et al., 2004), the preferential antagonist of NR2C/D NMDA receptors. At 100 nM PPDA removed most of the correlations between neurons (from 45 to 11%). Most of the GDP cells stopped their activity and the few who did not, evoked Ca2+ spikes at a much lower frequency (from 0.17 ± 0.01 to 0.07 ± 0.01 Hz; p = 0.0003, Mann–Whitney test; Figures 5C,D).
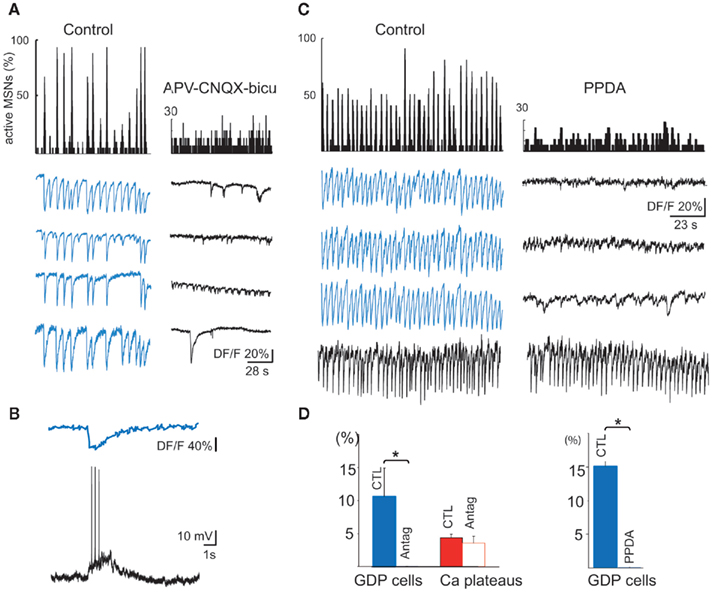
Figure 5. Synapse-driven, correlated Ca2+ events in immature MSNs. (A) Representative histograms (top) indicating the fraction of active MSNs in the field and representative calcium fluorescence traces from MSNs (GDPs, in blue; bottom) in control ACSF (left) or in the presence of antagonists of ionotropic glutamate and GABAA receptors. (B) Simultaneous optical (top) and current clamp (bottom) recordings of GDPs (Vm = −60 mV). (C) Same as in (A) but in the presence of PPDA 100 nM. Note the specific disappearance of correlated GDPs (blue traces) during PPDA application, but not of Ca2+ spikes generated at a different frequency (black trace). (D) Left: mean percentage (±SEM) of active cells generating GDPs (blue) or Ca2+ plateaus (red) in control ACSF (CTL) and in the presence of antagonists of ionotropic glutamate and GABAA receptors (Antag). Right: mean percentage of cells participating in GDPs in control (CTL) or in the presence of PPDA.
To understand the time course of development of the spontaneous synaptic activities afferent to MSNs and that could play a role in the transiently expressed GDPs, we performed separate recordings of glutamatergic and GABAergic synaptic events. Glutamatergic events: the fraction of MSNs exhibiting AMPA- or KA-mediated sEPSCs steadily increased from E16 to E18 (38 and 50%) to a maximum at P5–P7 (100%). The mean frequency of AMPA or KA receptor-mediated EPSCs gradually increased from E16 to E18 (0.11 ± 0.04 and 0.3 ± 0.1 Hz; n = 5 and 5 MSNs) to P30 (1.3 ± 0.7 and 0.9 ± 0.2 Hz; n = 5 and 6 MSNs; p = 0.03 and p = 0.004 respectively, one way ANOVA) but their amplitude (p = 0.3 for AMPA, p = 0.07 for KA, one way ANOVA), rise times and decay times remained constant (Figures 6A–E left and middle). In contrast, the fraction of MSNs showing spontaneous NMDA receptor-mediated EPSCs shifted from 40% at P0 (5/12 cells) to more than 90% at P5–7 (16/18), and decreased thereafter to 30% at P30 (4/12; Figures 6A,B right). Their frequency stayed constant and low (around 0.1 Hz, p = 0.9; one way ANOVA) and also their amplitude (p = 0.9) and rise times but their decay time significantly decreased in the same period (Figures 6C–E right).
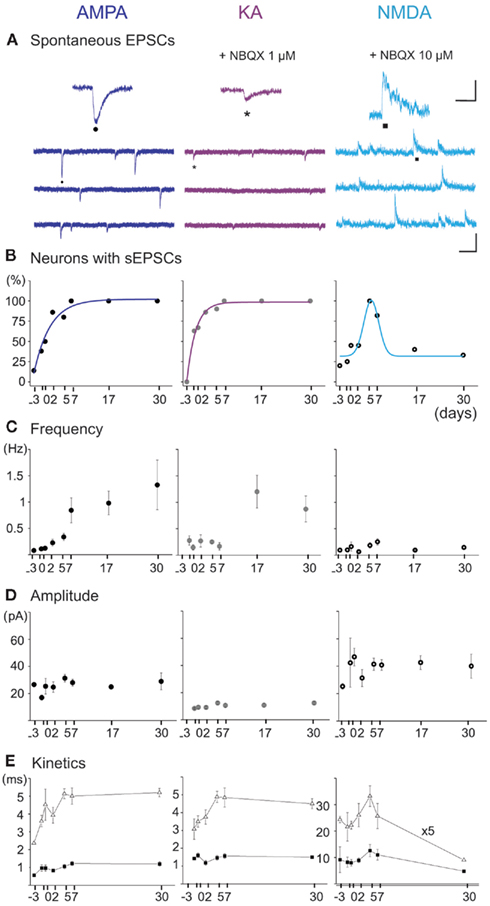
Figure 6. Spontaneous AMPA, KA, and NMDA receptor-mediated postsynaptic currents (EPSCs) from E16 to P30 MSNs. (A) Representative voltage-clamp recordings of spontaneous AMPA (VH = −80 mV), KA (VH = −80 mV under NBQX 1 μM), and NMDA (VH = + 40 mV under NBQX 10 μM) receptor-mediated EPSCs (CsGlu intrapipette solution) at P6. Scale: 100 pA, 200 ms (AMPA and KA), and 2 s (NMDA). (Top) Close up of each spontaneous current (Insets: 50 pA, 125 ms). (B) Fraction of the recorded MSNs which displayed AMPA, KA, and NMDA sEPSCs, as a function of age (n = 43, 54, and 36 MSNs). (C) Frequency and (D) amplitude of AMPA, KA, and NMDA receptor-mediated sEPSCs as a function of age. (E) Kinetics of the three types of sEPSCs. The rise times remained stable from E18 to P30 for AMPA (0.7 ± 0.1 vs. 0.8 ± 0.2 ms; p = 0.83), KA (1.0 ± 0.3 vs. 1.1 ± 0.2 ms; p = 0.84), and NMDA (7.1 ± 0.8 vs. 5.2 ± 1.1 ms; p = 0.33) currents. The decay times (τ) stayed constant for AMPA (1.8 ± 0.3 ms at E18 vs. 2.9 ± 0.5 ms at P30, p = 0.16) and KA (2.1 ± 0.3 ms at E18 vs. 2.9 ± 0.3 at P30, p = 0.08) currents whereas it significantly decreased for NMDA currents (203 ± 16 ms at P7, n = 9/11 vs. 87 ± 9 ms at P30, n = 4/12; p = 0.009).
Since the cortex provides a major source of glutamatergic inputs to MSNs, we studied the development of these inputs. DiI labeling of the neocortex (n = 5) revealed fiber staining in the striatum as early as E16 (Figure 7A). These inputs are functional, because cortical stimulation evoked glutamatergic EPSPs in 10% of MSNs at E16 (n = 2/18), 64% at P0–P2 (n = 20/31), 75% at P5–P7 (n = 9/12), 80% at P10 (n = 9/11), and 86% at P30 (n = 12/14). This was associated with a dramatic decrease in EPSP duration between P6 and P30 (−82%) and of the number of spikes they generated. At P2, EPSPs (311 ± 32 ms; n = 6) generated 1 spike or spikelet, at P6 (420 ± 41 ms; n = 8) 2–5 spikes, while by P10 EPSPs had shortened to 276 ± 36 ms (n = 7; p = 0.03, between P6 and P10, one way ANOVA) and only gave rise to one spike as at P30 (74 ± 7 ms, n = 7; Figure 7B). At P6, the large EPSPs (and GDPs) were mostly blocked by the NMDA receptor antagonist APV, suggesting that NMDA receptors were heavily involved in early cortico-striatal activity. The long decay of P6 EPSPs suggested a preferential contribution of NR2C/D subunits of NMDA receptors with their long kinetics and reduced voltage-dependent magnesium block (Monyer et al., 1994). The NR2C/D subunit inhibitor PPDA (100 nM; Feng et al., 2004) significantly reduced evoked EPSPs at P6 (−54%; p = 0.01, n = 6; paired Student’s t-test) but not at P2 (−13%; p = 0.18, n = 5; paired Student’s t-test) or P10 (−9%; p = 0.15, n = 5; paired Student’s t-test; Figure 7C), showing a restricted participation of NR2C/D before and after P6. The presence of a large NR2C/D-mediated NMDA component enables cortico-striatal synapses to generate large EPSCs associated with bursts of spikes at P5–P7, but not at P10.
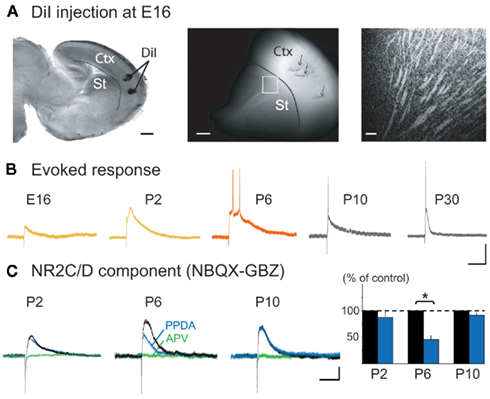
Figure 7. Embryonic presence of cortico-striatal EPSPs and postnatal transient expression of the NR2C/D-mediated NMDA component. (A) DiI injections in neocortex in an E16 sagittal slice (left). DiI-labeled cortical fibers observed in the striatum after 15 days of incubation, as shown in the confocal image (right) of the region indicated by a square (middle). Scale bars: 500, 200, and 50 μm. (B) Whole cell current clamp responses of embryonic and postnatal MSNs to intra-cortical stimulation in the absence of synaptic blockers (Vm = −70 mV), scale bars: 25 mV, 100 ms. (C) Effect of PPDA (100 nM, 15 min, blue) and APV (40 μM, green) on the NBQX (10 μM)/gabazine (GBZ, 10 μM) insensitive whole cell EPSP (black) at P2 (n = 5), P6 (n = 6), and P10 (n = 5), scale bars 10 mV, 250 ms.
GABAergic events
The fraction of MSNs exhibiting spontaneous GABAAR-mediated currents steadily increased from E16 to a maximum at P5–P7 and the mean frequency of these currents (GABAA PSCs) progressively increased from E16 up to P30 (519 MSNs; Figures 8A–C). The DF of GABA (DFGABA), determined from single-channel recordings of GABAARs (see Materials and Methods; Tyzio et al., 2003), was similarly depolarizing by 15 mV at P2 (+15.3 ± 3.4 mV; n = 8 MSNs, Figures 9A,B) and P30 (Dehorter et al., 2009; +16.1 ± 1.9 mV, n = 11; p = 0.8, Student’s t-test). To estimate  , we plotted the relationship between the single-channel GABAA current (iGABAA) and the pipette potential (Vp). This curve [iGABAA = f(Vp)] gives the value of Vp when iGABAA = 0 pA (Figures 9A,B right), because when iGABAA is null,
  Therefore, when iGABAA = 0 pA,
  (i.e.,
  ). By definition,
  , the DF of chloride ions through the GABAA channel (Tyzio et al., 2003). Therefore, when
  ,
,  Knowing Vrest and
  we can calculate the reversal potential for GABAA,
  The reversal potential of GABAA currents was 10 mV more depolarized at P2 than at P30 (Figure 9C). These values are based on the assumption that the NMDA current reverses at 0 mV in MSNs. Although an error of 5 mV may exist (Tyzio et al., 2003), the comparison of Vrest and EGABA obtained with the same methods at P2 and P30 confirms the validity of our conclusions. Therefore, GABAergic synapses depolarize MSNs from Vrest to a value closer to the action potential threshold than in the adult (Misgeld et al., 1982; Koos and Tepper, 1999). However, GABA does not excite immature MSNs. Focal applications of the GABAA receptor agonist isoguvacine failed to generate action potentials in cell-attached recordings from P2 (n = 6, Figure 9D) or P5 (n = 7, data not shown) MSNs. Similarly, stimulation of the striatal neuropil failed to evoke action potentials in cell-attached recordings of MSNs in the continuous presence of ionotropic glutamate receptors antagonists (data not shown).
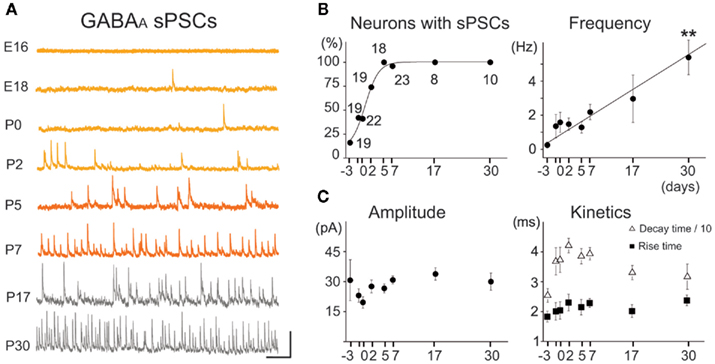
Figure 8. Spontaneous GABAA postsynaptic currents (GABAA-sPSCs) from E16 to P30 MSNs. (A) Voltage-clamp recordings of GABAA-sPSCs at the indicated ages with CsGlu intrapipette solution (VH = +10 mV). Scale: 50 pA, 500 ms. (B) Fraction of recorded MSNs which displayed GABAA-sPSCs and frequency of GABAA-sPSCs (R > 0.9) from E16 to P30 (for comparison, 2.1 ± 0.4 Hz at P7 vs. 5.4 ± 1.0 Hz at P30, n = 22 and n = 10, respectively; p < 0.01, one way ANOVA). (C) Amplitude and kinetics of GABAA-sPSCs did not significantly change from E16 to P30 (p > 0.05 for both, one way ANOVA; 30.3 ± 2.0 pA at E16 vs. 30.0 ± 4.3 pA at P30, n = 19 and n = 10, respectively; one way ANOVA). Neither the rise or decay time constants of GABAergic PSCs differed significantly during development: rise time (ν) around 2 ms (2.3 ± 0.1 ms at P7 vs. 2.4 ± 0.2 ms at P30), and decay time (Δ) around 35 ms (39.3 ± 2.1 ms at P7 vs. 32.0 ± 4.2 ms at P30; n = 22 at P7 and n = 10 at P30).
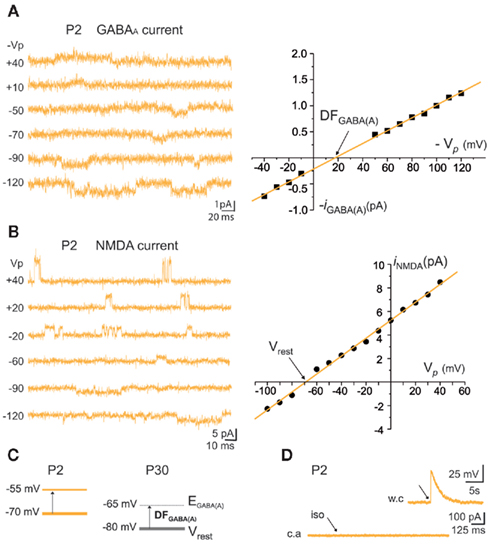
Figure 9. Resting membrane potential (Vrest) and reversal potential for GABAA-mediated currents [EGABA(A)] of immature MSNs. (A) Representative cell-attached recordings of unitary GABAA currents at the indicated pipette potential (Vp in mV) and corresponding I–V relationship of the recorded GABAA currents to determine the driving force (DF) for GABA (DFGABA = +17 mV). (B) Representative cell-attached recordings of unitary NMDA currents at the indicated Vp (in mV) and corresponding I–V relationship of the recorded currents to determine Vrest (−67 mV). (C) DFGABA was around 15 mV at P2 and P30 (Dehorter et al., 2009), which gives EGABA(A) = −55 mV at P2 and −65 mV at P30. (D) Pressure application of isoguvacine (iso, 100 μM) during cell-attached recordings. Inset shows the depolarization evoked by the same pressure application of isoguvacine during whole cell recording of the same MSN, to test the pressure application of isoguvacine. For DFGABA calculation Section “Materials and Methods,” analysis of electrophysiological data.
The above data show that striatal neurons generate GDPs during a transient period when all MSNs are connected to glutamatergic and GABAergic neurons and still exhibit immature membrane properties (see Figure 4). There is a more efficient GABAergic depolarizing drive than at P30 that may participate in the GDPs of P5–P7 MSNs (together with glutamatergic EPSPs; Bracci and Panzeri, 2006) but these events are mainly driven by cortico-striatal synapses at a time where cortical neurons also generate GDPs (Allene et al., 2008).
Intrinsic and Synapse-Driven Immature Activity Derive from Distinct Neural Ensembles
Because approximately 90% of the P5–P7 striatal networks did not generate GDPs at the time of recording, we wanted to understand whether synapse formation in some way altered the dynamics of the network. We compared network-wide activity at P2–P3 (when synapse density is low) to that at P5–P7 (when all MSNs are innervated by glutamatergic and GABAergic inputs). We found that both frequency and duration of events changed from P2–P3 to P5–P7 (Figures 10A,B). The distributions of mean event frequency significantly differed between P2–P3 and P5–P7 (Mann–Whitney U-test; nP2 = 18, nP6 = 33; U = 320; p = 0.02). Similarly, the distributions of median event duration significantly differed between P2–P3 and P5–P7 (U = 569.5, p = 0.0046). To gage the size of these differences between P2–P3 and P5–P7, we used k-means clustering to assign each recording to either P2–P3 or P5–P7 on the basis of its event statistics. We found that both duration (70% correct assignments) and frequency (64% correct) reliably indicated a recording’s developmental stage. Thus, the switch from intrinsically to synaptically driven activity reliably decreased duration and increased the frequency of calcium events in the immature striatal network.
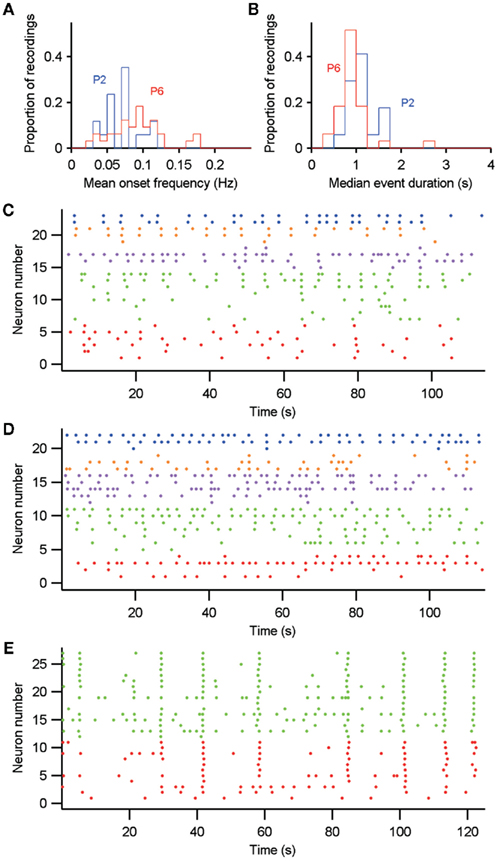
Figure 10. Comparison of intrinsically (P2–P3) and synaptically (P5–P7) driven immature spontaneous Ca2+ activity. (A,B) Distributions of each recording’s mean event frequency and median event duration for P2–P3 (P2) and P5–P7 (P6). (C,D) Example recordings at P2 (C) and P6 (D) with significant neural ensemble structure; both contain five groups. (E) Neural ensembles within GDP-driven network-wide synchronization at P6. In (C–E), neuron activity is color-coded by ensemble membership, as determined by the algorithm of Humphries (2011) – Section “Materials and Methods.”
Both P2–P3 and P5–P7 networks were capable of showing spontaneous formation of neural ensembles (Figures 10C,D). We found markedly more P5–P7 (43%, 9/21) than P2–P3 (29%, 4/18) recordings with significant ensemble structure. Conversely, these P2–P3 recordings contained more ensembles (range 5–9) than the P5–P7 recordings (range 2–6). We also found that the P5–P7 recordings with GDP-driven, network-wide synchronization could be sub-divided into ensembles that indicated the delay in a neuron’s participation of the network-wide synchronization (Figure 10E). These results suggest that the transition from intrinsic to synaptically driven activity promoted the appearance of putative cell assemblies.
Abrupt Loss of GDPs and Switch to Adult-Like Intrinsic Properties Occurs before Coordinated Locomotion
As shown in Figures 11A–E, many MSN characteristics changed abruptly between P6 and P10. MSNs become mostly silent at P10, entering an adult-like phase. AMPA or KA receptor-mediated signals are probably not involved in the extinction of early spontaneous activity in MSNs because their frequency continuously increases with age. In contrast, the switch in other properties such as the abrupt loss of NR2C/D, expression of IKIR, decrease in Rm, hyperpolarization of Vrest, and hyperpolarization of  all coincided with the silencing of MSNs.
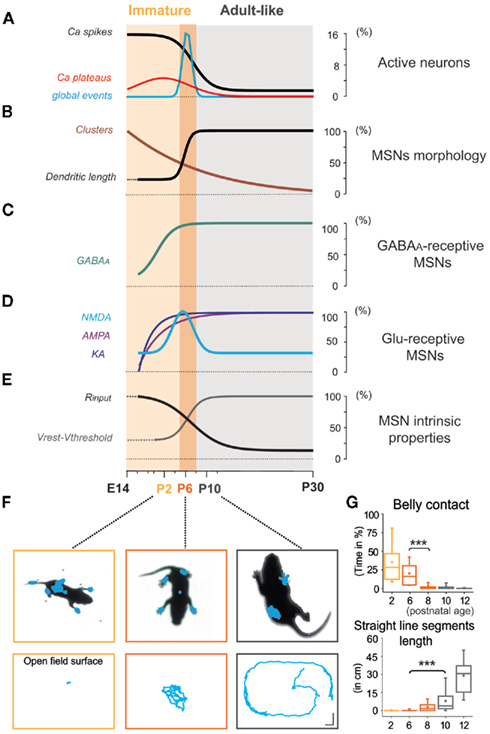
Figure 11. Medium spiny neurons have entered the adult-like phase before pups start quadruped locomotion. (A–E) Immature (light orange) and adult-like (gray) phases are separated by a transitory immature period (orange). Development of MSN intrinsic and synaptic properties from experiments of Figures 1–7. (F) Photos of representative postnatal mice showing the number and extent of pressure points (in blue) at P2, P6, and P10 (top). Body motion of the same pups in the open field (calibration bars 3 cm) during a 1-min test (bottom). (G) Mean percentage (±SEM) of belly contact time (n = 16, top) and total distance traveled along straight line segments (n = 14, bottom) as a function of postnatal age (see Movies S1–S3 in Supplementary Material).
In order to identify when the transition of MSNs from immature to adult-like state occurs in relation to a motor behavioral output, we quantified the maturation of pup body contacts and motion. At P2, prior to the onset of quadruped ambulation, the duration of abdominal contact with the cage surface was high (35.3 ± 4.9% of total time), then progressively decreased at P3–P6 (17.8 ± 1.6%) and P7–P8 (2.9 ± 0.7%), disappearing by P9–P10 (n = 16; p = 1 × 10⁻⁸ between P3–P6 and P7–P8; one way ANOVA; Figures 11F,G, top). Body motion was practically absent at P2, with pivoting and crawling predominating in P3–P7 pups. The total distance pups traveled along straight line segments underwent a marked increase from P3 to P6 (0.2 ± 0.1 cm, n = 56) to P9–P10 (7.9 ± 1.6 cm, n = 28; p = 0.0002, one way ANOVA test). By P12 pups traversed relatively large distances (28.9 ± 3.5 cm, n = 14; p = 1 × 10⁻¹² compared to P9–P10; one way ANOVA test; Figures 11F,G, bottom). Thus, spontaneous displacement with the ventral surface of the body held above the floor was first observed in P9–P10 mouse pups, in parallel with the chronology of MSN silencing.
Discussion
Our results show that MSNs, the dominant neuronal population of the striatum, generate immature patterns of activity at embryonic and early postnatal stages that are reminiscent of the patterns observed in developing cortical structures (Garaschuk et al., 2000; Corlew et al., 2004; Allene et al., 2008). This confirms the similarity between developmental activities of networks independently of their neuronal structure and final function (Ben-Ari, 2001). In the middle of the second postnatal week, MSNs shift to an adult-like pattern characterized by little activity in vitro (Carrillo-Reid et al., 2008), just before pups lift their body and begin to walk. Underlying this transition is a change in the fundamental characteristics of MSNs (Figure 11). This suggests that the development of MSNs and striatal network activity parallels the development of locomotor structures and pathways (Grillner et al., 2005).
Two features of immature MSNs emerge as central players in this progression. (i) Intrinsic voltage-gated Ca2+ currents: we propose that the reduced K+ currents and the consequent depolarized resting membrane potential allow spontaneous opening of N and L-type voltage-gated Ca2+ channels, then quieted near P10 by resting membrane potential hyperpolarization and/or developmental changes of Ca2+ channel properties; (ii) The transient NR2C/D-mediated cationic current: the expression of long lasting NMDA EPSCs mediated by the NR2C/D receptor subunit is a general feature of different developing brain structures (Monyer et al., 1994; Nansen et al., 2000; Logan et al., 2007; Dravid et al., 2008). NMDA receptor-mediated EPSCs are conspicuous in cortico-striatal neurons as early as P2 (see Hurst et al., 2001) for contradictory results). Using a dose of PPDA (100 nM) that preferentially antagonizes NR2C/D subunits (KD = 0.096 and 0.130 μM, respectively; Traynelis et al., 2010), we demonstrate that the window of operation of NR2C/D-mediated events is highly restricted to P5–P8 (Dunah et al., 1996). Therefore, as in other brain structures, immature neurons first generate long lasting synapse-driven patterns of activity that include large NMDA receptor driven currents. These currents, together with voltage-gated Ca2+ currents, trigger the large calcium fluxes needed for a wide range of essential developmental functions including neuronal growth, synapse formation, and the formation of neuronal ensembles (Spitzer, 2006). Indeed, we demonstrated that during this P5–P8 window, network-wide changes in calcium event statistics correlated with the reliable formation of neural ensembles.
Our observations also provide interesting insights concerning the generation of GDPs that have been observed in a wide range of brain networks but investigated primarily in cortical structures (Ben-Ari et al., 2007). GDPs are generated both by depolarizing GABAergic and glutamatergic notably NMDA receptors-mediated currents. The striatum is an interesting site to investigate the debated role of glutamate in GDPs generation because it has in contrast with other investigated structures no internal glutamatergic neurons. Clearly, the maturation of the glutamatergic cortico-striatal inputs is instrumental in the emergence of GDPs and particularly the long lasting NR2C/D component.
Adesnik et al. (2008) suggested that modest activity through NMDA receptors prevents the constitutive trafficking of AMPA receptors to the postsynaptic density via an LTD type mechanism. This ensures that synapses become functional only after strong or correlated activity, when enough calcium entry through these NMDA receptors overrides the inhibitory pathway and drives AMPA receptor insertion. This surge is provided by bursts of action potentials during GDPs and NMDA-mediated cortico-striatal EPSPs as shown here. From this perspective the elimination of the long lasting NR2C/D component in cortico-striatal EPSPs would constitute a gating device to induce the expression of AMPAergic currents in MSNs.
Therefore, our results suggest an intrinsic program that switches MSN activity from an immature low threshold activation state to a high threshold state in the adult with a low activity profile during resting conditions, coincident with the emergence of locomotion. In a more conceptual frame, in addition to ubiquitous developmental patterns of activity, there would be a superimposed sequence, unique to each brain structure, which takes over at an appropriate time to enable the generation of patterns required for specific functions. The adult-like state described here is accompanied by several additional factors including the development of the dendritic arbor and spines of MSNs and the increased density of asymmetric glutamatergic synapses (Tepper et al., 1998; Belleau and Warren, 2000), a second wave of nigro-striatal dopaminergic innervation (Moon and Herkenham, 1984), the development of thalamo-cortical loops, and sensori-motor cortex (Gianino et al., 1999; Vinay et al., 2002; Allene et al., 2008; Evrard and Ropert, 2009). It is also accompanied functionally by a dopamine- and D2 receptor-dependent decrease in the efficacy of glutamatergic transmission that takes place in vivo during weeks 2–3 of postnatal development and is a consequence of a number of physiological changes in the maturing striatum (Choi and Lovinger, 1997; Tang et al., 2001). Also, comparison of the present data with that obtained in rodents lacking dopaminergic substantia nigra neurons (pitx3−/− mice for example, Smidt et al., 2004), will allow understanding of the early role of endogenous dopamine on the development of the striatal network (Ohtani et al., 2003; Goffin et al., 2010).
Finally, present observations may be of clinical relevance because adult MSNs from the R6/2 rodent model of Huntington’s disease resemble immature MSNs described here in several respects, including an increased input resistance, depolarized resting membrane potential, low level of inwardly and outwardly rectifying K+ currents (Ariano et al., 2005), increased sensitivity to NMDA receptor activation (Cepeda et al., 2001) and decreased sensitivity of NMDA receptors to Mg2+ block (Starling et al., 2005).
Conflict of Interest Statement
The authors declare that the research was conducted in the absence of any commercial or financial relationships that could be construed as a potential conflict of interest.
Acknowledgments
The RCE:LoxP reporter strain was a gift of the Fishell laboratory. We thank R. Cossart, D. Aronov, and P. Bonifazi who developed the analysis method of the imaging data, J. Gallego for the use of the motricity platform facility and Y. Ben Ari for helpful discussions. This work was supported by grants from Institut National de La Santé et de la Recherche Médicale (INSERM), Fédération pour la Rechercher sur le Cerveau (FRC), Association Française contre les Myophaties (AFM), and Fondation Motrice. Nathalie Dehorter held a studentship from Région Provence Alpes Côte d’Azur, Neuroservice (Dir B. Buisson), and Association France Parkinson.
Supplementary Material
The Supplementary Material for this article can be found online at http://www.frontiersin.org/cellular_neuroscience/10.3389/fncel.2011.00024/abstract
References
Adesnik, H., Li, G., During, M. J., Pleasure, S. J., and Nicoll, R. A. (2008). NMDA receptors inhibit synapse unsilencing during brain development. Proc. Natl. Acad. Sci. U.S.A. 105, 5597–5602.
Allene, C., Cattani, A., Ackman, J. B., Bonifazi, P., Aniksztejn, L., Ben-Ari, Y., and Cossart, R. (2008). Sequential generation of two distinct synapse-driven network patterns in developing neocortex. J. Neurosci. 28, 12851–12863.
Ariano, M. A., Cepeda, C., Calvert, C. R., Flores-Hernandez, J., Hernandez-Echeagaray, E., Klapstein, G. J., Chandler, S. H., Aronin, N., DiFiglia, M., and Levine, M. S. (2005). Striatal potassium channel dysfunction in Huntington’s disease transgenic mice. J. Neurophysiol. 93, 2565–2574.
Belleau, M. L., and Warren, R. A. (2000). Postnatal development of electrophysiological properties of nucleus accumbens neurons. J. Neurophysiol. 84, 2204–2216.
Ben-Ari, Y. (2002). Excitatory actions of gaba during development: the nature of the nurture. Nat. Rev. Neurosci. 3, 728–739.
Ben-Ari, Y., Gaiarsa, J. L., Tyzio, R., and Khazipov, R. (2007). GABA: a pioneer transmitter that excites immature neurons and generates primitive oscillations. Physiol. Rev. 87, 1215–1284.
Blankenship, A. G., and Feller, M. B. (2010). Mechanisms underlying spontaneous patterned activity in developing neural circuits. Nat. Rev. Neurosci. 11, 18–29.
Bonifazi, P., Goldin, M., Picardo, M. A., Jorquera, I., Cattani, A., Bianconi, G., Represa, A., Ben-Ari, Y., and Cossart, R. (2009). GABAergic hub neurons orchestrate synchrony in developing hippocampal networks. Science 326, 1419–1424.
Bracci, E., and Panzeri, S. (2006). Excitatory GABAergic effects in striatal projection neurons. J. Neurophysiol. 95, 1285–1290.
Carrillo-Reid, L., Tecuapetla, F., Tapia, D., Hernandez-Cruz, A., Galarraga, E., Drucker-Colin, R., and Bargas, J. (2008). Encoding network states by striatal cell assemblies. J. Neurophysiol. 99, 1435–1450.
Cepeda, C., Ariano, M. A., Calvert, C. R., Flores-Hernandez, J., Chandler, S. H., Leavitt, B. R., Hayden, M. R., and Levine, M. S. (2001). NMDA receptor function in mouse models of Huntington disease. J. Neurosci. Res. 66, 525–539.
Choi, S., and Lovinger, D. M. (1997). Decreased probability of neurotransmitter release underlies striatal long-term depression and postnatal development of corticostriatal synapses. Proc. Natl. Acad. Sci. U.S.A. 94, 2665–2670.
Corlew, R., Bosma, M. M., and Moody, W. J. (2004). Spontaneous, synchronous electrical activity in neonatal mouse cortical neurones. J. Physiol. 560, 377–390.
Crepel, V., Aronov, D., Jorquera, I., Represa, A., Ben-Ari, Y., and Cossart, R. (2007). A parturition-associated nonsynaptic coherent activity pattern in the developing hippocampus. Neuron 54, 105–120.
Deacon, T. W., Pakzaban, P., and Isacson, O. (1994). The lateral ganglionic eminence is the origin of cells committed to striatal phenotypes: neural transplantation and developmental evidence. Brain Res. 668, 211–219.
Dehorter, N., Guigoni, C., Lopez, C., Hirsch, J., Eusebio, A., Ben-Ari, Y., and Hammond, C. (2009). Dopamine-deprived striatal GABAergic interneurons burst and generate repetitive gigantic IPSCs in medium spiny neurons. J. Neurosci. 29, 7776–7787.
Dravid, S. M., Prakash, A., and Traynelis, S. F. (2008). Activation of recombinant NR1/NR2C NMDA receptors. J. Physiol. 586, 4425–4439.
Dunah, A. W., Yasuda, R. P., Wang, Y. H., Luo, J., vila-Garcia, M., Gbadegesin, M., Vicini, S., and Wolfe, B. B. (1996). Regional and ontogenic expression of the NMDA receptor subunit NR2D protein in rat brain using a subunit-specific antibody. J. Neurochem. 67, 2335–2345.
Epsztein, J., Represa, A., Jorquera, I., Ben-Ari, Y., and Crepel, V. (2005). Recurrent mossy fibers establish aberrant kainate receptor-operated synapses on granule cells from epileptic rats. J. Neurosci. 25, 8229–8239.
Evrard, A., and Ropert, N. (2009). Early development of the thalamic inhibitory feedback loop in the primary somatosensory system of the newborn mice. J. Neurosci. 29, 9930–9940.
Feng, B., Tse, H. W., Skifter, D. A., Morley, R., Jane, D. E., and Monaghan, D. T. (2004). Structure-activity analysis of a novel NR2C/NR2D-preferring NMDA receptor antagonist: 1-(phenanthrene-2-carbonyl) piperazine-2,3-dicarboxylic acid. Br. J. Pharmacol. 141, 508–516.
Garaschuk, O., Linn, J., Eilers, J., and Konnerth, A. (2000). Large-scale oscillatory calcium waves in the immature cortex. Nat. Neurosci. 3, 452–459.
Gianino, S., Stein, S. A., Li, H., Lu, X., Biesiada, E., Ulas, J., and Xu, X. M. (1999). Postnatal growth of corticospinal axons in the spinal cord of developing mice. Brain Res. Dev. Brain Res. 112, 189–204.
Goffin, D., Ali, A. B., Rampersaud, N., Harkavyi, A., Fuchs, C., Whitton, P. S., Nairn, A. C., and Jovanovic, J. N. (2010). Dopamine-dependent tuning of striatal inhibitory synaptogenesis. J. Neurosci. 30, 2935–2950.
Grillner, S., Hellgren, J., Menard, A., Saitoh, K., and Wikstrom, M. A. (2005). Mechanisms for selection of basic motor programs–roles for the striatum and pallidum. Trends Neurosci. 28, 364–370.
Groc, L., Gustafsson, B., and Hanse, E. (2002). Spontaneous unitary synaptic activity in CA1 pyramidal neurons during early postnatal development: constant contribution of AMPA and NMDA receptors. J. Neurosci. 22, 5552–5562.
Han, J. Y. (2005). “Low-cost multi-touch sensing through frustrated total internal reflection,” in Proceedings of the 18th Annual ACM Symposium on User Interface Software and Technology – UIST (New York, NY: ACM Press), 115–118.
Huberman, A. D., Feller, M. B., and Chapman, B. (2008). Mechanisms underlying development of visual maps and receptive fields. Annu. Rev. Neurosci. 31, 479–509.
Humphries, M. D. (2011). Spike-train communities: finding groups of similar spike trains. J. Neurosci. 31, 2321–2336.
Hurst, R. S., Cepeda, C., Shumate, L. W., and Levine, M. S. (2001). Delayed postnatal development of NMDA receptor function in medium-sized neurons of the rat striatum. Dev. Neurosci. 23, 122–134.
Koos, T., and Tepper, J. M. (1999). Inhibitory control of neostriatal projection neurons by GABAergic interneurons. Nat. Neurosci. 2, 467–472.
Logan, S. M., Partridge, J. G., Matta, J. A., Buonanno, A., and Vicini, S. (2007). Long-lasting NMDA receptor-mediated EPSCs in mouse striatal medium spiny neurons. J. Neurophysiol. 98, 2693–2704.
Misgeld, U., Wagner, A., and Ohno, T. (1982). Depolarizing IPSPs and Depolarization by GABA of rat neostriatum cells in vitro. Exp. Brain Res. 45, 108–114.
Monyer, H., Burnashev, N., Laurie, D. J., Sakmann, B., and Seeburg, P. H. (1994). Developmental and regional expression in the rat brain and functional properties of four NMDA receptors. Neuron 12, 529–540.
Moon, E. S., and Herkenham, M. (1984). Comparative development of striatal opiate receptors and dopamine revealed by autoradiography and histofluorescence. Brain Res. 305, 27–42.
Nansen, E. A., Jokel, E. S., Lobo, M. K., Micevych, P. E., Ariano, M. A., and Levine, M. S. (2000). Striatal ionotropic glutamate receptor ontogeny in the rat. Dev. Neurosci. 22, 329–340.
Nimmerjahn, A., Kirchhoff, F., Kerr, J. N., and Helmchen, F. (2004). Sulforhodamine 101 as a specific marker of astroglia in the neocortex in vivo. Nat. Methods 1, 31–37.
Nobrega-Pereira, S., Kessaris, N., Du, T., Kimura, S., Anderson, S. A., and Marin, O. (2008). Postmitotic Nkx2-1 controls the migration of telencephalic interneurons by direct repression of guidance receptors. Neuron 59, 733–745.
Ohtani, N., Goto, T., Waeber, C., and Bhide, P. G. (2003). Dopamine modulates cell cycle in the lateral ganglionic eminence. J. Neurosci. 23, 2840–2850.
Olsson, M., Bjorklund, A., and Campbell, K. (1998). Early specification of striatal projection neurons and interneuronal subtypes in the lateral and medial ganglionic eminence. Neuroscience 84, 867–876.
Shen, W., Tian, X., Day, M., Ulrich, S., Tkatch, T., Nathanson, N. M., and Surmeier, D. J. (2007). Cholinergic modulation of Kir2 channels selectively elevates dendritic excitability in striatopallidal neurons. Nat. Neurosci. 10, 1458–1466.
Smidt, M. P., Smits, S. M., Bouwmeester, H., Hamers, F. P., van der Linden, A. J., Hellemons, A. J., Graw, J., and Burbach, J. P. (2004). Early developmental failure of substantia nigra dopamine neurons in mice lacking the homeodomain gene Pitx3. Development 131, 1145–1155.
Sousa, V. H., Miyoshi, G., Hjerling-Leffler, J., Karayannis, T., and Fishell, G. (2009). Characterization of Nkx6-2-derived neocortical interneuron lineages. Cereb. Cortex 19(Suppl. 1), i1–i10.
Starling, A. J., Andre, V. M., Cepeda, C., de, L. M., Chandler, S. H., and Levine, M. S. (2005). Alterations in N-methyl-D-aspartate receptor sensitivity and magnesium blockade occur early in development in the R6/2 mouse model of Huntington’s disease. J. Neurosci. Res. 82, 377–386.
Tang, K., Low, M. J., Grandy, D. K., and Lovinger, D. M. (2001). Dopamine-dependent synaptic plasticity in striatum during in vivo development. Proc. Natl. Acad. Sci. U.S.A. 98, 1255–1260.
Tepper, J. M., Koos, T., and Wilson, C. J. (2004). GABAergic microcircuits in the neostriatum. Trends Neurosci. 27, 662–669.
Tepper, J. M., Sharpe, N. A., Koos, T. Z., and Trent, F. (1998). Postnatal development of the rat neostriatum: electrophysiological, light- and electron-microscopic studies. Dev. Neurosci. 20, 125–145.
Todd, K. L., Kristan, W. B. Jr., and French, K. A. (2010). Gap junction expression is required for normal chemical synapse formation. J. Neurosci. 30, 15277–15285.
Traynelis, S. F., Wollmuth, L. P., McBain, C. J., Menniti, F. S., Vance, K. M., Ogden, K. K., Hansen, K. B., Yuan, H., Myers, S. J., Dingledine, R., and Sibley, D. (2010). Glutamate receptor ion channels: structure, regulation, and function. Pharmacol. Rev. 62, 405–496.
Tyzio, R., Ivanov, A., Bernard, C., Holmes, G. L., Ben-Ari, Y., and Khazipov, R. (2003). Membrane potential of CA3 hippocampal pyramidal cells during postnatal development. J. Neurophysiol. 90, 2964–2972.
Van Der Kooy, D., and Fishell, G. (1987). Neuronal birthdate underlies the development of striatal compartments. Brain Res. 401, 155–161.
Venance, L., Glowinski, J., and Giaume, C. (2004). Electrical and chemical transmission between striatal GABAergic output neurones in rat brain slices. J. Physiol. 559, 215–230.
Vinay, L., Brocard, F., Clarac, F., Norreel, J. C., Pearlstein, E., and Pflieger, J. F. (2002). Development of posture and locomotion: an interplay of endogenously generated activities and neurotrophic actions by descending pathways. Brain Res. Brain Res. Rev. 40, 118–129.
Keywords: development, basal ganglia, striatum, immature activity, locomotion, patch clamp, two-photons imaging, mouse pup
Citation: Dehorter N, Michel FJ, Marissal T, Rotrou Y, Matrot B, Lopez C, Humphries MD and Hammond C (2011) Onset of pup locomotion coincides with loss of NR2C/D-mediated cortico-striatal EPSCs and dampening of striatal network immature activity. Front. Cell. Neurosci. 5:24. doi: 10.3389/fncel.2011.00024
Received: 14 September 2011; Paper pending published: 06 October 2011;
Accepted: 21 October 2011; Published online: 21 November 2011.
Edited by:
Enrico Cherubini, International School for Advanced Studies, ItalyReviewed by:
Enrico Bracci, University of Manchester, UKPaolo Calabresi, Santa Maria Della Misericordia Hospital, Italy
Copyright: © 2011 Dehorter, Michel, Marissal, Rotrou, Matrot, Lopez, Humphries and Hammond. This is an open-access article subject to a non-exclusive license between the authors and Frontiers Media SA, which permits use, distribution and reproduction in other forums, provided the original authors and source are credited and other Frontiers conditions are complied with.
*Correspondence: Constance Hammond, Institut de Neurobiologie de la Méditerranée, INSERM UMR 901, 163 route de Luminy, BP13, 13273 Marseille Cédex 9, France. e-mail: hammond@inmed.univ-mrs.fr