 Haroon Anwar1,2*Christopher J. Roome3Hermina Nedelescu1,2†Weiliang Chen2Bernd Kuhn3Erik De Schutter1,2
- 1Theoretical Neurobiology and Neuroengineering, University of Antwerp, Wilrijk, Belgium
- 2Computational Neuroscience Unit, Okinawa Institute of Science and Technology, Onna-Son, Okinawa, Japan
- 3Optical Neuroimaging Unit, Okinawa Institute of Science and Technology, Onna-Son, Okinawa, Japan
There is growing interest in understanding calcium dynamics in dendrites, both experimentally and computationally. Many processes influence these dynamics, but in dendrites there is a strong contribution of morphology because the peak calcium levels are strongly determined by the surface to volume ratio (SVR) of each branch, which is inversely related to branch diameter. In this study we explore the predicted variance of dendritic calcium concentrations due to local changes in dendrite diameter and how this is affected by the modeling approach used. We investigate this in a model of dendritic calcium spiking in different reconstructions of cerebellar Purkinje cells and in morphological analysis of neocortical and hippocampal pyramidal neurons. We report that many published models neglect diameter-dependent effects on calcium concentration and show how to implement this correctly in the NEURON simulator, both for phenomenological pool based models and for implementations using radial 1D diffusion. More detailed modeling requires simulation of 3D diffusion and we demonstrate that this does not dissipate the local concentration variance due to changes of dendritic diameter. In many cases 1D diffusion of models of calcium buffering give a good approximation provided an increased morphological resolution is implemented.
Introduction
Intracellular Ca2+ has a central role in the information processing capabilities of neuronal dendrites. Ca2+ entering through voltage-gated Ca2+ channels (VGCC) and ligand-gated channels gives rise to cytosolic Ca2+, which in turn controls Ca2+-activated K+ (KCa) channels during dendritic Ca2+ spikes (Goldberg et al., 2004; Womack and Khodakhah, 2004; Kampa and Stuart, 2006). Free cytosolic Ca2+ can also activate complex molecular signaling pathways involved in different forms of synaptic and dendritic plasticity (Konnerth et al., 1992; Kampa et al., 2006; Rancz and Hausser, 2006; Canepari and Vogt, 2008; Antunes and De Schutter, 2012). The cytosolic spread and dynamics of Ca2+ in dendritic morphologies are controlled by intracellular Ca2+ mechanisms like diffusion, endogenous buffers, internal stores, exchangers and pumps (Berridge, 1998; Augustine et al., 2003; Hartmann and Konnerth, 2005). Therefore, correct representation of Ca2+ related mechanisms in complex dendritic structures is crucial in construction of biophysically faithful multi-scale models of dendrites.
In addition to intracellular Ca2+ mechanisms and ion channel distributions, dendritic geometry has been shown to greatly affect the spatial variability of Ca2+ dynamics (Lev-Ram et al., 1992; Regehr and Tank, 1994; Schiller et al., 1995; Holthoff et al., 2002; Rozsa et al., 2004). The effects of dendritic geometry on Ca2+ transients are often quantified in terms of the surface to volume ratio (SVR). This is because Ca2+ influx scales with membrane surface while the change in Ca2+ concentration due to diffusion and buffering strongly depends on the volume. This results in larger amplitude transients expected in small diameter dendrites because they have a large SVR. Considering each dendritic segment as a cylinder, SVR is inversely proportional to the diameter of the cylinder. Therefore, even in the absence of intracellular Ca2+ mechanisms (endogenous buffers, internal Ca2+ stores) and diffusion, changes in dendritic diameter across the dendrite will result in spatially variable Ca2+ levels. Moreover, because Ca2+ buffering and diffusion are also affected by geometry, dendrite diameters can also affect the decay time constants of Ca2+ transients (Holthoff et al., 2002). In this paper we characterize this spatial variability in Purkinje cell models and explore implementation issues that affect how well a biophysically detailed dendrite model can capture the spatio-temporal variability of Ca2+ dynamics caused by local variation of dendrite diameters.
Traditionally, a Ca2+ pool with a single relaxation time constant is used to model intracellular Ca2+ dynamics (Destexhe et al., 1994). Such models compute the effects of Ca2+ influx accurately but combine all removal systems, including diffusion, into one process with a fixed time constant. They usually represent the Ca2+ concentration in a submembrane shell with a fixed depth. Previously, we have shown that these pool based models can not capture the complex dynamics of intracellular Ca2+ because they fail to simulate the multiple time scales at which interactions between VGCC and KCa channels occur (Anwar et al., 2012). Here we extend the comparison of Ca2+ pool to complex Ca2+ dynamics models to the spatial domain. We will show that many model implementations in the literature do not compute correct volumes for the submembrane shell and that accuracy of morphological reconstruction is a more important concern than the limitations of only modeling 1D radial diffusion. In addition we provide detailed instructions on how to model biophysically realistic Ca2+ dynamics in compartmental models of dendrites.
Materials and Methods
Morphology Reconstructions
Purkinje cell morphologies
Dendritic morphologies of 10 Purkinje cells (PC 3–12) used in this study were obtained from the NeuroMorpho database (http://neuromorpho.org). An additional Purkinje cell morphology (PC 2) used in this study was provided by Ede Rancz and Michael Häusser, UCL, London, UK. Considering the small sample size of available PC neurons (11 cells) and their large variability in dendritic diameters, we decided to obtain an additional morphology (PC 1) with carefully reconstructed diameters.
PC morphology with carefully reconstructed diameters
All procedures for the care of animals were according to the Science Council of Japan Guidelines for Proper Conduct of Animal Experiments, and also the guideline approved by OIST Graduate University Animal Resources Section. A 4-week old mouse was anesthetized with isofluorane and decapitated. The cerebellum was removed from the skull and immediately collected into a vial containing ice cold carbogenated ACSF: NaCl 125 mM, KCl 2.5 mM, NaH2PO4 1.2 mM, MgSO4 1.9 mM, Glucose 10 mM, NaHCO3 25 mM, CaCl2 2 mM at 300-305 mOsm. Sagittal slices of 250 μm thickness were cut and placed in a recording chamber with carbogenated ACSF. The glass electrode (4 MOhm) was filled with intracellular solution containing potassium gluconate 140 mM, NaCl 10 mM, HEPES 10 mM, EGTA 0.2 mM, MgATP 4 mM, NaGTP 0.4 mM, Phosphocreatine 10 mM and 50 μM Alexa 594 (Invitrogen) with pH 7.3 and 300 mOsm.
A custom-built two-photon microscope (MOM, Sutter) with a Ti:sapphire laser (Vision II, Coherent), GaAsP photomultiplier tubes, and a 25x water (NA 1.05, Olympus) objective lens was used to acquire a 3D image stack of the Alexa-filled Purkinje cell with a z-step size of 0.25 μm and an xy field of view of 1024 × 1024 pixels. Next, the acquired 3D image stack was deconvoluted using AutoQuantX2 software (Media Cybernetics) using a theoretical point spread function (1–5 iterations) based on specifications from the image acquisition parameters. Later, the dendrite of Purkinje cell was reconstructed with Neurolucida, MBF Bioscience, (http://www.mbfbioscience.com/neurolucida). A different reconstruction of the same Purkinje cell has previously been used in Anwar et al. (2013).
Ca2+ Spiking Model
The detailed model of spontaneous Ca2+ spike generation was derived from the original biophysical model (Schmidt et al., 2003; Anwar et al., 2012) developed in the NEURON simulator (Hines and Carnevale, 1997). The model contained four types of ion channels: P-type Ca2+ channel (Pmax = 2 × 10⁻⁴ cm/s, GHK equation) (Swensen and Bean, 2005), T-type Ca2+ channel (Pmax = 8 × 10⁻⁶ cm/s, GHK equation) (Iftinca et al., 2006), BK-type Ca2+-activated K+ channel (Gmax = 7 × 10⁻² S/cm2) (Cox et al., 1997) and SK-type Ca2+-activated K+ channel (Gmax = 3.1 × 10⁻⁴ S/cm2) (Hirschberg et al., 1998; Solinas et al., 2007), plus a leak channel (Gmax = 1 × 10⁻⁶ S/cm2 and Erev = −61 mV).
Ca2+ Buffering Models
Intracellular Ca2+ was modeled using the following Ca2+ buffering mechanisms.
Ca2+ pool
The exponential decaying Ca2+ pool was modeled as
where [Ca2+]i is intracellular Ca2+ concentration, [Ca2+]0 is Ca2+ concentration at rest and is 45 nM, ICa(t) is total Ca2+ current per unit area through VGCC, F is the Faraday's constant, deq is the equivalent depth of a submembrane shell to define the volume for effective Ca2+ concentration, and β is the decay time constant. The values for depth (d) and β, 0.169 μm and 6.86 ms−1 respectively, were obtained from a past study (Anwar et al., 2012), where these values were fitted to generate dendritic Ca2+ spikes.
Two different definitions for deq were used. The first definition (SPold), uses a mechanism widely used in multi-compartment modeling studies using NEURON (e.g., Miyasho et al., 2001; Poirazi et al., 2003; Hemond et al., 2008; Hay et al., 2011) that takes the volume of the submembrane shell to be directly proportional to its depth d and therefore deq = d. This results in an incorrect volume of submembrane shell (see details in Results). The second definition (SPnew) used in this study computed an equivalent depth (deq) for each submembrane shell, which gives the correct volume (see details in Results) when used in the mechanism described by (1):
where diam is the diameter of each compartment.
Detailed Ca2+ dynamics
The detailed Ca2+ dynamics model used in this study was obtained from our previous study (Anwar et al., 2012). It included calbindin (CB) and parvalbumin (PV) as buffers. In addition to Ca2+, both PV and 80% of CB were diffusible (Schmidt et al., 2005; Anwar et al., 2012). A single surface-based Ca2+ pump was modeled using Michaelis-Menten kinetics (Sala and Hernandez-Cruz, 1990) as follows:
where pump density was 1 × 10⁻¹⁵ mol.cm−2, kf was 3 × 10³ mM−1.ms−1, kb was 17.5 ms−1 and kext was 72.55 ms−1.
Diffusion in NEURON simulator
In NEURON (Hines and Carnevale, 1997) simulations, diffusion of Ca2+, free and bound buffers was allowed only in the radial dimension, i.e., from membrane toward the center of the compartment and vice versa. Two different ways of discretizing space into concentric cylindrical shells were used. The first one, the variable depth scheme, is described as the standard example in the NEURON book (Carnevale and Hines, 2006). Each compartment is subdivided into radial shells (Figure 1) and the number of shells is computed using:
where Shells is the number of radial shells, diam is diameter of the compartment and d is depth of the outer radial shell, which was 0.1 μm. The discretization of the compartment volume into radial shells, where the depth of inner radial shells is twice the depth of outer radial shell, resulted in a varying depth of all shells, depending on the diameter of the compartment. The depth (d1) of the outer shell and the inner most shell is then:
and the other shells have a depth of 2 × d1 (see Figure 1).
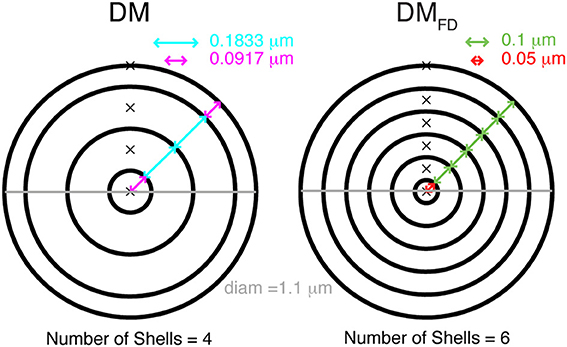
Figure 1. Cytosolic compartmentalization for diffusion from membrane toward the center of a cylindrical compartment. Schematic diagram shows two different ways of dividing the compartment volume into concentric shells. The DM mechanism (left) has a fixed number of shells and the depths of all shells vary so that the sum equals the compartment diameters, the outer shell also has a smaller depth than subsequent shells. In the DMFD mechanism (right) all shells have an identical, fixed depth except for the core shell whose depth is adjusted to get the correct compartment diameter. The number of shells is given by compartment diameter.
We also implemented a fixed depth scheme, where all the radial shells except the inner most core shell had a constant depth (Figure 1). The number of shells was computed using:
Here d1 as well as the depth of other shells was always 0.1 μm, and the core shell had a variable depth (≤0.1 μm). Note that to model radial diffusion with a variable number of shells, a separate mechanism with a unique configuration of shells for every compartment with a different diameter needs to be created in NEURON.
Diffusion in STEPS simulator
To allow 3D diffusion in the stochastic reaction-diffusion simulator STEPS (Hepburn et al., 2012), the dendritic morphology (part of PC 1) was discretized into tetrahedral mesh using CUBIT (http://cubit.sandia.gov).
Computer Simulations
All the simulations were run using a time step of 0.02 ms. Model scripts for all models used in this work are available at http://senselab.med.yale.edu/modeldb/ShowModel.asp?model=155731.
Ca2+ spike generation in realistic morphologies
Spontaneous Ca2+ spikes were generated using realistic morphologies of PCs with ion channels uniformly distributed over the dendrites. The Ca2+ spike generation model was simulated with the following conditions: temperature of 34 Celsius, initial voltage of −60 mV, membrane capacitance of 1.12 μF.cm−2 and axial resistance of 250 Ohm.cm.
Ca2+ transients in single compartments
Ca2+ transients were simulated using different Ca2+ buffering models in single compartments with diameter varying from 0.1 to 6 μm in steps of 0.1 μm. The P-type Ca2+ channel with Pmax of 5.2 × 10⁻⁵ cm/s was included in the model for Ca2+ influx. A “ramp-like” voltage step protocol (same as in Anwar et al., 2012) was used to depolarize the compartment to the voltage at which physiological dendritic Ca2+ spikes are generated.
Ca2+ transients in part of dendritic morphology
Ca2+ transients in a part of PC 1 dendritic morphology were simulated using the detailed Ca2+ dynamics model with 1D diffusion in NEURON and with 3D diffusion in STEPS. Because of the long runtime for 3D diffusion simulations it was not possible to simulate a complete PC in STEPS.
A uniform current (in mA/cm2) recorded during a Ca2+ spike was applied to each compartment in the NEURON simulations to evoke a constant shape of the spike. Two types of compartmentalization approaches were used in these simulations. Firstly, using a single compartment per dendritic section (Total sections = 45). Secondly, each of the dendritic section was split into multiple (1–22) sections (Total sections = 300), where each section consisted of adjacent traced points on the dendrite.
Ca2+ influx in STEPS was implemented using first-order surface based Ca2+ influx reaction (X → X + Ca2+), where “X” channels (100,000) were distributed uniformly over the surface triangles (~92,000) of the mesh. At each time point, the influx rate per channel was updated based on the Ca2+ influx profile (obtained using the total current applied in the NEURON simulation). Due to high rate and uniformity of influx, effects of stochasticity were negligible. The results of STEPS simulations in this study are reported as the mean computed over 10 trials.
Results
In this study we explore the effect of dendrite diameter on Ca2+ dynamics in models of different complexity. Figure 2 shows that simulation results are strongly influenced by how one implements the model by comparing the integrated Ca2+ concentrations (for all time points in a time window, the sum of Ca2+ concentrations multiplied by the time step) in three different models of a spontaneous burst of Ca2+ spikes (Figure 2D; see the corresponding currents in Figure 2E) computed using the NEURON simulator. Figure 2A shows the result when using a simple pool model to compute Ca2+ concentrations based on an approach used in most NEURON simulations (SPold, e.g., Miyasho et al., 2001; Poirazi et al., 2003; Hemond et al., 2008; Hay et al., 2011). Using this approach no gradients of Ca2+ concentration are predicted within the dendrite; this result is unlikely to be physiological considering the large variation in SVR across the dendrite. The model in Figure 2B (SPnew) also uses a simple pool but implemented differently; it results in strong Ca2+ gradients with higher concentrations in thin dendritic branches as expected from the SVR. Finally we simulated a detailed Ca2+ dynamics models with buffers and radial 1D diffusion (Figure 2C, DM). This shows similar gradients as SPnew, but with higher Ca2+ peak values as expected from previous work comparing DM to simple pool models (Anwar et al., 2012).
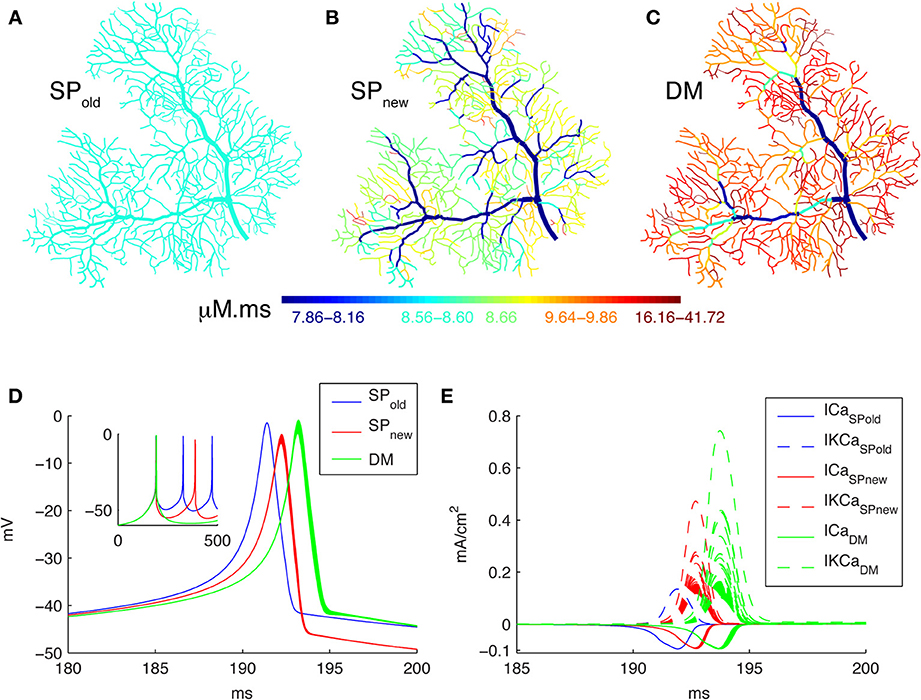
Figure 2. Spatial Ca2+ gradients strongly depend on type of model implementation. Panels (A–C) show maps of the integrated calcium levels in the dendrite during a spontaneous burst of Ca2+ spikes (panel D). The dendritic branches are color coded to show the integrated calcium levels using a 20 ms window around the peak Ca2+ concentration of the first dendritic Ca2+ spike. The color scales used in these maps are nonlinear (using histogram equalization) to enhance the contrast. (A) Single Ca2+ pool model using SPold mechanism results in homogenous Ca2+ levels. (B) Single Ca2+ pool model using SPnew mechanism results in variable Ca2+ levels. (C) Detailed Ca2+ dynamics model with buffering and 1D diffusion results in variable Ca2+ levels with larger Ca2+ gradients. (D) Voltage traces show the first spike of the Ca2+ burst for each model in all dendritic compartments for the 3 different models (see color code in Figure). The inset shows complete traces. (E) The underlying Ca2+ and KCa currents (recorded from all dendritic compartments) for the Ca2+ spike of the three different models (see color code in Figure).
Next we will describe in detail the differences between SPnew and SPold and then analyze the diameter dependence in SPnew and DM.
Inaccuracy of Ca2+ Volumes in Simple Pool Models and their Effects on Ca2+ Levels
Many multi-compartment dendritic models use a single pool model of Ca2+ buffering, which simulates only the submembrane Ca2+ concentration to control KCa channels. These phenomenological models convert Ca2+ current passing through VGCC to Ca2+ concentration using a submembrane shell of fixed depth, d [Equation (1); Figure 3A]. The volume of a submembrane shell (as for SPnew) is defined as:
where Volf denotes the volume of a full compartment, Volc denotes the volume of the core, d is the depth of submembrane shell, diam is the diameter of compartment and L is its length. Using such a representation of submembrane shell, SVRnew equals
where SA is the surface area of the compartment. Note that SVRnew is less dependent on diameter than the SVR for the complete volume (1/diam), but, as shown in Figure 3A, SVRnew still increases for smaller diameters.
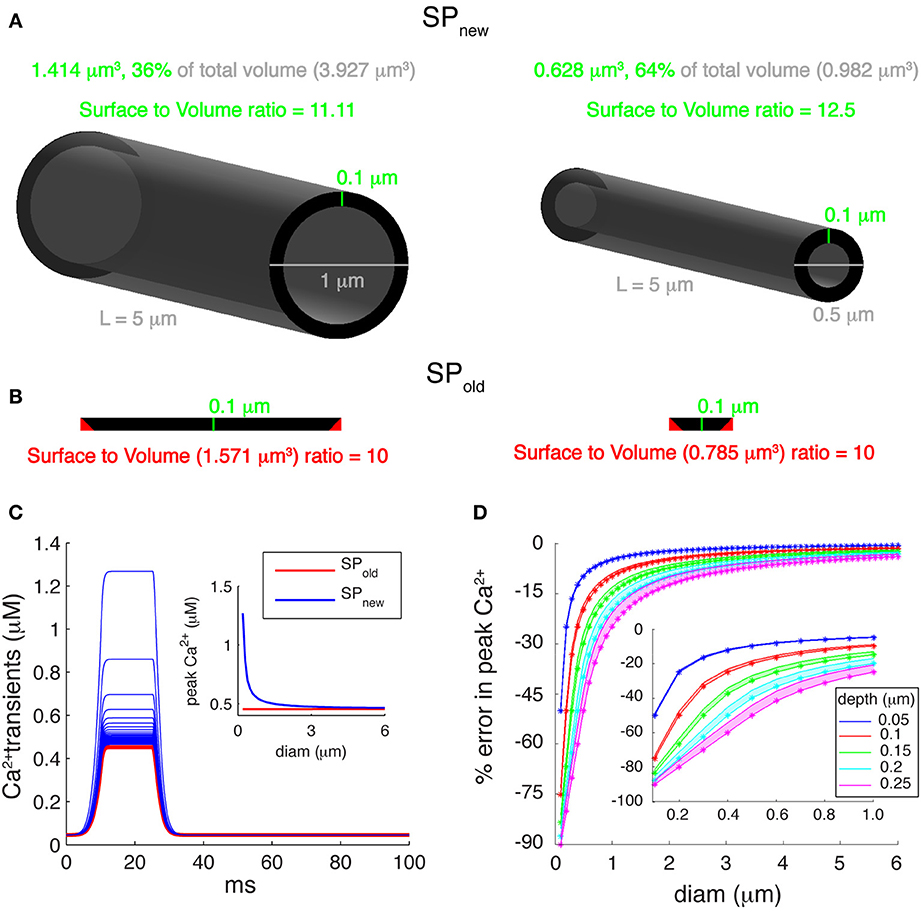
Figure 3. Errors introduced by incorrect submembrane volumes of single pool models. (A) Comparison between cylindrical dendritic compartments with diameters of 1 μm (left) and 0.5 μm (right) with submembrane shells with a depth of 0.1 μm. A correct implementation of the volume of the submembrane shell representing the single Ca2+ pool (SPnew mechanism) results in a SVR that depends on the compartment diameter. (B) For the same compartments using the SPold mechanism results in volumes that are too large and have a constant SVR. The cross-sectional area of each compartment (black disks shown in A) is unfolded and drawn to show that the actual volume of the submembrane shell (SPnew) is smaller than the volume used in the SPold mechanism. The red triangles represent extra cross-sectional area included in the volume of SPold. (C) Ca2+ transients generated using a “ramp-like” voltage command in single compartments with diameters ranging from 0.2 to 6 μm in steps of 0.1 μm. P-type Ca2+ channel with Pmax of 5.2 × 10⁻⁵ cm/s was used for Ca2+ influx. Inset: comparison of peak amplitudes of Ca2+ transients using SPold and SPnew show that the first mechanism causes exactly the same transient in all compartments, whereas, SPnew causes transients with varying peak Ca2+ amplitudes. (D) Error in peak Ca2+ levels caused by using the SPold mechanism [error = (max([Ca2+]SP_old) − max([Ca2+]SP_new)/max([Ca2+]SP_new))]. Pool models used β-values of 0.02, 6.86, and 10 ms−1; and depth (d) values of 0.05, 0.1, 0.15, 0.2, and 0.25 μm. The lower edge of shaded areas of each color shows error in peak calcium for β-value of 10 ms−1, whereas, the upper edge of shaded areas of each color show error for β-value of 0.02 ms−1. The colored asterisks show corresponding error for β-value (used to model PC dendrites) of 6.86 ms−1. Inset highlights large errors for branches with small diameters (diam ≤ 1 μm).
However, we noticed that most of the Ca2+ shell models implemented in NEURON use an incorrect volume for the submembrane shell (Figure 3B). In those models (SPold), the volume of a submembrane shell is defined as:
Using such a representation of submembrane shell, gives SVRold
Because the depth (d) of submembrane shells is usually taken constant for variable diameter compartments, SVRold is constant and independent of the dendrite diameter. As a result, we observe changes in peak amplitudes of the simulated Ca2+ transients using SPnew in compartments with different diameters (Figure 3C) while the same compartments with SPold always show exactly the same Ca2+ transient.
Since pool based models are phenomenological models, the values of depth (d) and decay time constants (β) can be tuned to approximate the desired behavior of intracellular [Ca2+]. In Figure 3D we show how the error of using SPold (compared to SPnew) depends on the values of d and β used. The errors in peak Ca2+ were computed using β-values of 0.02 ms−1 (Traub and Llinas, 1977), 6.86 ms−1 (Anwar et al., 2012), and 10 ms−1 (De Schutter and Bower, 1994) and using submembrane shells with depths ranging from 0.05 to 0.25 μm. The error increases with the size of depth used, as expected from SVRnew. More importantly, these errors become significantly larger for smaller diameters (diam <1 μm) and may reach up to 80% for 0.1 μm diameter compartments (inset of Figure 3D). Typically, distal dendrites have large numbers of dendritic branches with diameters less than 1 μm.
In the rest of our study we will only focus on SPnew and DM to investigate how well they can capture Ca2+ gradients in dendrites.
Detailed Ca2+ Dynamics Model Cause Large Spatial Variability of Ca2+ Levels in Realistic Dendritic Morphologies
Figure 2 demonstrates in one dendritic morphology that SVR differences cause sharper Ca2+ gradients when it was modeled using DM compared to SPnew. We next investigated whether this is a systematic observation by simulating the dendritic Ca2+ spike model in 11 additional dendritic reconstructions of PCs using both methods and comparing the results (Figure 4). For each PC, the ion channels were distributed uniformly on its dendrite and each unbranched segment had a constant diameter.
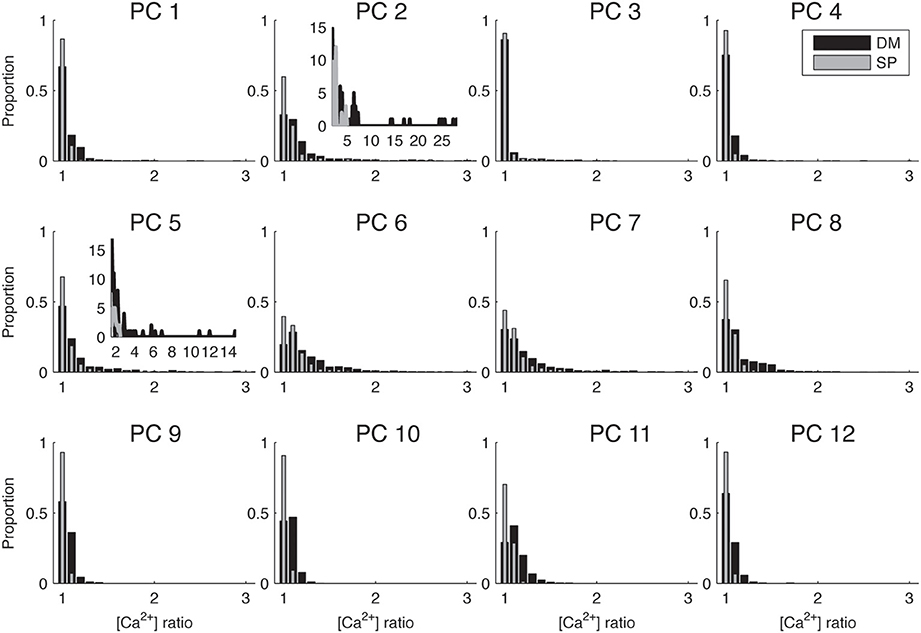
Figure 4. Biophysically detailed Ca2+ dynamics model causes larger differences in calcium levels in adjacent dendritic branches than single pool models. Histograms of ratios between integrated calcium from adjacent dendritic branches for 12 different PCs using SPnew and DM. To make the differences between cells more visible only the range of ratios 1–3 is shown, for the two cells that have significantly larger ratios the full distribution is shown in the inset. PC1 is shown in Figure 2. Integrated Ca2+ was computed for 20 ms around the first peak of Ca2+ transients for all PCs.
Because this study mostly focuses on local differences in Ca2+ concentration, we summarized the data on spatial gradients by computing the ratio of integrated [Ca2+] in adjacent dendritic segments and plotting the distributions of these ratios in Figure 4. We observe a wide range of distributions of spatial fluctuations of Ca2+ levels in different neuron reconstructions, with the histograms of some neurons (e.g., PC 2 and 5) showing very large tails and other ones only small fluctuations (ratio < 2). This observation may be related to differences in the quality of the reconstructions (see Discussion). But in all cases, the DM model always results in a wider range of Ca2+ fluctuations as compared to SPnew.
Variability of Diameters in Morphological Reconstructions of Neurons
In Figure 4 we used a common approach in compartmental modeling: we ignored small variations in diameter by taking only a single compartment for each unbranched segment. However, due to the large jumps in Ca2+ concentrations between neighboring compartments observed in some parts of the model (Figures 2, 4) we wondered about the realism of this assumption of uniform diameter. We investigated this issue both in the 12 PCs modeled previously as well as in 284 neocortical and 38 hippocampal pyramidal neuron reconstructions, because larger changes in diameter may be present in morphological classes where the level of branching is not as extensive as in PCs. For both neuron types we computed the coefficient of variation (CV) of diameters for every dendritic segment (between two branch points) based on all the measurements available in the morphological reconstruction (Figure 5). We observed a large variability in CV of reconstructed morphologies of neurons obtained from different laboratories for both cell classes (see Discussion), but overall the variability of diameter was much larger in pyramidal neurons where in many cells more than a quarter of the unbranched segments had CVs of 0.4 or more. In PCs more than half of the reconstructions had CVs of 0.2 or more in at least a quarter of their unbranched segments.
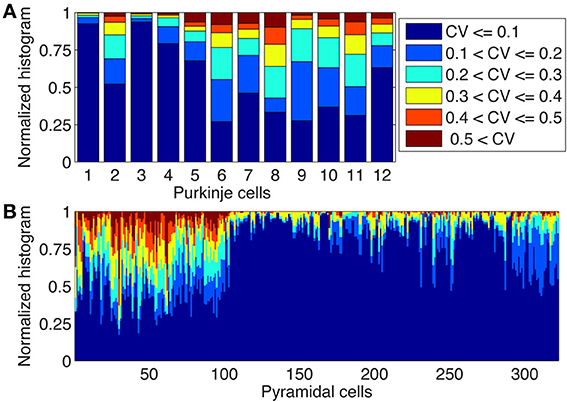
Figure 5. Large changes in diameters of unbranched dendritic segments exist in Purkinje and Pyramidal neurons. Stacked histograms show the distribution of CV values for the diameters changes over unbranched dendritic segments in Purkinje cells (A, N = 12) and in neocortical and hippocampal pyramidal neurons (B, N = 322). Notice the presence of large variability of diameters (CVs > 0.2 or more) in many neurons and the large neuron to neuron differences which are mostly caused by lab to lab differences in reconstruction quality (see text).
Our analysis suggests that for pyramidal neurons even more care should be taken when converting dendritic segments into cylindrical compartments. A good representation of dendritic segments with rapidly varying diameters is essential to model intracellular Ca2+ concentrations correctly (see also Figure 8).
Effect of Volume Discretization on Detailed Ca2+ Dynamics Models
Though the implementation of 1D diffusion in concentric cylindrical shells may seem straightforward, the NMODL language used in NEURON actually makes it difficult to do this in a flexible way and we discovered that many existing models do not implement it correctly. The standard example in the NEURON book (Carnevale and Hines, 2006) is a variable depth scheme where the volume is divided over a fixed number of concentric shells (4 in the standard example) with variable depth Equations (3) and (4) and Figure 1: DM, note that the submembrane and core shells have a smaller depth than the others). Many models using NEURON implement exactly this mechanism: 4 shells and all with variable depth. Because the volume of the submembrane shell is used to convert inward Ca2+ currents into a Ca2+ concentration that directly activates KCa channels, varying its depth will affect the computed value of this Ca2+ concentration. From a biophysical perspective there is no reason why the depth of a submembrane shell that is assumed to simulate the effective volume affecting the Ca2+ sensors of KCa channels (Fakler and Adelman, 2008; De Schutter, 2010) should vary greatly with dendrite diameter. We will therefore consider two issues: the number of shells to be modeled and a submembrane shell with variable (DM) or fixed depth (DMFD).
If one wants to vary the number of shells modeled depending on compartment diameter, which is the correct solution, a separate NEURON mechanism has to be created for each specific number of shells that is required. Some authors have therefore decided to use a fixed number of shells with variable depth of each shell (Migliore et al., 1995; Lazarewicz et al., 2002; Gold et al., 2007; Lavzin et al., 2012) (Figure 1: DM), but this can lead to significant errors in simulated submembrane Ca2+ concentration in large diameter dendrites if the number of shells is taken to be small (Figure 6A: circles). These errors show both a positive and negative component depending on compartment diameter, suggesting that two types of error contribute. Indeed, when we repeated these simulations with a fixed submembrane shell depth d1 of 0.1 μm and the rest of the volume divided over the remaining shells with equal, variable depths (FD: Figure 6B: triangles) only a positive error, increasing with diameter, remains. Because this error is quite small for a large number of shells, a model with the same large number of shells in every compartment will give accurate results in NEURON, but this may cause unacceptably slow runtimes (Anwar et al., 2012) so it is better to vary the number of shells [DMFD mechanism, Equation (5)].
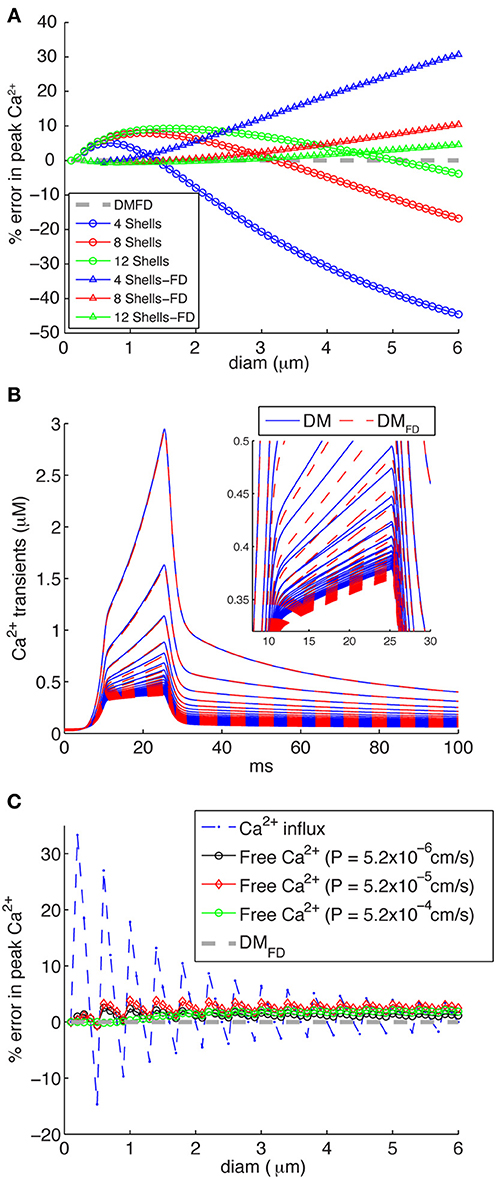
Figure 6. Inaccuracies of different calcium 1D diffusion models result in erroneous calcium levels. (A) Errors introduced by making the number of concentric shells independent of compartment diameter, for 4, 8, or 12 shells respectively. Two mechanisms are implemented: the standard NEURON scheme with variable depths for all shells (circles) and an FD scheme where the submembrane shell has a constant depth d1 = 0.1 μm and the rest of the shells has variable depth (triangles). The DMFD mechanism is used as reference. Note that for both mechanisms the errors become large for diameters beyond 2 μm if only four shells are used (as is the case in some NEURON models). (B) Ca2+ transients generated using a “ramp-like” voltage command in single compartments (see Figure 3C for details) comparing the responses of the DM and DMFD models. Both models show very similar behavior with only small numerical differences. (C) Errors due to discretization of radial shells in DM, which may result in variable d1 resulting in rapid changes of submembrane shell volume for increasing compartment diameter. The broken line with asterisks shows errors related to conversion of Ca2+ influx to Ca2+ concentration with variable depth d1 of the submembrane shell (it varies between 0.075 and 0.125 μm due to discretization) as compared to fixed d1 of 0.1 μm (DMFD). The solid lines with diamonds shows the actual error in free Ca2+ in the submembrane shell for DM models for different sizes of Ca2+ influx as indicated. Note that these errors are much smaller than predicted by the Ca2+ influx conversion.
The next question is then how to compute shell depth as the depth of at least one shell has to vary to fit the total exactly to a variable compartment diameter. As already mentioned, in the standard NEURON implementation (Carnevale and Hines, 2006) the depths of all shells vary with compartment diameter [variable depth scheme; Equations (3) and (4) and Figure 1: DM], including that of the submembrane shell. In effect, the depth of the submembrane shell (d1) may vary between d − 0.25 d and d + 0.25 d. In Figure 6C, the broken line shows the theoretical error of Ca2+ influx conversion to Ca2+ concentration using the variable depth scheme (range of d1 due to discretization: 0.075–0.125 μm). The larger predicted errors in these cases are associated with small diameters, where small changes of diam will result in bigger changes in d1 Equation (4) and submembrane shell volume.
These errors are large and should not be ignored. But what is the effect of these geometrical errors on actual computed Ca2+ concentrations? To quantify this we simulated Ca2+ transients using a mechanism with a variable number of shells, all with the same depth of 0.1 μm except for the core shell which has a variable diameter [DMFD, Equation (5) and Figure 1], which is assumed to give the most accurate solution. We found that DM and DMFD show very similar peak amplitudes and decay time constants for different diameter compartments (Figure 6B), resulting in much smaller errors in peak amplitudes of Ca2+ using DM compared to DMFD than theoretically predicted (Figure 6C). The error depends on the size of Ca2+ influx in a nontrivial way, but for all levels of Ca2+ influx it was small with the largest error only about 4%. This significant difference with the theoretical prediction is due to strong buffering (especially in PCs; (Hartmann and Konnerth, 2005) and diffusion of Ca2+, which removes most of Ca2+ entering into the submembrane shell.
How do the different Ca2+ buffering models respond to local fluctuations of dendrite diameter in terms of Ca2+ levels? To estimate the effect of dendritic diameter changes on Ca2+ dynamics using each model, we computed the ratio of integrated Ca2+ transients measured in each of the pair of simulated compartments using SPnew, DM and DMFD for many possible pairs of dendritic diameters (range: 0.1–6.0 μm with increments of 0.1 μm) (Figure 7). As explained previously, the SPold model does not show any sensitivity to changes in diameters. For SPnew, large ratios (>2) are limited to combinations where a compartment with an extremely small diameter (≤0.3 μm) is connected to one with large diameters. For DM and DMFD, this region expands to all compartments with diameter less than or equal to 1 μm that are connected to ones with larger diameters. Therefore, the detailed Ca2+ dynamics models are more sensitive to changes in dendritic diameter compared to pool based models, which explains the differences observed in Figure 3. But, although the sensitivity maps of DM are noisier than those of DMFD, due to the use of variable depth submembrane shells in DM, overall these maps are quite similar to each other.
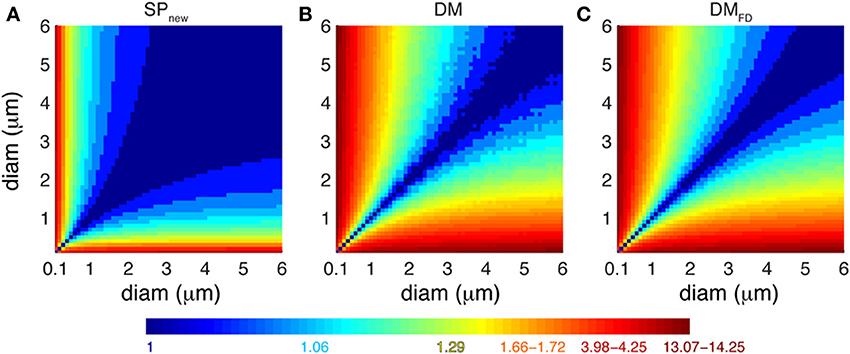
Figure 7. Different Ca2+ buffering model respond variably to changes in dendrite diameters. Predicted ratio of integrated Ca2+ concentration (100 ms window) for different combinations of diameters of pairs of dendritic compartments using (A) SPnew, (B) DM, and (C) DMFD. The maps are derived from the data shown in Figure 3C (A) and Figure 6B (B,C). The color scales used in these maps are nonlinear (using histogram equalization) to enhance the contrast.
We conclude from Figures 6, 7 that correct simulation of radial 1D Ca2+ diffusion requires a variable number of concentric shells that scales with compartment diameter, but that the Ca2+ dynamics are less sensitive to the actual scheme used to compute the depth of these shells.
Spatial Differences in Ca2+ Levels Persist with 3D Diffusion
The predictions of Figure 7 are based on no (SPnew) or only radial 1D diffusion (DM and DMFD). In this case, would the predicted large Ca2+ transients disappear in the presence of 3D diffusion? Also, what happens if dendritic diameter varies more smoothly than possible in a model using electrical compartmentalization? To address both issues, we used the STEPS simulator (Hepburn et al., 2012), which uses tetrahedral meshes to accurately represent detailed morphologies and 3D diffusion of molecules to simulate Ca2+ dynamics.
When we simulated Ca2+ transients with the detailed Ca2+ dynamics model in part of a PC dendritic arbor using STEPS, we still observed large fluctuations in Ca2+ levels along the different branches. Figure 8A shows the integrated Ca2+ levels for each tetrahedron located within 0.1 μm from the membrane. The large fluctuations of Ca2+ levels appear to be related to dendrite diameter. High Ca2+ levels are observed in dendritic regions with small diameter (Figure 8B) and at the tips of terminating branches. Higher levels at the tips are due to the higher SVR as a result of their small diameters and the reduced effective diffusion because of the closed end condition (the latter is not predicted by radial diffusion models). Overall we conclude that neither 3D diffusion nor smooth changes in dendrite diameter reduce the pronounced Ca2+ gradients caused by variable dendrite diameter, raising the question what level of detail is necessary to model this effect correctly?
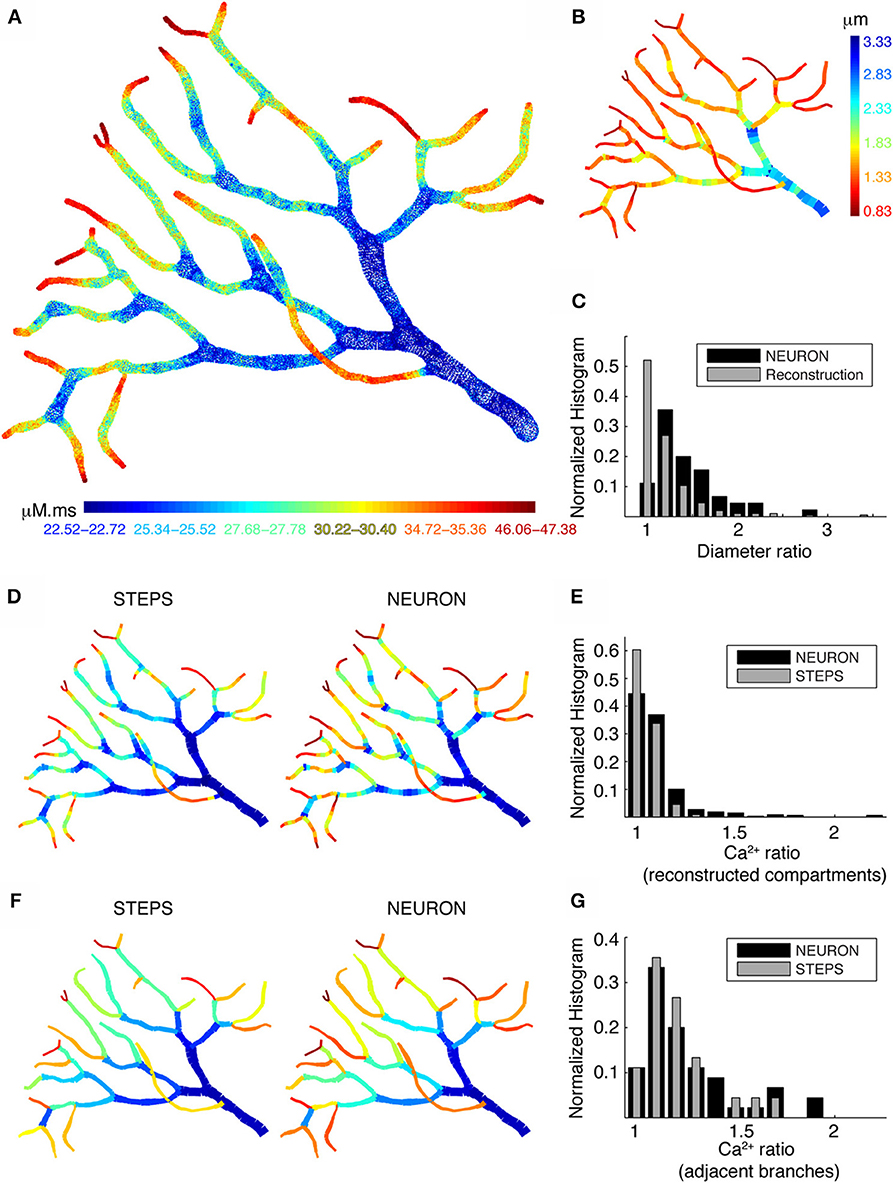
Figure 8. Large differences in calcium levels in adjacent dendritic branches persist in presence of 3D diffusion. (A) STEPS model using 3D buffered diffusion to compute the Ca2+ concentration resulting from the burst of Ca2+ spikes. Spatial map of integrated calcium (140 ms window) in a piece of carefully reconstructed PC dendritic arbor (part of PC 1). Every colored dot drawn at the center coordinates of each tetrahedron belonging to the mesh in which 3D diffusion was simulated shows the integrated Ca2+ in that particular tetrahedron. Only tetrahedrons representing the submembrane region are plotted. The color scales used in these maps are nonlinear (using histogram equalization) to enhance the contrast. (B) Spatial map of dendritic diameters in the dendrite shown in (A,D,F). (C) Normalized histograms compare the ratios of adjacent diameters in the original morphological reconstruction with similar ratios of diameters of adjacent compartments in the NEURON model (1 segment per unbranched section). (D,E) NEURON simulation with many compartments for each unbranched segment, carefully reflecting the variability of dendrite diameter. Data for the STEPS simulation are averaged over all tetrahedrons representing the corresponding NEURON compartment. (F,G) NEURON simulation with a single compartment for each unbranched segment, data for the STEPS simulation averaged for corresponding NEURON compartments. (D,F) Spatial maps of integrated submembrane Ca2+ concentration using the detailed calcium dynamics model with 3D diffusion (STEPS) and 1D radial diffusion (NEURON) are shown for the different compartmentalization schemes. (D) and (F) Use same color as in A. (E,G) Normalized histograms show the ratios of integrated Ca2+ concentration between every adjacent compartment using simulations with 3D diffusion (STEPS) and 1D diffusion (NEURON) for the results shown in (D,F) respectively.
To address this question, we compare NEURON and STEPS simulations using two different compartmentalization schemes in NEURON. First, we simulated Ca2+ transients in NEURON using multiple compartments per unbranched segment to capture all changes in dendritic diameters (Figure 8D; right panel). For comparison Figure 8D (left panel) shows the STEPS simulation with mean integrated Ca2+ concentration computed for all tetrahedrons corresponding to every NEURON compartment. Next, we made a similar comparison with NEURON simulations where every unbranched dendritic segment is considered as a single compartment (Figure 8F), which is the approach used in many compartmental models. Comparing these spatial maps (Figures 8D,F), we observe only small differences between simulations with 1D diffusion (NEURON) or with 3D diffusion (STEPS). However, the actual Ca2+ levels are different in the respective simulations. To quantify the difference in Ca2+ levels between the two approaches and how they relate to fluctuations in dendritic diameters we computed the ratios of Ca2+ levels and diameters for all adjacent segments. Figure 8E shows Ca2+ ratios in adjacent compartments for small compartment sizes (data shown in Figure 8D) and Figure 8G shows Ca2+ ratios in adjacent compartments with one compartment per unbranched dendritic segment (data shown in Figure 8F). The comparison of Figure 8E with Figure 8G clearly shows that the use of large compartments will result in larger jumps in Ca2+ levels between adjacent compartments. Using many small compartments to capture the continuous change of dendritic diameters results in much smoother and smaller changes in Ca2+ levels. The overall behavior of these changes in Ca2+ levels (Figures 8E,G) is similar, respectively, to the ratios of diameters in the original morphological reconstruction and to the ratios for adjacent compartments diameters for one compartment per unbranched segment (Figure 8C). This confirms that the simulated Ca2+ gradients are largely caused by the SVR effect. Finally, notice that the effect of 3D diffusion is more prominent when using small compartments (Figure 8D, bigger difference between NEURON and STEPS simulation).
Discussion
For a long time (until early 1960s), dendrites were thought to be passive structures, whose main function was to transfer and sum information from presynaptic to postsynaptic neurons (for review see Johnston et al., 1996). During the past couple of decades, it has been shown that dendrites contain a variety of voltage-gated channels (Llinas et al., 1992; Markram and Sakmann, 1994; Stuart and Sakmann, 1994; Magee and Johnston, 1995; Magee and Carruth, 1999; Lorincz and Nusser, 2010), voltage-dependent NMDA channels (Losonczy et al., 2008; Polsky et al., 2009; Major et al., 2013) and KCa channels (Golding et al., 1999; Womack and Khodakhah, 2002, 2003), which make these structures active. In addition to their role in neuronal excitability and dendritic integration, dendrites with thousands of synapses also serve as a venue of memory storage through induction of synaptic plasticity. Intracellular Ca2+ is involved in many processing capabilities of dendrites. Ca2+ entering through VGCC and NMDA channels gives rise to cytosolic Ca2+, which in turn activates various K+ channels and several molecular signaling pathways underlying synaptic plasticity. Therefore, it is important to correctly understand the dynamics of intracellular Ca2+ in dendrites with complex morphological structures.
Previous Modeling of Detailed Calcium Dynamics
The complexity of dendritic geometry and structure has been studied extensively to investigate its effects on propagation of action potentials, its role in synaptic efficacy and its effects on limiting interaction across different active dendritic regions (Mainen and Sejnowski, 1996; Vetter et al., 2001). Although variable levels of Ca2+ in different dendritic regions have been reported previously (Tank et al., 1988; Lev-Ram et al., 1992; Schiller et al., 1995), only a few studies specifically investigated the effect of dendritic diameters on Ca2+ dynamics (Holthoff et al., 2002; Rozsa et al., 2004). Therefore, those effects are often omitted while constructing biophysical models of dendrites. Due to limited quantitative information about the mechanisms controlling Ca2+ levels in many neurons, phenomenological models of Ca2+ buffering, such as the single exponential decaying pool, are commonly used for biophysical neuronal modeling. Such models when used correctly capture only some aspects of the highly complex behavior of intracellular Ca2+ buffering dynamics. In our previous work (Anwar et al., 2012), we showed that pool based models of Ca2+ buffering fail to correctly predict peak Ca2+ concentrations and decay time constants important for the interaction between VGCC and KCa channels. In this study, we investigated the effect of dendritic diameters on Ca2+ dynamics using a modeling approach. Our results (Figures 2, 4) show that pool based models have limited ability to capture the spatial variability of Ca2+ dynamics in morphologically complex dendrites as compared to a detailed Ca2+ dynamics model with radial 1D diffusion. The detailed Ca2+ dynamics model shows different peak amplitudes of Ca2+ levels as well as different (and multiple) decay time constants (Figure 6B). In contrast, pool based models with correct submembrane volume only show different peak amplitudes of Ca2+ levels (Figure 3C).
In general, many studies, including this one, ignore additional properties of real neurons that will affect Ca2+ dynamics. The most important of these simplifications are the assumption of constant density of Ca2+ channels, which is known to be not true for many neurons (for review see Johnston et al., 1996; Migliore and Shepherd, 2002), and the omission of the effect of organelles in the cytoplasm that block diffusion and have additional membrane Ca2+ pumps (mainly endoplasmic reticulum and mitochondria). Another important determinant of Ca2+ dynamics is inhomogeneous distribution of Ca2+ buffers in dendrites of a given neuron, as well as their properties, causing competitive binding of Ca2+ to available Ca2+ buffers and Ca2+ pumps (Markram et al., 1998). While the density of channels can easily be changed in compartmental models, accurate representation of intracellular organelles is possible in mesh based models only. We do not expect that inclusion of these properties would significantly change our conclusions.
Importance of Accurate Morphological Reconstruction
Dendrites have variable diameters. Typically, the diameter of dendrites taper with increasing distance from the soma. It is generally assumed that the change in diameter of an unbranched dendrite is relatively small as compared to the change in diameter at branching, which allows representation of an unbranched dendrite segment as a single uniform diameter compartment. However, as shown in our morphological analysis in Figure 5, many reconstructions of both PCs and pyramidal neurons show great diameter variability within their unbranched segments, with CV values sometimes reaching above 0.5. This implies that a correct Ca2+ dynamics model should represent this diameter variability by having several compartments for each unbranched segment (Figures 8D–E), but also that the quality of the morphological reconstruction is of utmost importance. We observed great differences of the diameter variability between different neural reconstructions which often could be related to the laboratory where the reconstructions have been done, as was reported previously for pyramidal neurons (Scorcioni et al., 2004; Szilagyi and De Schutter, 2004; Holmes et al., 2006). Because it seems more likely that human error causes an undersampling of diameter changes than an exaggeration, we assume that the reconstruction with high diameter CV tend to be more reliable. Finally, one should be aware that software like CVapp (Cannon et al., 1998), which converts morphology files into formats suitable for NEURON simulation, uses a specific discretization scheme that changes diameters at branch points (Figure S1).
Although morphological reconstructions obtained using electron microscopy (EM) capture dendrites much more precisely, because of rapid fluctuations in dendritic surface those reconstructions are not suitable for compartment based models. The proper use of EM reconstructions in modeling Ca2+ dynamics will require more advanced simulators with support for surface or tetrahedral meshes (e.g., M-Cell, STEPS). Also, this will require more detailed description of Ca2+ related mechanisms (e.g., spatial distribution of VGCa channels, KCa channels, buffers, pumps and internal calcium stores).
Simulator Implementation Issues
Almost all biophysically detailed models have been constructed using either the GENESIS or NEURON simulators. These software packages are based on compartmentalization of dendritic structures into multiple iso-potential cylinders, where voltage, currents and concentrations are computed for each of those compartments independently. Since these compartments are based on electrical properties of dendrites, biochemical representation of intracellular mechanisms in these compartments is always an approximation of the related biophysical process. Such a simplified molecular representation may result in unrealistic behavior of the model, depending on the rationale behind the assumption and its accuracy. One such example is the commonly used single pool model to simulate intracellular Ca2+ in the NEURON simulator Equations (8) and (9). The conversion of influx to intracellular Ca2+ concentration in these models is incorrect, which is due to the use of an inaccurate volume of the submembrane shell (Figure 3B). Although this inaccuracy does not influence the results of single compartment models dramatically because it can be easily tuned by adapting the shell depth, it becomes critically important in multi-compartment models. This incorrect single pool model will always underestimate the influx (Figure 3C), which may require unrealistic distribution of dendritic VGCC and KCa channels during model construction and cause a mismatch in input resistance between model and actual cell, and it will not predict any spatial gradients of Ca2+ concentration due to fluctuations of dendrite diameter (Figure 2A).
More detailed Ca2+ dynamics models using radial 1D diffusion are thought to be more accurate, but again the compartmentalization of the dendrite may result in either an inaccurate or incomplete representation of model. It is a major challenge to model diffusion in the NEURON simulator correctly. NEURON allows radial (toward the center of each dendritic compartment) and longitudinal (from one compartment to neighboring compartment) diffusion. Radial diffusion requires virtual submembrane shells (Figure 1), where shells typically have a variable depth, depending on the diameter of each compartment. Furthermore, longitudinal diffusion is only allowed if the adjacent compartments have the same number of shells which will introduce a larger error (Figure 6A) unless a very large number of shells is used everywhere. Conversely, though theoretically the variable submembrane depths of the standard NEURON scheme (DM) should result in large errors, this effect was strongly filtered by the diffusion and buffering mechanisms, resulting in only small differences (Figure 6C) with a method (DMFD) that ensures a fixed depth of the submembrane shell. It should be noted, however, that these differences may be larger in models of other neurons because the buffering capacity of PCs is exceptionally high (Hartmann and Konnerth, 2005). Control simulations showed that although the extent of the changes in Ca2+ levels varied in models with lower buffers concentrations, the dependence of Ca2+ levels on changes in diameters persisted (results not shown).
Neither of the issues just mentioned are relevant for the GENESIS simulator. Both submembrane pools (as the concpool object, De Schutter and Bower, 1994) and radial diffusion (as the difshell object, De Schutter and Smolen, 1999) are implemented correctly and are easy to set up. Conversely, it is time consuming to create multiple calcium dynamics mechanisms with radial diffusion in NEURON because a separate mechanism has to be written for each set of diameters (see Materials and Methods) and this requires a lot of extra care. And then, for every different morphology, one will have to repeat the process. We expect that multilevel declarative model description languages (Raikov and De Schutter, 2012) may allow transparent and correct compartment based assignment of molecular mechanisms in NEURON in the future.
Recommendations for Correct Modeling of Dendritic Ca2+ Dynamics
Even in PCs, where the estimated Ca2+ diffusion range is only about 5 μm (Santamaria et al., 2006), we observe effects of 3D diffusion on Ca2+ transients compared to when only radial 1D diffusion is used, especially when Ca2+ concentration is averaged over short distances only (Figures 8D,E). Nevertheless, the error introduced by the 1D approach is much smaller than the errors caused by inaccurate morphologies (Figure 8C) and simulating 3D diffusion in tetrahedral meshes is quite slow. However, 3D diffusion must be included in biophysically accurate models of synaptic plasticity or models involving Ca2+ based signaling pathways.
For most of modeling projects with the goal of capturing excitability and integrative properties of dendrites, a correct implementation of 1D radial diffusion and buffering in NEURON (or any other compartment based simulator) will be an adequate approximation. It is then important to implement a variable number of submembrane shells, with larger number of shells in larger diameter compartments, and best using a fixed depth of the submembrane shell [DMFD model: Figure 1, Equation (5)]. The model should be based on a high quality morphological reconstruction (Jacobs et al., 2010) and the variability of diameter along dendritic segments should be retained by having as many compartments as required to capture diameter changes (Figures 8D,E).
Finally, we do not recommend the use of simple pool models, unless good data on the properties of Ca2+ buffering (e.g., Schmidt et al., 2003 for PCs) in the neuron type to be modeled is completely absent. If one is forced to use a simple pool model, make sure it is implemented correctly [SPnew, Figure 3A and Equations (2) and (6)].
Conflict of Interest Statement
The authors declare that the research was conducted in the absence of any commercial or financial relationships that could be construed as a potential conflict of interest.
Acknowledgments
The authors wish to thank Sungho Hong and Iain Hepburn for comments on early drafts. This work was supported by OIST Graduate University. Hermina Nedelescu was supported by the European Union (CEREBNET FP7-ITN238686). We thank MBF Bioscience for providing Neurolucida tracing software and Professor Alanna Watt (McGill University) for providing the computer system and laboratory space to reconstruct the detailed morphology.
Supplementary Material
The Supplementary Material for this article can be found online at: http://www.frontiersin.org/journal/10.3389/fncel.2014.00168/abstract
References
Antunes, G., and De Schutter, E. (2012). A stochastic signaling network mediates the probabilistic induction of cerebellar long-term depression. J. Neurosci. 32, 9288–9300. doi: 10.1523/JNEUROSCI.5976-11.2012
Anwar, H., Hepburn, I., Nedelescu, H., Chen, W., and De Schutter, E. (2013). Stochastic calcium mechanisms cause dendritic calcium spike variability. J. Neurosci. 33, 15848–15867. doi: 10.1523/JNEUROSCI.1722-13.2013
Anwar, H., Hong, S., and De Schutter, E. (2012). Controlling Ca2+-activated K+ channels with models of Ca2+ buffering in purkinje Cells. Cerebellum 11, 681–693. doi: 10.1007/s12311-010-0224-3
Augustine, G. J., Santamaria, F., and Tanaka, K. (2003). Local calcium signaling in neurons. Neuron 40, 331–346. doi: 10.1016/S0896-6273(03)00639-1
Berridge, M. (1998). Neuronal calcium signaling review. Neuron 21, 13–26. doi: 10.1016/S0896-6273(00)80510-3
Canepari, M., and Vogt, K. E. (2008). Dendritic spike saturation of endogenous calcium buffer and induction of postsynaptic cerebellar LTP. PLoS ONE 3:e4011. doi: 10.1371/journal.pone.0004011
Cannon, R. C., Turner, D. A., Pyapali, G. K., and Wheal, H. V. (1998). An on-line archive of reconstructed hippocampal neurons. J. Neurosci. Methods 84, 49–54. doi: 10.1016/S0165-0270(98)00091-0
Carnevale, N. T., and Hines, M. L. (2006). The NEURON Book. New York, NY: Cambridge University Press. doi: 10.1017/CBO9780511541612
Cox, D. H., Cui, J., and Aldrich, R. W. (1997). Allosteric gating of a large conductance Ca-activated K+ channel. J. Gen. Physiol. 110, 257–281. doi: 10.1085/jgp.110.3.257
De Schutter, E. (2010). “Modeling intracellular calcium dynamics,” in Computational Modeling Methods for Neuroscientists, ed E. De Schutter (Cambridge, MA: The MIT Press), 93–106.
De Schutter, E., and Bower, J. M. (1994). An active membrane model of the cerebellar Purkinje cell. I. Simulation of current clamps in slice. J. Neurophysiol. 71, 375–400.
De Schutter, E., and Smolen, P. (1999). “Calcium dynamics in large neuronal models,” in Methods Neuronal Modeling: From Ions to Networks, Vol. 1, eds C. Koch and I. Segev (Cambridge, MA: The MIT Press), 1–44.
Destexhe, A., Mainen, Z. F., and Sejnowski, T. J. (1994). Synthesis of models for excitable membranes, synaptic transmission and neuromodulation using a common kinetic formalism. J. Comput. Neurosci. 1, 195–230. doi: 10.1007/BF00961734
Fakler, B., and Adelman, J. (2008). Control of KCa channels by calcium nano/microdomains. Neuron 59, 873–881. doi: 10.1016/j.neuron.2008.09.001
Gold, C., Henze, D., and Koch, C. (2007). Using extracellular action potential recordings to constrain compartmental models. J. Comput. Neurosci. 23, 39–58. doi: 10.1007/s10827-006-0018-2
Goldberg, J. H., Lacefield, C. O., and Yuste, R. (2004). Global dendritic calcium spikes in mouse layer 5 low threshold spiking interneurones: implications for control of pyramidal cell bursting. J. Physiol. 558, 465–478. doi: 10.1113/jphysiol.2004.064519
Golding, N. L., Jung, H.-Y., Mickus, T., and Spruston, N. (1999). Dendritic calcium spike initiation and repolarization are controlled by distinct potassium channel subtypes in CA1 pyramidal neurons. J. Neurosci. 19, 8789–8798.
Hartmann, J., and Konnerth, A. (2005). Determinants of postsynaptic Ca2+ signaling in Purkinje neurons. Cell Calcium 37, 459–466. doi: 10.1016/j.ceca.2005.01.014
Hay, E., Hill, S., Schürmann, F., Markram, H., and Segev, I. (2011). Models of neocortical layer 5b pyramidal cells capturing a wide range of dendritic and perisomatic active properties. PLoS Comput. Biol. 7:e1002107. doi: 10.1371/journal.pcbi.1002107
Hemond, P., Epstein, D., Boley, A., Migliore, M., Ascoli, G. A., and Jaffe, D. B. (2008). Distinct classes of pyramidal cells exhibit mutually exclusive firing patterns in hippocampal area CA3b. Hippocampus 18, 411–424. doi: 10.1002/hipo.20404
Hepburn, I., Chen, W., Wils, S., and De Schutter, E. (2012). STEPS: efficient simulation of stochastic reaction-diffusion models in realistic morphologies. BMC Syst. Biol. 6:36. doi: 10.1186/1752-0509-6-36
Hines, M. L., and Carnevale, N. T. (1997). The NEURON simulation environment. Neural Comput. 9, 1179–1209. doi: 10.1162/neco.1997.9.6.1179
Hirschberg, B., Maylie, J., Adelman, J., and Marrion, N. V. (1998). Gating of recombinant small-conductance Ca-activated K+ channels by calcium. J. Gen. Physiol. 111, 565–581. doi: 10.1085/jgp.111.4.565
Holmes, W. R., Ambros-Ingerson, J., and Grover, L. M. (2006). Fitting experimental data to models that use morphological data from public databases. J. Comput. Neurosci. 20, 349–365. doi: 10.1007/s10827-006-7189-8
Holthoff, K., Tsay, D., and Yuste, R. (2002). Calcium dynamics of spines depend on their dendritic location. Neuron 33, 425–437. doi: 10.1016/S0896-6273(02)00576-7
Iftinca, M., McKay, B. E., Snutch, T. P., McRory, J. E., Turner, R. W., and Zamponi, G. W. (2006). Temperature dependence of T-type calcium channel gating. Neuroscience 142, 1031–1042. doi: 10.1016/j.neuroscience.2006.07.010
Jacobs, G., Claiborne, B., and Harris, K. M. (2010). “Reconstruction of neuronal morphology,” in Computational Modeling Methods for Neuroscientists, ed E. De Schutter (Cambridge, MA: The MIT Press), 187–210.
Johnston, D., Magee, J. C., Colbert, C. M., and Christie, B. R. (1996). Active properties of neuronal dendrites. Annu. Rev. Neurosci. 19, 165–186. doi: 10.1146/annurev.ne.19.030196.001121
Kampa, B. M., Letzkus, J. J., and Stuart, G. (2006). Requirement of dendritic calcium spikes for induction of spike-timing-dependent synaptic plasticity. J. Physiol. 574, 283–290. doi: 10.1113/jphysiol.2006.111062
Kampa, B. M., and Stuart, G. J. (2006). Calcium spikes in basal dendrites of layer 5 pyramidal neurons during action potential bursts. J. Neurosci. 26, 7424–7432. doi: 10.1523/JNEUROSCI.3062-05.2006
Konnerth, A., Dreessen, J., and Augustine, G. J. (1992). Brief dendritic calcium signals initiate long-lasting synaptic depression in cerebellar Purkinje cells. Proc. Natl. Acad. Sci. U.S.A. 89, 7051–7055. doi: 10.1073/pnas.89.15.7051
Lavzin, M., Rapoport, S., Polsky, A., Garion, L., and Schiller, J. (2012). Nonlinear dendritic processing determines angular tuning of barrel cortex neurons in vivo. Nature 490, 397–401. doi: 10.1038/nature11451
Lazarewicz, M. T., Migliore, M., and Ascoli, G. A. (2002). A new bursting model of CA3 pyramidal cell physiology suggests multiple locations for spike initiation. Biosystems 67, 129–137. doi: 10.1016/S0303-2647(02)00071-0
Lev-Ram, V., Miyakawa, H., Lasser-Ross, N., and Ross, W. N. (1992). Calcium transients in cerebellar Purkinje neurons evoked by intracellular stimulation. J. Neurophysiol. 68, 1167–1177.
Llinas, R., Sugimori, M., Hillman, D. E., and Cherksey, B. (1992). Distribution and functional significance of the P-type, voltage-dependent Ca2+ channels in the mammalian central nervous system. Trends Neurosci. 15, 351–355. doi: 10.1016/0166-2236(92)90053-B
Lorincz, A., and Nusser, Z. (2010). Molecular identity of dendritic voltage-gated sodium channels. Science 328, 906–909. doi: 10.1126/science.1187958
Losonczy, A., Makara, J. K., and Magee, J. C. (2008). Compartmentalized dendritic plasticity and input feature storage in neurons. Nature 452, 436–441. doi: 10.1038/nature06725
Magee, J. C., and Carruth, M. (1999). Dendritic voltage-gated ion channels regulate the action potential firing mode of hippocampal CA1 pyramidal neurons. J. Neurophysiol. 82, 1895–1901.
Magee, J. C., and Johnston, D. (1995). Characterization of single voltage-gated Na+ and Ca2+ channels in apical dendrites of rat CA1 pyramidal neurons. J. Physiol. 487, 67–90.
Mainen, Z., and Sejnowski, T. (1996). Influence of dendritic structure on firing pattern in model neocortical neurons. Nature 382, 363–366. doi: 10.1038/382363a0
Major, G., Larkum, M. E., and Schiller, J. (2013). Active properties of neocortical pyramidal neuron dendrites. Annu. Rev. Neurosci. 36, 1–24. doi: 10.1146/annurev-neuro-062111-150343
Markram, H., Roth, A., and Helmchen, F. (1998). Competitive calcium binding: implications for dendritic calcium signaling. J. Comput. Neurosci. 5, 331–348. doi: 10.1023/A:1008891229546
Markram, H., and Sakmann, B. (1994). Calcium transients in dendrites of neocortical neurons evoked by single subthreshold excitatory postsynaptic potentials via low-voltage-activated calcium channels. Proc. Natl. Acad. Sci. U.S.A. 91, 5207–5211. doi: 10.1073/pnas.91.11.5207
Migliore, M., Cook, E. P., Jaffe, D. B., Turner, D. A., and Johnston, D. (1995). Computer simulations of morphologically reconstructed CA3 hippocampal neurons. J. Neurophysiol. 73, 1157–1168.
Migliore, M., and Shepherd, G. M. (2002). Emerging rules for the distributions of active dendritic conductances. Nat. Rev. Neurosci. 3, 362–370. doi: 10.1038/nrn810
Miyasho, T., Takagi, H., Suzuki, H., Watanabe, S., Inoue, M., Kudo, Y., et al. (2001). Low-threshold potassium channels and a low-threshold calcium channel regulate Ca2+ spike firing in the dendrites of cerebellar Purkinje neurons: a modeling study. Brain Res. 891, 106–115. doi: 10.1016/S0006-8993(00)03206-6
Poirazi, P., Brannon, T., and Mel, B. W. (2003). Pyramidal neuron as two-layer neural network. Neuron 37, 989–999. doi: 10.1016/S0896-6273(03)00149-1
Polsky, A., Mel, B., and Schiller, J. (2009). Encoding and decoding bursts by NMDA spikes in basal dendrites of layer 5 pyramidal neurons. J. Neurosci. 29, 11891–11903. doi: 10.1523/JNEUROSCI.5250-08.2009
Raikov, I., and De Schutter, E. (2012). The layer-oriented approach to declarative languages for biological modeling. PLoS Comput. Biol. 8:e1002521. doi: 10.1371/journal.pcbi.1002521
Rancz, E. A., and Hausser, M. (2006). Dendritic calcium spikes are tunable triggers of cannabinoid release and short-term synaptic plasticity in cerebellar purkinje neurons. J. Neurosci. 26, 5428–5437. doi: 10.1523/JNEUROSCI.5284-05.2006
Regehr, W. G., and Tank, D. W. (1994). Dendritic calcium dynamics. Curr. Opin. Neurobiol. 4, 373–382. doi: 10.1016/0959-4388(94)90099-X
Rozsa, B., Zelles, T., Vizi, E. S., and Lendvai, B. (2004). Distance-dependent scaling of calcium transients evoked by backpropagating spikes and synaptic activity in dendrites of hippocampal interneurons. J. Neurosci. 24, 661–670. doi: 10.1523/JNEUROSCI.3906-03.2004
Sala, F., and Hernandez-Cruz, A. (1990). Calcium diffusion modeling in a spherical neuron. Relevance of buffering properties. Biophys. J. 57, 313–324. doi: 10.1016/S0006-3495(90)82533-9
Santamaria, F., Wils, S., De Schutter, E., and Augustine, G. J. (2006). Anomalous diffusion in purkinje cell dendrites caused by spines. Neuron 52, 635–648. doi: 10.1016/j.neuron.2006.10.025
Schiller, J., Helmchen, F., and Sakmann, B. (1995). Spatial profile of dendritic calcium transients evoked by action potentials in rat neocortical pyramidal neurones. J. Physiol. 487, 583–600.
Schmidt, H., Schwaller, B., and Eilers, J. (2005). Calbindin D28k targets myo-inositol monophosphatase in spines and dendrites of cerebellar Purkinje neurons. Proc. Natl. Acad. Sci. U.S.A. 102, 5850–5855. doi: 10.1073/pnas.0407855102
Schmidt, H., Stiefel, K. M., Racay, P., Schwaller, B., and Eilers, J. (2003). Mutational analysis of dendritic Ca2+ kinetics in rodent Purkinje cells: role of parvalbumin and calbindin D28k. J. Physiol. 551, 13–32. doi: 10.1113/jphysiol.2002.035824
Scorcioni, R., Lazarewicz, M. T., and Ascoli, G. A. (2004). Quantitative morphometry of hippocampal pyramidal cells: differences between anatomical classes and reconstructing laboratories. J. Comp. Neurol. 473, 177–193. doi: 10.1002/cne.20067
Solinas, S., Forti, L., Cesana, E., Mapelli, J., De Schutter, E., and D'Angelo, E. (2007). Computational reconstruction of pacemaking and intrinsic electroresponsiveness in cerebellar golgi cells. Front. Cell. Neurosci. 1:2. doi: 10.3389/neuro.03.002.2007
Stuart, G. J., and Sakmann, B. (1994). Active propagation of somatic action potentials into neocortical pyramidal cell dendrites. Nature 367, 69–72. doi: 10.1038/367069a0
Swensen, A. M., and Bean, B. P. (2005). Robustness of burst firing in dissociated purkinje neurons with acute or long-term reductions in sodium conductance. J. Neurosci. 25, 3509–3520. doi: 10.1523/JNEUROSCI.3929-04.2005
Szilagyi, T., and De Schutter, E. (2004). Effects of variability in anatomical reconstruction techniques on models of synaptic integration by dendrites: a comparison of three internet archives. Eur. J. Neurosci. 19, 1257–1266. doi: 10.1111/j.1460-9568.2004.03222.x
Tank, D., Sugimori, M., Connor, J., and Llinas, R. (1988). Spatially resolved calcium dynamics of mammalian Purkinje cells in cerebellar slice. Science 242, 773–777. doi: 10.1126/science.2847315
Traub, R. D., and Llinas, R. (1977). The spatial distribution of ionic conductances in normal and axotomized motorneurons. Neuroscience 2, 829–849. doi: 10.1016/0306-4522(77)90110-5
Vetter, P., Roth, A., and Hausser, M. (2001). Propagation of action potentials in dendrites depends on dendritic morphology. J. Neurophysiol. 85, 926–937.
Womack, M. D., and Khodakhah, K. (2002). Characterization of large conductance Ca2+-activated K+ channels in cerebellar Purkinje neurons. Eur. J. Neurosci. 16, 1214–1222. doi: 10.1046/j.1460-9568.2002.02171.x
Womack, M. D., and Khodakhah, K. (2003). Somatic and dendritic small-conductance calcium-activated potassium channels regulate the output of cerebellar Purkinje neurons. J. Neurosci. 23, 2600–2607.
Keywords: intracellular calcium, calcium concentration, calcium buffering, diffusion, dendritic diameter, compartmentalization, active dendrite, morphology
Citation: Anwar H, Roome CJ, Nedelescu H, Chen W, Kuhn B and De Schutter E (2014) Dendritic diameters affect the spatial variability of intracellular calcium dynamics in computer models. Front. Cell. Neurosci. 8:168. doi: 10.3389/fncel.2014.00168
Received: 21 March 2014; Accepted: 02 June 2014;
Published online: 23 July 2014.
Edited by:
Hartmut Schmidt, University of Leipzig, GermanyReviewed by:
Arnd Roth, University College London, UKKnut Holthoff, Universitätsklinikum Jena, Germany
Copyright © 2014 Anwar, Roome, Nedelescu, Chen, Kuhn and De Schutter. This is an open-access article distributed under the terms of the Creative Commons Attribution License (CC BY). The use, distribution or reproduction in other forums is permitted, provided the original author(s) or licensor are credited and that the original publication in this journal is cited, in accordance with accepted academic practice. No use, distribution or reproduction is permitted which does not comply with these terms.
*Correspondence: Haroon Anwar, Department of Biological Sciences, New Jersey Institute of Technology, University Heights, Newark, NJ 07102-1982, USA e-mail:hanwar@njit.edu
†Present address: Hermina Nedelescu, Brain Mechanisms for Behavior Unit, Kunigami-gun, Okinawa, Japan