Increases in intracellular calcium via activation of potentially multiple phospholipase C isozymes in mouse olfactory neurons
 Steven A. Szebenyi
 Tatsuya Ogura
 Aaron Sathyanesan
 Abdullah K. AlMatrouk
 Justin Chang
 Weihong Lin
- Department of Biological Sciences, University of Maryland Baltimore County, Baltimore, MD, USA
Phospholipase C (PLC) and internal Ca2+ stores are involved in a variety of cellular functions. However, our understanding of PLC in mammalian olfactory sensory neurons (OSNs) is generally limited to its controversial role in odor transduction. Here we employed single-cell Ca2+ imaging and molecular approaches to investigate PLC-mediated Ca2+ responses and its isozyme gene transcript expression. We found that the pan-PLC activator m-3M3FBS (25 μM) induces intracellular Ca2+ increases in vast majority of isolated mouse OSNs tested. Both the response amplitude and percent responding cells depend on m-3M3FBS concentrations. In contrast, the inactive analog o-3M3FBS fails to induce Ca2+ responses. The m-3M3FBS-induced Ca2+ increase is blocked by the PLC inhibitor U73122, while its inactive analog U73433 has no effect. Removal of extracellular Ca2+ does not change significantly the m-3M3FBS-induced Ca2+ response amplitude. Additionally, in the absence of external Ca2+, we found that a subset of OSNs respond to an odorant mixture with small Ca2+ increases, which are significantly suppressed by U73122. Furthermore, using reverse transcription polymerase chain reaction and real-time quantitative polymerase chain reaction, we found that multiple PLC isozyme gene transcripts are expressed in olfactory turbinate tissue in various levels. Using RNA in situ hybridization analysis, we further show expression of β4, γ1, γ2 gene transcripts in OSNs. Taken together, our results establish that PLC isozymes are potent enzymes for mobilizing intracellular Ca2+ in mouse OSNs and provide molecular insight for PLC isozymes-mediated complex cell signaling and regulation in the peripheral olfactory epithelium.
Introduction
Phospholipase C (PLC) is one of the most common and important enzymes in cell signaling. Activation of PLC and its associated pathways by cell surface receptors including G-protein coupled receptors and receptor tyrosine kinases, enable cells to react to numerous internal and external signaling molecules, modulators, and stimuli (Suh et al., 2008; Yang et al., 2013). Upon activation, PLC catalyzes the hydrolysis of phosphatidylinositol 4, 5-bisphosphate (PIP2) to produce two second messengers: diacylglycerol (DAG) and inositol 1, 4, 5-trisphosphate (IP3), both of which are capable of triggering a variety of cellular events (Majerus et al., 1986; Singer et al., 1997; Rhee, 2001). In the olfactory system, the roles of PLC and its associated second messengers depend on species and sub-olfactory organs. While it is well known that the IP3-mediated pathway plays an important role in olfactory transduction of invertebrates and aquatic vertebrate animals (Fadool and Ache, 1992; Miyamoto et al., 1992; Schild et al., 1995; Bruch, 1996; Munger et al., 2000; Sansone et al., 2014), in rodent olfactory transduction, the role of the PLC pathways remains unclear because of inconsistent results in the literature. It has been reported that certain odors stimulate IP3 production (Boekhoff et al., 1990; Breer et al., 1990; Liu et al., 2006; Klasen et al., 2010) and that IP3 reportedly activates membrane ion channels in olfactory sensory neurons (OSNs; Restrepo et al., 1992; Okada et al., 1994; Lischka et al., 1999; Kaur et al., 2001; Liu et al., 2006). However, genetic knockout or pharmacological inhibition of the cAMP pathway, which is the canonical olfactory transduction pathway present in a majority of rodent OSNs, abolishes or severely suppresses odor responses to a wide range of odorants, including those stimulating IP3 production (Brunet et al., 1996; Belluscio et al., 1998; Chen et al., 2000; Wong et al., 2000; Zhao and Reed, 2001; Lin et al., 2004; Ma, 2012). Adding to the complexity, we previously showed that PLC inhibitor U73122 suppresses pheromone-induced electro-olfactogram (EOG) responses in the main olfactory epithelium (MOE) of wild type mice after the cAMP pathway is blocked (Lin et al., 2004). Furthermore, cyclic nucleotide gated channel A2 subunit (CNGA2) knockout mice are able to detect certain odorants behaviorally in experiments using an automated olfactometer system (Lin et al., 2004; Clevenger and Restrepo, 2006). These results indicate a role of PLC, although it is not dominant, in mammalian odor transduction.
Knowledge of PLC beyond olfactory transduction in the peripheral olfactory system is largely missing. To date, there is no report on direct activation of PLC in OSNs to evaluate its influence on intracellular Ca2+, despite one of the major functions of the PLC pathways is to mobilize intracellular Ca2+ to participate in and modulate cellular activity. Also, there is only scattered information about the expression of PLC isozymes (Liu et al., 2006). In mammals, 13 PLC isozymes have been identified and are divided into six groups: PLC-β, -γ, -δ, -ε, -ζ, and -η based on their amino acid sequences (Gresset et al., 2012). These isozymes, together with their second messenger DAG and IP3-mediated pathways, play essential roles in a variety of cellular functions primarily via protein kinase-mediated phosphorylation and elevation in intracellular Ca2+ levels (Rebecchi and Pentyala, 2000; Suh et al., 2008).
To increase our understanding of the PLC functions in the olfactory system, we first isolated OSNs from the MOE and surveyed PLC activity using a pan-PLC activator and single-cell intracellular Ca2+ imaging. Because the use of the activator in OSNs has not been reported, we conducted a series of stringent experiments to demonstrate its specificity in OSNs. Second, we identified the primary Ca2+ source for PLC-mediated Ca2+ increase. Third, we determined a small portion of odor-induced Ca2+ increases is from PLC-mediated internal Ca2+ release. Fourth, using reverse transcription polymerase chain reaction (RT-PCR) and real-time quantitative polymerase chain reaction (qPCR), we identified multiple PLC isozymes gene transcripts in RNA extracted from the olfactory turbinate tissue and quantified their expression levels. Finally, using RNA in situ hybridization (RISH), we show transcript expression of PLC isozyme β4, γ1, and γ2 in OSNs. Altogether, our data provides physiological and molecular insight for future studies investigating the roles of PLC and its second messenger-mediated signaling pathways in mammalian OSNs.
Materials and Methods
Animals
Adult male and female C57BL/6 background mice of 2–6 months old were used. These mice were in-house bred and were offspring of a transgenic mouse line generated originally in Dr. Robert R. Margolskee’s laboratory, in which the promoter of transient receptor potential channel M5 (TRPM5) drives the expression of GFP (Clapp et al., 2006). We used these mice because of tissue-sharing with other experiments to minimize the number of animals used. All animal care and procedures were approved by the Animal Care and Use Committees of University of Maryland, Baltimore County.
Solutions and Chemicals
Chemicals for solutions were purchased from Sigma-Aldrich (St. Louis, MO, USA). Normal bath solution (Tyrode’s saline) contained (in mM): 140 NaCl, 5 KCl, 10 N-2-hydroxyethylpiperazine- N = -2-ethanesulfonic acid buffer (HEPES), 1 MgCl2, 3 CaCl2, 10 Na pyruvate, and 10 D-glucose (pH 7.4 with NaOH). For nominal Ca2+ free bath solution, CaCl2 was omitted from the normal Tyrode’s saline. In some experiments as specified in the text, 1, 2-bis(o-aminophenoxy)ethane-N,N,N′,N′-tetracetic acid (BAPTA) was added to a final concentration of 210 μM or 5 mM (for odorants stimulation experiments). PLC activator 2,4,6-trimethyl-N-(m-3-trifluoromethylphenyl) benzenesulfonamide (m-3M3FBS) and its inactive analog o-3M3FBS (Tocris Bioscience, Minneapolis, MN, USA) were dissolved in dimethylsulfoxide (DMSO) to a stock concentration of 25 mM and freshly diluted immediately before each experiment in bath solution to a final concentration of 15 or 25 μM. The PLC inhibitor U73122 and its inactive derivative U73433 (Tocris) were dissolved in DMSO in stock and diluted in bath solution to a final concentration of 5 or 10 μM. The adenylyl cyclase activator forskolin (EMD Millipore) was dissolved in DMSO in stock and diluted in bath solution to a final concentration of 3 μM. The final concentration of <0.1% DMSO did not induce changes in Ca2+ levels in our Ca2+ imaging experiments. Odor chemicals were purchased from Sigma-Aldrich at the highest purity available. The odor mix used included pentanol, phenethyl alcohol, pentyl acetate, citral, geraniol, isobutyraldehyde, octanal, decanal, hexanal, trans-cinnamaldehyde (10 μM each). Odorants were made by dilution with vigorous vortexing in Tyrode’s saline from 10 mM stock solution stored in 20°C.
Enzymatic Isolation of OSNs
The method of OSN isolation was adapted from our previous study (Ogura et al., 2011). Briefly, mice were euthanized by CO2 asphyxiation followed by cervical dislocation and exsanguination through an open heart. The head skin was removed and the nose was split from the midline. The nasal turbinates were dissected and placed in Ca2+- Mg2+- free Tyrode’s saline containing ∼2.5–4 U/ml of papain (Worthington, Lakewood, NJ, USA) and 2 mM cysteine for 2.5–3.5 min at room temperature. Gentle pipetting at the end of enzyme incubation was applied to facilitate cell dissociation. The supernatant was transferred to an O-ring chamber on a cover slip pre-coated with concanavalin A (Sigma).
Fura-2 Ratio Ca2+ Imaging
Intracellular Ca2+ levels of OSNs were monitored using Ca2+ sensitive dye Fura-2 as described in our previous publication (Ogura et al., 1997, 2010, 2011). Briefly, cells were loaded with 2 μM Fura-2 AM (Molecular Probes) for 20–25 min. A pair of Fura-2 fluorescence images were captured every 3 s at 340 and 380 nm excitation lights using an inverted microscope (Olympus IX71) equipped with a UAPO/340 40x objective lens, a Hamamatsu CCD camera, a Sutter LS Xenon light source/filter changer controlled by Imaging Workbench software version 6 (INDEC BioSystems, Santa Clara, CA, USA). We measured Ca2+ levels as ratio of fluorescence values from 340 nm excitation/380 nm excitation light images. A change in the intracellular Ca2+ levels (ratio of F340/F380) is considered to be a stimulus-induced response if the peak value of the change during stimulation was greater than 5% of the resting level and within 30 s after stimulation, The resting Ca2+ level was obtained by averaging 10 data points (3 s each) before applying the stimulus in each cell tested or using the value of the first point before an assumed response if the baseline was stable. In figures containing Ca2+ traces, the vertical scale bar stands for a 50% change in the Ca2+ level measured from the resting Ca2+ level of the recorded region of the same cells.
Reverse Transcription Polymerase Chain Reaction
Primer design
Oligonucleotide primers were designed against each of the PLC isozymes using NCBI Primer BLAST (Ye et al., 2012) or the primer sequences were obtained from the Harvard PrimerBank (Spandidos et al., 2010). Primers were custom-made by Life Technologies (Carlsbad, CA, USA). Individual isozyme NCBI GI numbers, primer sequences, expected amplicon sizes, targeted splice variants and PrimerBank ID are listed in Table 1.
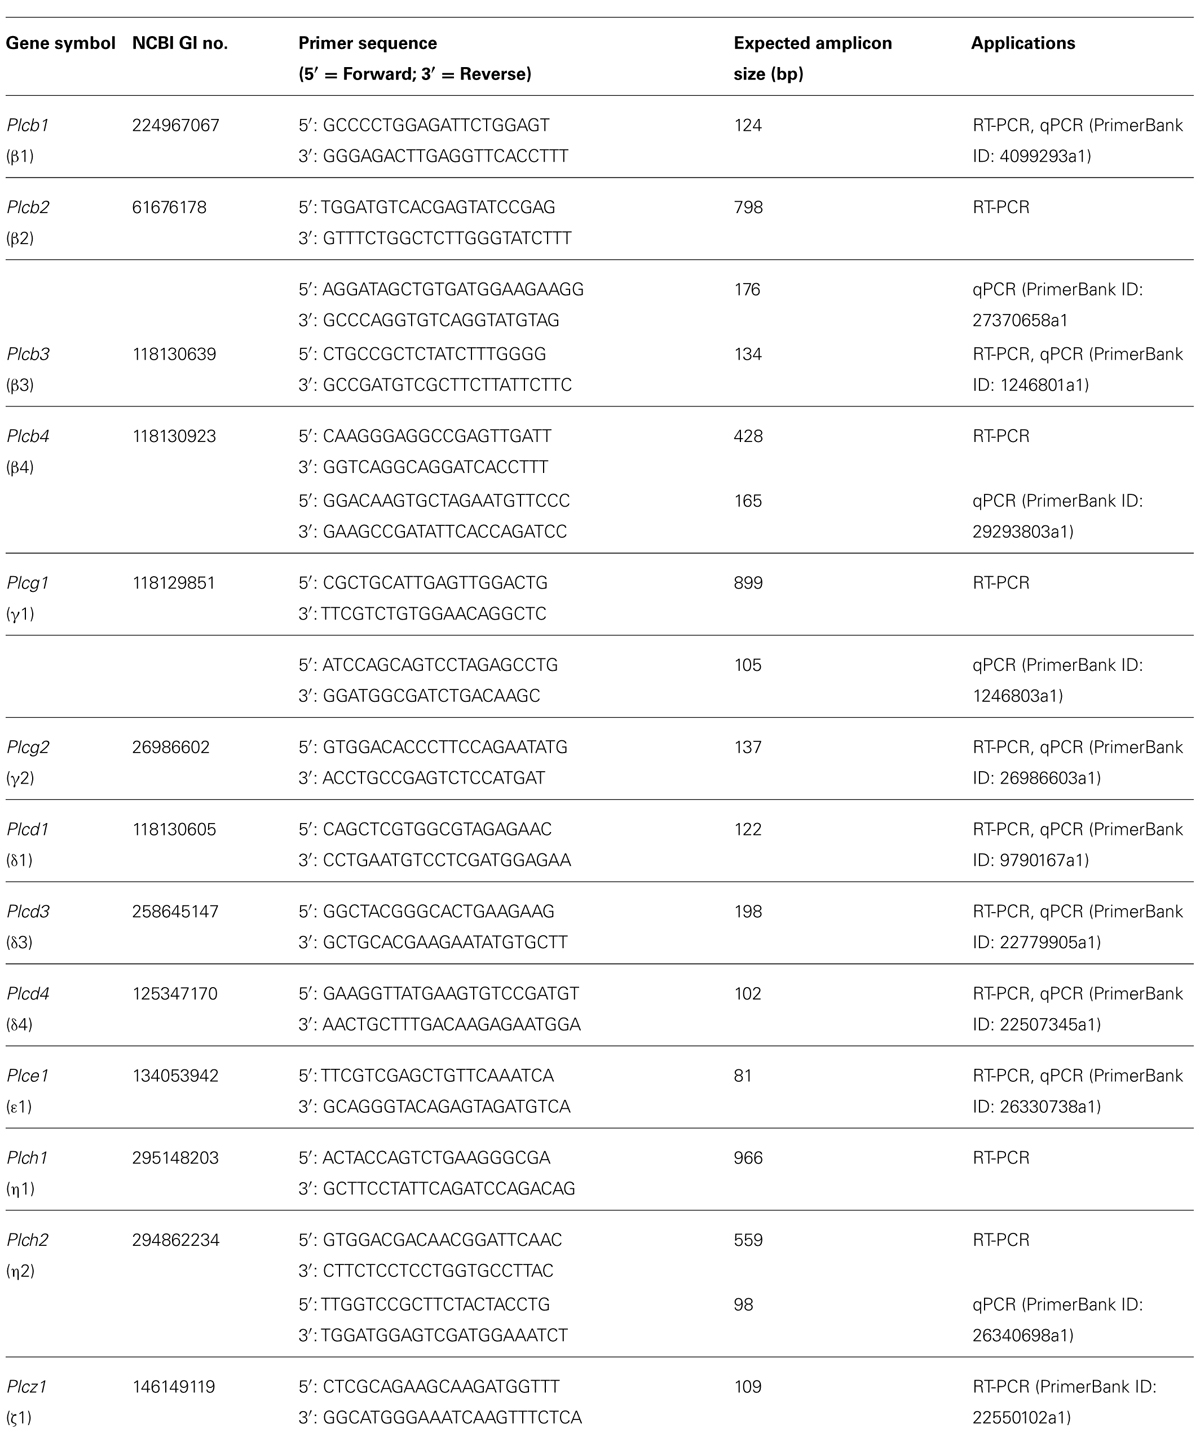
TABLE 1. Oligonucleotide primer sequences for individual PLC isozymes and their applications (RT-PCR and/or qPCR).
RNA extraction, first-strand cDNA synthesis, and agarose gel electrophoresis
Animal euthanasia, tissue dissection and the two-step RT-PCR protocol were described in our previous publication (Sathyanesan et al., 2013), with minor modifications. Briefly, individual mice were euthanized with CO2 and olfactory turbinate tissue and positive control tissues including brain, spleen, testis were freshly dissected, homogenized, and total RNA was extracted. For first-strand cDNA synthesis, 500 ng of total RNA template was used and one aliquot (1 μl) of the cDNA reaction was used as the starting template for polymerase chain reaction (PCR). For PLC isozymes that were not expressed at these standard amounts, the cDNA synthesis and PCR steps were repeated with higher amounts of starting material at each step (1.5 μg total RNA and five aliquots of the cDNA reaction for each isozyme PCR). Additionally, PCR cycles for isozymes that were not expressed with the standard amount of 500 ng of total RNA were increased from 30 to 40 cycles. Templates from cDNA reactions without reverse transcriptase served as negative controls. Resulting amplicons were electrophoretically resolved on 2% agarose gels.
Real-Time Quantitative Polymerase Chain Reaction
The qPCR and data analysis were carried out as previously described (Sathyanesan et al., 2013). Some of the primers used for RT-PCR were also used for qPCR since the amplicon size was in the range desirable for qPCR (Table 1).
RNA in Situ Hybridization
RNA in situ hybridization protocol including solution making, tissue preparation, riboprobe synthesis, hybridization, and image acquisition have been described in detail in Sathyanesan et al. (2013). Briefly, RNase-free conditions were achieved using 0.1% diethyl pyrocarbonate (DEPC) treated solution and RNase Zap (Sigma). Digoxygenin (DIG) labeled riboprobes were synthesized from RT-PCR amplicons cloned into the pGEM-T-Easy vector (Promega, Fitchburg, WI, USA). We used the same PCR primers listed in Table 1 for making PLCβ4, γ1, and γ2 RISH probes. Additionally, we adapted a pair of PLCβ4 primers from Allen brain atlas data portal: in situ hybridization data (5′: GCAGGTTATATCAGGGCAGTTC, 3′: CGCCTTCTCTAGGATTTTCTCA). Procedure for acquiring adult olfactory tubinate tissue from manually deboned noses can be further obtained from our recent video and publication (Dunston et al., 2013). For RISH analysis, we used 14 μm-thick MOE sections.
Statistical Analysis
For comparison of Ca2+ responses, Student’s t-test statistical analyses were performed. p < 0.05 was considered to be statistically different. Bar graphs represent mean percent changes at the peak of the responses from resting Ca2+ levels ± SEM. The mean values were obtained by averaging all the responses in each set of experiments. For comparison of qPCR data of PLC isozyme expression levels, one-way ANOVA followed by Tukey’s post hoc analysis was performed. p < 0.05 was considered statistically significant. Bar graphs represent mean expression (n = 3 mice) of PLC isozyme transcripts normalized to expression of glyceraldehyde 3-phosphate dehydrogenase (Gapdh) transcript ± SEM.
Results
The PLC Activator m-3M3FBS-Induced Intracellular Ca2+ Increases in Isolated OSNs
To investigate changes in intracellular Ca2+ levels mediated by direct PLC activation, we freshly dissociated OSNs from the MOE and stimulated them with the PLC activator m-3M3FBS in intracellular Ca2+ imaging. For our experiments, we selected OSNs that had multiple relatively long cilia. The lengths of the cilia varied, some of which were over 30 μm, indicating the OSNs we recorded were mature (Figure 1A, left panel: a typical isolated OSN; right panel: image with focus on cilia emanating from the knob). In addition, we also monitored OSN’s excitability by challenging randomly selected OSNs with either a high K+ (40 mM) bath solution and/or forskolin (3 μM). The high K+ solution induces an increase in intracellular Ca2+ levels by depolarizing the cell membrane, which consequently activates voltage-gated Ca2+ channels. Forskolin activates adenylyl cyclase, leading to activation of the canonical cAMP-mediated odor transduction pathway. All OSNs tested responded to high K+ and forskolin (Supplementary Figure 1), indicating that the OSNs we selected for our experiments were in healthy conditions with well-maintained morphology and excitability. For this study, we used a 40x oil objective lens, which enables us to reliably measure Ca2+ levels in the both dendritic knob and soma of individual OSNs. For the purpose of this study, we did not determine what odor receptors these isolated OSNs expressed. Because we randomly selected OSNs that were isolated from the entire olfactory turbinates, they most likely expressed different odor receptors.
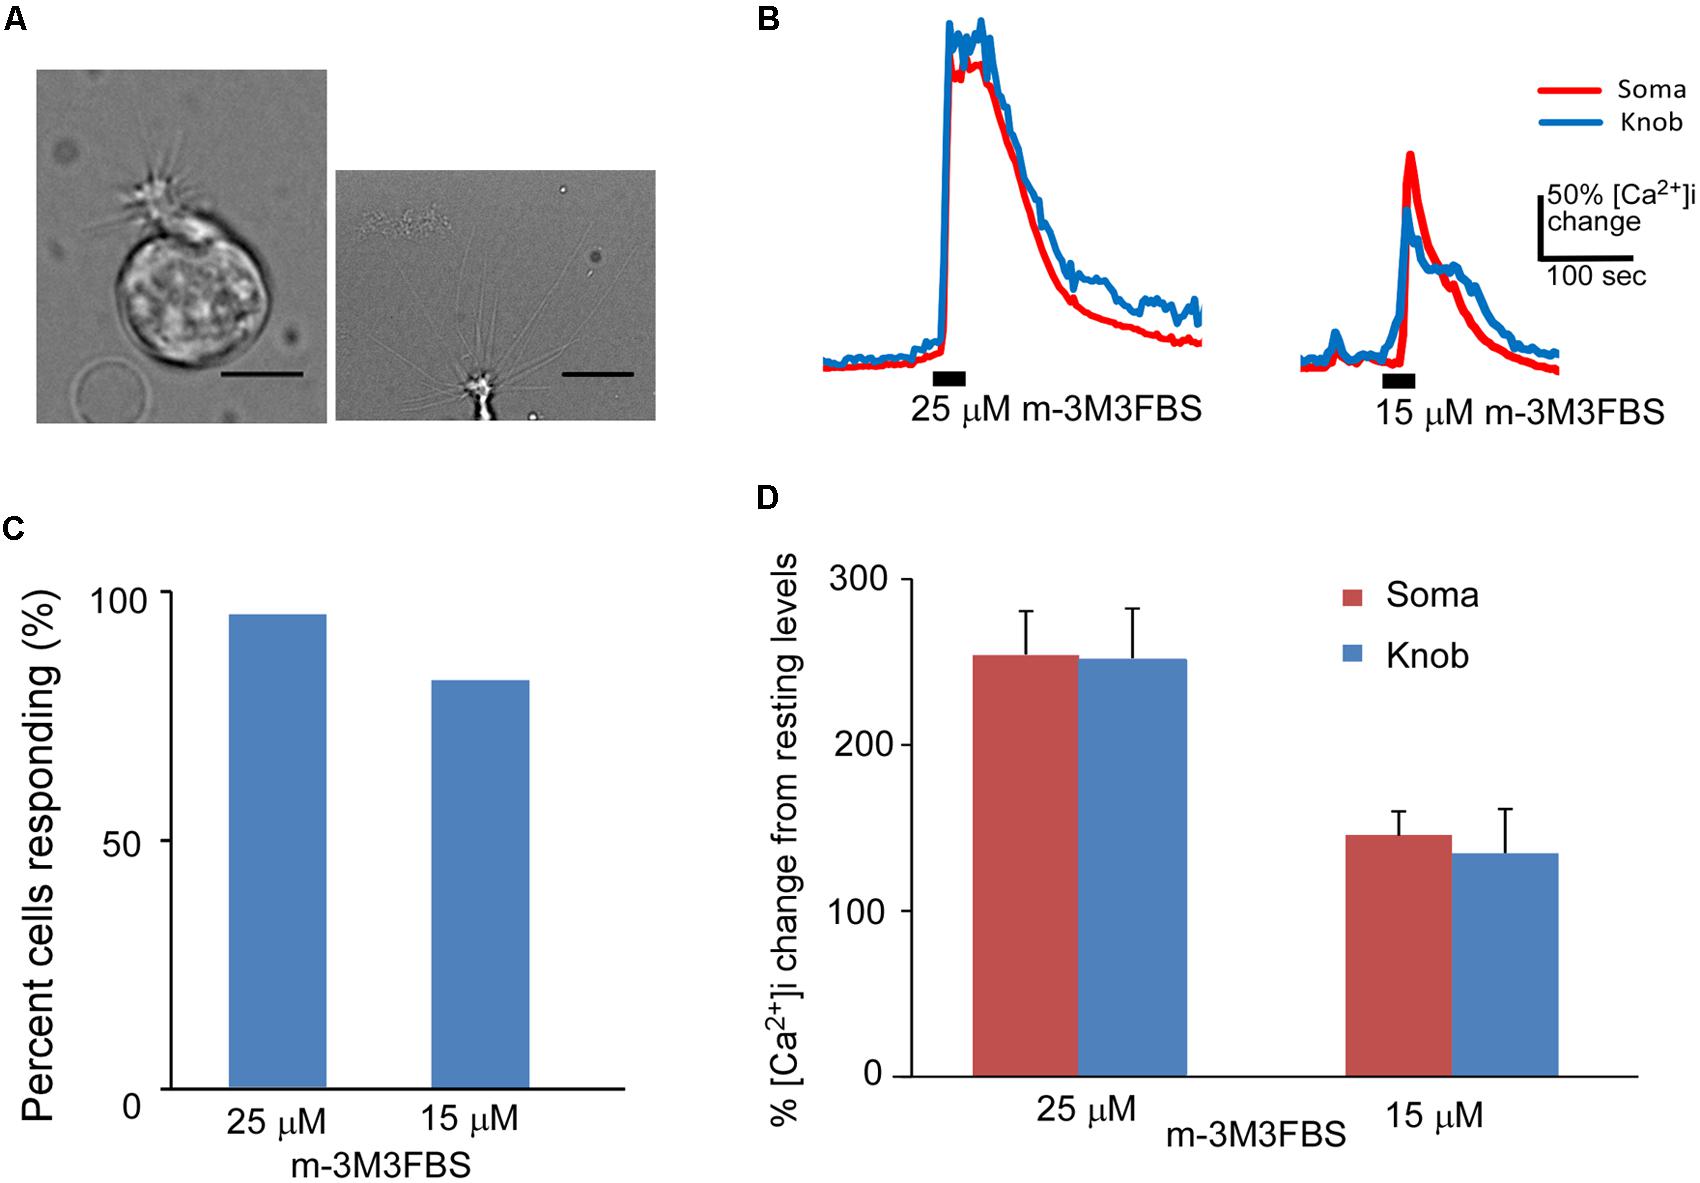
FIGURE 1. Phospholipase C activator m-3M3FBS increases Ca2+ levels in isolated OSNs. (A) Left: a representative image of an isolated OSN used for our recordings. Right: an image of the apical region of an isolated OSN, showing more than 10 long cilia emanating from a dendritic knob. Scale: 5 and 10 μm for left and right panels, respectively. (B) Representative Ca2+ response traces recorded from OSN soma (red) and dendritic knob (blue) to 25 and 15 μM m-3M3FBS in imaging experiments. Bars indicate the stimulation period of 35 s. (C) Percentage of OSNs responding to 25 μM (n = 47) and 15 μM (n = 32) m-3M3FBS. (D) Plot of averaged peak response amplitudes to 25 and 15 μM m-3M3FBS, respectively. The vertical scale bar in (B) and Y-axis in (D) stand for percent changes in the intracellular Ca2+ level ([Ca2+]i) measured from the resting Ca2+ level of the recorded region of the same cells (Mean ± SEM).
We freshly made working solution of PLC activator m-3M3FBS from its stock solution (25 mM in DMSO) immediately before each experiment. Bath-application of m-3M3FBS resulted in a large increase in intracellular Ca2+ in both the knob and soma regions. Figure 1B shows typical traces of Ca2+ responses evoked by 25 and 15 μM m-3M3FBS, respectively for 35 s application. Approximately 93.6% (44 out of total 47 OSNs tested from 25 mice) and 81.3% (26 out of 32 OSNs tested from 13 mice) OSNs, respectively, responded to 25 and 15 μM m-3M3FBS (Figure 1C). There is no statistical difference between the percent responding cells to the two concentrations (p = 0.15, Fisher’s exact test, two-tail). Figure 1D presents the averaged changes in the Ca2+ levels induced by 35 s application of 25 and 15 μM m-3M3FBS, respectively, with significantly higher response amplitude observed at 25 μM (p < 0.05, two-tail t-test, n = 44 and 26 for 25 and 15 μM, respectively). These results indicate that PLC activity is present in a vast majority of mouse mature OSNs and that activation of PLC is a potent mechanism to increase intracellular Ca2+.
Specificity of the PLC Activator
To test the specificity of m-3M3FBS in OSNs, we performed the same Ca2+ imaging experiment using the inactive analog o-3M3FBS. o-3M3FBS (25 μM) produced only a slow and very small Ca2+ increase in two out of eight OSNs tested even for longer application time (n = 4 mice), in contrast to the Ca2+ increase evoked by the active activator m-3M3FBS applied for 35 s after to the same cells (Figure 2A). The averaged response amplitude is plotted in Figure 2B, showing drastic differences in the response amplitude between these two analogs (p < 0.005, paired t-test, two-tail, n = 8). To further examine the specificity of the PLC activator in OSNs, we pre-incubated the OSNs with the PLC inhibitor U73122 (5 μM) for 5 min and monitored the effect of U73122 on m-3M3FBS (25 μM)-induced Ca2+ increases. The Ca2+ recording traces and the average response amplitude plot are shown in Figures 2C,D, respectively. U73122 suppressed the m-3M3FBS-induced responses amplitude even after longer m-3M3FBS application time (Figure 2D) and the percent responding cells (27.5% responding cells; three out of eight cells from 3 mice). For control, we repeated the experiment with the U73122 inactive analog U73433 (5 μM). All five cells tested with U73433 responded to m-3M3FBS. The difference in the response amplitude between U73122 and U73433 treatment is statistically significant (p < 0.01, t-test, two-tail, n = 8 and 5 for U73122 and U73433, respectively). Thus, under our experimental conditions, m-3M3FBS activates PLC in OSNs specifically.
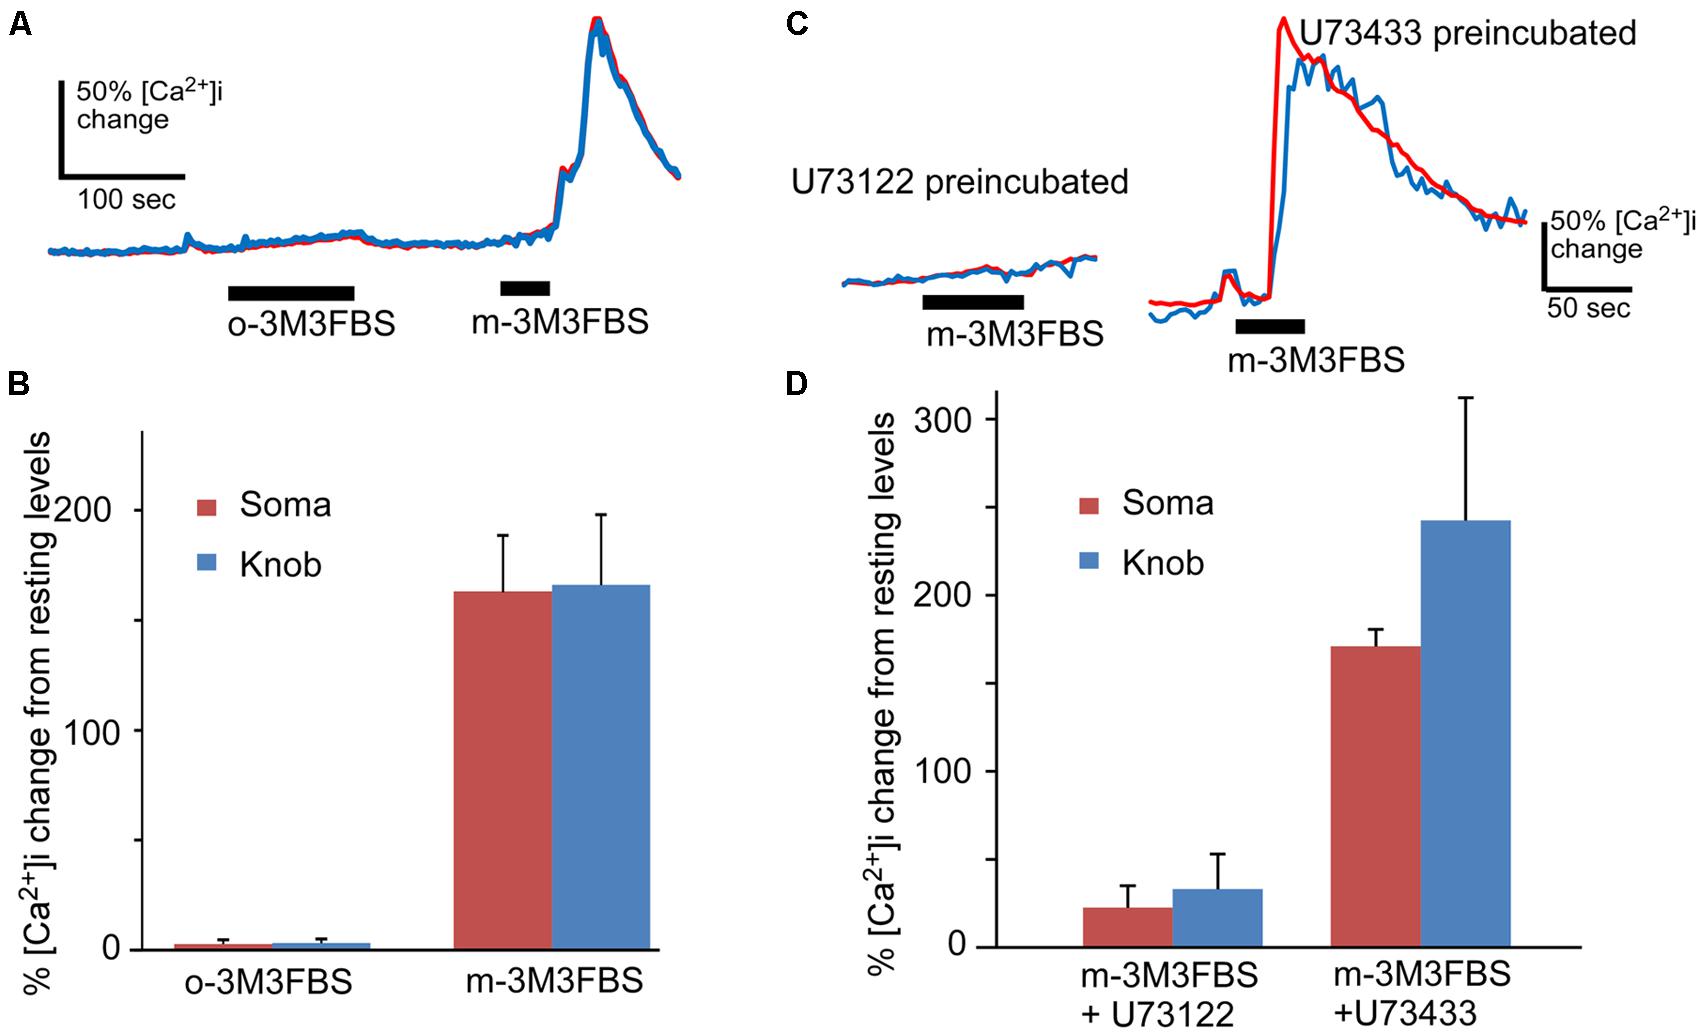
FIGURE 2. m-3M3FBS specifically activates PLC in OSNs. (A) Representative response records for o-3M3FBS, which is the inactive analog of m-3M3FBS, and m-3M3FBS at 25 μM in Ca2+ imaging experiment. o-3M3FBS failed to induce Ca2+ increase in the same cells tested responsive to m-3M3FBS. Bars indicate the stimulation period. (B) Average of peak responses to 25 μM o-3M3FBS and m-3M3FBS. The mean response amplitude value induced by o-3M3FBS is significantly smaller than the value induced by m-3M3FBS (p < 0.005, paired t-test, two-tail, n = 8). (C) Representative response records to 25 μM m-3M3FBS in OSNs after incubation with PLC inhibitor U73122 or its inactive analog U73433 (5 μM, each). (D) Averaged peak response values (Mean ± SEM) to 25 μM m-3M3FBS after pre-incubation of either U73122 (n = 8) or U73433 (n = 5), showing that U73122 significantly reduces the response to m-3M3FBS as compared to U73433 (p < 0.01, two-tail, t-test). Note the lengthened stimulation times for o-3M3FBS and for m-3M3FBS after U73433 to ensure their effects were recorded.
Additionally, we examined the autofluorescence of m-3M3FBS because a previous study has indicated that the autofluorescence of m-3M3FBS may induce artifacts in the fluorescence measurements (Jansen et al., 2004). We measured ratiometrically the fluorescence intensity of the bath solutions before and after adding different concentrations of m-3M3FBS. Under our optical recording condition for Fura-2 ratio imaging, m-3M3FBS at 15 and 25 μM induced only 0.10 ± 0.04 and 0.17 ± 0.09% changes from the background fluorescence intensity (n = 11 and 18, respectively; Supplementary Figure 2). We also applied 100 μM m-3M3FBS and did not see any higher than 1% changes in the background intensity in the bath (data not shown). This result rules out the potential effect of m-3M3FBS autofluorescence on our results.
Involvement of Intracellular Ca2+ Stores in PLC Activation Induced Ca2+ Increases
Both second messenger IP3 and DAG produced as the consequence of PLC activation are capable of increasing intracellular Ca2+ via either internal or external sources in sensory receptor cells (Restrepo et al., 1990; Schild et al., 1995; Ogura et al., 1997; Lucas et al., 2003; Zhang et al., 2010). We removed extracellular Ca2+ from the bath solution to determine whether the external or internal Ca2+ source is responsible for the PLC-induced Ca2+ increases. To avoid shocking the cells, we first reduced extracellular Ca2+ levels by switching from the normal Tyrode’s saline to a nominal Ca2+ free saline and then replaced it with a BAPTA (150 μM)-containing Ca2+ free saline. m-3M3FBS was only applied once per cell for 35 s, since subsequent applications of m-3M3FBS often induced smaller responses as compared to the first response (data not shown). As shown in Figure 3A, m-3M3FBS at both 25 and 15 μM induced sizable intracellular Ca2+ increases in both soma and knobs in Ca2+-free bath solution. Also, similar to the m-3M3FBS-induced Ca2+ responses in normal Tyrode’s, high percent of OSNs tested responded to both 25 and 15 μM in Ca2+-free bath solution (7 of 7 cells and 10 of 12 cells, for 25 and 15 μM m-3M3FBS, respectively). There is no statistical difference between the percent responding cells to the two concentrations (p = 0.51, Fisher’s exact test, two-tail). In the responses produced by 25 μM m-3M3FBS, the averaged response amplitude measured in the soma in the Ca2+-free bath was very close to the value obtained in the normal Tyrode’s (Figure 3B). We did not find any statistical difference between the two values (p = 0.95, t-test, two-tail, n = 44 and 7 for normal and Ca2+ free Tyrode’s solutions, respectively). The average peak value measured from the knobs in the Ca2+ free solution was lower than that measured in the normal Tyrode’s solution (Figure 3B), but the difference was not statistically significant (p = 0.44, t-test, two-tail, n = 44 and 7 for control and Ca2+ free, respectively). When comparing the 25 μM m-3M3FBS-induced Ca2+ responses in Ca2+ free solution (Figure 3B, Ca2+ free), the difference between soma and knob region is statistically significant (p < 0.05, two-tail, paired t-test). In the responses produced by 15 μM m-3M3FBS, the average response amplitudes from both soma and knobs obtained in the Ca2+ free solution were only slightly reduced as compared to the amplitude from those obtained in normal Tyrode’s (Figure 3C), and the difference was not statistically significant (p = 0.43 and 0.80 for soma and knob, respectively, t-test, two-tail, n = 26 and 10 for control and Ca2+ free solutions, respectively). These results indicate that PLC activation-induced increases in Ca2+ levels are primarily due to Ca2+ release from internal stores.
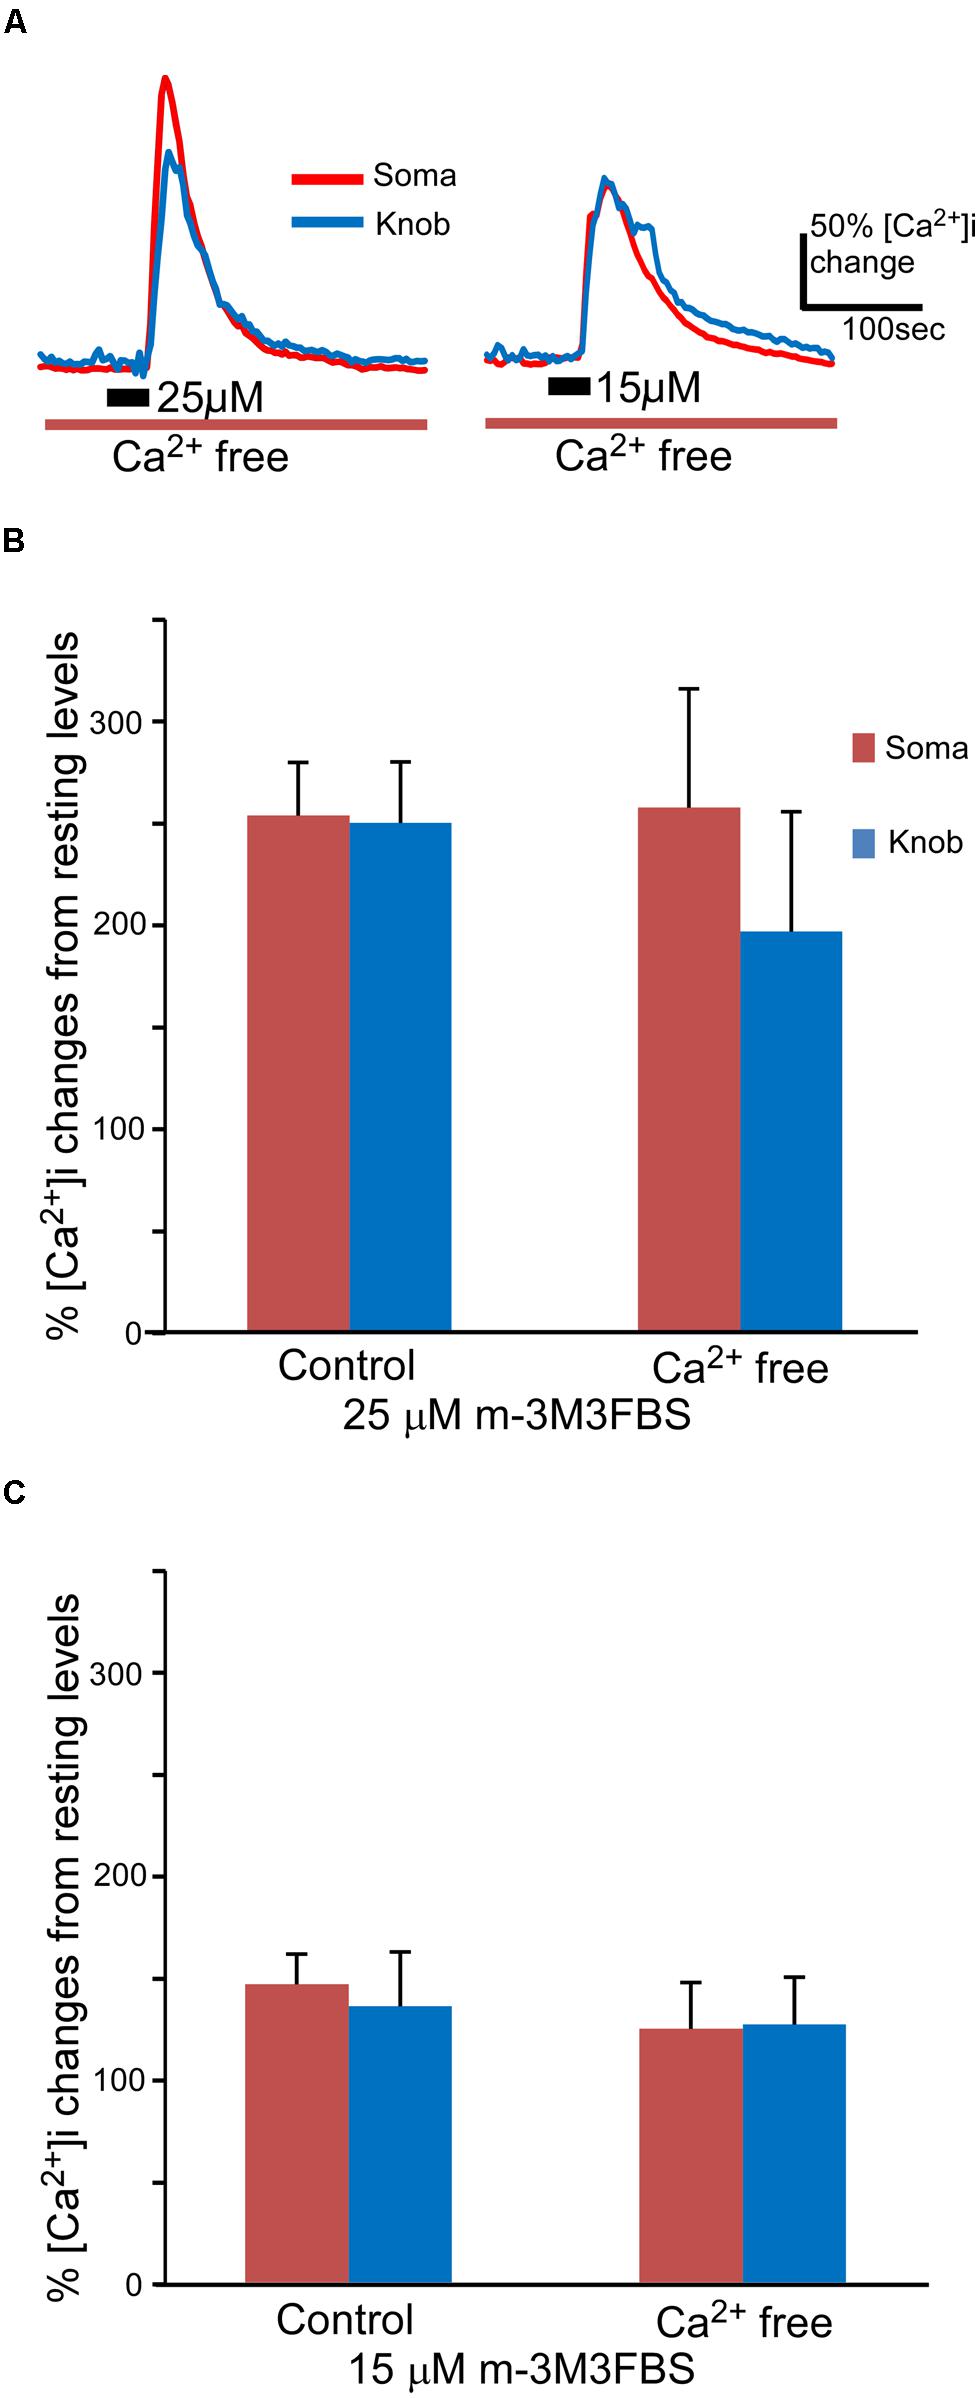
FIGURE 3. m-3M3FBS induces intracellular Ca2+ increases primarily via internal Ca2+ release. (A) Representative records of responses to 25 and 15 μM m-3M3FBS in Ca2+ free Tyrode’s saline. (B,C) Averaged peak response values to 25 μM (B) and 15 μM (C) m-3M3FBS in normal and Ca2+ free saline (n = 44 and 7 for 25 μM and n = 26 and 10 for 15 μM, respectively, Mean ± SEM).
Odor Mixture-Induced Ca2+ Increases in the Absence of External Ca2+ and Involvement of PLC
Our results indicate that activation of PLC represents an important route to change Ca2+ levels in a high percentage of OSNs. However, the involvement of PLC in rodent odor transduction remains controversial. In mouse OSNs, Ca2+ increase-mediated by the canonical cAMP olfactory signaling pathway indispensably relies on Ca2+ influx through the CNG channels (Frings et al., 1995). We reasoned that, since the PLC activator-induced Ca2+ increases rely on internal Ca2+ stores, odor-induced responses would be detectable in Ca2+ free saline if the PLC plays a role in odor signal transduction. To examine the involvement of PLC in odor-induced responses, we stimulated OSNs with an odor mixture in the presence and absence of extracellular Ca2+. The odor mixture contains 12 individual odorants at 10 μM each (see Materials and Methods for the list of odorants) to increase the percent responding OSNs. Also, because odor responses attenuate over repeated stimulation and over time, we carefully paired the experiments to ensure data comparable. In control experiments, isolated OSNs were repetitively stimulated with the odor mixture (15 s stimulation duration, ∼240 s interval between 1st and 2nd stimulation), and the Ca2+ responses were recorded (Figure 4A). About 30% OSNs responded to odor mix stimulation in normal Tyrode’s containing 3 mM Ca2+ with a sharp increase in the intracellular Ca2+ levels (35 out 117 cells tested in 19 mice). In general, the peak response amplitude-induced by the odor mixture in the knob was higher than in the soma. When the odor mixture stimulation was repeated, the second response generally was smaller than the first response obtained from the same cells, which is consistent with previous reports (Maue and Dionne, 1987; Hegg and Lucero, 2004). In the soma, the averaged peak response value of the second response was 92% of the first response peak value (Figures 4B,G, normal saline). The differences between 1st and 2nd response was not significant (Figure 4B, p = 0.06, paired t-test, two-tail, n = 9). In the knob, the run-down was slightly faster with the average magnitude of second responses being about 75% of the value of first responses. The difference is statistically significant (Figures 4B,G normal saline; p < 0.05, paired t-test, two-tail, n = 9). When the odor mix was applied for the second time in the Ca2+-free saline containing 5 mM BAPTA (15 s stimulation duration, ∼270 s interval between 1st and 2nd stimulation), five out of six OSNs tested responded with a relatively small, but measurable Ca2+ increase in both the knob and the soma (Figure 4C). The amplitude values of the second response measured from the soma and the knob in the Ca2+-free solution were 35 and 26%, respectively, of the first response measured from the same region of the same cells in the normal saline (Figure 4D, p < 0.05 between 1st and 2nd responses for both soma and knobs, paired t-test, two-tail, n = 6). Interestingly, due to the more reduction in the knob response amplitude in the Ca2+ free saline, the average peak response values for both the soma and knob became similar and not statistically significant (traces in Figure 4C and plot in Figure 4D, p = 0.96, t-test, two-tail, n = 6). These results demonstrate that a small portion of the Ca2+ increase induced by the odorant mixture in the knob and soma is from internal Ca2+ stores.
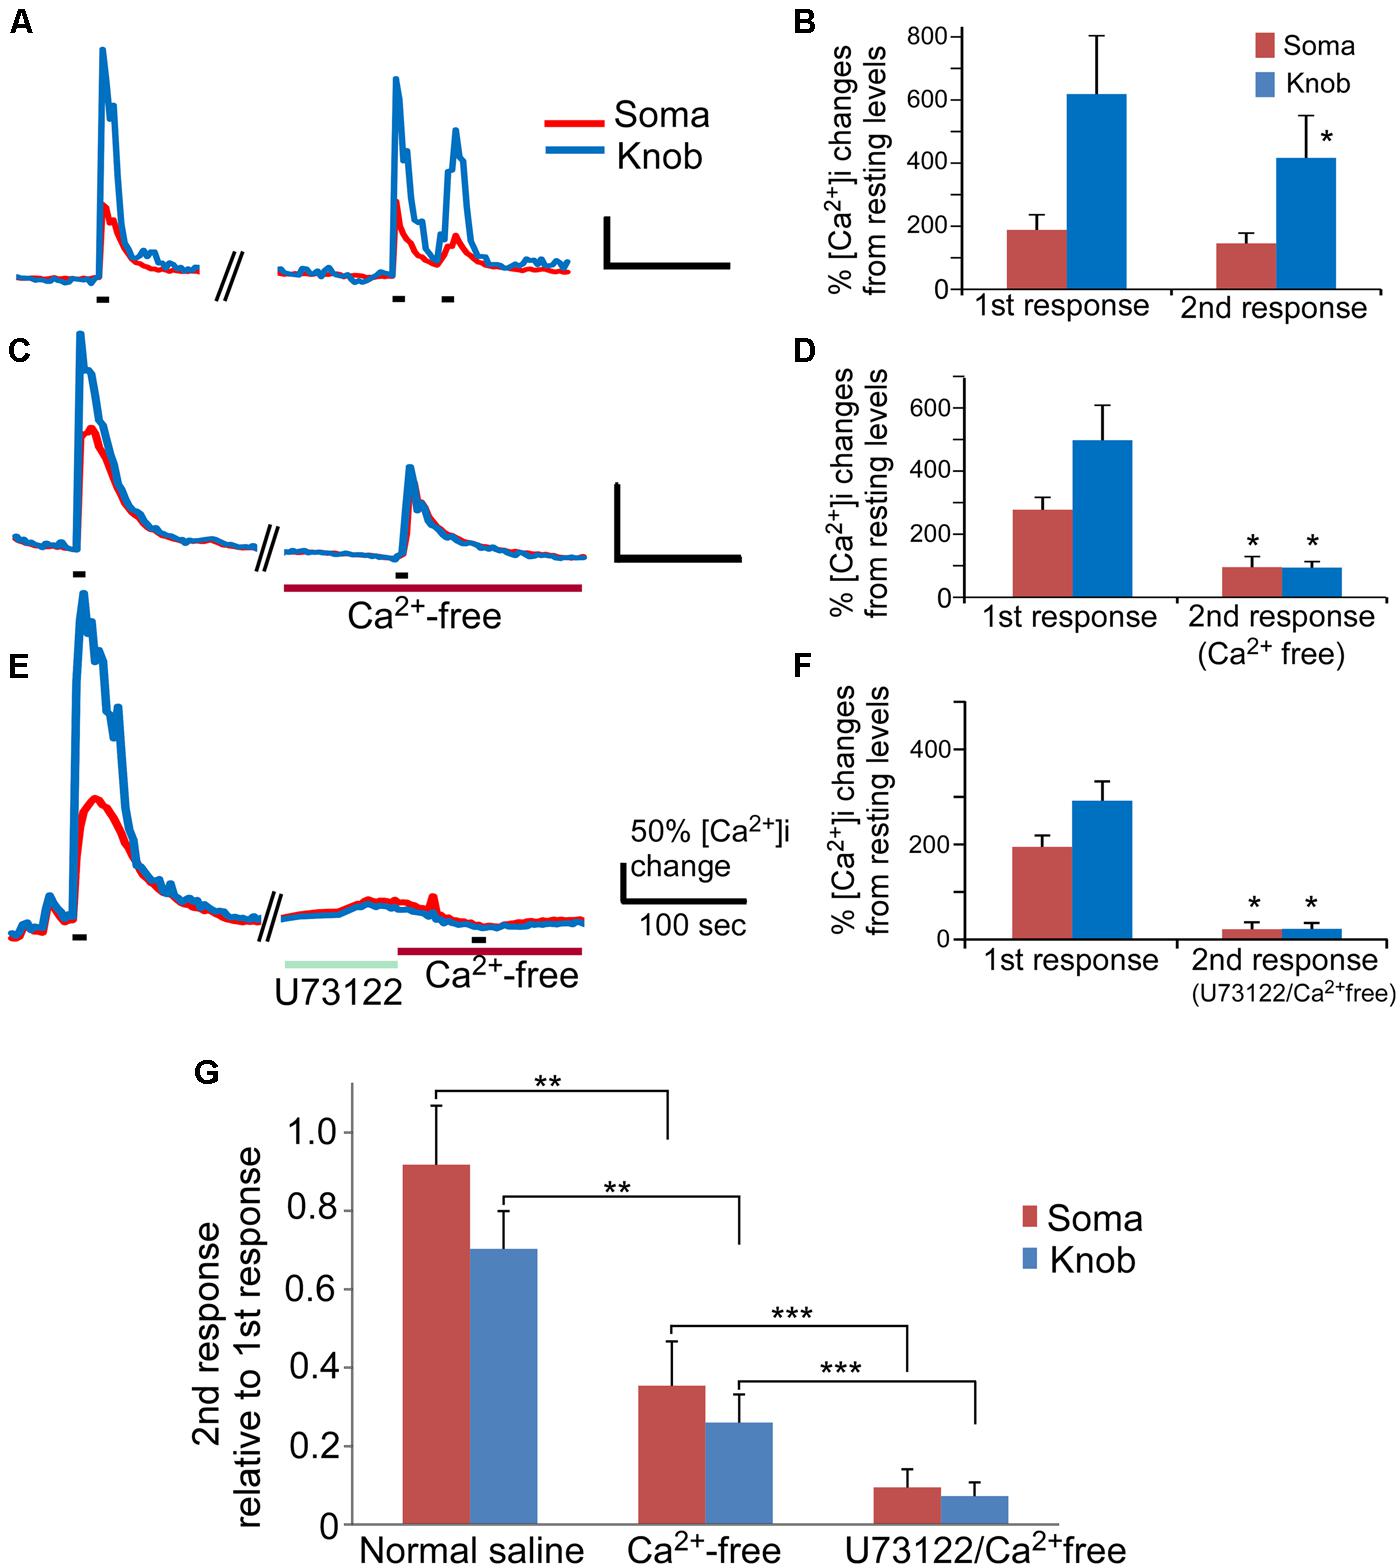
FIGURE 4. The PLC-mediated Ca2+ increase contributes to an odor mixture-induced intracellular Ca2+ increases. (A,C,E) Representative records of changes in Ca2+ levels from isolated OSNs in response to repetitive stimulation with an odor mixture. Red and blue color traces are obtained from the soma and dendritic knob regions, respectively. Black bars under the recording traces indicate 15 s stimulation. The first stimulation was applied in normal saline, followed by second stimulation in either normal saline (A), or in Ca2+ free (C), or in Ca2+ free after incubation with U73122 (E). Scale bars in (A,C,E) 50% change in Ca2+ level from the resting level and 100 s. (B,D,F) Averaged peak Ca2+ responses from 1st to 2nd stimulation correlating to (A,C,E; n = 9, 6, and 7 cells, respectively). Asterisk denotes the averaged second responses are significantly different compared to the paired first responses from the same cells (two-tail, paired t-test, p < 0.05). (G) Comparison of the normalized second response values obtained either in normal, Ca2+ free or Ca2+ free plus U73122 saline. The relative second response values were calculated by normalizing the values of the second responses to the values of the first responses from the same cells. Note that statistically significant differences are found between the normal and Ca2+ free saline (two-tail, t-test, **p < 0.05) and between Ca2+ free and Ca2+ free saline plus U73122 pre-incubation (two-tail, t-test, ***p < 0.05).
We further examined the role of PLC in the odor mixture-induced Ca2+ release in Ca2+-free bath by using the PLC inhibitor U73122. Pre-incubation of U73122 (5 μM) significantly reduced or eliminated the Ca2+ response to the 15 s odor mixture stimulation in Ca2+-free saline with stimulation interval ∼540 s (traces in Figure 4E and average amplitude plot in Figure 4F) as compared to the response obtained without U73122 pre-incubation (Figures 4C,D). Figure 4G shows the second response amplitude relative to the value of the first response, showing significant difference of the second response amplitude between in Ca2+ free and in U73122/Ca2+ free for both soma and knob region (p < 0.05, t-test, two-tail, n = 6 and 7 for Ca2+ free and U73122/Ca2+ free, respectively). These data provide further evidence that Ca2+ release via PLC activation is partially responsible for the odorant mixture-induced Ca2+ increases measured from the OSN cell bodies and dendritic knobs.
RT-PCR Analysis of Gene Transcript Expression of PLC Isozymes
To determine PLC gene transcript expression in the MOE, we used RT-PCR to probe all known mouse PLC isozymes. Using total RNA extracted from olfactory turbinate tissues in RT-PCR, we found a strong band of the PLCβ4 amplicant product and moderate or weak bands for PLC isozyme β3, γ1, and ε1 (Figure 5A, top left panel). Positive PCR products of these isozymes as well as other isozymes were obtained from control tissues including brain, spleen, and testis (Figure 5A, bottom panels). Because the lack of positive results for other PLC isozymes in the MOE preparations might be due to weak expression, we conducted RT-PCR experiments with increased amounts of RNA as starting template from 500 ng to 1.5 μg and an increased aliquot of the resulting cDNA from 1 to 5 μl for each PCR reaction. We also increased the number of PCR cycles from 30 to 40. Under such conditions, we observed additional positive bands for PLCβ1, β2, γ2 δ1, δ3, δ4, η2 (Figure 5A, top right panels). No product was found for PLCη1 and ζ1 although positive bands with correct sizes were found in control tissue (the size for ζ1 band in the MOE was incorrect). We repeated the experiments in RNA extract from three to six mice and confirmed the identity of all the amplicants by sequencing except δ1 due to the very low yield of the PCR product (Genewiz Inc.). These results indicate expression of multiple PLC isozymes in the olfactory turbinate tissue.
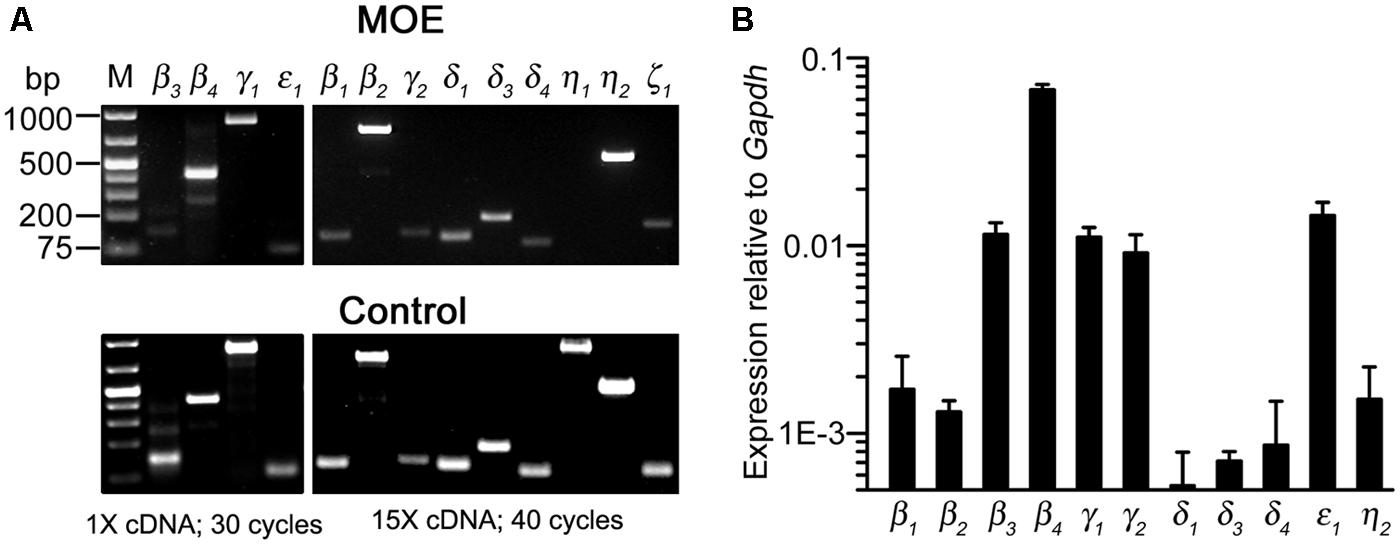
FIGURE 5. Gene transcript expression of multiple PLC isozymes in olfactory turbinate tissue. (A) RT-PCR analysis. Total RNA was extracted from olfactory turbinate tissue made up primarily of the MOE, and control tissues of brain for most of the isozymes except for β2 and ε1, for which spleen and testis RNA were used. Left: PCR products from a 30-cycle reaction that used 1 μl of the cDNA synthesis products (total 20 μl; started with 500 ng RNA). Right: PCR products from a 40-cycle reaction that used 5 μl of the cDNA synthesis products (total 20 μl; started with 1.5 μg RNA). (B) Real-time qPCR analysis. The expression levels are plotted relative to the expression of Gapdh reference gene, showing stronger expression of PLCβ3, β4, γ1, γ2, and ε1 as compared to PLCβ1, β2, δ3, δ4, η2 in the MOE.
Real-Time Quantitative PCR Analysis of PLC Isozyme Expression
We next conducted qPCR to determine the relative expression levels of these isozymes in RNA extracted from the olfactory turbinate tissues. The expression level of a housekeeping gene glyceraldehyde phosphate dehydrogenase (Gapdh) was used for comparison. We found that PLC β3, β4, γ1, and ε1 were expressed at significantly higher levels than PLC β1, β2, δ1, δ3, δ4, and η2 (F10,22 = 104.4, p < 0.001 one-way ANOVA for 11 isozymes, α =0.05 for post hoc Tukey’s multicomparison; n = 3 mice; Figure 5B), with β4 expression being the highest. Additionally, qPCR data also indicate relatively high expression of γ2, which is comparable to the expression levels of β3, γ1 and ε1, although there is no significant difference from the isozymes expressed at lower levels (F3,8 = 1.18, p = 0.38, one-way ANOVA for the four isozymes, n = 3 mice). These quantitative results confirm the expression of multiple PLC isozymes in the olfactory turbinate tissues.
Rish Analysis on Cell-Type Specific Transcript Expression of PLCβ4, γ1, and γ2 in the MOE
Because our qPCR data show that PLCβ4 is expressed at the highest level among all the isozymes and reportedly present in neurons of the cerebellum and retina (Lee et al., 1993; Roustan et al., 1995), we first probed its gene transcript expression in MOE coronal sections. We found that the RISH signal yielded from the PLCβ4 antisense probe is not confined to any particular layer or specific cell types in the MOE, although some cells in the OSN layer exhibited relatively stronger signal than their neighboring cells. Additionally, the antisense probe also positively labeled some cells in the lamina propria (Figure 6A, low magnification image, Figure 6A’ higher magnification image). The RISH experiment with the sense probe, which was conducted at the same time and under the same conditions, did not yield any apparent labels (Figure 6A”). To confirm this result, we repeated the RISH experiment using a different primer set, which sequence information was obtained from the Allen Brain Atlas data portal, to synthesize riboprobes. We obtained the same results (data not shown), indicating that the PLCβ4 mRNA transcripts are expressed in multiple cell types in the olfactory turbinate, which might result in a high expression level as indicated by our qPCR data.
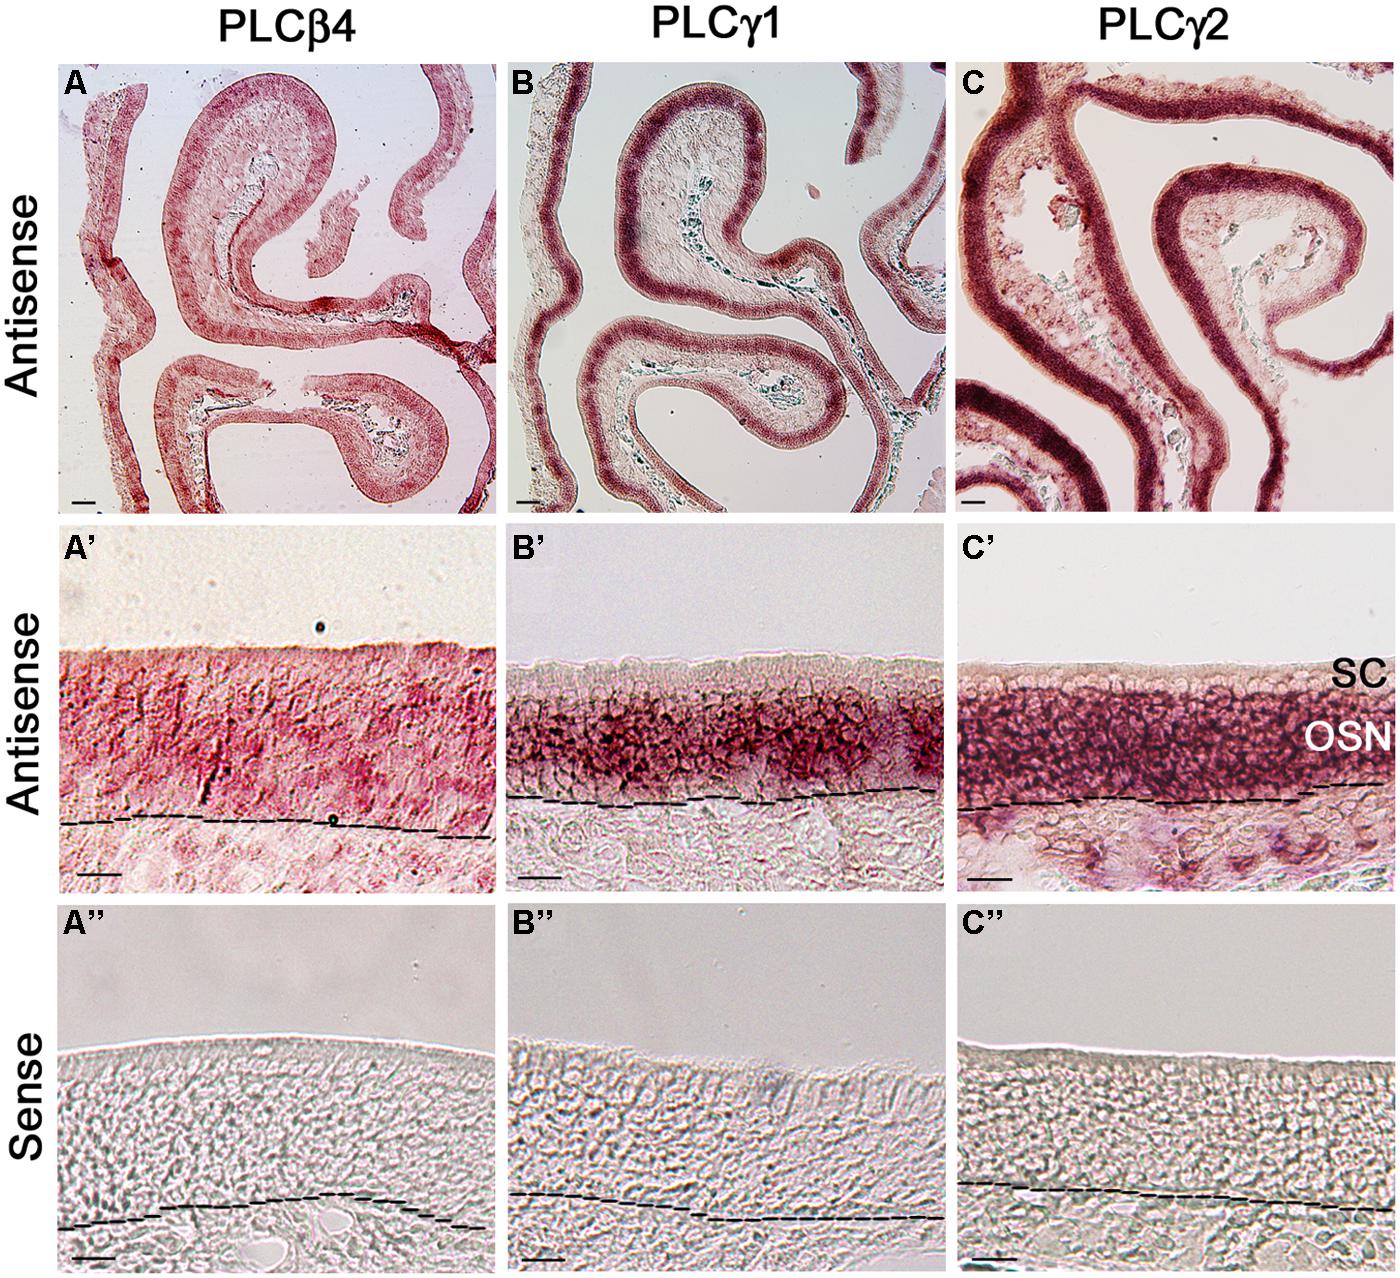
FIGURE 6. RNA in situ hybridization analysis of PLCβ4, γ1, and γ2 isozyme expression in the MOE. (A,A’) Lower and higher magnification images from MOE sections labeled with PLCβ4 antisense probes. RISH signal is present in various cell types of the MOE. as, antisense probe. Black dashed lines indicate basal lamina. (A”) Image from a section reacted with the PLCβ4 sense probe, showing absence of specific labeling. sen, sense probe. (B,B’) Lower and higher magnification images, showing PLCγ1 expression. The label is limited in the OSN layer. (B”) No labeling from the PLCγ1 sense probe. (C,C’) Lower and higher magnification images showing PLCγ2 expression in the MOE. OSN layer is strongly labeled. (C”) Image from the sense probe of PLCγ2. No labeling was found. SC, sustentacular/supporting cell layer; OSN, olfactory sensory neuron layer. Scale: (A–C) 50 μm; (A’–C”) 20 μm.
We next examined the expression of two PLCγ isozymes because positive immunoreactivity for PLCγ1 is reportedly present in OSNs (Liu et al., 2006). We found that both PLCγ1 and γ2 antisense probes strongly label the OSN layers (Figures 6B,C: low magnification image, Figures 6B‘,C’: higher magnification image, from the γ1 and γ2 antisense probes, respectively; Figures 6B″,C″: γ1 and γ2 sense probe labeling, respectively). Further close comparison between the two antisense labeling images, we found that the PLCγ1 signal is apparently restrict to the middle region of the MOE, where mature OSNs are located, while the γ2 signal is present in the entire OSN layer (dotted lines in the images represent the basal lamina), indicating that the isozyme is most likely expressed in both immature and mature neurons. Taken together, our RISH results confirm the expression of PLCγ1 and additionally, we show presence of PLCβ4 and γ2 in OSNs.
Discussion
We have investigated PLC-mediated activity and its isozyme expression in mouse OSNs using physiological and molecular approaches. Our results from single-cell Ca2+ imaging provide evidence that direct activation of PLC by m-3M3FBS leads to a large increase in intracellular Ca2+ in a vast majority of OSNs tested. This PLC-mediated Ca2+ increase is primarily from internal Ca2+ release since removal of extracellular Ca2+ has minimal effect on both the response amplitude and percent responding cells. We also showed that in the absence of extracellular Ca2+, the odor mixture-induced small Ca2+ response is mediated by PLC via internal Ca2+ release. Furthermore, we showed expression of multiple PLC isozymes and relatively higher levels of PLC β3, β4, γ1, γ2, and ε1 expression in the MOE as compared to other isozymes. Our RISH analysis confirms that OSNs express at least PLC β4, γ1, γ2 gene transcripts. Taken together, our results reveal the abundance of PLC-mediated activities and multiple isozyme transcript expression in mouse OSNs, providing basic knowledge for further investigation of PLC isozyme-mediated complex cellular signaling and regulations.
PLC-Mediated Activities Via Dag and Down-Stream Protein Kinase C
All 13 PLC isozymes identified to date are capable of catalyzing the hydrolysis of PIP2 to produce second messenger DAG and IP3 (Rhee, 2001). In mouse vomeronasal sensory neurons, DAG-mediated activation of TRPC2 is believed to play a key role in pheromone signal transduction (Spehr et al., 2002; Lucas et al., 2003; Zhang et al., 2010). Whether DAG directly activates ion channels in OSNs is not known currently. In our experiment, removal of external Ca2+ from the bath solution did not significantly reduce PLC-mediated intracellular Ca2+ increase. Thus, it is likely that the contribution of DAG-mediated Ca2+ influx via unknown ion channels to the overall PLC-mediated Ca2+ increase, if there is any, is minimal in mouse mature OSNs. Another major role of DAG is to activate protein kinase C (PKC), which is made up of a family of ten serine/threonine kinases (Takai et al., 1979; Kishimoto et al., 1980), and PKC related kinases (Mukai, 2003; Rykx et al., 2003). These kinases are known to be involved in cellular responses to environmental cues, cell proliferation, maturation, and regulation of gene expression in many cell types (Nishizuka, 1988). PKC has been studied in olfactory systems of various species. Bruch et al. (1997) found expression of multiple PKC gene transcripts in channel catfish olfactory tissue using RT-PCR (Bruch et al., 1997). In drosophila OSNs, PKC activation via the PLC pathway results in an enhancement of odor responses (Sargsyan et al., 2011) and altered behavioral preference to odorants (Tsunozaki et al., 2008). In mammals, odor stimulation induced phosphorylation of rat cilia proteins (Boekhoff et al., 1992). Pharmacological inhibition of PKC alters the odor-induced Ca2+ increases in isolated rat and human OSNs (Gomez et al., 2000). In addition to direct modulation of odor signaling, PKC also indirectly regulate signal output of OSNs by changing membrane excitability (Han and Lucero, 2006). Because DAG is the endogenous ligand for PKC and is produced primarily via PLC-catalyzed breakdown of inositol phospholipids, it is conceivable that PLC activity is common among OSNs of various species from these diverse effects of PKC. In our study, we found that over 90% of OSNs tested are activated by the PLC activator m-3M3FBS at 25 μM, a concentration commonly used in other investigations and at least three PLC isozymes expressed in the OSNs. These consistent results all point to the abundant presence of PLC in OSNs.
PLC-Mediated Intracellular Ca2+ Increases Via IP3
Unlike DAG, the role of IP3 in odor transduction has been investigated by various approaches (Schild and Restrepo, 1998). Certain odorants stimulate IP3 production in various species and in a heterologous expression system (Boekhoff et al., 1990; Breer et al., 1990; Restrepo et al., 1993; Ronnett et al., 1993; Klasen et al., 2010; Benbernou et al., 2011). In patch clamping and Ca2+ imaging experiments, IP3 activates a voltage-independent Ca2+ current and a non-selective cation current in the plasma membrane, leading to a large increase in the intracellular Ca2+ in the dendritic knob of Xenopus laevis OSNs (Schild et al., 1995). Similar results are also obtained from isolated OSNs of other species (Restrepo et al., 1992; Okada et al., 1994; Kashiwayanagi, 1996; Lischka et al., 1999; Kaur et al., 2001). The classic action of IP3, however, is to activate IP3 receptors located in the membrane of specialized endoplasmic reticula, i.e., Ca2+ stores and release Ca2+ internally (Rhee, 2001; Suh et al., 2008; Yang et al., 2013). In our study, removal of external Ca2+ did not significantly alter the Ca2+ responses to the PLC-activator m-3M3FBS when comparing soma to soma and knob to knob between normal and Ca2+-free Tyrode’s solutions. These results indicate that PLC-mediated Ca2+ increase in mouse OSNs primarily relies on internal Ca2+ release. Our results are different from the previous findings from frog and rat OSNs, where Ca2+ influx contributes primarily to the IP3-meditated Ca2+ increases (Restrepo et al., 1992; Okada et al., 1994; Lischka et al., 1999). Whether this discrepancy results from species difference is currently unknown. In addition, because we did not record from cilia, the primary site for odor transduction, we cannot rule out presence of IP3-mediated Ca2+ influx through ion channels in the plasma membrane responsible for signal transduction of select odorants.
In our experiment, 25 μM m-3M3FBS evoked significantly higher Ca2+ increase in the soma than in the knob in Ca2+-free Tyrode’s solution (Figure 3B). Such difference was not observed when stimulated with 15 μM m-3M3FBS (Figure 3C). Endoplasmic reticulum (ER), which presumably can serve as Ca2+ stores are present in the knob as indicated by the ER specific markers (Pietrobon et al., 2011). Due of the smaller size of the knob, ER in this region likely does not have the same capacity for Ca2+ storage, which might limit the amount of Ca2+ that can be released upon stimulation.
Potential Role of PLC in Regulating OSN Activity and Output
According to the pioneering work of Maue and Dionne (1987), the large conductance Ca2+ activated K+ channels are the most frequently observed channels in both the knob and soma of mouse OSNs in patch clamp recordings and activation of these channels may also play a role in sensory adaptation in which the firing rate of OSNs is reduced during prolonged odor stimulation. PLC-mediated changes in intracellular Ca2+ levels potentially can regulate these channels and activation of PLC can be through purinergic receptors via Gq/G11 (Hegg et al., 2003; Verkhratsky, 2005; Yu and Zhang, 2014). In our study, we found expression of PLCβ4 using RISH and PCR. PLCβ4 can be activated via Gq/G11, which is reportedly present in OSNs (Menco et al., 1994).
Odor Mix-Induced Ca2+ Increase in the Absence of External Ca2+
In our Ca2+ imaging experiment, we observed a rapid increase in intracellular Ca2+ when stimulated with the odorant mixture in normal Tyrode’s. When the external Ca2+ is removed, the odorant response amplitude is significantly reduced, suggesting that the Ca2+ increase largely resulted from Ca2+ influx. Our results are consistent with the current view on the dominant role of cAMP pathway in rodent odor transduction. In this canonical pathway, odor stimulation leads to an increase in the intracellular cAMP level, leading to the opening of CNG channels and Ca2+ influx, which subsequently activates the Ca2+-activated Cl- channels for further membrane depolarization via Cl- efflux (Schild and Restrepo, 1998). However, in the absence of external Ca2+ (Ca2+ free saline plus 5 mM BAPTA) the odor mix still induced a small Ca2+ increase in most OSNs tested and the PLC inhibitor U73122 eliminated this response, suggesting a role of PLC and internal Ca2+ release in odor-evoked Ca2+ increase. These results are in consistent with a recent report by Pietrobon et al. (2011), in which they investigated odor-induced Ca2+ responses in rat cultured OSNs. They found that odor-evoked increase in intracellular Ca2+ persists in the Ca2+-free Rigner’s solution, which is blocked by PLC inhibitor U73122 and this internal Ca2+ release is sufficient to stimulate cGMP production in most OSNs tested. Pathways linking odor stimulation to PLC activation is not established. One possibility is via G-protein Gβγ subunits which are dissociated from the Gαolf upon odor stimulation that activates the canonical pathway. We recently found that the Gβ1γ13 dimer is the dominant Gβγ subunits expressing in the mature OSNs (Sathyanesan et al., 2013). It will be interesting to determine whether Gβ1γ13 contribute to PLC isozyme activation in OSNs.
Also, whether this small Ca2+ response originates from the cilia or the knob is not known. An elegant experiment by Leinders-Zufall et al. (1997) revealed Ca2+ wave propagating from cilia to the knob and soma following odor stimulation in dissociated salamander OSNs. Due to the small diameter of mouse OSN cilia, we did not monitor ciliary Ca2+ changes. Because multiple PLC isozymes can be expressed in a single-cell in a spatially restricted fashion, the PLC-mediated events in cilia, if there is any, might not be the same as in the knob and soma.
Expression of Multiple PLC Isozymes in the MOE
Our PCR experiments show that the olfactory turbinate tissue, which is made up mostly of MOE, expresses multiple PLC isozymes at various levels. This level of complexity is not surprising, given the diverse roles of PLC isozymes and presence of multiple cell types in the MOE. Previously, Liu et al. (2006) found expression of PLCβ1–3 and γ1 in the membrane fraction of Odora culture cells and rat MOE using Western blotting. They also confirmed the expression of PLCβ1–3 in rat OSNs and their axon bundles using immunolabeling. In our qPCR analysis, we found that the gene transcript expression levels of PLCβ1 and β2 are significantly lower than those of PLCβ3 and β4. In RISH analysis, we found expression of PLCβ4 transcript in the OSNs as well as other cell types of the MOE. Because PLCγ1 gene transcript was detected in sustentacular cells (Bruch et al., 1995), we also performed RISH analysis on the two PLCγ isozymes. In consistent with our qPCR results, our RISH data clearly show the expression of PLCγ1 and γ2 in the OSNs. Therefore, multiple PLC isozymes are expressed in mouse OSNs, supporting our findings in Ca2+ imaging.
The specific functions of these PLC isozymes in OSNs are yet to be determined. It is well known that mechanisms activating and regulating these isozymes are different. For example, PLCβ3 is activated through both Gαq and Gβγ. PLCβ4 is activated by Gαq and is insensitive to Gβγ. PLCγ1 and γ2 are activated via receptor tyrosine kinases, in contrast to the PLCβ group (Kamat and Carpenter, 1997; Carpenter and Ji, 1999). We recently found that the Gβ1γ13 dimer is the dominant Gβγ subunits expressing in the mature OSNs (Sathyanesan et al., 2013). It will be interesting to determine whether Gβ1γ13 contributes to PLC isozyme activation in OSNs.
The Use of PLC Activator and its Specificity
In this study, we used the PLC activator m-3M3FBS to directly activate PLC because isozyme-specific activators and inhibitors are not available commercially. m-3M3FBS activates all PLC isozymes and has been used in studies of neurons, immune cells, sensory epithelial cells, and various cancer cells. Results of these studies have shown that m-3M3FBS induces intracellular Ca2+ release, IP3 production and reduction of PIP2, consistent with the expected outcome of PLC activation (Bae et al., 2003; Clapp et al., 2006; Li et al., 2009; Fujita et al., 2013). However, non-specific effects (Krjukova et al., 2004) and auto-fluorescence have also been reported (Jansen et al., 2004). Because there is no published result using m-3M3FBS in OSNs, we conducted stringent experiments to determine its specificity by: (1) pairing m-3M3FBS with its inactive analog o-3M3FBS; (2) using PLC inhibitor U73122 to block the m-3M3FBS responses, which was also paired with the inactive analog U73433; (3) determining Ca2+ source responsible for the m-3M3FBS-evoked Ca2+ increases; and (4) testing the auto-fluorescence of m-3M3FBS in the bath solution. Our results clearly demonstrate that m-3M3FBS specifically activates PLC in OSNs under our experimental conditions.
Conclusion
In summary, we have provided strong physiological and molecular evidence for PLC-mediated changes in intracellular Ca2+ and expression of multiple PLC isozyme gene transcripts in a vast majority of mouse OSNs. Because the PLCβ4, γ1, and γ2 that we found in the OSNs can be activated via various cell surface receptors and intracellular Ca2+ influence a variety of cellular activities, we expect diverse and complex roles of PLC isozymes in OSNs. Our study therefore is significant in providing basic knowledge of PLC isozymes for future investigation, especially in the area of regulation of olfactory activities.
Author Contributions
Steven A. Szebenyi performed most of the Ca2+ imaging experiment. Tatsuya Ogura and Steven A. Szebenyi designed Ca2+ imaging experiments and performed data analysis. Tatsuya Ogura drafted some Ca2+ imaging results. Aaron Sathyanesan and Abdullah K. AlMatrouk performed RT-PCR, qPCR, and RISH experiments. Aaron Sathyanesan, Abdullah K. AlMatrouk, and Tatsuya Ogura performed qPCR data analyses. Justin Chang performed some Ca2+ imaging and data analysis. Weihong Lin conceived, supervised the project and drafted most of the manuscript. All authors read, edited and approved the manuscript.
Conflict of Interest Statement
The authors declare that the research was conducted in the absence of any commercial or financial relationships that could be construed as a potential conflict of interest.
Acknowledgments
We thank Ms. Wangmei Luo and Akua Nimarko for technical assistance. This work was supported by NIH/NIDCD 009269 and DC012831 to Weihong Lin.
Supplementary Material
The Supplementary Material for this article can be found online at: http://www.frontiersin.org/journal/10.3389/fncel.2014.00336/abstract
References
Bae, Y. S., Lee, T. G., Park, J. C., Hur, J. H., Kim, Y., Heo, K.,et al. (2003). Identification of a compound that directly stimulates phospholipase C activity. Mol. Pharmacol. 63, 1043–1050. doi: 10.1124/mol.63.5.1043
Pubmed Abstract | Pubmed Full Text | CrossRef Full Text | Google Scholar
Belluscio, L., Gold, G. H., Nemes, A., and Axel, R. (1998). Mice deficient in G(olf) are anosmic. Neuron 20, 69–81. doi: 10.1016/S0896-6273(00)80435-3
Pubmed Abstract | Pubmed Full Text | CrossRef Full Text | Google Scholar
Benbernou, N., Robin, S., Tacher, S., Rimbault, M., Rakotomanga, M., and Galibert, F. (2011). cAMP and IP3 signaling pathways in HEK293 cells transfected with canine olfactory receptor genes. J. Hered. 102(Suppl. 1), S47–S61. doi: 10.1093/jhered/esr033
Pubmed Abstract | Pubmed Full Text | CrossRef Full Text | Google Scholar
Boekhoff, I., Schleicher, S., Strotmann, J., and Breer, H. (1992). Odor-induced phosphorylation of olfactory cilia proteins. Proc. Natl. Acad. Sci. U.S.A. 89, 11983–11987. doi: 10.1073/pnas.89.24.11983
Pubmed Abstract | Pubmed Full Text | CrossRef Full Text | Google Scholar
Boekhoff, I., Tareilus, E., Strotmann, J., and Breer, H. (1990). Rapid activation of alternative second messenger pathways in olfactory cilia from rats by different odorants. EMBO J. 9, 2453–2458.
Breer, H., Boekhoff, I., and Tareilus, E. (1990). Rapid kinetics of second messenger formation in olfactory transduction. Nature 345, 65–68. doi: 10.1038/345065a0
Pubmed Abstract | Pubmed Full Text | CrossRef Full Text | Google Scholar
Bruch, R. C. (1996). Phosphoinositide second messengers in olfaction. Comp. Biochem. Physiol. B Biochem. Mol. Biol. 113, 451–459. doi: 10.1016/0305-0491(95)02040-3
Bruch, R. C., Abogadie, F. C., and Farbman, A. I. (1995). Identification of three phospholipase C isotypes expressed in rat olfactory epithelium. Neuroreport 6, 233–237. doi: 10.1097/00001756-199501000-00002
Pubmed Abstract | Pubmed Full Text | CrossRef Full Text | Google Scholar
Bruch, R. C., Kang, J., Moore, M. L. Jr., and Medler, K. F. (1997). Protein kinase C and receptor kinase gene expression in olfactory receptor neurons. J. Neurobiol. 33, 387–394. doi: 10.1002/(SICI)1097-4695(199710)33:4<387::AID-NEU4>3.0.CO;2-6
Brunet, L. J., Gold, G. H., and Ngai, J. (1996). General anosmia caused by a targeted disruption of the mouse olfactory cyclic nucleotide-gated cation channel. Neuron 17, 681–693. doi: 10.1016/S0896-6273(00)80200-7
Pubmed Abstract | Pubmed Full Text | CrossRef Full Text | Google Scholar
Carpenter, G., and Ji, Q. (1999). Phospholipase C-gamma as a signal-transducing element. Exp. Cell Res. 253, 15–24. doi: 10.1006/excr.1999.4671 S0014482799946712
Pubmed Abstract | Pubmed Full Text | CrossRef Full Text | Google Scholar
Chen, S., Lane, A. P., Bock, R., Leinders-Zufall, T., and Zufall, F. (2000). Blocking adenylyl cyclase inhibits olfactory generator currents induced by “IP(3)-odors.” J. Neurophysiol. 84, 575–580.
Clapp, T. R., Medler, K. F., Damak, S., Margolskee, R. F., and Kinnamon, S. C. (2006). Mouse taste cells with G protein-coupled taste receptors lack voltage-gated calcium channels and SNAP-25. BMC Biol. 4:7. doi: 10.1186/1741-7007-4-7
Pubmed Abstract | Pubmed Full Text | CrossRef Full Text | Google Scholar
Clevenger, A. C., and Restrepo, D. (2006). Evaluation of the validity of a maximum likelihood adaptive staircase procedure for measurement of olfactory detection threshold in mice. Chem. Senses 31, 9–26. doi: 10.1093/chemse/bjj001
Pubmed Abstract | Pubmed Full Text | CrossRef Full Text | Google Scholar
Dunston, D., Ashby, S., Krosnowski, K., Ogura, T., and Lin, W. (2013). An effective manual deboning method to prepare intact mouse nasal tissue with preserved anatomical organization. J. Vis. Exp. e50538. doi: 10.3791/50538
Pubmed Abstract | Pubmed Full Text | CrossRef Full Text | Google Scholar
Fadool, D. A., and Ache, B. W. (1992). Plasma membrane inositol 1,4,5-trisphosphate-activated channels mediate signal transduction in lobster olfactory receptor neurons. Neuron 9, 907–918. doi: 10.1016/0896-6273(92)90243-7
Pubmed Abstract | Pubmed Full Text | CrossRef Full Text | Google Scholar
Frings, S., Seifert, R., Godde, M., and Kaupp, U. B. (1995). Profoundly different calcium permeation and blockage determine the specific function of distinct cyclic nucleotide-gated channels. Neuron 15, 169–179. doi: 10.1016/0896-6273(95)90074-8
Pubmed Abstract | Pubmed Full Text | CrossRef Full Text | Google Scholar
Fujita, F., Uchida, K., Takaishi, M., Sokabe, T., and Tominaga, M. (2013). Ambient temperature affects the temperature threshold for TRPM8 activation through interaction of phosphatidylinositol 4,5-bisphosphate. J. Neurosci. 33, 6154–6159. doi: 10.1523/JNEUROSCI.5672-12.2013
Pubmed Abstract | Pubmed Full Text | CrossRef Full Text | Google Scholar
Gomez, G., Rawson, N. E., Cowart, B., Lowry, L. D., Pribitkin, E. A., and Restrepo, D. (2000). Modulation of odor-induced increases in [Ca(2+)](i) by inhibitors of protein kinases A and C in rat and human olfactory receptor neurons. Neuroscience 98, 181–189. doi: 10.1016/S0306-4522(00)00112-3
Gresset, A., Sondek, J., and Harden, T. K. (2012). The phospholipase C isozymes and their regulation. Subcell. Biochem. 58, 61–94. doi: 10.1007/978-94-007-3012-0_3
Pubmed Abstract | Pubmed Full Text | CrossRef Full Text | Google Scholar
Han, P., and Lucero, M. T. (2006). Pituitary adenylate cyclase activating polypeptide reduces expression of Kv1.4 and Kv4.2 subunits underlying A-type K(+) current in adult mouse olfactory neuroepithelia. Neuroscience 138, 411–419. doi: 10.1016/j.neuroscience.2005.11.028
Pubmed Abstract | Pubmed Full Text | CrossRef Full Text | Google Scholar
Hegg, C. C., Greenwood, D., Huang, W., Han, P., and Lucero, M. T. (2003). Activation of purinergic receptor subtypes modulates odor sensitivity. J. Neurosci. 23, 8291–8301.
Hegg, C. C., and Lucero, M. T. (2004). Dopamine reduces odor- and elevated-K(+)-induced calcium responses in mouse olfactory receptor neurons in situ. J. Neurophysiol. 91, 1492–1499. doi: 10.1152/jn.00670.2003
Pubmed Abstract | Pubmed Full Text | CrossRef Full Text | Google Scholar
Jansen, S., Arning, J., Kemken, D., Dulcks, T., and Beyersmann, D. (2004). Phospholipase C activator 2,4,6-trimethyl-N-(meta-3-trifluoromethyl-phenyl)-benzene-sulfonamide decays under ultraviolet light and shows strong self-fluorescence. Anal. Biochem. 330, 353–355. doi: 10.1016/j.ab.2004.02.047
Pubmed Abstract | Pubmed Full Text | CrossRef Full Text | Google Scholar
Kamat, A., and Carpenter, G. (1997). Phospholipase C-gamma1: regulation of enzyme function and role in growth factor-dependent signal transduction. Cytokine Growth Factor Rev. 8, 109–117. doi: 10.1016/S1359-6101(97)00003-8
Kashiwayanagi, M. (1996). Dialysis of inositol 1,4,5-trisphosphate induces inward currents and Ca2+ uptake in frog olfactory receptor cells. Biochem. Biophys. Res. Commun. 225, 666–671. doi: 10.1006/bbrc.1996.1227
Pubmed Abstract | Pubmed Full Text | CrossRef Full Text | Google Scholar
Kaur, R., Zhu, X. O., Moorhouse, A. J., and Barry, P. H. (2001). IP3-gated channels and their occurrence relative to CNG channels in the soma and dendritic knob of rat olfactory receptor neurons. J. Membr. Biol. 181, 91–105. doi: 10.1007/s0023200100135
Pubmed Abstract | Pubmed Full Text | CrossRef Full Text | Google Scholar
Kishimoto, A., Takai, Y., Mori, T., Kikkawa, U., and Nishizuka, Y. (1980). Activation of calcium and phospholipid-dependent protein kinase by diacylglycerol, its possible relation to phosphatidylinositol turnover. J. Biol. Chem. 255, 2273–2276.
Klasen, K., Corey, E. A., Kuck, F., Wetzel, C. H., Hatt, H., and Ache, B. W. (2010). Odorant-stimulated phosphoinositide signaling in mammalian olfactory receptor neurons. Cell. Signal. 22, 150–157. doi: 10.1016/j.cellsig.2009.09.026
Pubmed Abstract | Pubmed Full Text | CrossRef Full Text | Google Scholar
Krjukova, J., Holmqvist, T., Danis, A. S., Akerman, K. E., and Kukkonen, J. P. (2004). Phospholipase C activator m-3M3FBS affects Ca2+ homeostasis independently of phospholipase C activation. Br. J. Pharmacol. 143, 3–7. doi: 10.1038/sj.bjp.0705911
Pubmed Abstract | Pubmed Full Text | CrossRef Full Text | Google Scholar
Lee, C. W., Park, D. J., Lee, K. H., Kim, C. G., and Rhee, S. G. (1993). Purification, molecular cloning, and sequencing of phospholipase C-beta 4. J. Biol. Chem. 268, 21318–21327.
Leinders-Zufall, T., Rand, M. N., Shepherd, G. M., Greer, C. A., and Zufall, F. (1997). Calcium entry through cyclic nucleotide-gated channels in individual cilia of olfactory receptor cells: spatiotemporal dynamics. J. Neurosci. 17, 4136–4148.
Li, L., Hutchins, B. I., and Kalil, K. (2009). Wnt5a induces simultaneous cortical axon outgrowth and repulsive axon guidance through distinct signaling mechanisms. J. Neurosci. 29, 5873–5883. doi: 10.1523/JNEUROSCI.0183-09.2009
Pubmed Abstract | Pubmed Full Text | CrossRef Full Text | Google Scholar
Lin, W., Arellano, J., Slotnick, B., and Restrepo, D. (2004). Odors detected by mice deficient in cyclic nucleotide-gated channel subunit A2 stimulate the main olfactory system. J. Neurosci. 24, 3703–3710. doi: 10.1523/JNEUROSCI.0188-04.2004
Pubmed Abstract | Pubmed Full Text | CrossRef Full Text | Google Scholar
Lischka, F. W., Zviman, M. M., Teeter, J. H., and Restrepo, D. (1999). Characterization of inositol-1,4,5-trisphosphate-gated channels in the plasma membrane of rat olfactory neurons. Biophys. J. 76, 1410–1422. doi: 10.1016/S0006-3495(99)77302-9
Pubmed Abstract | Pubmed Full Text | CrossRef Full Text | Google Scholar
Liu, G., Badeau, R. M., Tanimura, A., and Talamo, B. R. (2006). Odorant receptors directly activate phospholipase C/inositol-1,4,5-trisphosphate coupled to calcium influx in Odora cells. J. Neurochem. 96, 1591–1605. doi: 10.1111/j.1471-4159.2006.03667.x
Pubmed Abstract | Pubmed Full Text | CrossRef Full Text | Google Scholar
Lucas, P., Ukhanov, K., Leinders-Zufall, T., and Zufall, F. (2003). A diacylglycerol-gated cation channel in vomeronasal neuron dendrites is impaired in TRPC2 mutant mice: mechanism of pheromone transduction. Neuron 40, 551–561. doi: 10.1016/S0896-6273(03)00675-5
Ma, M. (2012). Odor and pheromone sensing via chemoreceptors. Adv. Exp. Med. Biol. 739, 93–106. doi: 10.1007/978-1-4614-1704-0_6
Pubmed Abstract | Pubmed Full Text | CrossRef Full Text | Google Scholar
Majerus, P. W., Connolly, T. M., Deckmyn, H., Ross, T. S., Bross, T. E., Ishii, H.,et al. (1986). The metabolism of phosphoinositide-derived messenger molecules. Science 234, 1519–1526. doi: 10.1126/science.3024320
Maue, R. A., and Dionne, V. E. (1987). Patch-clamp studies of isolated mouse olfactory receptor neurons. J. Gen. Physiol. 90, 95–125. doi: 10.1085/jgp.90.1.95
Menco, B. P., Tekula, F. D., Farbman, A. I., and Danho, W. (1994). Developmental expression of G-proteins and adenylyl cyclase in peripheral olfactory systems. Light microscopic and freeze-substitution electron microscopic immunocytochemistry. J. Neurocytol. 23, 708–727. doi: 10.1007/BF01181645
Pubmed Abstract | Pubmed Full Text | CrossRef Full Text | Google Scholar
Miyamoto, T., Restrepo, D., Cragoe, E. J. Jr., and Teeter, J. H. (1992). IP3- and cAMP-induced responses in isolated olfactory receptor neurons from the channel catfish. J. Membr. Biol. 127, 173–183. doi: 10.1007/BF00231505
Pubmed Abstract | Pubmed Full Text | CrossRef Full Text | Google Scholar
Mukai, H. (2003). The structure and function of PKN, a protein kinase having a catalytic domain homologous to that of PKC. J. Biochem. 133, 17–27. doi: 10.1093/jb/mvg019
Pubmed Abstract | Pubmed Full Text | CrossRef Full Text | Google Scholar
Munger, S. D., Gleeson, R. A., Aldrich, H. C., Rust, N. C., Ache, B. W., and Greenberg, R. M. (2000). Characterization of a phosphoinositide-mediated odor transduction pathway reveals plasma membrane localization of an inositol 1,4, 5-trisphosphate receptor in lobster olfactory receptor neurons. J. Biol. Chem. 275, 20450–20457. doi: 10.1074/jbc.M001989200
Pubmed Abstract | Pubmed Full Text | CrossRef Full Text | Google Scholar
Nishizuka, Y. (1988). The molecular heterogeneity of protein kinase C and its implications for cellular regulation. Nature 334, 661–665. doi: 10.1038/334661a0
Pubmed Abstract | Pubmed Full Text | CrossRef Full Text | Google Scholar
Ogura, T., Krosnowski, K., Zhang, L., Bekkerman, M., and Lin, W. (2010). Chemoreception regulates chemical access to mouse vomeronasal organ: role of solitary chemosensory cells. PLoS ONE 5:e11924. doi: 10.1371/journal.pone.0011924
Pubmed Abstract | Pubmed Full Text | CrossRef Full Text | Google Scholar
Ogura, T., Mackay-Sim, A., and Kinnamon, S. C. (1997). Bitter taste transduction of denatonium in the mudpuppy Necturus maculosus. J. Neurosci. 17, 3580–3587.
Ogura, T., Szebenyi, S. A., Krosnowski, K., Sathyanesan, A., Jackson, J., and Lin, W. (2011). Cholinergic microvillous cells in the mouse main olfactory epithelium and effect of acetylcholine on olfactory sensory neurons and supporting cells. J. Neurophysiol. 106, 1274–1287. doi: 10.1152/jn.00186.2011
Pubmed Abstract | Pubmed Full Text | CrossRef Full Text | Google Scholar
Okada, Y., Teeter, J. H., and Restrepo, D. (1994). Inositol 1,4,5-trisphosphate-gated conductance in isolated rat olfactory neurons. J. Neurophysiol. 71, 595–602.
Pietrobon, M., Zamparo, I., Maritan, M., Franchi, S. A., Pozzan, T., and Lodovichi, C. (2011). Interplay among cGMP, cAMP, and Ca2+ in living olfactory sensory neurons in vitro and in vivo. J. Neurosci. 31, 8395–8405. doi: 10.1523/JNEUROSCI.6722-10.2011
Pubmed Abstract | Pubmed Full Text | CrossRef Full Text | Google Scholar
Rebecchi, M. J., and Pentyala, S. N. (2000). Structure, function, and control of phosphoinositide-specific phospholipase C. Physiol. Rev. 80, 1291–1335.
Restrepo, D., Boekhoff, I., and Breer, H. (1993). Rapid kinetic measurements of second messenger formation in olfactory cilia from channel catfish. Am. J. Physiol. 264, C906–C911.
Restrepo, D., Miyamoto, T., Bryant, B. P., and Teeter, J. H. (1990). Odor stimuli trigger influx of calcium into olfactory neurons of the channel catfish. Science 249, 1166–1168. doi: 10.1126/science.2168580
Pubmed Abstract | Pubmed Full Text | CrossRef Full Text | Google Scholar
Restrepo, D., Teeter, J. H., Honda, E., Boyle, A. G., Marecek, J. F., Prestwich, G. D.,et al. (1992). Evidence for an InsP3-gated channel protein in isolated rat olfactory cilia. Am. J. Physiol. 263, C667–C673.
Rhee, S. G. (2001). Regulation of phosphoinositide-specific phospholipase C. Annu. Rev. Biochem. 70, 281–312. doi: 10.1146/annurev.biochem.70.1.281
Ronnett, G. V., Cho, H., Hester, L. D., Wood, S. F., and Snyder, S. H. (1993). Odorants differentially enhance phosphoinositide turnover and adenylyl cyclase in olfactory receptor neuronal cultures. J. Neurosci. 13, 1751–1758.
Roustan, P., Abitbol, M., Menini, C., Ribeaudeau, F., Gerard, M., Vekemans, M.,et al. (1995). The rat phospholipase C beta 4 gene is expressed at high abundance in cerebellar Purkinje cells. Neuroreport 6, 1837–1841. doi: 10.1097/00001756-199510020-00004
Pubmed Abstract | Pubmed Full Text | CrossRef Full Text | Google Scholar
Rykx, A., De Kimpe, L., Mikhalap, S., Vantus, T., Seufferlein, T., Vandenheede, J. R.,et al. (2003). Protein kinase D: a family affair. FEBS Lett. 546, 81–86. doi: 10.1016/S0014-5793(03)00487-3
Pubmed Abstract | Pubmed Full Text | CrossRef Full Text | Google Scholar
Sansone, A., Hassenklover, T., Syed, A. S., Korsching, S. I., and Manzini, I. (2014). Phospholipase C and diacylglycerol mediate olfactory responses to amino acids in the main olfactory epithelium of an amphibian. PLoS ONE 9:e87721. doi: 10.1371/journal.pone.0087721
Pubmed Abstract | Pubmed Full Text | CrossRef Full Text | Google Scholar
Sargsyan, V., Getahun, M. N., Llanos, S. L., Olsson, S. B., Hansson, B. S., and Wicher, D. (2011). Phosphorylation via PKC regulates the function of the Drosophila odorant co-receptor. Front. Cell. Neurosci. 5:5. doi: 10.3389/fncel.2011.00005
Pubmed Abstract | Pubmed Full Text | CrossRef Full Text | Google Scholar
Sathyanesan, A., Feijoo, A. A., Mehta, S. T., Nimarko, A. F., and Lin, W. (2013). Expression profile of G-protein betagamma subunit gene transcripts in the mouse olfactory sensory epithelia. Front. Cell. Neurosci. 7:84. doi: 10.3389/fncel.2013.00084
Pubmed Abstract | Pubmed Full Text | CrossRef Full Text | Google Scholar
Schild, D., Lischka, F. W., and Restrepo, D. (1995). InsP3 causes an increase in apical [Ca2+]i by activating two distinct current components in vertebrate olfactory receptor cells. J. Neurophysiol. 73, 862–866.
Schild, D., and Restrepo, D. (1998). Transduction mechanisms in vertebrate olfactory receptor cells. Physiol. Rev. 78, 429–466.
Singer, W. D., Brown, H. A., and Sternweis, P. C. (1997). Regulation of eukaryotic phosphatidylinositol-specific phospholipase C and phospholipase D. Annu. Rev. Biochem. 66, 475–509. doi: 10.1146/annurev.biochem.66.1.475
Spandidos, A., Wang, X., Wang, H., and Seed, B. (2010). PrimerBank: a resource of human and mouse PCR primer pairs for gene expression detection and quantification. Nucleic Acids Res. 38, D792–D799. doi: 10.1093/nar/gkp1005
Pubmed Abstract | Pubmed Full Text | CrossRef Full Text | Google Scholar
Spehr, M., Hatt, H., and Wetzel, C. H. (2002). Arachidonic acid plays a role in rat vomeronasal signal transduction. J. Neurosci. 22, 8429–8437.
Suh, P. G., Park, J. I., Manzoli, L., Cocco, L., Peak, J. C., Katan, M.,et al. (2008). Multiple roles of phosphoinositide-specific phospholipase C isozymes. BMB Rep. 41, 415–434. doi: 10.5483/BMBRep.2008.41.6.415
Takai, Y., Kishimoto, A., Kikkawa, U., Mori, T., and Nishizuka, Y. (1979). Unsaturated diacylglycerol as a possible messenger for the activation of calcium-activated, phospholipid-dependent protein kinase system. Biochem. Biophys. Res. Commun. 91, 1218–1224. doi: 10.1016/0006-291X(79)91197-5
Tsunozaki, M., Chalasani, S. H., and Bargmann, C. I. (2008). A behavioral switch: cGMP and PKC signaling in olfactory neurons reverses odor preference in C. elegans. Neuron 59, 959–971. doi: 10.1016/j.neuron.2008.07.038
Pubmed Abstract | Pubmed Full Text | CrossRef Full Text | Google Scholar
Verkhratsky, A. (2005). Physiology and pathophysiology of the calcium store in the endoplasmic reticulum of neurons. Physiol. Rev. 85, 201–279. doi: 10.1152/physrev.00004.2004
Pubmed Abstract | Pubmed Full Text | CrossRef Full Text | Google Scholar
Wong, S. T., Trinh, K., Hacker, B., Chan, G. C., Lowe, G., Gaggar, A.,et al. (2000). Disruption of the type III adenylyl cyclase gene leads to peripheral and behavioral anosmia in transgenic mice. Neuron 27, 487–497. doi: 10.1016/S0896-6273(00)00060-X
Pubmed Abstract | Pubmed Full Text | CrossRef Full Text | Google Scholar
Yang, Y. R., Follo, M. Y., Cocco, L., and Suh, P. G. (2013). The physiological roles of primary phospholipase C. Adv. Biol. Regul. 53, 232–241. doi: 10.1016/j.jbior.2013.08.003
Pubmed Abstract | Pubmed Full Text | CrossRef Full Text | Google Scholar
Ye, J., Coulouris, G., Zaretskaya, I., Cutcutache, I., Rozen, S., and Madden, T. L. (2012). Primer-BLAST: a tool to design target-specific primers for polymerase chain reaction. BMC Bioinformatics 13:134. doi: 10.1186/1471-2105-13-134
Pubmed Abstract | Pubmed Full Text | CrossRef Full Text | Google Scholar
Yu, Y., and Zhang, C. (2014). Purinergic signaling negatively regulates activity of an olfactory receptor in an odorant-dependent manner. Neuroscience 275, 89–101. doi: 10.1016/j.neuroscience.2014.05.055
Pubmed Abstract | Pubmed Full Text | CrossRef Full Text | Google Scholar
Zhang, P., Yang, C., and Delay, R. J. (2010). Odors activate dual pathways, a TRPC2 and a AA-dependent pathway, in mouse vomeronasal neurons. Am. J. Physiol. Cell Physiol. 298, C1253–C1264. doi: 10.1152/ajpcell.00271.2009
Pubmed Abstract | Pubmed Full Text | CrossRef Full Text | Google Scholar
Zhao, H., and Reed, R. R. (2001). X inactivation of the OCNC1 channel gene reveals a role for activity-dependent competition in the olfactory system. Cell 104, 651–660. doi: 10.1016/S0092-8674(01)00262-8
Pubmed Abstract | Pubmed Full Text | CrossRef Full Text | Google Scholar
Keywords: phospholipase C isozyme, calcium imaging, olfactory sensory neuron, real-time qPCR, RNA in situ hybridization
Citation: Szebenyi SA, Ogura T, Sathyanesan A, AlMatrouk AK, Chang J and Lin W (2014) Increases in intracellular calcium via activation of potentially multiple phospholipase C isozymes in mouse olfactory neurons. Front. Cell. Neurosci. 8:336. doi: 10.3389/fncel.2014.00336
Received: 29 July 2014; Accepted: 01 October 2014;
Published online: 21 October 2014.
Edited by:
Dieter Wicher, Max Planck Institute for Chemical Ecology, GermanyReviewed by:
Claudia Lodovichi, Venetian Institute of Molecular Medicine, ItalyMerid Negash Getahun, Max Planck Institute for Chemical Ecology and Addis Ababa University, Germany
Copyright © 2014 Szebenyi, Ogura, Sathyanesan, AlMatrouk, Chang and Lin. This is an open-access article distributed under the terms of the Creative Commons Attribution License (CC BY). The use, distribution or reproduction in other forums is permitted, provided the original author(s) or licensor are credited and that the original publication in this journal is cited, in accordance with accepted academic practice. No use, distribution or reproduction is permitted which does not comply with these terms.
*Correspondence: Weihong Lin, Department of Biological Sciences, University of Maryland Baltimore County, Baltimore, MD 21250, USA e-mail: weihong@umbc.edu