Lysosomal and phagocytic activity is increased in astrocytes during disease progression in the SOD1 G93A mouse model of amyotrophic lateral sclerosis
 David J. Baker
  Daniel J. Blackburn Marcus Keatinge Dilraj Sokhi Paulius Viskaitis
  Paul R. Heath
  Laura Ferraiuolo
  Janine Kirby*†
  Pamela J. Shaw†
- Department of Neuroscience, Sheffield Institute for Translational Neuroscience, University of Sheffield, Sheffield, UK
Astrocytes are key players in the progression of amyotrophic lateral sclerosis (ALS). Previously, gene expression profiling of astrocytes from the pre-symptomatic stage of the SOD1G93A model of ALS has revealed reduced lactate metabolism and altered trophic support. Here, we have performed microarray analysis of symptomatic and late-stage disease astrocytes isolated by laser capture microdissection (LCM) from the lumbar spinal cord of the SOD1G93A mouse to complete the picture of astrocyte behavior throughout the disease course. Astrocytes at symptomatic and late-stage disease show a distinct up-regulation of transcripts defining a reactive phenotype, such as those involved in the lysosome and phagocytic pathways. Functional analysis of hexosaminidase B enzyme activity in the spinal cord and of astrocyte phagocytic ability has demonstrated a significant increase in lysosomal enzyme activity and phagocytic activity in SOD1G93A vs. littermate controls, validating the findings of the microarray study. In addition to the increased reactivity seen at both stages, astrocytes from late-stage disease showed decreased expression of many transcripts involved in cholesterol homeostasis. Staining for the master regulator of cholesterol synthesis, SREBP2, has revealed an increased localization to the cytoplasm of astrocytes and motor neurons in late-stage SOD1G93A spinal cord, indicating that down-regulation of transcripts may be due to an excess of cholesterol in the CNS during late-stage disease possibly due to phagocytosis of neuronal debris. Our data reveal that SOD1G93A astrocytes are characterized more by a loss of supportive function than a toxic phenotype during ALS disease progression and future studies should focus upon restorative therapies.
Introduction
Amyotrophic lateral sclerosis (ALS) is a neurodegenerative disorder characterized by progressive loss of motor neurons and resulting muscular weakness leading to death on average within 2–3 years of symptom onset. ALS occurs in approximately 2 per 100,000 population with incidence enhanced by: increasing age; gender (1.6:1 male to female ratio); and genetic susceptibility. Five to 10% of cases of ALS are familial (fALS) and multiple causative genes have been identified (Goodall et al., 2012). The most common known genetic cause of ALS is a mutation in the C9ORF72 gene (Dejesus-Hernandez et al., 2011; Renton et al., 2011), implicated in approximately 7% of sporadic cases (sALS) and 43% of fALS (Cooper-Knock et al., 2012). Mutations in SOD1 (Cu/Zn superoxide dismutase (1) are the second most common genetic cause of ALS, and account for 10–20% of fALS (Cudkowicz et al., 1997). Transgenic mice expressing mutant human SOD1 (mSOD1) are widely used as an animal model of ALS, allowing for detailed study of motor neurons and the surrounding glia during disease progression (Gurney et al., 1994; Turner and Talbot, 2008). Using the SOD1G93A model of ALS originally developed by Gurney et al. (1994) we have developed the model on a homogeneous background featuring highly consistent disease progression (Mead et al., 2011), which allows analysis of discrete time-points in disease.
Astrocytes play important roles in development, blood flow, homeostasis, synaptic function, metabolism, and formation of the blood brain barrier (Sofroniew and Vinters, 2010). In ALS, astrocytes become activated in a process called reactive astrogliosis, in which astrocytes become hypertrophic and release increased levels of chemokines and cytokines (Blackburn et al., 2009; Philips and Robberecht, 2011). Astrocytic protein inclusions containing mSOD1 are an early feature of disease in the mSOD1 mouse model (Bruijn et al., 1997). Selective expression of mSOD1 in astrocytes alone failed to provoke an ALS phenotype (Gong et al., 2000), but silencing mSOD1 expression in astrocytes significantly slowed disease progression in the SOD1G37R mouse model (Yamanaka et al., 2008), without affecting the level of astrogliosis. Studies using chimeric mice have shown normal motor neurons develop features of ALS pathology when surrounded by mSOD1-expressing glial cells (Clement et al., 2003). In vitro mSOD1 astrocytes are selectively toxic to motor neurons (Nagai et al., 2007; Bilsland et al., 2008; Cassina et al., 2008; Díaz-Amarilla et al., 2011) and this toxicity has been replicated in astrocytes derived from human cases of sporadic and familial MND (Haidet-Phillips et al., 2011; Re et al., 2014). In concert with these increased toxic properties of astrocytes, ALS is characterized by a loss of essential supportive behavior in these cells. Glutamate re-uptake, a process in which astrocytes play a major part, is compromised in the ALS spinal cord, motor cortex, and somatosensory cortex (Rothstein et al., 1995). In vitro, the presence of mutant SOD1 within astrocytes leads to altered GluR2 AMPA receptor subunit expression in co-cultured neurons, increasing their susceptibility to excitotoxic damage (Van Damme et al., 2007). Mutant SOD1 is also suggested to render astrocytes vulnerable to excitotoxic damage through activation of mGluR5 (Rossi et al., 2008) which can be rescued by the anti-apoptotic Bcl-XL leading to improved motor performance (Martorana et al., 2011).
Gene expression profiling using microarray technology has been used to delineate specific pathways that may serve as therapeutic targets in ALS. Laser capture microdissected (LCM) motor neurons from the SOD1G93A mouse model at pre-symptomatic (~60 day), symptomatic (~90 day), and late-stage (~120 day) have been used previously to show the change in motor neuron transcriptional behavior throughout the disease course (Ferraiuolo et al., 2007). Microarray analysis of LCM astrocytes, taken from the pre-symptomatic time-point revealed dysregulated metabolic homeostasis, in particular a reduction in lactate provision from astrocytes to motor neurons (Ferraiuolo et al., 2011a). Due to the complexity of the disease process, a transcriptomic approach is needed so that interactions between the multiple disease mechanisms can be identified (Ferraiuolo et al., 2011b). This approach can then be used to study the specific changes that occur in astrocytes during ALS and how these affect their interaction with motor neurons. The aim of this study was to perform microarray analysis of laser-captured SOD1G93A astrocytes from the symptomatic and late-stage time-points to complement the previous work performed by Ferraiuolo et al. (2011a) and to reveal the full extent of astrocytic behavior during disease progression. The data show that an activated phenotype becomes apparent at the symptomatic stage which follows through to late-stage and is characterized by an up-regulation of transcripts involved in lysosomal and phagocytic pathways. We hypothesized that these pathways are up-regulated at the functional level. To test this, we performed enzymatic assays and in vitro experiments using fluorescently labeled NSC34 cell debris to confirm an intrinsic lysosomal and phagocytic up-regulation in SOD1G93A astrocytes. At the late-stage, a dysregulation in transcripts involved in many steps of cholesterol processing also occurs and immunohistochemistry has confirmed an altered distribution of cholesterol processing enzymes in late-stage lumbar spinal cord. In combination with the pre-symptomatic data of Ferraiuolo et al. (2011a), these findings provide a detailed map of astrocyte behavior throughout disease and point to a loss of supportive function as the overwhelming astrocyte phenotype that emerges during the disease course.
Materials and Methods
The SOD1G93A Mouse Model
The SOD1G93A mouse model, staining, LCM, and microarray analysis were performed as in Ferraiuolo et al. (2011a). Mice used were male SOD1G93A transgenic mice B6SJL-Tg (SOD1G93A) 1 Gur/J, which had been backcrossed onto C57Bl/6 J Ola/Hsd (Harlan) for over 20 generations (Mead et al., 2011), and their non-transgenic (NTg) littermates were used. Three mice were used for disease and control groups at the symptomatic (90 days) and late-stage (120 days) time-points. All procedures were performed according to UK Home Office regulations and in accordance with guidelines specified by The University of Sheffield Ethics Committee.
Rapid Immunohistochemistry (IHC) using ALDH1L1
Rapid IHC staining of astrocytes, to allow rapid isolation of cells and preservation of RNA quality, was performed as previously described (Ferraiuolo et al., 2011a). Tissue sections (10 μm) were stained with primary antibody (rabbit polyclonal anti-ALDH1L1, Abcam, #ab 79727) at 1:50 dilution and secondary antibody and ABC reagent were from the Vectastain Rabbit IgG kit (Vector Labs # PK-6101).
Laser Capture of Astrocytes
A minimum of 1500 astrocytes per animal were captured by LCM using the Arcturus Pixcell II microdissection instrument (Applied Biosystems, Carlsbad, CA) using Arcturus Capsure Macro LCM Caps (Applied Biosystems #LCM0211). RNA was extracted from captured cells using the Arcturus Picopure RNA Isolation kit (Applied Biosystems #12204-01) and tested for RNA quantity using the Agilent Nanodrop spectrophotometer ND-1000 (Agilent Technologies, Santa Clara, CA) and for quality using the RNA 6000 PicoChip kit (Agilent # 5067-1513).
Microarray Data Analysis and Gene Ontology Categorization
RNA was linearly amplified using the Two Rounds Amplification kit (Affymetrix) as per manufacturer's instructions. cRNA was generated using the GeneChip Expression 3′ Amplification Reagents for IVT labeling (Affymetrix). Fifteen micrograms of cRNA for each of 3 × SOD1G93A and 3 × NTg mice was fragmented (Genechip reagents, Affymetrix) and 12.5 μg hybridized onto Mouse Genome 430 2.0 Genechips (Affymetrix). Prior to analysis probe sets were removed from the analysis if all samples were called absent using the MAS5 algorithm within Bioconductor (Gentleman et al., 2004). Initial GeneChip analysis for determination of differentially expressed transcripts was then performed using Genespring GX (Agilent) with the Probe Logarithmic Intensity Error (PLIER) algorithm. For Gene Ontology categorization, genes with p ≤ 0.05 and fold-change ≥2 were analyzed using the Database for Annotation and Visualization (DAVID) in combination with NetAffx Analysis Centre (www.affymetrix.com) and Genecards V3 (www.genecards.org).
qPCR Validation
The amplified samples used in the microarray analysis were diluted to 12.5 ng/μl and used for qPCR validation. Only selected genes were validated via q-PCR due to the limited availability of RNA from late stage animals following microarray analysis. As a result some pathways were only validated by functional tests. Genes were chosen based upon their presence in key pathways of interest. Optimization of primer concentrations was performed as described previously (Ferraiuolo et al., 2007). qPCR was performed in 10 μL reaction volumes using 5 μL Brilliant III Ultra Fast SYBR® Green qPCR mastermix (Agilent). Primer sequences, concentrations and the PCR programme used are shown in Supplementary Table 1. To calculate relative expression differences between SOD1G93A astrocytes and NTg controls the 2[-Delta Delta C(T)] method was used (Livak and Schmittgen, 2001). Gapdh was chosen as the housekeeping gene due to a consistent expression level across all GeneChips and based upon previous optimization at the presymptomatic time-point (Ferraiuolo et al., 2011a).
Astrocyte Cell Culture
Primary astrocyte cultures were set up as previously described (Ferraiuolo et al., 2011a). Cortices from 0 to 2 day old SOD1G93A mice and their NTg littermates were used to make separate cultures of astrocytes. The presence of the transgene for each culture was ascertained using PCR for each pup tail clip. Cells were cultured in DMEM containing 10% FBS until 100% confluence was reached, at which time flasks were shaken overnight at 225 rpm at 37°C followed by mild trypsinisation (Saura et al., 2003) to separate astrocytes from microglia. Astrocytes were defined as ≥95% purity before use in experiments using a FACSCalibur flow cytometer (BD) and antibodies against GLAST (Miltenyi Biotech) and CD11b (Ebioscience) to check for microglial presence.
β Hexosaminidase Activity Assay
Symptomatic and late-stage mice were euthanized via intraperitoneal injection of pentobarbital and perfused with PBS. Spinal cords were dissected, cut just above the lumbar enlargement to give the “upper cord” and “lower cord,” and rapidly frozen in liquid nitrogen. Sections of tissue (~5 mg) were dissected from the thoracic section of the upper cord and the lumbar section of the lower cord on dry ice and then homogenized using a glass tissue homogeniser (Jencons, England). Protein concentration of homogenates was measured using BCA assay (Sigma #B9643) and samples diluted to 1 mg/mL using distilled water. Five microliters of diluted homogenate was added to 500 μL McIlvaine citrate–phosphate pH 4.5 buffer (MV4.5) and 100 μL aliquots taken. All tubes and substrate solution [4-Methylumbelliferyl N-acetyl-β-D-glucosaminide (Sigma) at 1.1 mg/mL in MV4.5] were warmed for 2 min at 37°C, before the substrate was added at timed intervals in 100 μL volumes to all tubes. All tubes were then incubated at 37°C for 10 min and then stopping solution (0.25 M glycine buffer pH10.4) added at timed intervals. Sample fluorescence was then read using a FLUOstar Omega platereader (BMG Labtech) with excitation settings of 365 nm and emission of 450 nm.
Astrocyte Phagocytosis Assay
Cell debris was created by placing complete medium containing 1:200 Vybrant Dil (Life Technologies) onto the murine NSC34 motor neuronal cell line for 20 min at 37°C. Cells were washed for 10 min in fresh complete medium and were then placed in serum-free DMEM for 48 h to induce cell death. Cells were collected and counted and stored at −80°C. Neonatal astrocytes from SOD1G93A and NTg mice were seeded at a density of 4 × 10³ per well of a 384 well optical plate (Greiner Bio One) and changed to serum-free medium (DMEM/F12 containing 1 × N2) 24 h prior to exposure to cell debris. NSC34 debris was placed onto astrocytes at a concentration of 125 cells/μL in serum-free medium. Following a 48 h incubation at 37°C, cultures were washed 3 times with PBS and fixed with 4% PFA for 15 min at room temperature. As a negative control, cells were treated with decreasing concentrations of Latrunculin A (10, 5, and 1 μM), a commonly used phagocytosis inhibitor that forms a complex with actin filaments and inhibits actin polymerization and elongation. One micromolar was the concentration that less affected astrocyte viability and morphology and was, therefore, used as a negative control for the phagocytosis assay. Cells were treated overnight with 1 μM Latrunculin A (Sigma), the day after cells were washed and cell debris were applied onto the cells as above. Astrocytes were stained with anti-GFAP antibody (Abcam #ab7260) and nuclei were visualized using Hoescht staining. The InCell 2000 (GE) was used for image capture of 9 fields per well (5 wells per sample) and subsequent analysis was performed using InCell Developer Toolbox v.1.9 (GE) with an analysis protocol that counted debris if ≥65% of debris-signal overlapped with GFAP-signal. Confocal images of phagocytosis were taken on a Leica SP5 confocal microscope using a x63/1.4 oil immersion objective lens. Z-stack images were taken at a resolution of 512 × 512 pixels at intervals of 0.12 μm throughout the depth of the cell of interest.
Immunohistochemistry for SREBP2
Sections of frozen spinal cord (10 μm) were taken from three symptomatic SOD1G93A mice and 3 age-matched NTg controls. Staining was performed as per the manufacturer's protocol using the Vectastain Rabbit IgG kit as used for Aldh1l1 staining. The primary antibody used was Ab282482 (AbCam) at 1:400 dilution in blocking solution. SREBP2 staining was visualized using diaminobenzidine and nuclei were visualized using haemotoxylin. Microscopy was performed using a Nikon Eclipse Ni microscope with a Nikon DS-Ri1 camera using brightfield settings of 9.5 ms exposure for 20X magnified images and 44 ms exposure for 40X magnified images.
Cholesterol Assay
Primary cortical astrocytes isolated from neonate SOD1G93A mice and their NTg littermates were plated in a 96-well plate at a density of 3 × 10⁴ cells/well. Twenty-four hours post-plating cells were either treated with U-18666A 1.25 μM, a cholesterol transport inhibitor, or medium was replaced. Forty-eight hours later cells were fixed and cholesterol staining using Filipin III was performed as per manufacturer's instructions. All wells were scanned and images collected using the InCell 2000 (GE). Image analysis was performed using ImageJ (http://imagej.nih.gov/ij/). All images were treated as stacks and adjusted for brightness, background and threshold using the same parameters. Data on signal intensity and signal area were collected using the function “Analyse Particles.” Three independent cell preparations were analyzed in triplicate for each condition.
Statistical Tests
All statistical analyses were performed in GraphPad Prism v6.05 (Graphpad Software Inc.). qPCR data, phagocytosis and cholesterol assay data was analyzed using an independent samples t-test whilst lysosomal enzyme activity was analyzed using One-way ANOVA with Tukey post-hoc test.
Results
Gene Expression Profiling of Symptomatic and Late-stage Astrocytes
The transcriptomics study performed here is the first to complete an analysis of astrocytes from multiple stages of disease in the SOD1G93A mouse model of ALS. There is an expected up-regulation of many genes involved in astrocyte activation [e.g., glial fibrillary acidic protein (Gfap; 90d: ~+3, 120d: +10.48), Cd44 (90d: +2.72; 120d: +5.56)] and inflammation signaling a reactive astrocyte phenotype. In support of this, a profound up-regulation of lysosomal genes is observed, which may reflect a general increase in astrocyte reactivity already seen in ALS and could be a response to increased phagocytic activity of SOD1G93A astrocytes. Concurrently, SOD1G93A astrocytes continue to decrease the expression of transcripts involved in the support of neurons such as those involved in maintaining homeostasis and neuronal support; steroid and cholesterol biosynthesis, neurotransmitter receptors and potassium and sodium ion channels important for sensing alterations in the synaptic space.
All GeneChips from the symptomatic and late-stage time-points were similar in terms of percentage present call (mean = 50.42% range = 36.27–57.81%) and average background signal (mean = 33.41 range = 30.47–35.74) and GeneChips within each time-point fell within the scale factor of three recommended by Affymetrix. At the symptomatic time-point 276 transcripts (corresponding to 321 probe sets due to multiple probe sets per transcript) were differentially expressed with fold change ≥2 and p < 0.05 in SOD1G93A astrocytes compared to NTg controls with 117 transcripts (139 probe sets) showing decreased expression and 159 transcripts (182 probe sets) increased expression. At late-stage 1685 transcripts (2066 probe sets) were differentially expressed with fold change ≥2 and p ≤ 0.05, with 1330 transcripts (1595 probe sets) showing decreased expression and 355 transcripts (471 probe sets) with increased expression. A list of genes with FC ≥ 2 and p < 0.05 for both symptomatic and late-stage categorized by gene function is shown in Supplementary Datasheet 1 [CEL files for each of the 12 GeneChips have been uploaded to the Gene Expression Omnibus Repository (GSE69166)]. PCR performed on glial cell markers before and after picking showed the astrocyte marker GFAP to still be present in LCM material, whilst levels of different cellular markers in array material shows astrocytes to be a major component of the picked material (Supplementary Figure 1). Therefore, the RNA analyzed here is from a mixed cell population with a significant astrocytic component.
Enrichment analysis was performed for genes that were differentially expressed at symptomatic and late-stage time-points to assess genes involved from disease onset (Table 1 and Supplementary Datasheets 1–6). This showed symptomatic and late-stage SOD1G93A astrocytes to be very similar in terms of gene expression. The most enriched categories for up-regulated transcripts by DAVID enrichment score consisted of the lysosome, positive regulation of immune response and positive regulation of phagocytosis, pointing to an increased reactivity of astrocytes beginning at symptom onset. Potassium transport was down-regulated at the symptomatic stage which developed into a more general disruption in ion homeostasis at late-stage, which also featured dysregulation of ATP biosynthesis genes. This may signify an increased inability of astrocytes from symptomatic to late-stage disease to sense their environment.
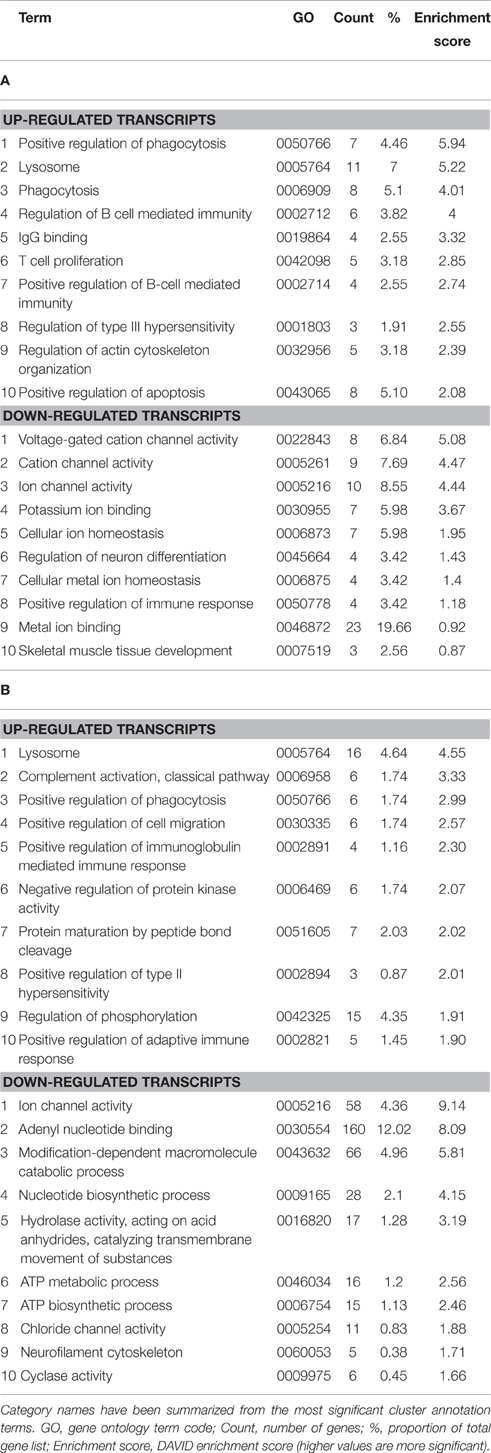
Table 1. Enrichment analysis of transcripts differentially expressed in both the (A) symptomatic and (B) late-stage time-points in SOD1G93A astrocytes vs. NTg controls (p ≤ 0.05, FC ≥ 2).
Lysosomal Up-regulation Occurs at Symptomatic Stage and Continues to Late-stage Disease
To functionally validate the findings of the gene expression data, we chose to investigate the increased reactivity of astrocytes that is apparent at the symptomatic stage and continues to late-stage disease. Due to the enrichment for lysosomal genes at both time-points, we chose to investigate this group of genes first. There is a clear up-regulation of lysosomal genes in SOD1G93A astrocytes at both symptomatic and late-stage time-points (Table 2). The genes involved include several lysosomal digestive proteases: cathepsin D (Ctsd), cathepsin H (Ctsh), cathepsin S (Ctss), cathepsin Z (CtsZ); two glycosidase subunits: hexosamindase A (Hexa) and hexosaminidase B (Hexb); and two minor lysosomal membrane proteins: solute carrier family 11 member 1 (Slc11a1) and lysosomal associated transmembrane protein 5 (Laptm5). Out of five genes chosen for validation by qPCR, all showed regulation in the same direction as the microarrays and three genes (Hexa, Ctsd, and Ctss) showed a statistically significant difference between disease and control (Figure 1A). This indicated that several aspects of lysosomal activity are increased in the SOD1G93A spinal cord as the disease progresses. To assess whether the differential expression of these genes translates to a functional difference in lysosomal enzyme activity we assayed the activity of β-hexosaminidase (β-hex) in the upper and lower spinal cord. β-hex is encoded by the Hexa and Hexb transcripts (Mahuran, 1995). B-hex activity was significantly increased compared to controls in the upper cord and lower cord at the late-stage of disease (Figure 1B). As in our previous work upon motor neurons from different disease stages of the SOD1G93A mouse, no differences were observed between NTg littermates and mice overexpressing wild-type human SOD1 and NTg littermates were used for all further experiments to reduce the number of animals used.
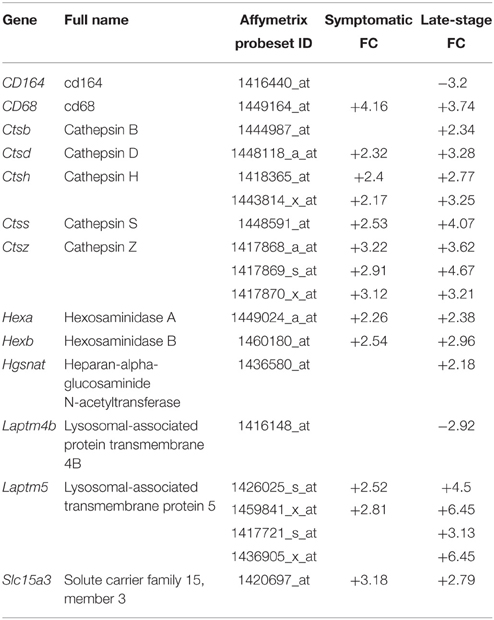
Table 2. Lysosomal genes differentially expressed with p ≤ 0.05 and fold-change ≥2 in SOD1G93A astrocytes vs. NTg controls.
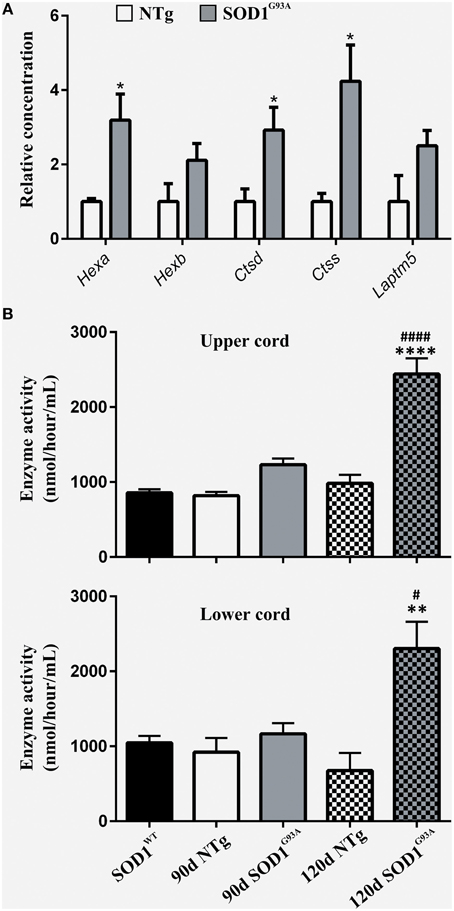
Figure 1. (A) qPCR upon symptomatic RNA of five lysosomal transcripts differentially expressed on symptomatic and late-stage microarrays; n = 3 per group. (B) Enzyme activity of Hexosaminidase B in the upper and lower spinal cord of SOD1WT, SOD1G93A, and NTg controls (SOD1WT, 90d NTg, and 90d SOD1G93A: n = 3, 120d NTg and 120d SOD1G93A: n = 4). Error bars = S.E.M. *p ≤ 0.05, **p ≤ 0.01, ****p ≤ 0.0001 vs. age-matched NTg control. #p ≤ 0.05, ####p ≤ 0.0001 vs. SOD1WT control.
Enhanced Reactivity of SOD1G93A Astrocytes is Demonstrated by Increased Phagocytic Activity
Gene categories relating to the immune response are up-regulated at both the symptomatic and late-stage time-points in SOD1G93A astrocytes (Table 3). There is an up-regulation of chemotactic genes, with seven genes in the KEGG chemokine signaling pathway differentially expressed in symptomatic SOD1G93A astrocytes (Table 3). Only two of these genes, Ccl6 and Cxcl10 are differentially expressed at late-stage. Ccl6 but not Cxcl10 was validated by qPCR (Figure 2A). The complement pathway, an innate immune mechanism for the destruction of invading pathogens, is up-regulated at both disease stages, with C1qb validated by qPCR as differentially expressed (Figure 2A). The complement pathway consists of a cascade of protein activation, centered around C1q, the three components of which (C1qa, b, and c) are up-regulated at symptomatic and further at late-stages in our microarray of astrocytes with C1q and C4b showing the most highly significant differential expression (p ≤ 0.0001) of all dysregulated genes at late stage disease. C1q binds to antigen-antibody and stimulates phagocytic activity (van Beek et al., 2003) and several other stimulants of phagocytosis are also up-regulated such as Clec7a and Ptx3. Along with these classic immune response transcripts, markers of astrocyte reactivity were also up-regulated such as activating transcription factor 3 (Atf3) and serpin peptidase inhibitor clade A member 3 (Serpina3n), which were both confirmed as differentially expressed by qPCR (Figure 2A). We next investigated whether the increased immuno-reactive phenotype of astrocytes led to differences in phagocytic ability. Cortical astrocytes from neonatal mice were used due to the difficulty of obtaining a sufficient number of proliferating astrocytes from adult spinal cord (data not shown). Astrocytes expressing SOD1G93A phagocytosed significantly higher amounts of debris compared with NTg controls [204.84% (SOD1G93A) vs. 100% (NTg), S.E.M = 25.88 (SOD1G93A) vs. 12.62 (NTg), p = 0.0112] as measured using the InCell 2000 (Figure 2B). The InCell system was used for phagocytosis analysis due to the ability to run the assay in a 384-well format and allow automated image analysis. In order to check that debris had been engulfed and were not simply stuck to the cell surface of astrocytes, confocal microscopy was then used to confirm that debris were localized in the same plane as the astrocyte marker GFAP (Figure 2C) adding to the observation of prominent GFAP staining seen around engulfed material during InCell analysis (Figure 2D). In addition, the use of a phagocytic inhibitor, Latrunculin, abolished phagocytosis of NSC34 cell debris (Supplementary Figure 2).
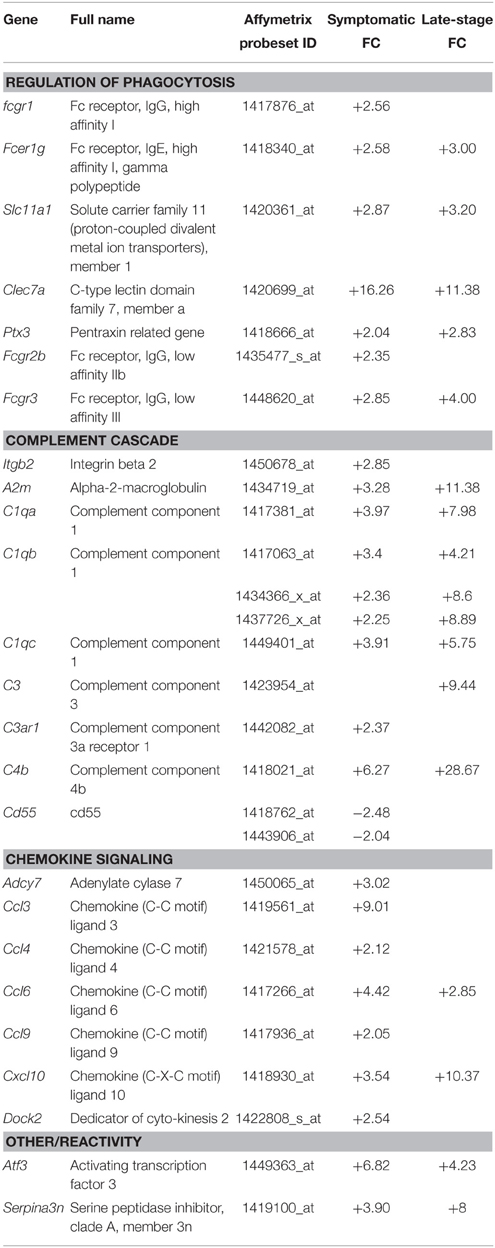
Table 3. Genes involved in the phagocytic and immune response categories that are differentially expressed in symptomatic and late-stage SOD1G93A astrocytes vs. NTg controls (p ≤ 0.05, FC ≥ 2).
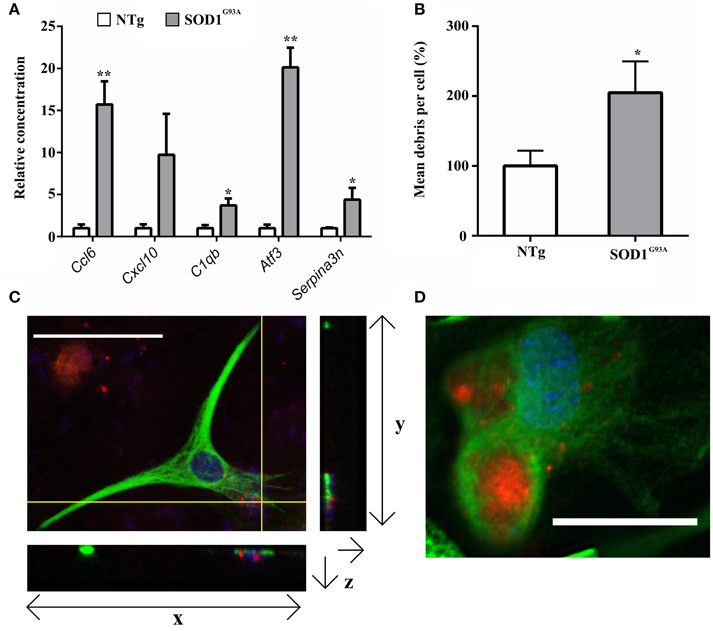
Figure 2. (A) qPCR upon symptomatic RNA of five transcripts differentially expressed in symptomatic and late-stage SOD1G93A astrocyte microarray data and putatively involved in their immuno-reactive phenotype, including the chemokines Ccl6 and Cxcl10, the complement component C1qb, the stress response transcription factor Atf3 and the serpin peptidase inhibitor Serpina3n; n = 3 per group. (B) SOD1G93A astrocytes phagocytose a significantly greater area of debris vs. NTg control. Results expressed as a percentage of control (NTg = 100% ± S.E.M. 12.62, SOD1G93A = 204.84% ± S.E.M = 25.88). n = 3. (C) Confocal microscopy reveals NSC34 debris (red) to be in the same plane as GFAP staining (green). Crosshairs indicate location of zy and zx view. Note colocalisation of debris and GFAP in zx field. Both nuclei of astrocytes and nuclear debris of NSC34 cells are observed stained blue. (D) InCell image of GFAP+ astrocytes (green) phagocytosing NSC34 cell debris (red), nuclei are stained in blue. *p ≤ 0.05, **p ≤ 0.01. Error bars = S.E.M. Scale bars = 25 μm.
Cholesterol Processing Transcripts are Dysregulated in Late-stage SOD1G93A Astrocytes
Whilst analysing the symptomatic and late-stage datasets, we noticed that there were a large number of differentially expressed transcripts involved in cholesterol synthesis in late-stage SOD1G93A astrocytes that had not been identified by DAVID analysis (Table 4). When the late-stage gene list is analyzed in isolation this category contains 38 transcripts passing a fold-change ≥2, the majority of which (35 transcripts) are down-regulated, with several genes representing key components of the cholesterol synthesis pathway (Figure 3A). Measurement of intracellular cholesterol levels in neonatal SOD1G93A astrocytes after inhibiting cholesterol export showed that transgenic astrocytes produce less than half the cholesterol of NTg control astrocytes (Figure 3B). To investigate whether cholesterol synthesis was affected in SOD1G93A spinal cord, we performed staining for sterol regulatory binding protein 2 (SREBP2), a master regulator of cholesterol synthesis genes. SREBP2 is a transcription factor which is processed and re-located to the nucleus during low cholesterol conditions to up-regulate cholesterol synthesis genes (Figure 3C). SREBP2 is also involved in the transcription of the low density lipoprotein receptor (LDLR) which is down-regulated at the transcript level (-3.39) in late-stage SOD1G93A astrocytes. Srebp2 is not down-regulated at the transcript level in either symptomatic or late-stage astrocytes. However, in late-stage SOD1G93A spinal cord we saw an increased staining for SREBP2 in cells with motor neuron morphology and within processes that may belong to astrocytes (arrowhead in Figure 3D). In contrast NTg spinal cord contains no such astrocytic processes and negatively stained areas with motor neuron morphology. Taken together, the increased staining of SREBP2 in the cytoplasm of SOD1G93A motor neurons may be an attempt by neurons to increase cholesterol synthesis because of reduced astrocytic cholesterol provision.
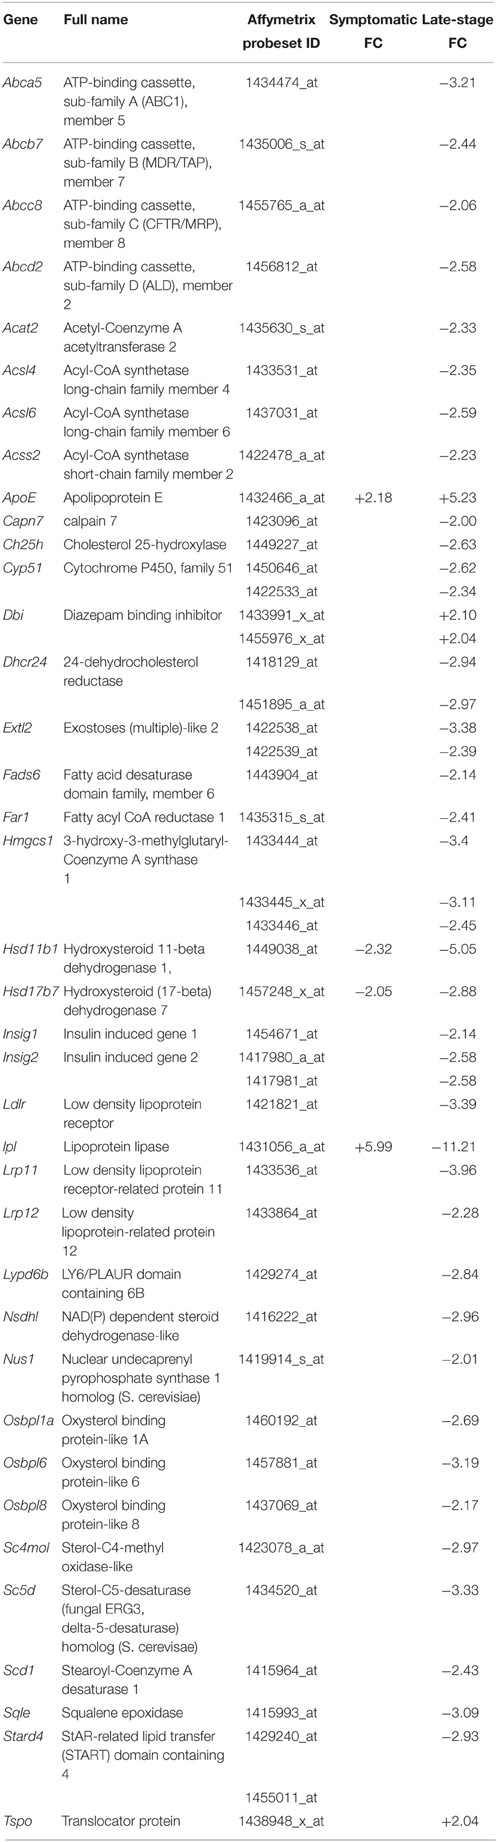
Table 4. Transcripts involved in cholesterol homeostasis that are differentially expressed in symptomatic and late-stage SOD1G93A astrocytes vs. NTg controls (p ≤ 0.05, FC ≥ 2).
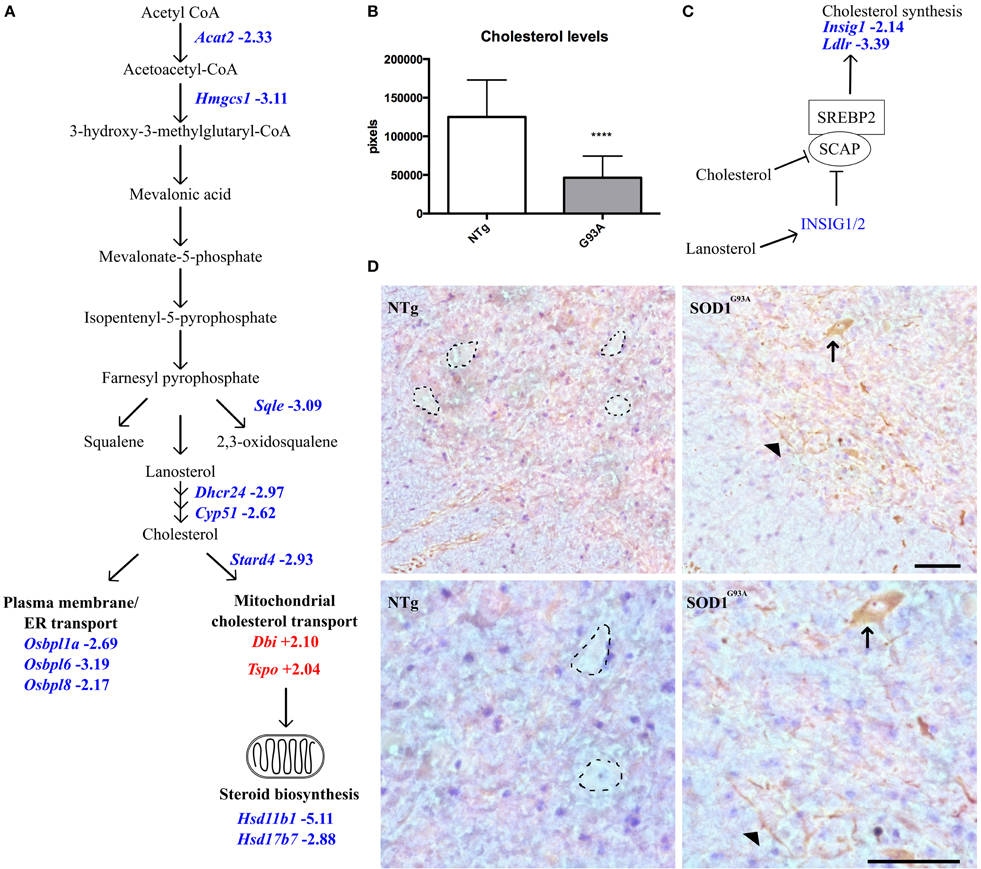
Figure 3. (A) Transcripts involved in intracellular cholesterol synthesis and transport are dysregulated in late-stage SOD1G93A astrocytes vs. NTg controls. Blue indicates decreased expression, red indicates increased expression, number indicates fold-change vs. NTg control. (B) Intracellular cholesterol levels in neonatal SOD1G93A astrocytes are significantly lower than those in NTg controls. (C) Simplified schematic of SREBP2 regulation. Excess cholesterol or lanosterol inhibits SCAP-mediated transport of SREBP2 to the golgi apparatus. Consequently, SREBP2 is not activated and does not translocate to the nucleus to upregulate cholesterol synthesis and genes such as Insig1 and Ldlr which are decreased in late-stage SOD1G93A astrocytes. (D) SREBP2 staining in the ventral horn of NTg (left) and SOD1G93A (right) lumbar spinal cord of late-stage mice, top panels indicate 20X magnification and bottom panels 40X magnification. In NTg spinal cord, negatively stained areas show the morphology of motor neurons (dotted lines) whereas in SOD1G93A spinal cord cells with motor neuron morphology stain positively for SREBP2 in the cytoplasm (arrow). In addition SREBP2 appears to be located in long processes which may belong to astrocytes or neurons (arrowhead). Scale bars = 100 μm. ****p ≤ 0.0001.
Overlapping Gene Expression of Pre-symptomatic, Symptomatic, and Late-stage SOD1G93A Astrocytes
Pre-symptomatic SOD1G93A astrocytes have already undergone gene expression profiling by Ferraiuolo et al. (2011a) which enables a comparison of the gene lists generated at three time-points of the disease. The number of transcripts with differential expression passing p ≤ 0.05 and FC ≥ 2 in common between all three time-points was investigated using a Venn diagram (Figure 4). There is high variability in the number of transcripts differentially expressed at FC ≥ 2 between the three time-points, with the symptomatic stage showing a lower number of transcripts (276) compared to the pre-symptomatic (878) and late-stage (1685) GeneChips. The highest proportion of genes shared is between the symptomatic and late-stage time-points where 17% of up-regulated and 4.5% of down-regulated transcripts are in common (for full lists of shared genes see Supplementary Datasheet 6). The separation also shows that there is a large amount of transcriptional down-regulation at late-stage disease compared to the other time-points which are more evenly split, as previously seen in our microarray studies of the corresponding time-points of SOD1G93A motor neurons (Ferraiuolo et al., 2007). The overlap between the pre-symptomatic + late-stage and symptomatic + late-stage time-points is more evenly matched for down-regulated transcripts, whereas the overlap between the pre-symptomatic and symptomatic time-points is again very small. This reinforces the findings of our enrichment analyses (Table 1) which featured many common categories between the symptomatic and late-stage time-points.
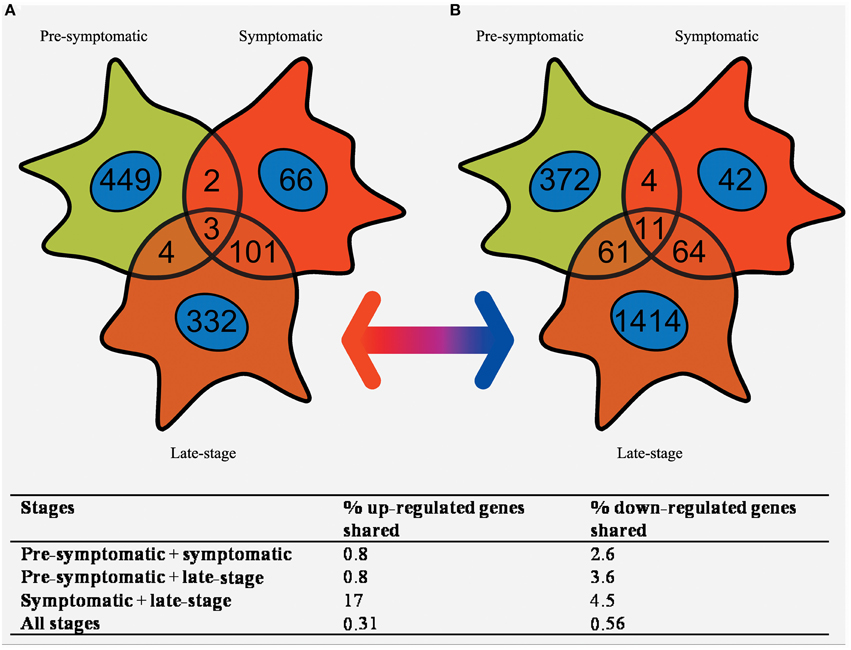
Figure 4. Venn diagram of the (A) up-regulated and (B) down-regulated genes that are differentially expressed in SOD1G93A astrocytes at pre-symptomatic, symptomatic, and late-stage disease. The greatest overlap occurs between up-regulated transcripts in symptomatic and late-stage SOD1G93A astrocytes. In comparison very few genes are shared between pre-symptomatic astrocytes and the other two disease stages, or between all three disease stages together.
Discussion
Gene expression profiling of astrocytes from the SOD1G93A transgenic mouse at symptomatic and late-stage disease time-points and subsequent combination with the previous analysis by Ferraiuolo et al. (2011a) at the pre-symptomatic stage has allowed a picture of astrocyte behavior throughout the ALS disease course in the murine model to be seen for the first time (Figure 5). The pre-symptomatic time-point is highly associated with an alteration of supportive function in SOD1G93A astrocytes, such as the provision of lactate to motor neurons and altered secretion of pro-nerve growth factor (ProNGF). In the current study, we have identified an altered immune response beginning at symptomatic and continuing through to the late-stage of disease, shown by the large overlap of increased transcripts between these two stages (Figure 4). Whilst there is evidence of neuronal and microglial contamination in the LCM samples (Supplementary Figure 1), it is well established that astrocytes are highly activated during the late-stages of disease. In addition, our experiments, particularly those looking at the phagocytosis of neuronal debris and cholesterol synthesis, sought to confirm these as astrocytic phenomena by using pure cultures of astrocytes. The lysosomal up-regulation seen at the symptomatic time-point, with further up-regulation at late-stage, would be in keeping with either: attempts to deal with intracellular inclusions, and/or increased phagocytosis of motor neuronal debris. At the late-stage time-point, defects in ion homeostasis and cholesterol and steroid metabolism are also seen. The greatly increased expression of genes involved in immune function, complement, cell signaling, and secretion pathways seen at the symptomatic time-point are less apparent at late-stage, which probably reflects the widespread dysregulation of transcripts in astrocytes at this time-point leading to a lower enrichment. It is apparent from these data that a transition occurs between the pre-symptomatic and symptomatic time-points leading to a reactive astrocyte phenotype characterized by increased chemokine secretion, lysosomal up-regulation and up-regulation of stress response factors which carries through to late-stage. This is reinforced by a recent gene expression study of SOD1G93A spinal cord which reported an increase in antigen presentation transcripts from an early pre-symptomatic stage (40d) to a late-pre-symptomatic stage (80d) (de Oliveira et al., 2013). For maximum applicability of functional data to both disease stages, we chose to functionally investigate this reactive response rather than the down-regulation of categories such as ion homeostasis due to the aforementioned large overlap for up-regulated transcripts (Figure 4).
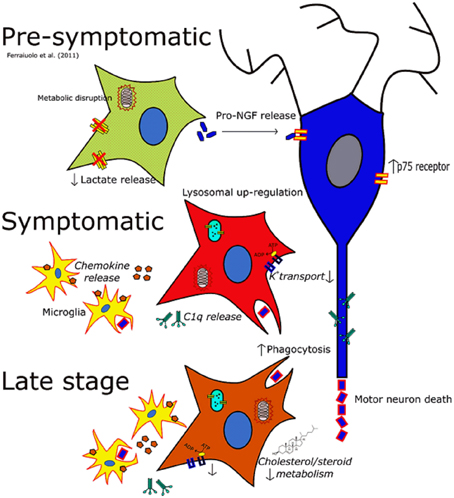
Figure 5. The changing phenotype of astrocytes during the disease course in the SOD1G93A mouse. Italics indicate data inferred from microarrays whilst non-italics indicate data for which functional outcomes have been observed. At the pre-symptomatic stage astrocyte gene expression is characterized by disruptions in lactate provision to neurons and mitochondrial dysfunction, as well as perturbations in secreted trophic factors such as the pro-NGF:NGF ratio. At the symptomatic time-point astrocytes take on a much more reactive phenotype characterized by increased lysosomal, phagocytic and chemokine gene expression whilst also featuring a down-regulation of genes involved in potassium transport. At late-stage disease astrocytes feature differential expression of a large number of genes, and still show the disruption seen at the symptomatic stage. In addition cholesterol synthesis transcripts are differentially expressed at this time-point which may indicate an excess of cholesterol in the CNS, or a disruption in the activation of cholesterol synthesis.
The increase in expression of cathepsin transcripts is in keeping with several previous studies which reported increased expression in glia (Fukada et al., 2007) and decreased expression in motor neurons in SOD1-ALS (Wootz et al., 2006; Cox et al., 2010; Kirby et al., 2011), suggesting up-regulation of the lysosomal pathway is astrocyte-specific. Up-regulation of lysosomal proteins could be as a result of increased amounts of autophagy of SOD1G93A protein, aggregates of which are degraded by autophagy in vitro (Kabuta et al., 2006). Interestingly, SOD1 and CtsD are co-localized in motor neurons of sALS patients (Forsberg et al., 2010). However, our results do not show an up-regulation of the classic autophagy related genes such as Beclin 1, Lc3-II, Vps34, or the Atg group of genes (Virgin and Levine, 2009). This suggests that if autophagy is increased, it is due to altered autophagic flux rather than induction of autophagic genes.
Rather than a lysosomal up-regulation due to increased autophagy, the microarray data suggests that lysosomal up-regulation could be as a consequence of increased astrocyte phagocytosis (Table 1). Indeed, in addition to the cathepsin group of proteases, this study is the first to highlight an increased β-hexosaminidase activity in SOD1G93A spinal cord at the late-stage of disease (Figure 1B). The fact that both transcripts that make up the two β-hexosaminidase isoforms are differentially expressed in the microarray data makes it highly likely that part of this increased activity comes from astrocytes. β-hexosaminidase is involved in the processing of gangliosides, which are abundant upon cell membranes, and its increased activity from the symptomatic stage onwards may be in response to increased processing of neuronal debris. Astrocytes are capable phagocytes (Chang et al., 2000) and their phagocytosis of cell debris is seen to protect neurons from contact-induced cell death in vitro (Lööv et al., 2012). Here we compared the phagocytic ability of SOD1G93A astrocytes vs. NTg controls and have shown for the first time that SOD1G93A astrocytes have an increased propensity to phagocytose cellular debris (Figure 2). Again, the results of the functional study were consistent with the up-regulation of several membrane receptors for phagocytosis (Table 2). Given the data of Lööv et al. (2012), we hypothesize that this would actually function as a protective mechanism during the disease course and dampen inflammation. In support of this, macrophage phagocytosis of either apoptotic or necrotic debris does not affect expression of pro-inflammatory cytokines (Brouckaert et al., 2004).
At the late-stage of disease in particular, many transcripts involved in cholesterol and steroid homeostasis are dysregulated in SOD1G93A astrocytes. Astrocytes are important in the adult CNS as they provide cholesterol and cholesterol precursors to neurons via transport proteins such as APOE (Pfrieger and Ungerer, 2011). Another mouse model which closely resembles ALS, featuring a deletion of the hypoxia response element of the vascular endothelial growth factor gene (VEGFδ∕δ), shows down-regulation of many of the transcripts seen in the present study including: Ldlr, Stard4, Hsd17b7, and Sqle (Brockington et al., 2010). In contrast to the results of ourselves and Brockington et al. (2010) showing decreased cholesterol synthesis, Ceramide 24 and sphingomyelin (classes of membrane lipid) and cholesterol-16 and -18 are increased in the spinal cord of ALS patients and in the lumbar spinal cord of the pre-symptomatic SOD1G93A mouse (Cutler et al., 2002). The decreased intracellular cholesterol measured in the current study may be the reason for increased translocator protein (Tspo) (120d: +2.04), which along with diazepam binding inhibitor (Dbi) (120d: +2.4) induces translocation across the mitochondrial membrane (Rone et al., 2009). This may be an attempt by the cell to increase cholesterol transport into mitochondria for steroid biosynthesis. However, downstream steroid biosynthesis within mitochondria is predicted to be decreased due to the decreased expression of Hsd11b1 and Hsd17b7. This decreased expression is superimposed upon the dysregulation of mitochondrial transcripts already apparent in the pre-symptomatic SOD1G93A astrocytes (Ferraiuolo et al., 2011a). Future therapeutic strategies could focus upon mitochondrial protection to rescue this deficit and thereby increase production of neuroprotective steroids.
We show here that SOD1G93A astrocytes inherently produce a lower amount of cholesterol than NTg controls. This is the first time to our knowledge that this has been demonstrated. The increased APOE activity seen in the microarray data might therefore be an attempt to increase cholesterol transport in response to lower astrocytic cholesterol synthesis. Future study should focus upon confirming the increased expression of APOE at the protein level. The increased staining of SREBP2 in motor neuronal cell bodies and process-like structures of late-stage SOD1G93A lumbar spinal cord may result from a neuronal reaction to lower cholesterol transport to neurons from astrocytes, and an up-regulation of SREBP2 by neurons in an attempt to synthesize cholesterol themselves. To investigate this further, in vitro studies should be performed to investigate whether increased extracellular cholesterol leads to cytoplasmic SREBP2 localization in astrocytes or motor neurons and whether the SOD1G93A mutation affects this.
This study has revealed three previously unexplored phenomena in SOD1G93A astrocytes occurring at the symptomatic stage and continuing to late-stage disease. Intriguingly, these mechanisms may be interconnected and future studies can now focus on characterizing these behaviors further. Much focus is placed upon whether astrocytes become toxic or lose supportive function during ALS progression. The data presented in this report suggest that astrocytes react so as to attempt damage limitation via clearance and processing of cellular debris for re-distribution of components such as cholesterol. In addition, the transcriptomic data of symptomatic and late-stage SOD1G93A astrocytes show decreased expression of many transcripts involved in ion homeostasis and transport, suggesting that astrocytes are concurrently losing their ability to regulate the external environment. Given this, we conclude that the majority of behavior change in SOD1G93A astrocytes during disease progression is a loss of supportive function rather than a toxic gain of function and that this is equally damaging to neuronal survival. It is important now to determine whether these astrocytic behaviors can be modulated and whether this is a means by which to influence disease progression.
Author Contributions
LF, DB2, JK, PH, and PS were involved in the conception and design of the initial work. PV, DS, and LF were involved in the acquisition of material for microarray samples. DB1 and LF conceived, performed and analyzed further experiments based upon the microarray data. MK and DB1 performed the assay of β-hexosaminidase activity. All authors were involved in the drafting of the manuscript and final approval of the version to be published.
1 David Baker
2 Daniel Blackburn
Funding
We acknowledge grants from the European Community's Seventh Framework Programme (FP7/2007-2013) under the EuroMOTOR project, grant agreement no 259867 and the EU Joint Programme-Neurodegenerative Disease Research (JPND) projects, SOPHIA and STRENGTH, supported through the following funding agencies under the aegis of JPND—http://www.jpnd.eu/: United Kingdom, Medical Research Council to PJS and JK. PJS is an NIHR Senior Investigator. LF is funded by a EU Marie Curie Fellowship. PV was funded by a Wellcome Trust summer studentship. MK was funded by a BBSRC/Lilly (PhD CASE studentship).
Conflict of Interest Statement
The authors declare that the research was conducted in the absence of any commercial or financial relationships that could be construed as a potential conflict of interest.
Acknowledgments
The authors wish to thank Professor Oliver Bandmann for his contribution of materials used in the assay of β-hexosaminidase activity and special thanks go to Mr Ian Coldicott, Dr Richard Mead and Dr Ellen Bennett for help with mouse dissection and tissue collection.
Supplementary Material
The Supplementary Material for this article can be found online at: https://www.frontiersin.org/article/10.3389/fncel.2015.00410
References
Bilsland, L. G., Nirmalananthan, N., Yip, J., Greensmith, L., and Duchen, M. R. (2008). Expression of mutant SOD1 in astrocytes induces functional deficits in motoneuron mitochondria. J. Neurochem. 107, 1271–1283. doi: 10.1111/j.1471-4159.2008.05699.x
Blackburn, D., Sargsyan, S., Monk, P. N., and Shaw, P. J. (2009). Astrocyte function and role in motor neuron disease: a future therapeutic target? Glia 57, 1251–1264. doi: 10.1002/glia.20848
Brockington, A., Heath, P. R., Holden, H., Kasher, P., Bender, F. L., Claes, F., et al. (2010). Downregulation of genes with a function in axon outgrowth and synapse formation in motor neurones of the VEGFdelta/delta mouse model of amyotrophic lateral sclerosis. BMC Genomics 11:203. doi: 10.1186/1471-2164-11-203
Brouckaert, G., Kalai, M., Krysko, D. V., Saelens, X., Vercammen, D., Ndlovu, M. N., et al. (2004). Phagocytosis of necrotic cells by macrophages is phosphatidylserine dependent and does not induce inflammatory cytokine production. Mol. Biol. Cell 15, 1089–1100. doi: 10.1091/mbc.E03-09-0668
Bruijn, L. I., Becher, M. W., Lee, M. K., Anderson, K. L., Jenkins, N. A., Copeland, N. G., et al. (1997). ALS-linked SOD1 mutant G85R mediates damage to astrocytes and promotes rapidly progressive disease with SOD1-containing inclusions. Neuron 18, 327–338. doi: 10.1016/S0896-6273(00)80272-X
Cassina, P., Cassina, A., Pehar, M., Castellanos, R., Gandelman, M., de Leon, A., et al. (2008). Mitochondrial dysfunction in SOD1G93A-bearing astrocytes promotes motor neuron degeneration: prevention by mitochondrial-targeted antioxidants. J. Neurosci. 28, 4115–4122. doi: 10.1523/JNEUROSCI.5308-07.2008
Chang, G. H., Barbaro, N. M., and Pieper, R. O. (2000). Phosphatidylserine-dependent phagocytosis of apoptotic glioma cells by normal human microglia, astrocytes, and glioma cells. Neuro Oncol. 2, 174–183. doi: 10.1215/15228517-2-3-174
Clement, A. M., Nguyen, M. D., Roberts, E. A., Garcia, M. L., Boillee, S., Rule, M., et al. (2003). Wild-type nonneuronal cells extend survival of SOD1 mutant motor neurons in ALS mice. Science 302, 113–117. doi: 10.1126/science.1086071
Cooper-Knock, J., Hewitt, C., Highley, J. R., Brockington, A., Milano, A., Man, S., et al. (2012). Clinico-pathological features in amyotrophic lateral sclerosis with expansions in C9ORF72. Brain 135, 751–764. doi: 10.1093/brain/awr365
Cox, L. E., Ferraiuolo, L., Goodall, E. F., Heath, P. R., Higginbottom, A., Mortiboys, H., et al. (2010). Mutations in CHMP2B in lower motor neuron predominant amyotrophic lateral sclerosis (ALS). PLoS ONE 5:e9872. doi: 10.1371/journal.pone.0009872
Cudkowicz, M. E., Mckenna-Yasek, D., Sapp, P. E., Chin, W., Geller, B., Hayden, D. L., et al. (1997). Epidemiology of mutations in superoxide dismutase in amyotrophic lateral sclerosis. Ann. Neurol. 41, 210–221. doi: 10.1002/ana.410410212
Cutler, R. G., Pedersen, W. A., Camandola, S., Rothstein, J. D., and Mattson, M. P. (2002). Evidence that accumulation of ceramides and cholesterol esters mediates oxidative stress-induced death of motor neurons in amyotrophic lateral sclerosis. Ann. Neurol. 52, 448–457. doi: 10.1002/ana.10312
Dejesus-Hernandez, M., Mackenzie, I. R., Boeve, B. F., Boxer, A. L., Baker, M., Rutherford, N. J., et al. (2011). Expanded GGGGCC hexanucleotide repeat in noncoding region of C9ORF72 causes chromosome 9p-linked FTD and ALS. Neuron 72, 245–256. doi: 10.1016/j.neuron.2011.09.011
de Oliveira, G. P., Alves, C. J., and Chadi, G. (2013). Early gene expression changes in spinal cord from SOD1(G93A) Amyotrophic Lateral Sclerosis animal model. Front. Cell. Neurosci. 7:216. doi: 10.3389/fncel.2013.00216
Díaz-Amarilla, P., Olivera-Bravo, S., Trias, E., Cragnolini, A., Martinez-Palma, L., Cassina, P., et al. (2011). Phenotypically aberrant astrocytes that promote motoneuron damage in a model of inherited amyotrophic lateral sclerosis. Proc. Natl. Acad. Sci. U.S.A. 108, 18126–18131. doi: 10.1073/pnas.1110689108
Ferraiuolo, L., Heath, P. R., Holden, H., Kasher, P., Kirby, J., and Shaw, P. J. (2007). Microarray analysis of the cellular pathways involved in the adaptation to and progression of motor neuron injury in the SOD1 G93A mouse model of familial ALS. J. Neurosci. 27, 9201–9219. doi: 10.1523/JNEUROSCI.1470-07.2007
Ferraiuolo, L., Higginbottom, A., Heath, P. R., Barber, S., Greenald, D., Kirby, J., et al. (2011a). Dysregulation of astrocyte-motoneuron cross-talk in mutant superoxide dismutase 1-related amyotrophic lateral sclerosis. Brain 134, 2627–2641. doi: 10.1093/brain/awr193
Ferraiuolo, L., Kirby, J., Grierson, A. J., Sendtner, M., and Shaw, P. J. (2011b). Molecular pathways of motor neuron injury in amyotrophic lateral sclerosis. Nat. Rev. Neurol. 7, 616–630. doi: 10.1038/nrneurol.2011.152
Forsberg, K., Jonsson, P. A., Andersen, P. M., Bergemalm, D., Graffmo, K. S., Hultdin, M., et al. (2010). Novel antibodies reveal inclusions containing non-native SOD1 in sporadic ALS patients. PLoS ONE 5:e11552. doi: 10.1371/journal.pone.0011552
Fukada, Y., Yasui, K., Kitayama, M., Doi, K., Nakano, T., Watanabe, Y., et al. (2007). Gene expression analysis of the murine model of amyotrophic lateral sclerosis: studies of the Leu126delTT mutation in SOD1. Brain Res. 1160, 1–10. doi: 10.1016/j.brainres.2007.05.044
Gentleman, R. C., Carey, V. J., Bates, D. M., Bolstad, B., Dettling, M., Dudoit, S., et al. (2004). Bioconductor: open software development for computational biology and bioinformatics. Genome Biol. 5:R80. doi: 10.1186/gb-2004-5-10-r80
Gong, Y. H., Parsadanian, A. S., Andreeva, A., Snider, W. D., and Elliott, J. L. (2000). Restricted expression of G86R Cu/Zn superoxide dismutase in astrocytes results in astrocytosis but does not cause motoneuron degeneration. J. Neurosci. 20, 660–665.
Goodall, E. F., Bury, J. J., Cooper-Knock, J., Shaw, P. J., and Kirby, J. (2012). “Genetics of familial amyotrophic lateral sclerosis,” in Amyotrophic Lateral Sclerosis, ed M. H. Maurer (Rijeka: InTech), 517–553.
Gurney, M. E., Pu, H., Chiu, A. Y., Dal Canto, M. C., Polchow, C. Y., Alexander, D. D., et al. (1994). Motor neuron degeneration in mice that express a human Cu, Zn superoxide dismutase mutation. Science 264, 1772–1775. doi: 10.1126/science.8209258
Haidet-Phillips, A. M., Hester, M. E., Miranda, C. J., Meyer, K., Braun, L., Frakes, A., et al. (2011). Astrocytes from familial and sporadic ALS patients are toxic to motor neurons. Nat. Biotechnol. 29, 824–828. doi: 10.1038/nbt.1957
Kabuta, T., Suzuki, Y., and Wada, K. (2006). Degradation of amyotrophic lateral sclerosis-linked mutant Cu, Zn-superoxide dismutase proteins by macroautophagy and the proteasome. J. Biol. Chem. 281, 30524–30533. doi: 10.1074/jbc.M603337200
Kirby, J., Ning, K., Ferraiuolo, L., Heath, P. R., Ismail, A., Kuo, S. W., et al. (2011). Phosphatase and tensin homologue/protein kinase B pathway linked to motor neuron survival in human superoxide dismutase 1-related amyotrophic lateral sclerosis. Brain 134, 506–517. doi: 10.1093/brain/awq345
Livak, K. J., and Schmittgen, T. D. (2001). Analysis of relative gene expression data using real-time quantitative PCR and the 2(-Delta Delta C(T)) Method. Methods 25, 402–408. doi: 10.1006/meth.2001.1262
Lööv, C., Hillered, L., Ebendal, T., and Erlandsson, A. (2012). Engulfing astrocytes protect neurons from contact-induced apoptosis following injury. PLoS ONE 7:e33090. doi: 10.1371/journal.pone.0033090
Mahuran, D. J. (1995). Beta-hexosaminidase: biosynthesis and processing of the normal enzyme, and identification of mutations causing Jewish Tay-Sachs disease. Clin. Biochem. 28, 101–106. doi: 10.1016/0009-9120(95)00003-R
Martorana, F., Brambilla, L., Valori, C. F., Bergamaschi, C., Roncoroni, C., Aronica, E., et al. (2011). The BH4 domain of Bcl-X(L) rescues astrocyte degeneration in amyotrophic lateral sclerosis by modulating intracellular calcium signals. Hum. Mol. Genet. 21, 826–840. doi: 10.1093/hmg/ddr513
Mead, R. J., Bennett, E. J., Kennerley, A. J., Sharp, P., Sunyach, C., Kasher, P., et al. (2011). Optimised and rapid pre-clinical screening in the SOD1(G93A) transgenic mouse model of amyotrophic lateral sclerosis (ALS). PLoS ONE 6:e23244. doi: 10.1371/journal.pone.0023244
Nagai, M., Re, D. B., Nagata, T., Chalazonitis, A., Jessell, T. M., Wichterle, H., et al. (2007). Astrocytes expressing ALS-linked mutated SOD1 release factors selectively toxic to motor neurons. Nat. Neurosci. 10, 615–622. doi: 10.1038/nn1876
Pfrieger, F. W., and Ungerer, N. (2011). Cholesterol metabolism in neurons and astrocytes. Prog. Lipid Res. 50, 357–371. doi: 10.1016/j.plipres.2011.06.002
Philips, T., and Robberecht, W. (2011). Neuroinflammation in amyotrophic lateral sclerosis: role of glial activation in motor neuron disease. Lancet Neurol. 10, 253–263. doi: 10.1016/S1474-4422(11)70015-1
Re, D. B., Le Verche, V., Yu, C., Amoroso, M. W., Politi, K. A., Phani, S., et al. (2014). Necroptosis drives motor neuron death in models of both sporadic and familial ALS. Neuron 81, 1001–1008. doi: 10.1016/j.neuron.2014.01.011
Renton, A. E., Majounie, E., Waite, A., Simón-Sánchez, J., Rollinson, S., Gibbs, J. R., et al. (2011). A hexanucleotide repeat expansion in C9ORF72 is the cause of chromosome 9p21-linked ALS-FTD. Neuron 72, 257–268. doi: 10.1016/j.neuron.2011.09.010
Rone, M. B., Fan, J., and Papadopoulos, V. (2009). Cholesterol transport in steroid biosynthesis: role of protein-protein interactions and implications in disease states. Biochim. Biophys. Acta 1791, 646–658. doi: 10.1016/j.bbalip.2009.03.001
Rossi, D., Brambilla, L., Valori, C. F., Roncoroni, C., Crugnola, A., Yokota, T., et al. (2008). Focal degeneration of astrocytes in amyotrophic lateral sclerosis. Cell Death Differ. 15, 1691–1700. doi: 10.1038/cdd.2008.99
Rothstein, J. D., Van Kammen, M., Levey, A. I., Martin, L. J., and Kuncl, R. W. (1995). Selective loss of glial glutamate transporter GLT-1 in amyotrophic lateral sclerosis. Ann. Neurol. 38, 73–84. doi: 10.1002/ana.410380114
Saura, J., Tusell, J. M., and Serratosa, J. (2003). High-yield isolation of murine microglia by mild trypsinization. Glia 44, 183–189. doi: 10.1002/glia.10274
Sofroniew, M. V., and Vinters, H. V. (2010). Astrocytes: biology and pathology. Acta Neuropathol. 119, 7–35. doi: 10.1007/s00401-009-0619-8
Turner, B. J., and Talbot, K. (2008). Transgenics, toxicity and therapeutics in rodent models of mutant SOD1-mediated familial ALS. Prog. Neurobiol. 85, 94–134. doi: 10.1016/j.pneurobio.2008.01.001
van Beek, J., Elward, K., and Gasque, P. (2003). Activation of complement in the central nervous system: roles in neurodegeneration and neuroprotection. Ann. N.Y. Acad. Sci. 992, 56–71. doi: 10.1111/j.1749-6632.2003.tb03138.x
Van Damme, P., Bogaert, E., Dewil, M., Hersmus, N., Kiraly, D., Scheveneels, W., et al. (2007). Astrocytes regulate GluR2 expression in motor neurons and their vulnerability to excitotoxicity. Proc. Natl. Acad. Sci. U.S.A. 104, 14825–14830. doi: 10.1073/pnas.0705046104
Virgin, H. W., and Levine, B. (2009). Autophagy genes in immunity. Nat. Immunol. 10, 461–470. doi: 10.1038/ni.1726
Wootz, H., Weber, E., Korhonen, L., and Lindholm, D. (2006). Altered distribution and levels of cathepsinD and cystatins in amyotrophic lateral sclerosis transgenic mice: possible roles in motor neuron survival. Neuroscience 143, 419–430. doi: 10.1016/j.neuroscience.2006.07.048
Keywords: microarray, superoxide dismutase 1, cholesterol/steroid, neurodegeneration, motor neuron
Citation: Baker DJ, Blackburn DJ, Keatinge M, Sokhi D, Viskaitis P, Heath PR, Ferraiuolo L, Kirby J and Shaw PJ (2015) Lysosomal and phagocytic activity is increased in astrocytes during disease progression in the SOD1 G93A mouse model of amyotrophic lateral sclerosis. Front. Cell. Neurosci. 9:410. doi: 10.3389/fncel.2015.00410
Received: 08 July 2015; Accepted: 25 September 2015;
Published: 15 October 2015.
Edited by:
Flavia Trettel, University of Roma Sapienza, ItalyReviewed by:
Eliana Scemes, Albert Einstein College of Medicine, USACarole Escartin, MIRCen, France
Daniela Rossi, IRCCS Salvatore Maugeri Foundation, Italy
Copyright © 2015 Baker, Blackburn, Keatinge, Sokhi, Viskaitis, Heath, Ferraiuolo, Kirby and Shaw. This is an open-access article distributed under the terms of the Creative Commons Attribution License (CC BY). The use, distribution or reproduction in other forums is permitted, provided the original author(s) or licensor are credited and that the original publication in this journal is cited, in accordance with accepted academic practice. No use, distribution or reproduction is permitted which does not comply with these terms.
*Correspondence: Janine Kirby, j.kirby@sheffield.ac.uk
†These authors have contributed equally to this work.