Proteomic and Metabolomic Analyses of Vanishing White Matter Mouse Astrocytes Reveal Deregulation of ER Functions
 Lisanne E. Wisse1‡
  Renske Penning2‡
  Esther A. Zaal2
  Carola G. M. van Berkel1 Timo J. ter Braak1 Emiel Polder1 Justin W. Kenney3† Christopher G. Proud3†
  Celia R. Berkers2
  Maarten A. F. Altelaar2
  Dave Speijer4 Marjo S. van der Knaap1
  Truus E. M. Abbink1*
- 1Pediatrics, VU University Medical Center, Amsterdam, Netherlands
- 2Biomolecular Mass Spectrometry and Proteomics Group, Utrecht Institute for Pharmaceutical Sciences, Bijvoet Center for Biomolecular Research, Utrecht University, Utrecht, Netherlands
- 3Centre for Biological Sciences, University of Southampton, Southampton, United Kingdom
- 4Medical Biochemistry, Academic Medical Center, Amsterdam, Netherlands
Vanishing white matter (VWM) is a leukodystrophy with predominantly early-childhood onset. Affected children display various neurological signs, including ataxia and spasticity, and die early. VWM patients have bi-allelic mutations in any of the five genes encoding the subunits of the eukaryotic translation factor 2B (eIF2B). eIF2B regulates protein synthesis rates under basal and cellular stress conditions. The underlying molecular mechanism of how mutations in eIF2B result in VWM is unknown. Previous studies suggest that brain white matter astrocytes are primarily affected in VWM. We hypothesized that the translation rate of certain astrocytic mRNAs is affected by the mutations, resulting in astrocytic dysfunction. Here we subjected primary astrocyte cultures of wild type (wt) and VWM (2b5ho) mice to pulsed labeling proteomics based on stable isotope labeling with amino acids in cell culture (SILAC) with an L-azidohomoalanine (AHA) pulse to select newly synthesized proteins. AHA was incorporated into newly synthesized proteins in wt and 2b5ho astrocytes with similar efficiency, without affecting cell viability. We quantified proteins synthesized in astrocytes of wt and 2b5ho mice. This proteomic profiling identified a total of 80 proteins that were regulated by the eIF2B mutation. We confirmed increased expression of PROS1 in 2b5ho astrocytes and brain. A DAVID enrichment analysis showed that approximately 50% of the eIF2B-regulated proteins used the secretory pathway. A small-scale metabolic screen further highlighted a significant change in the metabolite 6-phospho-gluconate, indicative of an altered flux through the pentose phosphate pathway (PPP). Some of the proteins migrating through the secretory pathway undergo oxidative folding reactions in the endoplasmic reticulum (ER), which produces reactive oxygen species (ROS). The PPP produces NADPH to remove ROS. The proteomic and metabolomics data together suggest a deregulation of ER function in 2b5ho mouse astrocytes.
Introduction
Vanishing white matter (VWM) is one of the more prevalent leukodystrophies (van der Knaap et al., 1999). Patients with VWM display chronic neurological deterioration and additionally episodes of stress-provoked rapid and severe deterioration. Neuropathology of post-mortem brain shows cystic degeneration of the cerebral white matter with lack of appropriate astrogliotic scar formation, profound lack of myelin, increased numbers of oligodendrocyte precursor cells and immature astrocytes. The morphology of especially astrocytes in cerebral white matter is abnormal. They look coarse and have fewer, thicker processes than normal (van der Knaap et al., 2006; Bugiani et al., 2011). A small proportion of the oligodendrocytes look foamy (Wong et al., 2000).
Recessive mutations in the eukaryotic translation factor 2B (eIF2B) cause VWM (Leegwater et al., 2001; van der Knaap et al., 2002). eIF2B is an enzyme composed of five different subunits (eIF2Bα-𝜀), encoded by five genes (EIF2B1-5). Mutations reduce the activity of eIF2B (van Kollenburg et al., 2006; Horzinski et al., 2009; Liu et al., 2011).
The eIF2B complex functions as a guanine nucleotide exchange factor (GEF), mediating the exchange of GDP for GTP on eIF2. eIF2-GTP binds to methionine-charged initiator tRNA (Met-tRNAMeti), thereby forming the ternary complex eIF2.GTP.Met-tRNAMeti. The ternary complex together with the small ribosomal subunit binds the 5′-end of the mRNA and scans the 5′-untranslated region (5′-UTR) until it encounters a start codon in a suitable context, whereupon translation of the open reading frame (ORF) starts. Simultaneously, GTP on eIF2 is hydrolyzed to GDP which makes the complex inactive (Konieczny and Safer, 1983; Kleijn et al., 1998; Proud, 2001). GEF activity is needed to recharge eIF2 with GTP.
Translation initiation is a complex process, involving multiple eukaryotic initiation factors (eIFs) (Voorma et al., 1994; Sonenberg and Hinnebusch, 2009). Translation initiation efficiency is profoundly influenced by the nucleotides flanking the start codon (usually AUG), the Kozak consensus sequence (Kozak, 1987). Purines at the -3 and +4 position relative to the AUG start codon are most important in determining translation initiation efficiency (Kozak, 1987; Noderer et al., 2014). The architecture of the 5′-UTR with regard to various sequences, structural motifs and length also determines the translation efficiency of an mRNA (Hinnebusch et al., 2016). eIF2B mutations are expected to reduce ternary complex levels and thus overall mRNA translation. However, this reduced activity can actually enhance translation of certain mRNAs with 5′-upstream open reading frames (uORFs) in their 5′-UTR. uORFs can inhibit translation of the main ORF (mORF) and translation of these mORFs depends on translation reinitiation, which is regulated by ternary complex levels (Meijer and Thomas, 2002; Hinnebusch et al., 2016).
A VWM mouse model, homozygous for the Arg191His mutation in the eIF2B𝜀 subunit has been developed, representative of the human disease (2b5ho mice) (Dooves et al., 2016). The Arg191His mutation corresponds to the Arg195His mutation in patients. This mutation reduces eIF2B activity in vitro and gives a severe VWM phenotype (Fogli et al., 2004; Li et al., 2004). Astrocytes in brains of 2b5ho mice are positive for the immaturity marker nestin. In vitro experiments show that 2b5ho astrocytes inhibit maturation of wild type (wt) oligodendrocytes (Dooves et al., 2016).
The mechanism by which mutations in eIF2B lead to astrocytic dysfunction and disease remains unclear. Here we aim to improve understanding of the molecular mechanism underlying VWM. We expected that mutant eIF2B would not have a general effect on mRNA translation but rather affects translation of a small number of specific mRNAs, leading to disruption of cellular balances and dysfunction of astrocytes in particular. To identify these translational differences, we subjected adult mouse astrocytes to high-resolution quantitative proteomics after a pulse labeling with AHA (L-azidohomoalanine) combined with SILAC (stable isotope-labeling by amino acids in cell culture) (Dieterich et al., 2006; Eichelbaum et al., 2012; Kenney et al., 2016).
Materials and Methods
Mice
All experiments were carried out under the Dutch and European law with approval of the local Institutional Animal Care and Use Committee (IACUC) of the VU University (Amsterdam, Netherlands). Wt and 2b5ho animals were used. All animals were weaned at P21 and had ad libitum access to food and water. The mice were housed with a 12 h light and dark cycle.
Astrocyte Culture
Four-month-old mice were sacrificed by cervical dislocation. Brains were taken out and the olfactory bulbs, cerebella and forebrains were removed. Astrocytes from the remaining structures (gray and white matter structures, including striatum, hippocampi and basal nuclei) were isolated. Brain tissue was minced with a scalpel in Hank’s balanced salt solution (HBSS) without magnesium and calcium (Gibco) at 4°C. The tissue was dissociated with a papain solution containing 20 mM PIPES (pH 7.4), 120 mM NaCl, 5 mM KCl, 1.1 mM EDTA, 5.5 mM L-cysteine-HCl, 40 U/ml DNase and 20 U/ml papain for 30 min at 37°C. Cells were plated in poly-L-ornithine (PLO)-coated flasks and cultured in DMEM/F12 with 15% fetal bovine serum (FBS) (Hyclone), 1% sodium pyruvate (Gibco), 100U penicillin, 100 μg/ml streptomycin (Gibco) and 10 μg/ml gentamicin (Gibco). The cells were passaged twice before they were used for experiments. All chemicals were purchased from Sigma–Aldrich unless otherwise stated. Every experiment was replicated in independent cultures derived from different mice (number of experiments is indicated in figure legends as, e.g., n = 3).
Rate of Protein Synthesis Assay
Astrocytes were plated in 6 cm dishes (∼250,000 cells/dish) and cultured until 80–90% confluent. Cells were starved for methionine for 15 min in AHA medium [DMEM/F12 without methionine, lysine, arginine and phenol red (Thermo Fisher Scientific)] supplemented with 91.3 mg/L L-lysine, 147.5 mg/L L-arginine, dialysed FBS and phenol red, after which AHA (Bachem) was added to AHA medium for the indicated time in a final concentration of 2 mM. Cells were harvested in lysis buffer composed of 50 mM Tris pH 7.5, 100 mM NaCl, 0.5 mM EDTA and 0.5% sodium dodecyl sulfate (SDS).
The newly synthesized proteins were labeled using the Click-iT® Protein buffer kit according to the manufacturer’s protocol (Invitrogen). In short, the AHA molecules in the cell lysate were coupled to biotin. Proteins were precipitated by subsequent addition of six volumes of methanol, 1.5 volume of chloroform and 4 volumes of water. The protein pellet was dissolved in 50 mM Tris-HCl pH 7.5 with 1% SDS before subjection to Western blot analysis. Samples were loaded on 12% CriterionTM TGX Stain-FreeTM Protein Gels (Bio-Rad), allowing detection of total protein load. Biotinylated AHA-labeled proteins were stained with 400 ng/ml streptavidin (680 nm) and visualized at 700 nm in an Odyssey system (Odyssey® Fc, LI-COR). The amount of AHA-staining was corrected for the total protein load determined by Gel DocTM EZ System (Bio-Rad).
Cell Viability Assay
Astrocytes were plated in ½ area 96 well plates (∼5000 cells/well) and cultured for 2 days in AHA-SILAC medium (Thermo Fisher Scientific, custom-made DMEM/F12 without methionine, arginine, lysine and phenol red), with addition of 15% dialyzed serum, 0.005% phenol red, SILAC amino acids (94.2 mg/L [13C6] L-lysine 152 mg/L [13C6] L-arginine or 96 mg/L [13C6, 15N4] L-lysine and 154.3 mg/L [13C6, 15N4] L-arginine) and 17.2 mg/L L-methionine. The cells were starved for methionine from 15 min and cultured with 2 mM AHA (Bachem) or methionine overnight in half well area plates. Cell viability (ATP levels, CellTiter-Glo) was measured according to manufacturer’s instructions (Promega). In short, cells were kept at room temperature for 30 min. CellTiter-Glo was added in the same volume as the culture medium. The plate was shaken for 2 min and left standing for 10 min before measuring luminescence with a Victor2 plate reader (PerkinElmer Life Sciences).
AHA Enrichment and On-Bead Digestion
Astrocytes were plated in 10 cm dishes (∼750,000 cells/dish) and cultured until 80% confluent. The culture medium was replaced with AHA-SILAC medium. Cells were grown for 4 days. SILAC labels were reversed in biological duplicates. Cells were subsequently starved for methionine for 15 min and AHA was added as described in the previous section. Astrocytes were further cultured for 2 h or otherwise indicated. The cells were subsequently washed with cold PBS and lysed in urea lysis buffer (supplied with the Click-IT Protein enrichment Kit, Invitrogen).
For the protein analysis of secreted proteins conditioned medium samples from wt and 2b5ho astrocytes (2 h) were concentrated using Amicon® Ultra-15 centrifuge filter tubes (3 kDa, Merck). Samples were diluted with urea lysis buffer to a volume of 400 μl per sample.
The AHA-labeled proteins from cell lysates as well as from the conditioned medium were enriched using the Click-iT® Protein Enrichment Kit according to the manufacturer’s protocol (Invitrogen) with some minor modifications. In short, the AHA-labeled proteins were bound to the resin (16 h), following an iodoacetamide treatment and several washing steps. The AHA-labeled proteins bound to the resin were dissolved in 50 mM ammonium bicarbonate with 3 M urea. Digestion was performed at 37°C by adding 0.1 μg Lys-C for 4 h followed by addition of 1 μg trypsin overnight. The peptides were separated from the resin by briefly centrifuging them through a 0.8 ml spin columns (Thermo Fisher Scientific). The flow through contains the peptides. Peptide samples were stored at -80°C until further use. See also Figure 1 for an overview of the enrichment procedure.
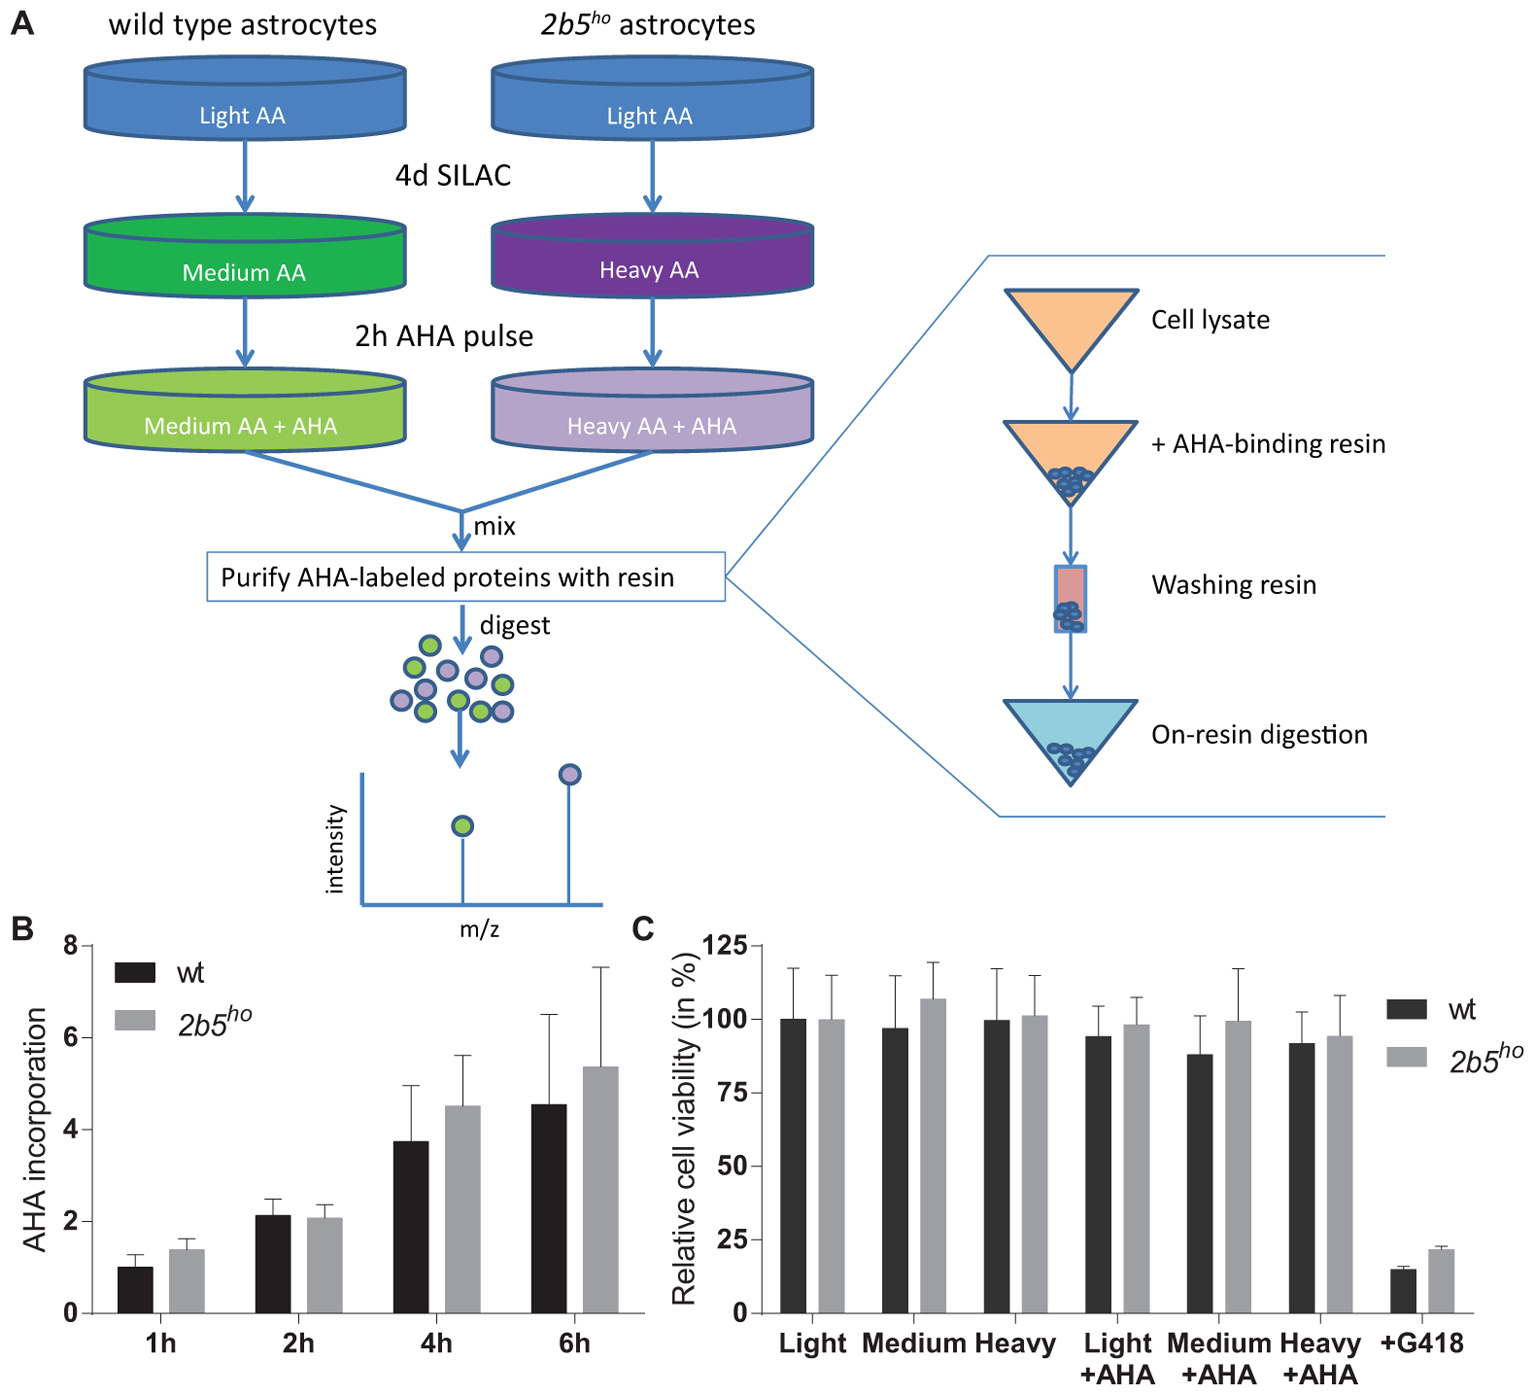
FIGURE 1. L-azidohomoalanine (AHA) incorporation rates are similar between wt and 2b5ho astrocytes and assay conditions do not affect wt and 2b5ho cell viability. (A) Overview of the enrichment protocol. Heavy refers to labeling with [13C6, 15N4] L-lysine and [13C6, 15N4] L-arginine, while medium refers to labeling with [13C6] L-lysine and [13C6] L-arginine. (B) Astrocytes were treated with AHA for 1–6 h to determine a suitable AHA labeling time to measure newly synthesized proteins as well as confirm a similar AHA incorporation between wt and 2b5ho astrocytes. The graph shows the mean + SD (n = 3) and the 1-h-incorporation in wt cells was set to 1. (C) Astrocytes were grown in normal (light) or SILAC culture medium (medium or heavy) for 2 days with or without a 16-h AHA pulse. Cell viability was determined by measuring intracellular ATP levels (CellTiter-glo, Promega). As a positive control for the assay, cells were grown in the presence of G418. The graph shows the mean ± SD (n = 3).
LC-MS/MS Analysis
Peptides were analyzed using a Q ExactiveTM Hybrid Quadrupole-OrbitrapTM Mass Spectrometer (Thermo Fisher Scientific), which was connected to a 1290 Infinity II LC System (Agilent). The trap column was made of C18 (Dr. Maisch Reprosil) material and the analytical column was a 50 cm, 50 μm inner diameter Poroshell C18 (Agilent) column. Both the trap and analytical columns were packed in-house. Solvent A consisted of 0.1% formic acid (Merck) in deionized water (Merck) and Solvent B of 0.1% formic acid in 80% acetonitrile (Biosolve). Peptides were first trapped at 50 μl/min with solvent A and then eluted with solvent B in a 120 min gradient at 100 nl/min: 0–10 min, 100% solvent A; 10.1–105 min, 13–40% solvent B; 105–108 min, 40–100% solvent B; 108–109 min, 100% solvent B; 109–110 min, 0–100% solvent A; 110–120 min, 100% solvent A. The Orbitrap was operated in a data-dependent manner, with the following settings: ESI voltage, 1700 V; inlet capillary temperature 320°C; full-scan automatic gain control (AGC) target, 3 × 10⁶ ions at 35000 resolution; scan range, 350–1500 m/z; Orbitrap full-scan maximum injection time, 250 ms; MS2 scan AGC target, 5 × 10⁴ ions at 17500 resolution; maximum injection, 120 ms; normalized collision energy, 25; dynamic exclusion time, 30; isolation window 1.5 m/z; 10 MS2 scans per full scan.
Data Processing
The LC-MS/MS data were processed with MaxQuant (v1.5.2.8) and MS2 spectra were searched with the Andromeda search engine against the mouse proteome in UniProt (17155 entries, downloaded on 2015-10-27). Enzyme specificity was set to Trypsin/P and two missed cleavages were allowed. SILAC labels (K6/8, R6/10), methionine for AHA substitution and methionine oxidation were set as variable modifications and cysteine carbamidomethylation was set as fixed modification. Minimum peptide length was 7 amino acids. Mass tolerance was set to 20 ppm for peptide masses and 0.6 Da for fragmentation masses. The false discovery rate (FDR) threshold was set to 1% for identifications. Minimal ratio count was set to 2 for protein quantification and the functions “match between runs” and “requantify” were enabled. Data were further analyzed in Perseus (v1.5.0.0). Protein groups were kept for further analysis if they were detected in at least three of the biological replicates. A t-test was performed and protein groups were considered significant if the p-value was <0.05.
Signal Peptide Analysis
To assess the presence of an N-terminal signal peptide in the proteins, we subjected the proteins from the proteomic screen to the SignalP 4.1 server (Bendtsen et al., 2004; Petersen et al., 2011). For all UniProt IDs the FASTA files were downloaded from the UniProt website and all Fasta files are automatically subjected to the SignalP 4.1 server. The presence or absence of a signal peptide for each UniProt ID was predicted with the SignalP 4.1 algorithms and the results were saved to Excel. The UniProt IDs linked back to the list of all identified protein names. Biomart was used to identify proteins containing a transmembrane domain. The number of proteins with a signal peptide was calculated for the proteins, the synthesis of which was affected by eIF2B𝜀Arg191His as well as for the other proteins that are not regulated by the same mutation. Next the number of regulated proteins with a signal peptide were subdivided in ‘upregulated’ and ‘downregulated’.
In Silico Analysis of mRNA Features of eIF2B𝜀Arg191His-Regulated Proteins
The sequences of the mRNA variants encoding the proteins identified in the AHA-SILAC proteomes were downloaded from the NCBI database including the start and stop codon location. The 5′-UTR features “uORFs, %GC and thermodynamic stability (ΔG in kcal/mol)” were determined for all mRNAs (Babendure et al., 2006). We compared each mRNA characteristic for all proteins found in the AHA-SILAC proteomic screen and compared the characteristics for the proteins regulated by eIF2B𝜀Arg191His and non-regulated proteins. The 5′-UTR length, %GC and ΔG from mRNAs encoding the proteins found in the AHA-SILAC proteomes were analyzed per protein. When a protein is potentially translated from more than 1 mRNA variant (taken from the NCBI database), we counted and analyzed all features of all mRNA variants per protein and plotted all as a proportional representation per protein so that the analysis was not skewed by proteins with multiple variants. 5′-UTR lengths of less than 13 nucleotides were omitted from analyses as AUG codons less than 13 nt from the cap are inefficient to initiate translation (Hinnebusch, 2011). The % of GC in the 5′-UTRs was calculated. To calculate the thermodynamic stability, the free energy (ΔG) of 5′-UTRs was determined using UNAFold1, which predicts thermodynamic stability. The uORF was defined as upstream AUG/CUG/GUG/UUG/ACG with a purine (A/G) at the -3 position and a guanine at the +4 position (Ingolia et al., 2011; Ferreira et al., 2013; Noderer et al., 2014). Scripts used for the analyses are found at: https://github.com/LisanneWisse/UORF or https://github.com/LisanneWisse/RefSeq.
DAVID Analysis
Overrepresentation of specific pathways was analyzed with DAVID [based on gene ontology (GO)-terms] between the proteins that are affected by the eIF2B𝜀Arg191His mutation and all the proteins found in the AHA-SILAC proteome (Huang et al., 2009a,b).
Cell Lysates for Western Blot Experiments
Astrocytes were plated in 10 cm dishes (∼750,000 cells/dish) and cultured until 80% confluent. Cells were washed with cold PBS, collected by scraping in PBS and pelleted by centrifugation (5 min, 1000 × g, 4°C). The method is based on the protocol described2. Cells were lysed in harvesting buffer containing 10 mM HEPES pH 7.9, 50 mM NaCl, 0.5 M sucrose, 0.1 mM EDTA, 0.5% Triton, 1 mM DTT, phosphatase inhibitors (0.5 mM activated NaVO3, 25 mM β-glycerophosphate, 50 mM NaF) and protease inhibitors (Roche). Lysates were centrifuged (10 min 500 × g, 4°C) and the supernatant was used for Western blot analyses.
Whole Brain Lysates for qPCR and Western Blot Experiments
Mice were sacrificed by cervical dislocation at 4 months of age. Brains were removed, snap-frozen in liquid nitrogen and stored at -80°C until further use. Lysates were prepared by grinding the brain samples with a pestle and mortar under liquid nitrogen. The powder was lysed in cytoplasmic lysis buffer (20 mM Tris pH 7.4, 100 mM KAc, 3 mM MgAc2, 2 mM DTT, 1.5% IGEPAL, 1.5% sodium deoxycholate (SODC), 1x HALT (protease and phosphatase inhibitory cocktail, Thermo Fisher Scientific]. The samples were homogenized with a pestle followed by trituration through a 23G needle. The samples were centrifuged (10 min, 10.000 × g, 4°C) and the supernatant was aliquoted into pre-chilled microfuge tubes. Protein concentrations were determined using a Quick StartTM Bradford Protein Assay (Bio-Rad). For RNA isolation, TRIzolTM Reagent (Invitrogen) was added to 50 μl of the supernatant and total RNA was isolated as described under RNA isolation and cDNA synthesis.
Western Blot
For cell lysates approximately 10 μg and for brain lysates 50–60 μg of protein was loaded on a 12% SDS-polyacrylamide gel with 2,2,2-trichloroethanol (TCE) which allow detection of total protein load (Ladner et al., 2004). Proteins were transferred onto a PVDF membrane (Bio-Rad). Membranes were blocked in 5% (w/v) milk powder and stained with the antibody against PROS1 (16910-1-AP, Proteintech) or SLC3A2 (LS-C334231, LSBio) overnight (16 h) at 4°C. Membranes were washed with TBS-Tween20 (0.1%) and incubated with an HRP-conjugated secondary goat anti-rabbit IgG antibody (Dako, P0448) for 2 h at room temperature. The membranes were washed three times with TBS-Tween (0.1%) and once with TBS, incubated with SuperSignalTM West Femto (Thermo Fisher Scientific) and imaged (Odyssey® Fc, LI-COR). Protein expression was corrected for total amount of protein determined by Gel DocTM EZ System (Bio-Rad).
RNA Isolation, cDNA Synthesis and qPCR
Astrocytes were washed twice with PBS and collected in TRIzolTM Reagent (Invitrogen). RNA was isolated according to the manufacturer’s protocol. In short, 1/5 volume chloroform was added to the TRIzolTM Reagent. The samples were centrifuged (10 min, 12000 × g, 4°C) and the water layer was transferred to a fresh tube. Half a volume of isopropanol and 1/250 volume of linear acrylamide (Ambion) was added and the samples were centrifuged for 20 min at 4°C and 12000 × g. The pellet was washed twice with 70% ethanol and resuspended in non-DEPC treated water (Ambion). RNA was precipitated with 175 mM sodium acetate (pH 5.2) and 70% ethanol and incubated for 30 min at -20°C. The samples were centrifuged (30 min, 4°C, 12000 × g) and the pellets were washed twice with 70% ethanol and resuspended in non-DEPC-treated water.
RNA quality and quantity were determined by measuring the A260 and A280 (NanoDrop 2000, Thermo Fisher Scientific). cDNA was synthesized in a 20 μl reverse transcription reaction: 1x first strand buffer (Invitrogen), random hexamers (0.02 μg/μl; Qiagen), oligoDT (0.02 μg/μl; Qiagen), dNTPs (1 mM each; Roche), DTT (1 mM; Invitrogen), RNaseOUT (0.25 U/μl; Invitrogen), Superscript III (5 U/μl; Invitrogen) and 1.5 μg total RNA were incubated for 2 h at 50°C. RNAseH (62.5 U/μl; Invitrogen) was added and incubated for 30 min at 37°C followed by 15 min at 70°C.
mRNA levels were determined with qPCR using a LightCycler® 480 II Instrument (Roche). For each 10 μl sample a mixture of LightCycler® 480 SYBR Green I Master (Roche), primers (1 pmol/μl) and cDNA (0.1 μl) was used. Used primers are listed in Table 1. Gapdh mRNA was used as reference.
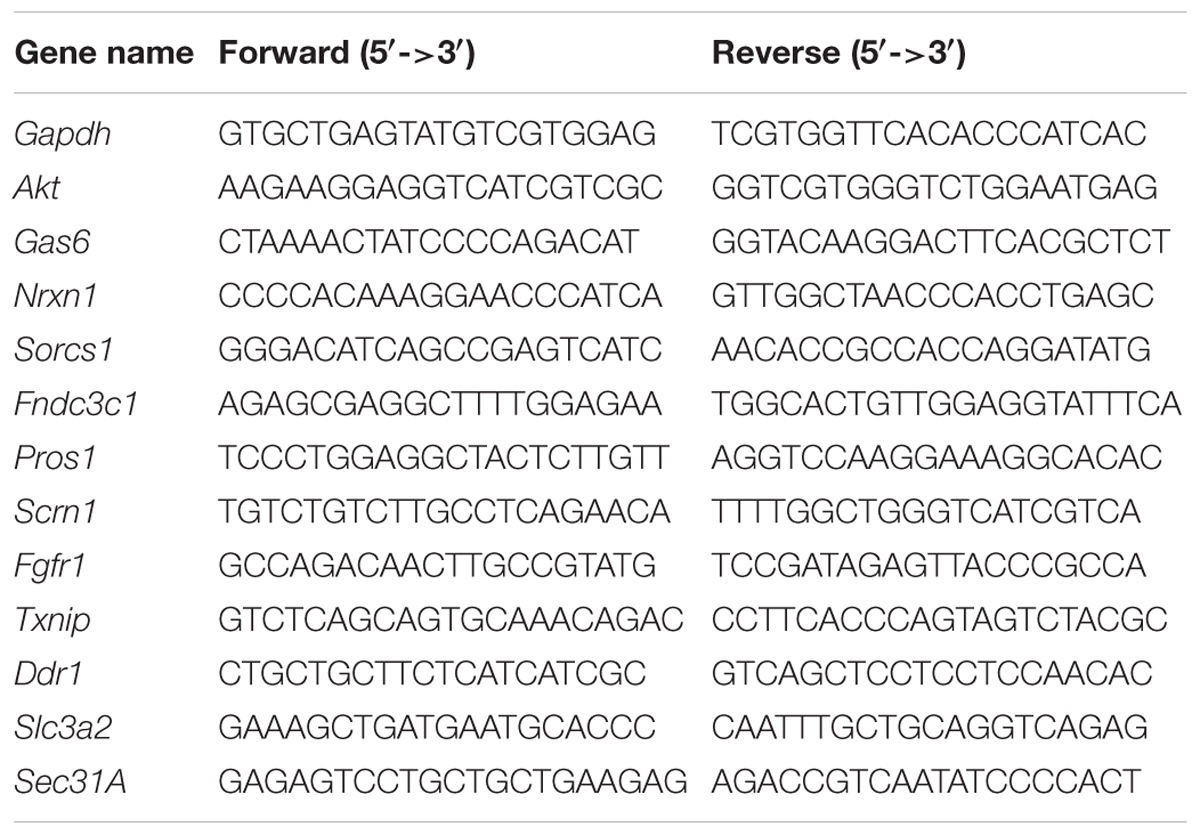
TABLE 1. Primers used for qPCR.
Constructs
Construct to Determine Secretion
The pNL1.3 plasmid (Promega) expresses the nanoluciferase protein with an N-terminal signal peptide from interleukin-6 (IL-6; Secluc). The signal peptide promotes secretion of the nanoluciferase into the culture medium. The pNL1.3-Gapdh construct contains the promoter including 5′-UTR of Gapdh, which was inserted in the pNL1.3 vector using an infusion reaction, according to the manufacturer’s protocol (In-Fusion® HD Cloning Kit, Clontech). The PCR-amplified sequence of the constructs was confirmed by sequence analysis.
Constructs to Determine Translation
The pNL1.1 plasmids express the nanoluciferase protein (Nluc). Promoter and 5′-UTR sequences of candidate genes were taken from NCBI and Ensembl databases (Table 2). Infusion primers were designed to amplify promoter (approximately 2000 bps upstream of the transcription start site) and 5′-UTR-encoding sequences using the primer design tool on the Clontech website. Internal primers were designed to merge the Gapdh promoter region and the 5′-UTR of the candidate.
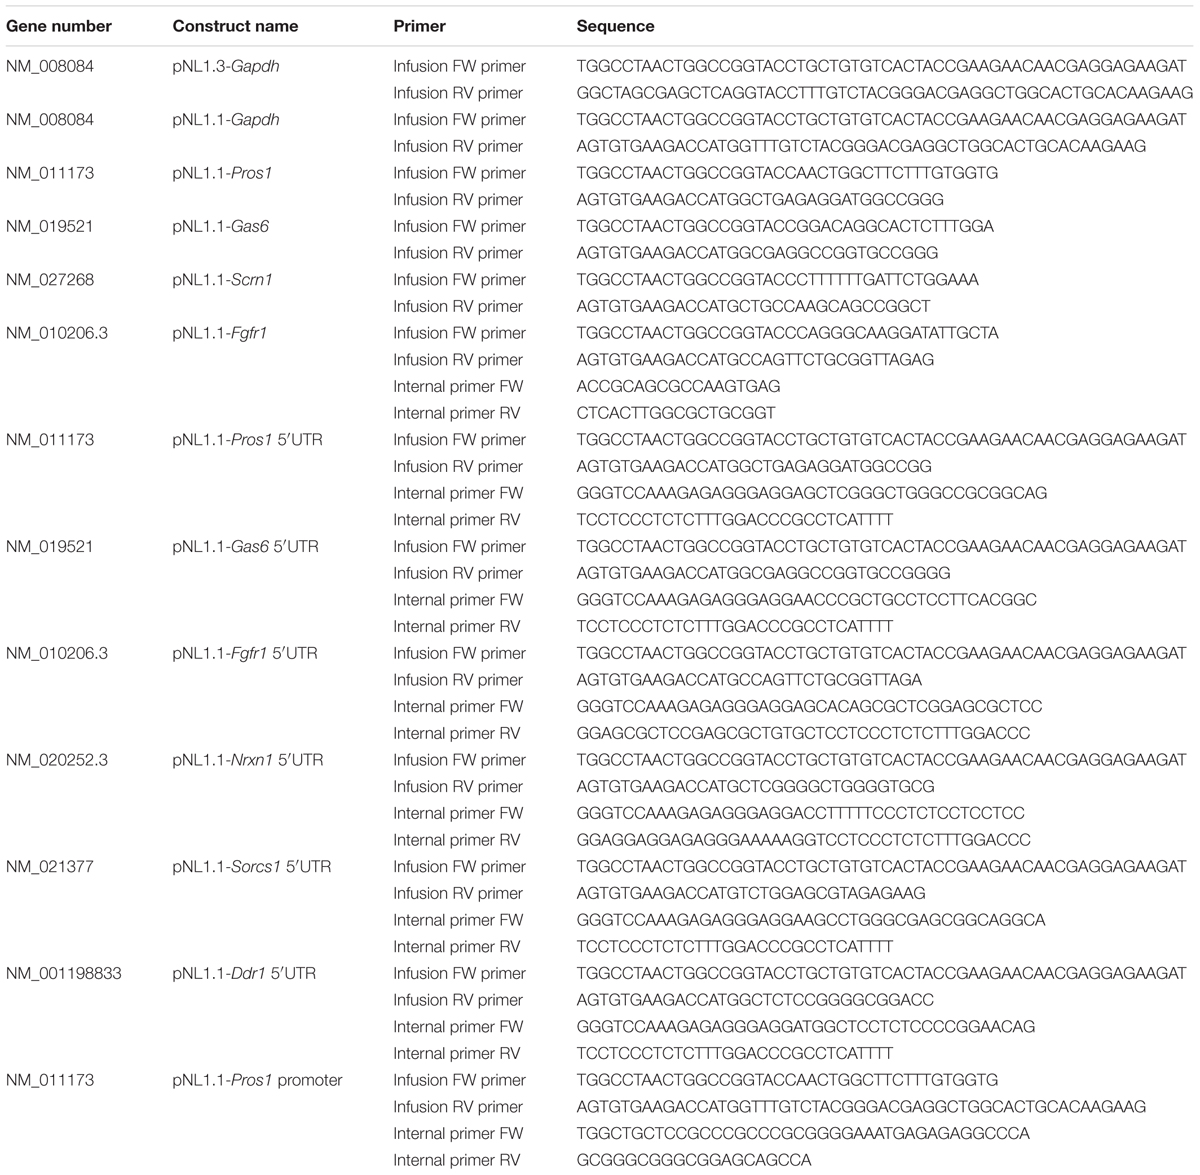
TABLE 2. Primer sequences used for cloning.
The promoter and 5′-UTR sequences were amplified using the infusion primers and the overlapping internal primers on gDNA from mouse liver or cDNA from cultured mouse astrocytes (Table 2) according to the manufacturer’s protocol (ClonAmp, In-Fusion HD, Clontech). For the chimeric constructs comprising the murine Gapdh core promoter and 5′-UTR of the candidate mRNA a triple infusion reaction was performed with the pNL1.1 vector, the amplified promoter product and the amplified 5′-UTR product (Table 2). All promoter and 5′-UTR sequences were inserted into the pNL1.1 vector (Promega) using an infusion reaction according to the manufacturer’s protocol (In-Fusion® HD Cloning Kit, Clontech). The resulting plasmids are listed in Table 2. PCR-amplified sequences of all constructs were confirmed by sequence analysis.
Construct Used As Internal Control
The pGL3 plasmid expresses the firefly luciferase protein (Fluc). The murine Gapdh promoter and 5′-UTR were digested from the pNL1.1 vector with KpnI and NcoI, purified from agarose gel (High Pure PCR Cleanup, Roche) and inserted into an empty pGL3 vector digested with the same restriction enzyme using a T4 DNA ligase (Promega). The resulting plasmid pGL3-Gapdh was used as internal standard in transfection studies. PCR-amplified sequence of the constructs was confirmed by sequence analysis.
Measurement of Secretion and Secretory Pathway Flux
Astrocytes were plated in half-area 96 well plates (∼3000 cells/dish, CELLSTRAR) to 80% confluency. pNL1.3-Gapdh (80 ng) was transfected into the cells using 0.24 μl FuGENE® 6 according to the manufacturer’s protocol (Promega). Luciferase activity in cells and culture medium was measured using the protocol of Promega and a Wallac 1420 Victor2 Microplate Reader (Perkin Elmer). The ratio of extracellular/intracellular luciferase activity determines the relative secretion.
Transfections
Astrocytes were plated in half-area 96 well plates (∼3000 cells/dish, CELLSTAR). Each pNL1.1 promoter/5′-UTR construct (40 ng) was co-transfected with internal control pGL3-Gapdh (20 ng) using FuGENE® 6 Transfection Reagent (0.24 μl) according to the manufacturer’s protocol. Luciferase activity was measured using the protocol of Promega and a GloMax® Discover System (Promega). The ratio Nluc:Fluc determines the expression of Nluc corrected for well-by-well differences.
Metabolomics
Astrocytes were cultured in 6 cm dishes (∼250,000 cells/dish) until 70% confluent. Medium was replaced 72 and 24 h before harvesting. At the time of harvesting culture medium was removed from the cells and stored at -80°C until analysis. Cells were washed with ice-cold PBS and metabolites were extracted from cells in 0.5 ml lysis buffer containing methanol/acetonitrile/dH2O (2:2:1). Samples were spun at 16.000 × g for 15 min at 4°C. Supernatants were collected for LC-MS analysis. 10 μl of conditioned medium was added to 1 mL of lysis buffer containing methanol/acetonitrile/H2O (2:2:1) and prepared as above.
LC-MS analysis was performed on an Exactive mass spectrometer (Thermo Fisher Scientific) coupled to a Dionex Ultimate 3000 autosampler and pump (Thermo Fisher Scientific). The MS operated in polarity-switching mode with spray voltages of 4.5 and -3.5 kV. Metabolites were separated using a SeQuant® ZIC®-pHILIC HPLC Columns (2.1 mm × 150 mm, 5 μm, guard column 2.1 mm × 20 mm, 5 μm; Merck) using a linear gradient of acetonitrile and eluent A [20 mM (NH4)2CO3, 0.1% NH4OH in ULC/MS grade water (Biosolve)]. Flow rate was set at 150 μl/min. Metabolites were identified and quantified using LCQUANTM Quantitative Software (Thermo Fisher Scientific) on the basis of exact mass within 5 ppm and further validated by concordance with retention times of standards. Metabolites were quantified using LCQUANTM Quantitative Software (Thermo Fisher Scientific). Peak intensities were normalized based on median peak intensity.
Statistical Analyses
The program Factor was used to correct for differences between experiments (qPCR, Western blot, cell viability) but not between other conditions (genotype, treatments) (Ruijter et al., 2006). Statistical analysis of qPCR, Western blot and cell viability experiments were performed with a two way ANOVA followed by a Sidaks multiple comparison test, using GraphPad Prism software. Statistical analysis of the transfection data was performed using a T-test per construct.
A Chi-square analysis was used to measure significant differences in the presence of signal peptides, transmembrane regions and SP-targeting proteins as well as for the analysis on the 5′-UTR features using GraphPad Prism software.
The secretion assay was statistically tested with a multilevel analysis in SPSS. Differences were significant when p < 0.05.
Results
AHA-SILAC Incorporation Is Not Affected by Mutations in eIF2B and Does Not Affect Astrocyte Viability
L-azidohomoalanine incorporation was measured in wt and 2b5ho astrocytes to investigate if the general protein synthesis rate is affected by the homozygous Arg191His mutation in eIF2B𝜀 (Figure 1). Label incorporation increased linearly for a period of 4 h (Figure 1B). The incorporation occurred with similar kinetics in 2b5ho and wt astrocytes (Figure 1B), indicating that the eIF2B𝜀 Arg191His mutation did not significantly affect protein synthesis rate. The viability of both wt and 2b5ho astrocytes was not influenced by AHA or SILAC treatment (Figure 1C). Expression of stress-related mRNAs was unaffected by the AHA-labeling protocol (Supplementary Figure 1). These results allow further proteomic analyses with an AHA incorporation pulse of 2 h.
Pulsed Labeling Proteomics of Astrocytes Reveals 80 Proteins Regulated by the eIF2B𝜀 Arg191His Mutation
The AHA proteomic labeling approach was performed to identify and quantify proteins that are differentially translated in 2b5ho astrocytes. SILAC-labeled wt and 2b5ho astrocytes were subjected to AHA labeling for 2 h. After AHA labeling cells were harvested and subjected to bead-based enrichment using a Click-iT chemistry approach. Bound proteins were digested and resulting peptides were analyzed by LC-MS/MS. In four biological replicates, we identified a total of 2888 proteins across both wt and 2b5ho astrocytes. 1240 proteins were detected in at least 3 out of 4 biological replicates for both wt and 2b5ho astrocytes and used for further analysis. Accumulation of 72 proteins was increased and of eight proteins decreased in the 2b5ho AHA-proteome (p < 0.05, student’s T-test) (Figure 2A and Supplementary File 1).
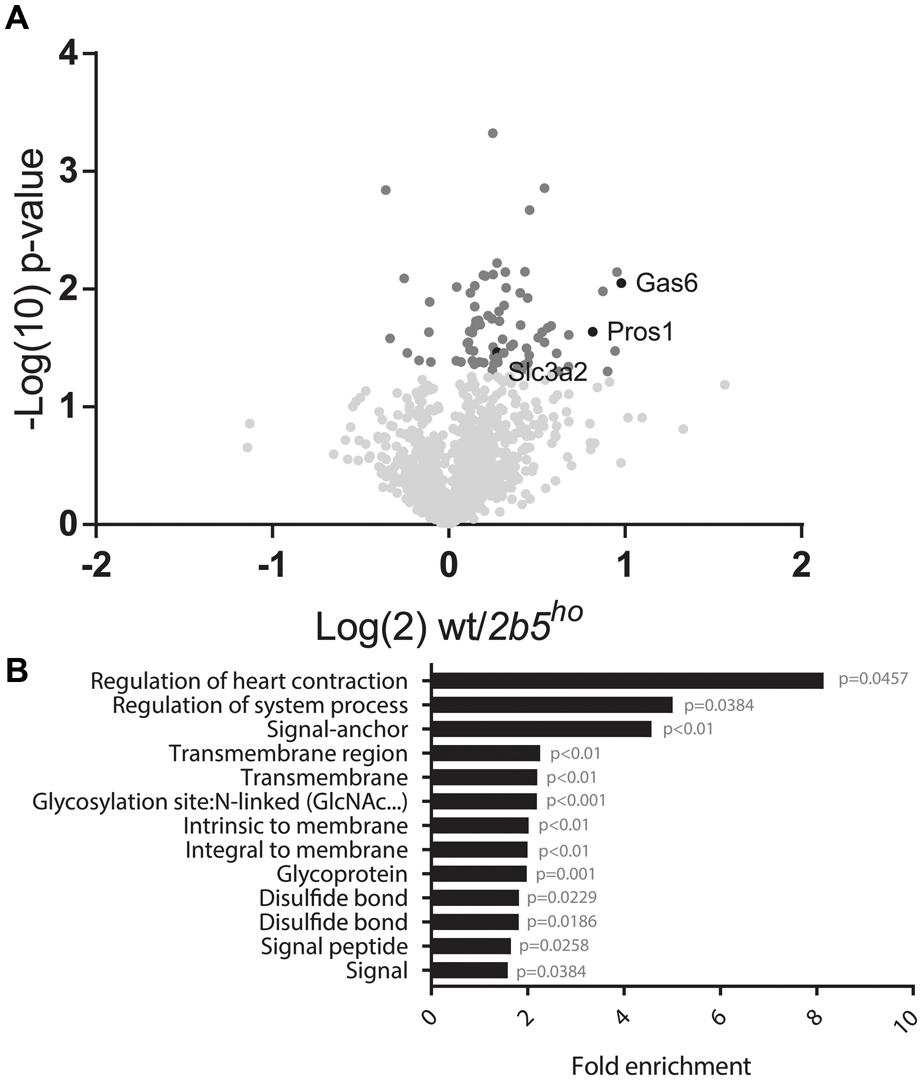
FIGURE 2. Volcano plot of all 1240 proteins from the proteomic screen and DAVID analysis of the 80 proteins regulated by eIF2B𝜀Arg191His identifies a difference in proteins that migrate through the secretory pathway. (A) In the volcano plot the proteins in darker gray have a p-value < 0.05 and are considered significantly differently synthesized between wt and 2b5ho astrocyte cultures. The p-values are plotted as Log(10) and p < 0.05 corresponds to -Log10 > 1.12. The fold change between wt and 2b5ho is plotted as Log(2) and a fold change of >2 corresponds to Log(2) > 1. 80 proteins are significantly different between wt and 2b5ho astrocytes of which 72 are increased and 8 are decreased in 2b5ho astrocytes. The proteins SLC3A2, PROS1, and GAS6 are highlighted in black. (B) The figure shows the overrepresentation analysis (p-value < 0.05) between the significantly different proteins with the proteins found in the proteome as a background. The pathway analysis reveals an overrepresentation of proteins with a signal peptide, transmembrane domain, N-linked glycosylation site(s) and/or disulfide bond(s). These terms together pinpoint targeting of proteins to the secretory pathway, some of which are post-translationally modified, as being affected by this mutation.
eIF2B𝜀Arg191His-Regulated Proteins Localize Predominantly to the Plasma Membrane or Extracellular Space
We performed a DAVID pathway analysis to investigate if the eIF2B𝜀Arg191His-regulated proteins share common functions, localizations or other features. This analysis showed enrichment for N-terminally glycosylated proteins, membrane proteins, proteins with disulfide bonds as well as proteins that contain a signal peptide among the set of eIF2B𝜀Arg191His-regulated proteins (Figure 2B). This outcome suggests that many regulated proteins follow the secretory pathway. Since signal peptides and transmembrane domains are associated with targeting to the secretory pathway (von Heijne, 1990; Petersen et al., 2011; Borgese, 2016), we tested all 1240 identified proteins for signal peptides or transmembrane domains. Signal peptides were found in 237 proteins and transmembrane domains in 177. The number of proteins predicted to pass through the secretory pathway was significantly enriched in the 2b5ho proteome (Table 3). 27 out of the 80 regulated proteins harbor a signal peptide and 24 have at least one transmembrane domain; 13 of the proteins harbor both a signal peptide and a transmembrane domain (in total 38 proteins out of 80). Intriguingly, the proteins annotated as migrating through the secretory pathway were all upregulated in 2b5ho astrocytes. It is possible that these proteins accumulate more in 2b5ho astrocytes during the 2-h labeling pulse due to a secretory pathway flux difference and not to an actual increase in translation rate. To investigate this, we analyzed the AHA-enriched secretome from wt and 2b5ho cultures after a 2-h AHA labeling. We detected 22 labeled proteins in the secretome, of which three (APOE, CST3 and POSTN) were significantly reduced in the 2b5ho astrocyte-conditioned medium. Intracellularly, APOE and POSTN were not changed by eIF2B𝜀Arg191His. CST3 was significantly increased intracellularly in 2b5ho astrocytes. No other protein from the original 27 eIF2B𝜀Arg191His-regulated proteins with a signal peptide was detected in the secretomes of wt and 2b5ho astrocytes. To further address the hypothesis that 2b5ho astrocytes have an altered secretory pathway flux, we evaluated the flux of proteins migrating through the secretory pathway with a reporter assay. The assay showed robust secretion of the Secluc reporter (Supplementary Figure 2) and secretion differences between wt and 2b5ho astrocytes were not detected (Figure 3).
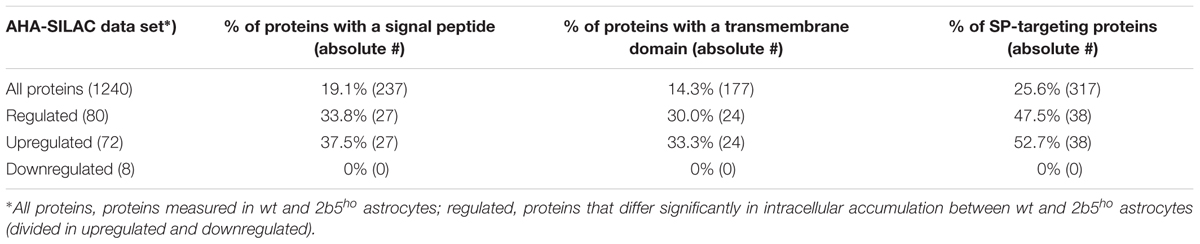
TABLE 3. Analysis of the proteins that are synthesized and migrate in the secretory pathway (SP).
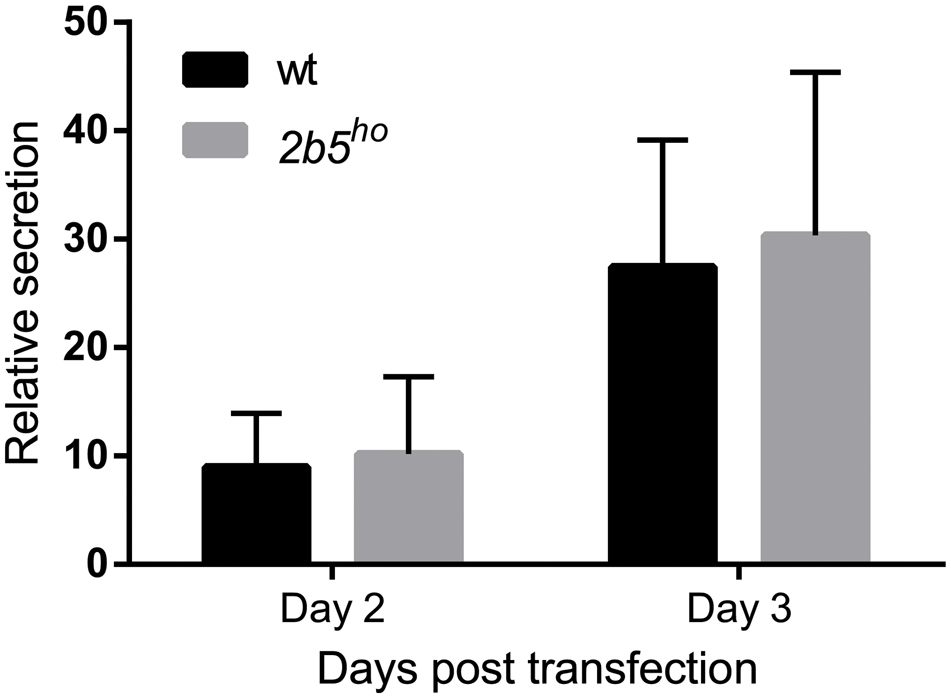
FIGURE 3. The secretion of Secluc nanoluciferase via the secretory pathway is not affected in 2b5ho astrocyte cultures. Astrocytes were transfected with a luciferase reporter construct that expresses nanoluciferase fused to the IL-6 signal peptide. Luciferase activity was measured 2 and 3 days post transfection in cell lysates and cell culture medium. The ratio of extracellular:intracellular luciferase activity was determined as a measure for secretion through the secretory pathway. In the absence of the signal peptide, the extracellular luciferase activity was similar to the background signal (Supplementary Figure 2). The graph shows the mean ± SD (three independent cultures, six wells per culture).
Validation of eIF2B𝜀Arg191His-Regulated Proteins
To investigate if the proteins that were found in the screen are indeed differentially expressed at the translational level, we selected eleven candidates that are either increased or decreased in wt vs. 2b5ho cultures. We quantified their mRNA levels to discriminate whether differences in protein amounts are regulated at the transcriptional or the translational level. Only one of the selected candidates differed in mRNA expression between wt and 2b5ho astrocytes (Figure 4A), suggesting that the increased accumulation of the other 10 proteins was not due to increased transcription or mRNA stability. Of the 11 candidates two were further investigated at the protein level by Western blot. We found that PROS1 and SLC3A2 were indeed significantly increased at the total protein level (Figure 4B). This result confirms the data from the proteomic screen and also demonstrates increased accumulation of these candidate proteins.
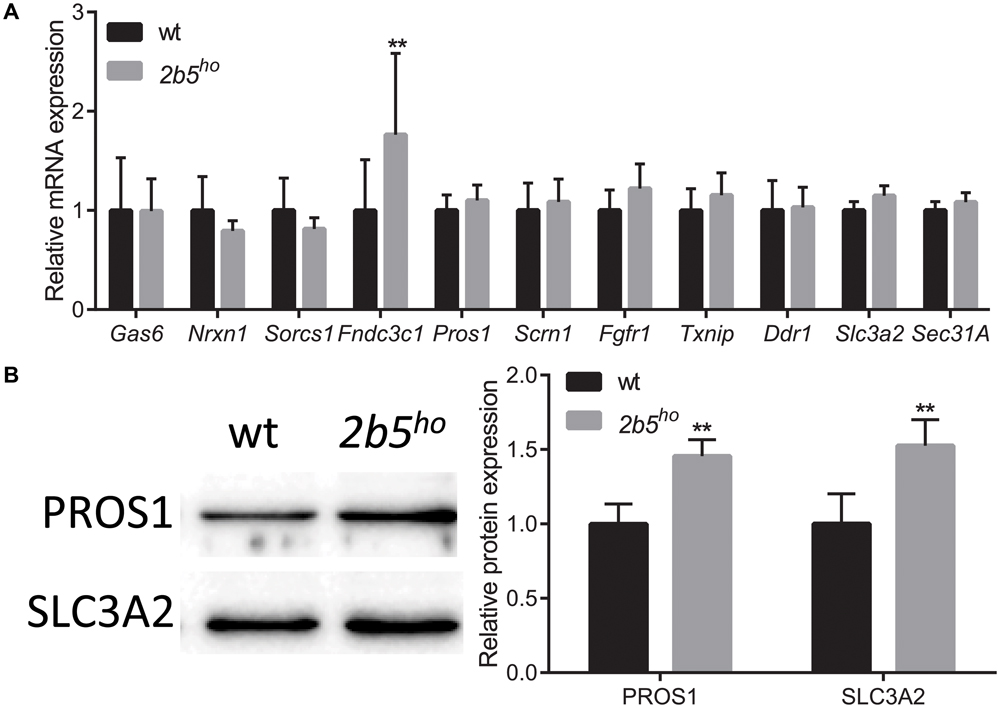
FIGURE 4. mRNA and protein levels of candidate proteins in astrocyte cultures. (A) mRNA levels of the investigated candidate were investigated with qPCR. The mRNA levels were similar between wt and 2b5ho astrocytes (n ≥ 5), with the exception of the Fndc3c1 mRNA, which was increased in 2b5ho astrocytes. (B) The total protein levels of PROS1 and SLC3A2 were determined by Western blot. The graph shows the mean ± SD. The protein levels were increased in 2b5ho cultures compared to wt cultures (n ≥ 3). ∗∗p < 0.01. Post-translational modifications were overall not affected in 2b5ho astrocytes. Western blot analyses did not show whether PROS1 in astrocytes was post-translationally modified or not. Staining of all proteins (loading control) is shown in Supplementary Figure 4.
We next investigated several targets in mouse brain. At the mRNA level seven out of nine targets were similar between wt and 2b5ho brains (Supplementary Figure 3A). Two proteins were further assessed using Western blot (Supplementary Figure 3B). SLC3A2 protein abundance was also increased in brain lysates; however, this correlated with increased Slc3a2 mRNA levels, suggesting transcriptional regulation in brain. PROS1 protein abundance was also increased in brain lysates, but Pros1 mRNA abundance was not. This finding suggests translational upregulation of PROS1 both in cell culture and brain.
In Silico Analysis of mRNAs
eIF2B plays an essential role in the regulation of protein synthesis. For this reason, we investigated if the mRNAs of the eIF2B𝜀Arg191His-regulated proteins share specific features that could explain the translational regulation by eIF2B. We investigated the 5′-UTRs for length, structural stability (%GC and ΔG) and number of uORFs with a Kozak sequence. The 5′-UTR length was significantly increased for mRNAs encoding eIF2B𝜀Arg191His-regulated proteins (Figure 5). Of note, the mRNAs for the eight proteins decreased in the eIF2B𝜀Arg191His-regulated proteome have relatively short 5′-UTRs (29-343 bases, median 133). This analysis showed that the eIF2B𝜀Arg191His mutation differentially influences expression of proteins translated from mRNAs with short 5′-UTRs (<150 bases), which were underrepresented, compared to those with lengthy 5′-UTRs (>550 nucleotides), which were overrepresented; those translated from mRNAs with short 5′-UTRs, if regulated, tend to go down in expression in the mutant cells. The %GC in the 5′-UTRs did not significantly differ between eIF2B𝜀Arg191His-regulated proteins and other proteins (Figure 5). The thermodynamic stability (ΔG in kcal/mole) of the 5′-UTR seemed to be higher for mRNAs encoding the eIF2B𝜀Arg191His-regulated proteins, although not significantly (Figure 5). The overall number of uORFs did not significantly differ for mRNA encoding the eIF2B𝜀Arg191His-regulated proteins compared to the non-regulated proteins (Figure 5). However, mRNAs with high numbers of uORFs (8 or more) were clearly overrepresented in the group of significantly altered proteins.
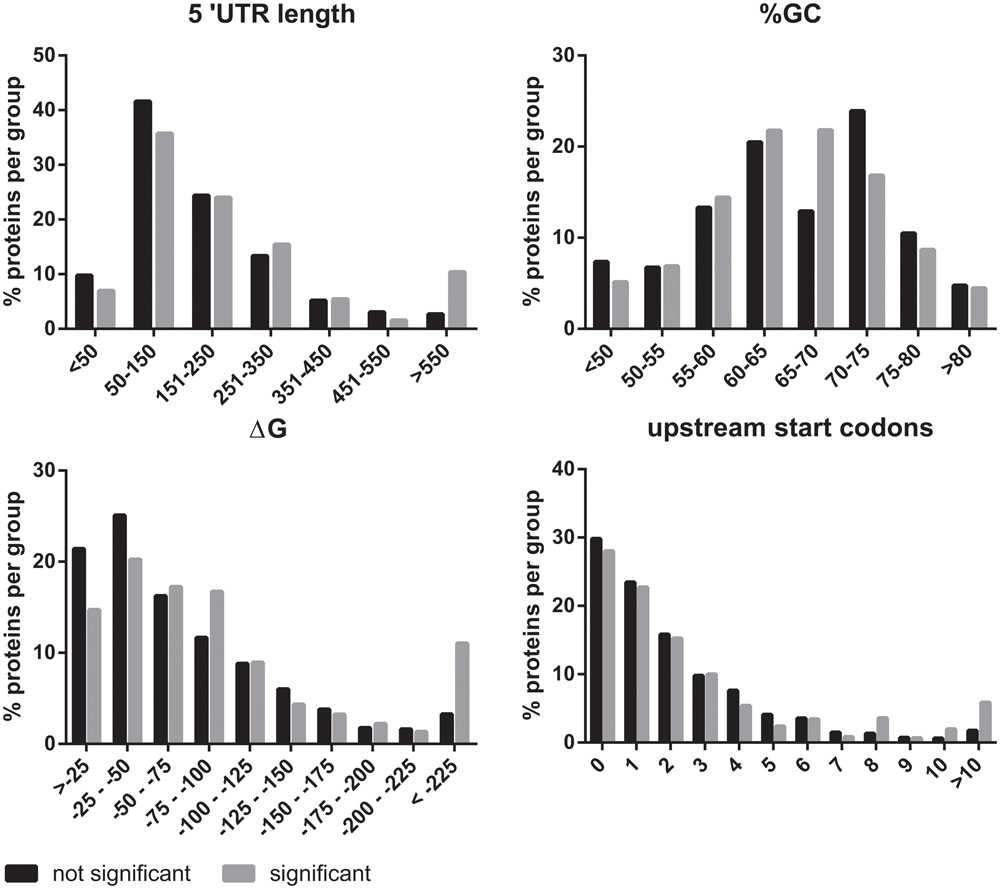
FIGURE 5. In silico 5′UTR analysis of the eIF2BArg191His-regulated proteins. The 5′UTRs of the mRNAs encoding the proteins regulated by eIF2B𝜀Arg191His mRNAs are significantly longer than of those encoding non-regluated proteins. They have an overall similar percentage GC content to the non regulated proteins. However, they seem to tend to higher ΔG’s. These findings combined are indicative of relatively structured 5′-UTRs in the mRNAs of eIF2B𝜀Arg191His-regulated proteins. The number of uORFs is similar between the significant and not significant proteins, though mRNAs with very high numbers (8 or more) of predicted uORFs are overrepresented in the group of significantly altered proteins.
Translation Efficiency Was Assessed in Reporter Assays
We investigated the potential translational regulation of some eIF2B𝜀Arg191His-regulated proteins using reporter constructs encoding nanoluciferase driven by promoter sequences (including the 5′-UTR) of the candidates GAS6, PROS1, SCRN1 and FGFR1. A Gapdh promoter construct was included as non-regulated control. Transfection of each construct yielded similar luciferase expression in wt and 2b5ho cultures (Figure 6). Transfection of the pNL1.1-Fgfr1 promoter construct did not yield a reliable level of nanoluciferase (approximately two–threefold over the background signal in non-transfected cells) and was therefore omitted from analysis. The levels of nanoluciferase activity expressed with the other constructs were still low in comparison to the Gapdh-promoter-driven expression. Because expression could be increased by replacing the candidate promoter with the Gapdh promoter, we therefore constructed Gapdh-candidate chimeras. With these chimeras we tested the 5′-UTR efficiency of candidates GAS6, SORCS1, PROS1, FGFR1, NRXN1, and DDR1 in wt and 2b5ho cultures. Neither the pNL1.1-Fgfr1-5′-UTR nor the pNL1.1-Nrxn1-5′-UTR constructs yielded quantifiable nanoluciferase expression. These constructs were omitted from further analyses. The expression from the chimeric promoter-5′-UTR constructs of Gas6 and Pros1 was increased by the Gapdh core promoter in both wt and 2b5ho cells. Still, none of these constructs yielded an increased nanoluciferase expression in 2b5ho compared to wt astrocytes (Figure 6).
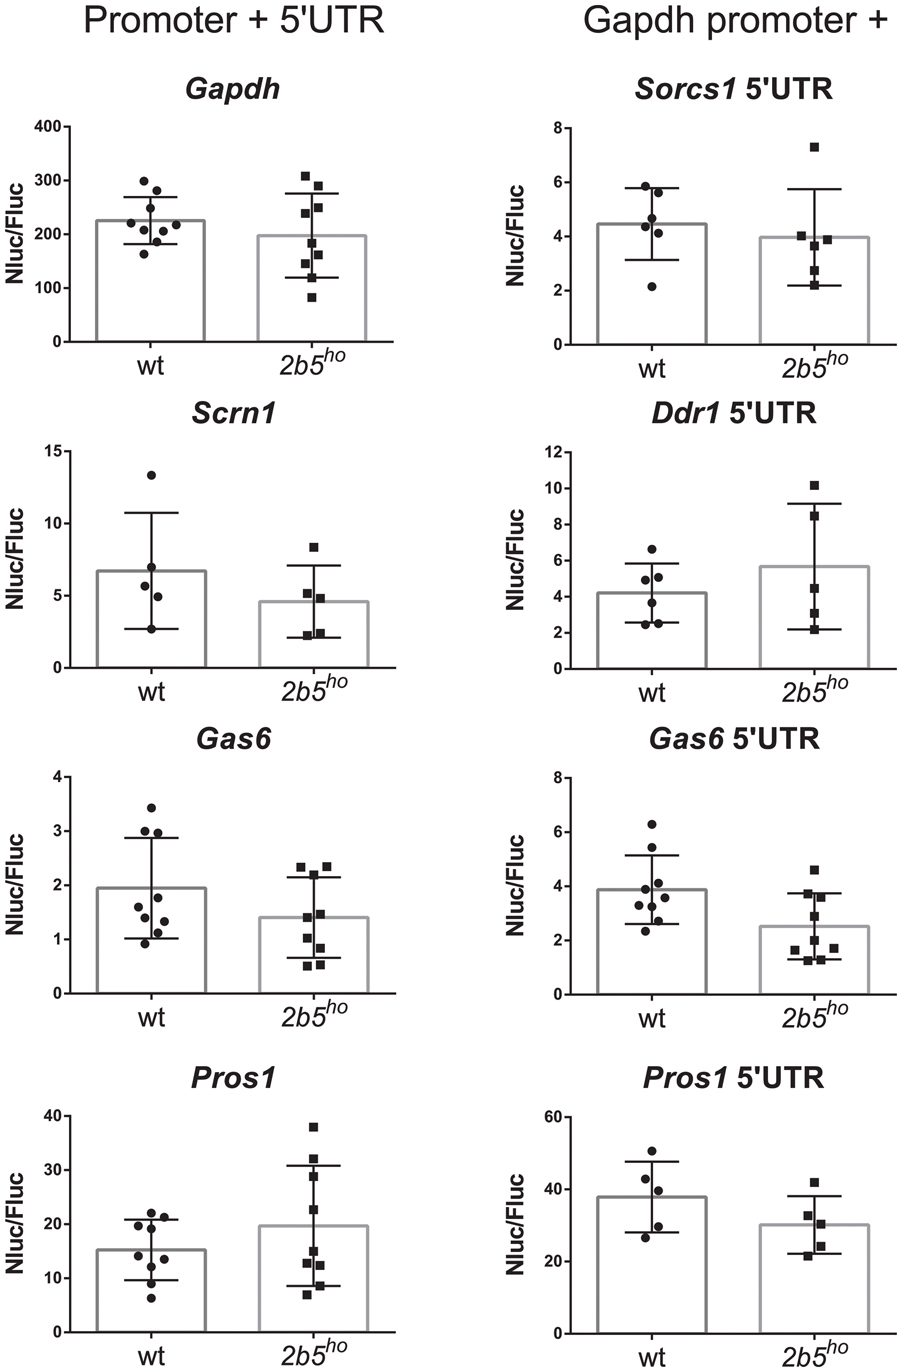
FIGURE 6. In vitro analyses of candidate gene expression regulation do not reveal difference in promoter or 5′-UTR efficiency in wt and 2b5ho astrocytes. pNL1.1- Scrn1, -Gas6 and -Pros1 constructs and pNL1.1-Sorcs1, -Ddr1, -Gas6 and -Pros1 5′UTR constructs were transfected into wt and 2b5ho astrocytes. Nanoluciferase activity was measured 3 days post transfection and corrected for firefly luciferase activity expressed from the pGL3-Gapdh internal standard. Every culture is shown as a single dot and bars represent the mean ± SD (n = 5–9). Replacement of the authentic Pros1 or Gas6 promoter by the Gapdh promoter increased the nanoluciferase expression by approximately twofold. pNL1.1-Gapdh was used as reference non-regulated promoter.
Metabolic Screen of Astrocytes Conditioned Medium and Lysates
Because the proteomic data only gave small differences, the VWM phenotype remained difficult to explain. Tiny differences in protein levels and post-translational modifications occasionally lead to metabolic shifts. Thus we checked whether they affected cellular metabolism, using a mass spectrometry-based metabolic screen. We measured intra- and extracellular metabolites 24 and 72 h after replacing the culture medium. We looked at general energy consumption by measuring the uptake and secretion of metabolites from the culture medium (Figure 7A). As expected, both cultures had taken up glutamate (Martin-Jimenez et al., 2017) and aspartate (which use the same transporters) (Bender et al., 1997), reflecting specific astrocyte function. The uptake of glutamate and aspartate did not influence their intracellular levels (Supplementary File 2). Also, both wt and 2b5ho cultures showed uptake of pyruvate. Astrocytes convert pyruvate into lactate and glutamate/aspartate into glutamine, cis-aconitate and α-ketoglutarate (Martin-Jimenez et al., 2017). Indeed, the wt as well as the 2b5ho cultures secreted lactate, glutamine, cis-aconitate and α-ketoglutarate (Figure 7A). In addition, we investigated intracellular metabolites (Figure 7B). 6P-gluconate, an intermediate of the pentose phosphate pathway (PPP), was detected in 2b5ho but not in wt cells at both time points (Figure 7B). A fluctuation over time in NADPH levels was observed. The remaining metabolites tested did not show consistent differences over time between wt and 2b5ho astrocytes (Figure 7B and Supplementary File 2).
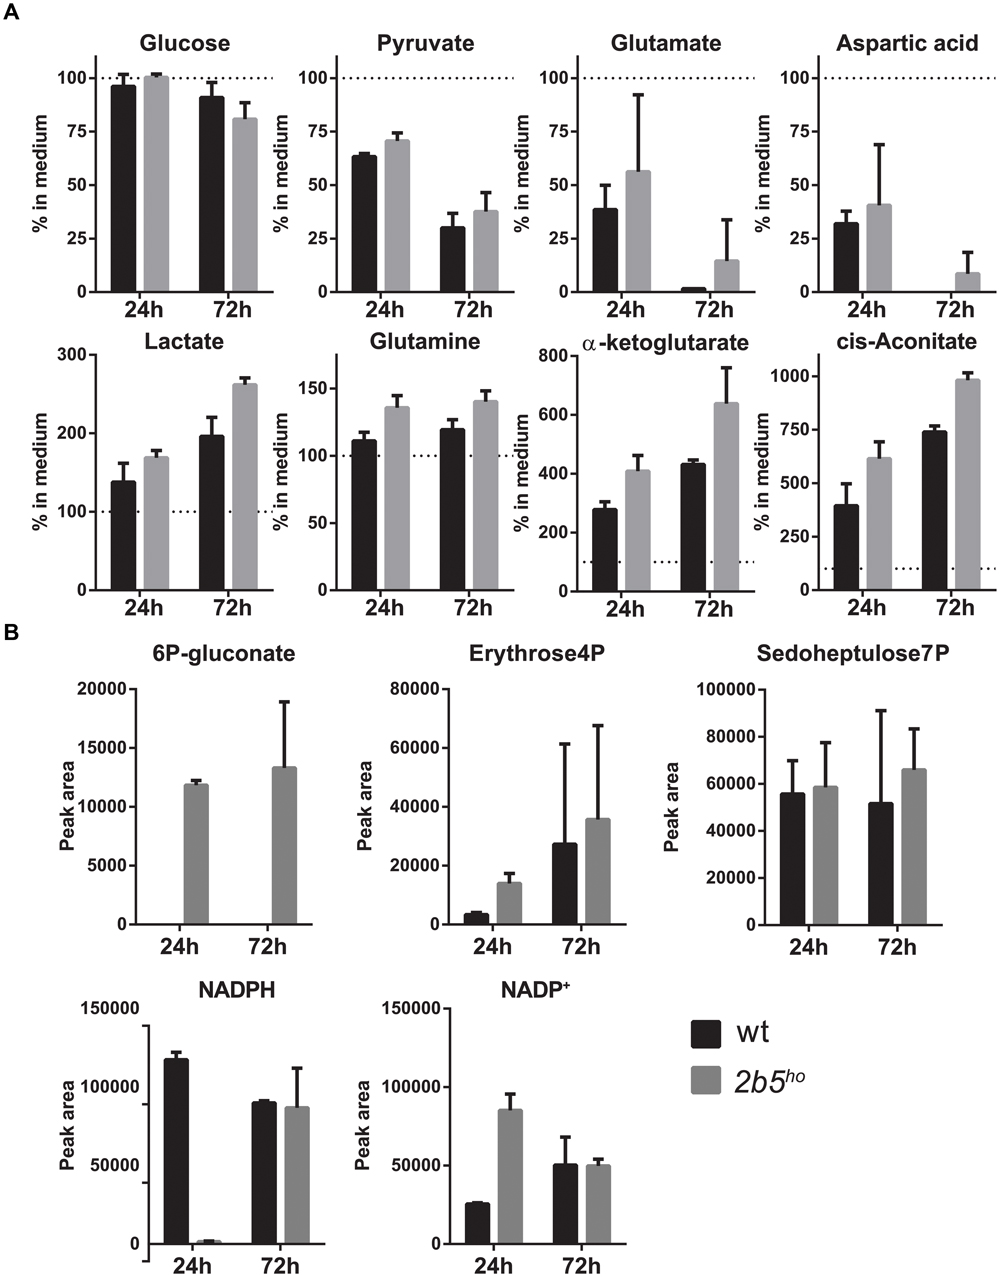
FIGURE 7. Intracellular and extracellular metabolic analysis after 24 and 72 h of culture showed increased levels of intracellular levels of a pentose phosphate pathway intermediate (6P-gluconate). The astrocytes were cultured until 70% confluent. Media of the cultures were replaced with fresh medium. The cells as well as the media were collected after 24 and 72 h. The graphs show the mean ± SD. (A) The metabolite concentrations in the culture media of wt and 2b5ho astrocytes were compared to unconditioned media (n = 2). Glucose levels and pyruvate levels in conditioned medium of wt and 2b5ho astrocytes were decreased as well as glutamate and aspartate levels. Lactate, glutamine, cis-aconitate and α-ketoglutarate were increased in the conditioned medium of both cultures. (B) 6P-gluconate levels were consistently detected in 2b5ho cultures but not in wt cultures (24 and 72 h after replacing the culture medium). Four other metabolites of the pentose phosphate pathway were detected in the metabolic screen (erythrose-4P and sedoheptulose-7P, NADPH and NADP+), but these were not consistently altered between wt and 2b5ho cultures.
Discussion
Here we aimed to identify whether specific proteins are translationally regulated by eIF2B𝜀Arg191His in astrocytes. We used primary astrocyte cultures of the 2b5ho mouse model. Both wt and 2b5ho cells display an astrocyte morphology, synthesize CD44, nestin and vimentin (Supplementary Figure 5 and File 1), supporting astrocyte identity. We first established that cultures of primary astrocytes are suitable for sensitive labeling of newly synthesized proteins. Consistent with previous studies (Howden et al., 2013; Genheden et al., 2015), we found that AHA-labeling did not affect murine astrocyte viability for at least 16 h. No differences in AHA-labeling efficiency were observed between wt and 2b5ho astrocytes. These results confirm that the pulsed AHA-SILAC labeling protocol is suitable to study differences in proteins synthesized in wt and 2b5ho astrocytes, enabling us to investigate whether the Arg191His mutation in eIF2B𝜀 affects translation of specific mRNAs.
We identified 80 proteins that accumulate differentially in wt vs. 2b5ho astrocyte cultures upon a 2 h AHA pulse. The majority (72 out of 80) is upregulated in 2b5ho astrocytes. We investigated the proteomic results by qPCR (11 candidates) and Western blot (4 candidates) (Figure 4). The tested antibodies detecting PROS1 and SLC3A2 showed consistent differences between wt and 2b5ho while TXNIP gave variable results and SCRN1 was not detected. Changes observed at the proteomic level were not due to altered mRNA levels, indicating that differences arose at the translational level. PROS1 and SLC3A2 protein levels were also increased in 2b5ho mouse brain lysates, supporting the findings in astrocyte cultures. Of these, Pros1 was not increased at the mRNA level.
Our analyses indicate significant enrichment for proteins containing a signal peptide and motifs for N-glycosylation and disulfide bond formation in 2b5ho astrocytes (Figure 2B). These motifs highlight involvement of the endoplasmic reticulum (ER), the first organelle of the secretory pathway (Farhan and Rabouille, 2011). Approximately 50% of the eIF2B𝜀Arg191His-regulated proteins were predicted to use the secretory pathway, suggesting an increased flux in 2b5ho astrocytes. The analysis of the secretome after 2 h AHA labeling as well as a standardized secretion assay did not indicate a difference in general secretion between wt and 2b5ho astrocytes. The increased amount of proteins using the secretory pathway observed in the proteomic screen may still indicate a deregulation of ER function. The secreted luciferase reporter used in the standardized secretion assay was not modified in the ER. Protein modifications could be further investigated by expressing a reporter protein that is, e.g., N-glycosylated, actively folded by chaperones and/or subjected to extensive disulfide bond formation in ER and Golgi. However, transfections with such reporter constructs probably do not yield protein levels sufficient to quantify the small differences in these processes. Overexpression of such reporters will overburden the ER and induce an unfolded protein response, compromising ER function, preventing reliable conclusions.
Next we investigated if the mRNAs for eIF2B𝜀Arg191His-regulated proteins contain uORFs as reduced eIF2B activity increases translation of mRNAs with one or more uORFs in the 5′-UTR (Meijer and Thomas, 2002). In silico analyses of the 5′-UTR sequences of the candidates did not reveal obvious overall differences in uORF numbers. Nonetheless, mRNAs with high numbers of uORFs (8 or more) were clearly overrepresented in the group of significantly altered proteins (Figure 5). Thus, when eIF2B activity is reduced, protein synthesis of those mRNAs may be enhanced due to inefficient initiation on inhibitory uORFs, stimulating initiation on the “normal” start codon of the mORF (Meijer and Thomas, 2002). Our analyses highlighted some overrepresentation for mRNAs with (especially) long 5′-UTRs and probably higher ΔG in 2b5ho astrocytes (Figure 5). These length and ΔG observations suggest greater dependence on RNA helicase activity during translation initiation of eIF2B𝜀Arg191His-regulated proteins (Sen et al., 2016). To further characterize the 5′-UTR efficiency in wt and 2b5ho astrocytes, we performed transient transfection assays for several candidates, some of which were longer than 700 nucleotides (Fgfr1 and Nrxn1). Unfortunately, transfection of the Fgfr1 and Nrxn1 constructs did not yield reliable expression, which precluded testing whether they are translated more efficiently in 2b5ho than in wt astrocytes. The transfection assay is not robust enough to detect differences that were picked up with the pulsed AHA-SILAC proteomics and in silico 5′UTR analyses.
PROS1 was shown to be upregulated in both 2b5ho astrocytes and brain without increased mRNA level. In brain, PROS1 is expressed by astrocytes and microglia (Zhang et al., 2014). Interestingly, PROS1 and GAS6 (which was also found to be upregulated) bind the same class of receptors (Hafizi and Dahlback, 2006). PROS1 and GAS6 enhance myelination and support oligodendrocyte survival in mice in vitro and in vivo (Tsiperson et al., 2010; Gruber et al., 2014; Goudarzi et al., 2016; Akkermann et al., 2017). Recently, PROS1 was described to function in neural stem cells (NSCs) as a regulator for NSC quiescence, proliferation and NSC development into neurons or astrocytes (Zelentsova et al., 2016).
Other proteins enriched in the eIF2B𝜀Arg191His-regulated proteome are implicated in astrocyte development. For example NRXN1 (Zeng et al., 2013) and SORCS1, that transports NRXN1, can induce differentiation toward astrocytes (Savas et al., 2015). Moreover TGFβ2 (Park et al., 2012) and its binding partners, ERBIN and latent TGFβ-binding protein 3 (LTBP3) are increased during astrocyte differentiation (Robertson et al., 2015). All these results suggest that 2b5ho astrocytes have a slightly altered differentiation state as shown before in 2b5ho mice and VWM patients (Bugiani et al., 2011; Dooves et al., 2016).
To investigate other functional changes, we compared the metabolomes of wt and 2b5ho cells. We detected glutamate uptake in both cultures, which is a typical function of astrocytes, (Martin-Jimenez et al., 2017). This observation further confirms the astrocytic identity of the cultured cells. The most consistent difference observed was an increase in 6P-gluconate, an intermediate of the PPP. The PPP shunt is an alternative route for the metabolism of glucose which can supply ribose for nucleotide production in the non-oxidative part and NADPH in the oxidative part of the pathway. The reducing equivalents provided by NADPH are used both for biosynthesis and repair of oxidative damage (Stincone et al., 2015). The oxidative intermediate 6P-gluconate was increased in 2b5ho astrocytes while the non-oxidative intermediates sedoheptulose 7-phosphate and erythrose 4-phosphate were not consistent over time. These results suggest an increased activity of the PPP, especially at earlier time points. Interestingly, the observed PPP signature has been found in lung cancer cells in response to reduced 6P-gluconate dehydrogenase (6PGDH) activity leading to reactive oxygen species (ROS) production (Patra and Hay, 2014).
Could there be a link between the two main observations, i.e., the deregulated transport of some proteins in the ER and the increased 6P-gluconate concentrations? We think this is likely; although PPP is cytosolic, there are links to the ER. Part of the pathway appears to be associated with the ER (Stockwell et al., 2012) and NADPH produced by the PPP might be needed to combat ROS formation, which can be produced in the ER by processes related to oxidative protein folding. On the basis of the combined proteomic and metabolomic findings, we hypothesize that 2b5ho astrocytes may accumulate ROS as a result of an increased flux of proteins (e.g., requiring correct disulfide bond formation) through the secretory pathway (Figures 2, 8). Correct disulfide bond formation is dependent on protein disulfide isomerases (PDIs) and Ero1 in the ER (Bechtel and Weerapana, 2017). This process can result in H2O2 as by-product and increased PPP flux might compensate by producing NADPH (Espinosa-Diez et al., 2015). 6P-gluconate is the only metabolite in the metabolic screen that was changed in 2b5ho astrocytes and it is not completely clear whether this reflects increased production or decreased breakdown or a combination of both. There are indications that G6PDH is the only NADPH-producing enzyme activated upon oxidative stress and therefore it has been called “guardian of the cell redox potential” (Filosa et al., 2003). Lack of consistent changes over time in NADPH in 2b5ho astrocytes suggest that the balance between H2O2 and NADPH in steady state is “successfully” compensated (Figure 8). On the basis of our results we cannot discriminate between a compensated system or a deregulated system, the latter leading to pathology (Bechtel and Weerapana, 2017).
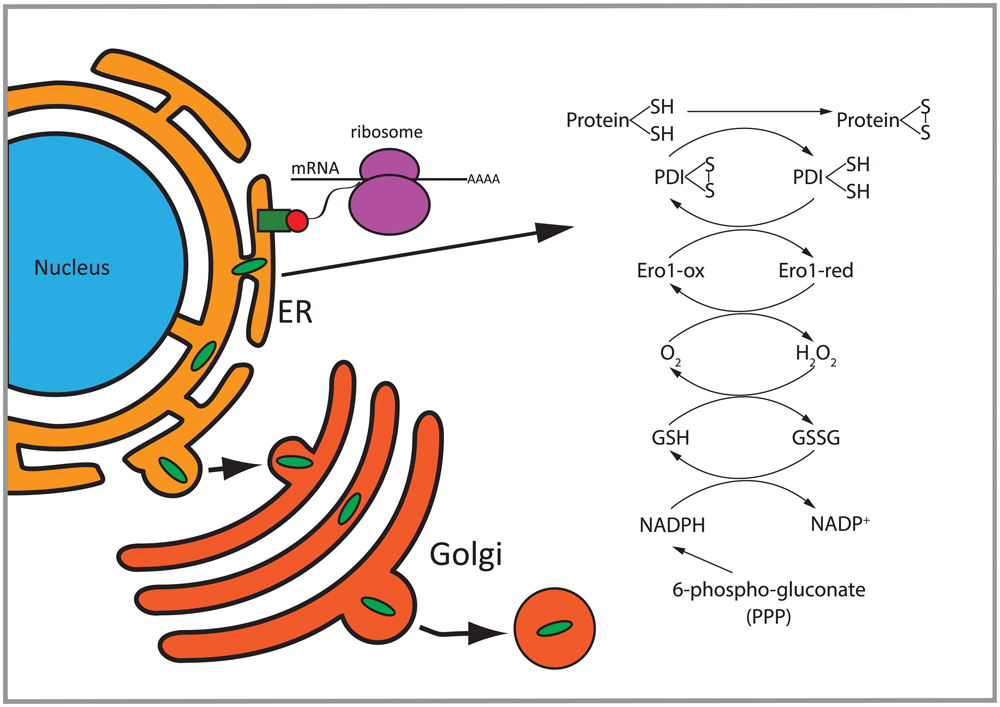
FIGURE 8. Overview of differentially regulated functions in 2b5ho astrocytes. Proteins with a signal peptide or transmembrane domain enter the ER to be folded. Proteins going through the secretory pathway that are subjected to N-glycosylation and disulfide bond formation are enriched in the set of eIF2B𝜀Arg191His-regulated proteins. Disulfide bridge formation through oxidation of these proteins can induce H2O2. 6-Phospho-gluconate is involved in the production of NADPH which can be used to remove H2O2. PDI, protein disulfide isomerase; GSH, reduced glutathione; GSSG, oxidized glutathione; Ero1-ox, oxidized Ero1; Ero1-red, reduced Ero1; PPP, pentose phosphate pathway.
Conclusion
The 80 proteins differentially detected in the AHA-SILAC proteome are most likely translationally regulated as their mRNA levels are similar. Regulation thus must occur via increased synthesis or accumulation in 2b5ho astrocytes. We observed that the function of some of these differentially affected proteins is linked to astrocyte differentiation, which is known to be disturbed in VWM. As we would expect from deregulated protein synthesis in 2b5ho cells, the regulated proteins differ from their non-regulated counterparts in aspects of their 5′-UTRs. Altered synthesis may lead to an increase of proteins in the ER and secretory pathway without an overt effect on overall secretion. Possibly, increased demands of protein folding in the ER may result in generation of H2O2 or other ROS by-products (Espinosa-Diez et al., 2015). Thus, the increased synthesis of proteins that undergo disulfide formation and elevated 6P-gluconate might point to increased ROS in astrocytes, which may affect their function (Figure 8).
Author Contributions
Substantial contributions to the conception or design of the work: LW, RP, CP, MvdK, and TA. The acquisition, analysis: LW, RP, EZ, CvB, TtB, and EP. Interpretation of data for the work: LW, RP, EZ, JK, CP, CB, MA, DS, and TA. Drafting the work or revising it critically for important intellectual content: LW, RP, EZ, CvB, TtB, EP, JK, CP, CB, MA, DS, MvdK, and TA. Final approval of the version to be published: LW, RP, EZ, CvB, TtB, EP, JK, CP, CB, MA, DS, MvdK, and TA. Agreement to be accountable for all aspects of the work in ensuring that questions related to the accuracy or integrity of any part of the work are appropriately investigated and resolved: LW, RP, EZ, CvB, TtB, EP, JK, CP, CB, MA, DS, MvdK, and TA.
Funding
LW, TA, TtB, EP, and MvdK are supported by ZonMw (TOP grant 91211005), Fonds NutsOHRA (1204-032), Hersenstichting Project grant (BGWS2014(1)-04), the Phelps Foundation (grant 2011.040). MA and RP are supported by Netherlands Organization for Scientific Research (NWO) as part of the National Roadmap Large-scale Research Facilities of the Netherlands, Proteins@Work (project number 184.032.201) and a VIDI grant (723.012.102) CB and EZ are supported by VENI grant (project 722.013.009) from the Netherlands Organization for Scientific Research (NWO).
Conflict of Interest Statement
The authors declare that the research was conducted in the absence of any commercial or financial relationships that could be construed as a potential conflict of interest.
Acknowledgments
The authors thank Adri Thomas (University of Utrecht, Netherlands) for critical reading of the manuscript. They thank Anton den Hoed for the writing of the scripts used for the 5′UTR analysis. They thank I. G. Metgod and C. M. T. Beertsen (Department of Clinical Chemistry, VU University Medical Center, Amsterdam, Netherlands) for use of the Wallac 1420 Victor2 Microplate Reader. They thank R. Groen (Department of Hematology, VU University Medical Center, Amsterdam, Netherlands) for use of the GloMax® Discover System. They thank Sander Bobeldijk for facilitating the ΔG calculations.
Supplementary Material
The Supplementary Material for this article can be found online at: https://www.frontiersin.org/articles/10.3389/fncel.2017.00411/full#supplementary-material
Footnotes
- ^ http://unafold.rna.albany.edu//?q=DINAMelt/Quickfold
- ^ http://ron.cimr.cam.ac.uk/protocols/NucCyto.html
References
Akkermann, R., Aprico, A., Perera, A. A., Bujalka, H., Cole, A. E., Xiao, J., et al. (2017). The TAM receptor Tyro3 regulates myelination in the central nervous system. Glia 65, 581–591. doi: 10.1002/glia.23113
Babendure, J. R., Babendure, J. L., Ding, J. H., and Tsien, R. Y. (2006). Control of mammalian translation by mRNA structure near caps. RNA 12, 851–861. doi: 10.1261/rna.2309906
Bechtel, T. J., and Weerapana, E. (2017). From structure to redox: the diverse functional roles of disulfides and implications in disease. Proteomics 17:1600391. doi: 10.1002/pmic.201600391
Bender, A. S., Woodbury, D. M., and White, H. S. (1997). The rapid L- and D-aspartate uptake in cultured astrocytes. Neurochem. Res. 22, 721–726. doi: 10.1023/A:1027358211472
Bendtsen, J. D., Jensen, L. J., Blom, N., Von Heijne, G., and Brunak, S. (2004). Feature-based prediction of non-classical and leaderless protein secretion. Protein Eng. Des. Sel. 17, 349–356. doi: 10.1093/protein/gzh037
Borgese, N. (2016). Getting membrane proteins on and off the shuttle bus between the endoplasmic reticulum and the Golgi complex. J. Cell Sci. 129, 1537–1545. doi: 10.1242/jcs.183335
Bugiani, M., Boor, I., van Kollenburg, B., Postma, N., Polder, E., van Berkel, C., et al. (2011). Defective glial maturation in vanishing white matter disease. J. Neuropathol. Exp. Neurol. 70, 69–82. doi: 10.1097/NEN.0b013e318203ae74
Dieterich, D. C., Link, A. J., Graumann, J., Tirrell, D. A., and Schuman, E. M. (2006). Selective identification of newly synthesized proteins in mammalian cells using bioorthogonal noncanonical amino acid tagging (BONCAT). Proc. Natl. Acad. Sci. U.S.A. 103, 9482–9487. doi: 10.1073/pnas.0601637103
Dooves, S., Bugiani, M., Postma, N. L., Polder, E., Land, N., Horan, S. T., et al. (2016). Astrocytes are central in the pathomechanisms of vanishing white matter. J. Clin. Invest. 126, 1512–1524. doi: 10.1172/JCI83908
Eichelbaum, K., Winter, M., Berriel Diaz, M., Herzig, S., and Krijgsveld, J. (2012). Selective enrichment of newly synthesized proteins for quantitative secretome analysis. Nat. Biotechnol. 30, 984–990. doi: 10.1038/nbt.2356
Espinosa-Diez, C., Miguel, V., Mennerich, D., Kietzmann, T., Sanchez-Perez, P., Cadenas, S., et al. (2015). Antioxidant responses and cellular adjustments to oxidative stress. Redox Biol. 6, 183–197. doi: 10.1016/j.redox.2015.07.008
Farhan, H., and Rabouille, C. (2011). Signalling to and from the secretory pathway. J. Cell Sci. 124(Pt 2), 171–180. doi: 10.1242/jcs.076455
Ferreira, J. P., Overton, K. W., and Wang, C. L. (2013). Tuning gene expression with synthetic upstream open reading frames. Proc. Natl. Acad. Sci. U.S.A. 110, 11284–11289. doi: 10.1073/pnas.1305590110
Filosa, S., Fico, A., Paglialunga, F., Balestrieri, M., Crooke, A., Verde, P., et al. (2003). Failure to increase glucose consumption through the pentose-phosphate pathway results in the death of glucose-6-phosphate dehydrogenase gene-deleted mouse embryonic stem cells subjected to oxidative stress. Biochem. J. 370, 935–943. doi: 10.1042/bj20021614
Fogli, A., Schiffmann, R., Bertini, E., Ughetto, S., Combes, P., Eymard-Pierre, E., et al. (2004). The effect of genotype on the natural history of eIF2B-related leukodystrophies. Neurology 62, 1509–1517. doi: 10.1212/01.WNL.0000123259.67815.DB
Genheden, M., Kenney, J. W., Johnston, H. E., Manousopoulou, A., Garbis, S. D., and Proud, C. G. (2015). BDNF stimulation of protein synthesis in cortical neurons requires the MAP kinase-interacting kinase MNK1. J. Neurosci. 35, 972–984. doi: 10.1523/JNEUROSCI.2641-14.2015
Goudarzi, S., Rivera, A., Butt, A. M., and Hafizi, S. (2016). Gas6 promotes oligodendrogenesis and myelination in the adult central nervous system and after lysolecithin-induced demyelination. ASN Neuro 8:1759091416668430. doi: 10.1177/1759091416668430
Gruber, R. C., Ray, A. K., Johndrow, C. T., Guzik, H., Burek, D., de Frutos, P. G., et al. (2014). Targeted GAS6 delivery to the CNS protects axons from damage during experimental autoimmune encephalomyelitis. J. Neurosci. 34, 16320–16335. doi: 10.1523/JNEUROSCI.2449-14.2014
Hafizi, S., and Dahlback, B. (2006). Gas6 and protein S. Vitamin K-dependent ligands for the Axl receptor tyrosine kinase subfamily. FEBS J. 273, 5231–5244. doi: 10.1111/j.1742-4658.2006.05529.x
Hinnebusch, A. G. (2011). Molecular mechanism of scanning and start codon selection in eukaryotes. Microbiol. Mol. Biol. Rev. 75, 434–467. doi: 10.1128/MMBR.00008-11
Hinnebusch, A. G., Ivanov, I. P., and Sonenberg, N. (2016). Translational control by 5′-untranslated regions of eukaryotic mRNAs. Science 352, 1413–1416. doi: 10.1126/science.aad9868
Horzinski, L., Huyghe, A., Cardoso, M. C., Gonthier, C., Ouchchane, L., Schiffmann, R., et al. (2009). Eukaryotic initiation factor 2B (eIF2B) GEF activity as a diagnostic tool for EIF2B-related disorders. PLOS ONE 4:e8318. doi: 10.1371/journal.pone.0008318
Howden, A. J., Geoghegan, V., Katsch, K., Efstathiou, G., Bhushan, B., Boutureira, O., et al. (2013). QuaNCAT: quantitating proteome dynamics in primary cells. Nat. Methods 10, 343–346. doi: 10.1038/nmeth.2401
Huang, D. W., Sherman, B. T., and Lempicki, R. A. (2009a). Bioinformatics enrichment tools: paths toward the comprehensive functional analysis of large gene lists. Nucleic Acids Res. 37, 1–13. doi: 10.1093/nar/gkn923
Huang, D. W., Sherman, B. T., and Lempicki, R. A. (2009b). Systematic and integrative analysis of large gene lists using DAVID bioinformatics resources. Nat. Protoc. 4, 44–57. doi: 10.1038/nprot.2008.211
Ingolia, N. T., Lareau, L. F., and Weissman, J. S. (2011). Ribosome profiling of mouse embryonic stem cells reveals the complexity and dynamics of mammalian proteomes. Cell 147, 789–802. doi: 10.1016/j.cell.2011.10.002
Kenney, J. W., Genheden, M., Moon, K. M., Wang, X., Foster, L. J., and Proud, C. G. (2016). Eukaryotic elongation factor 2 kinase regulates the synthesis of microtubule-related proteins in neurons. J. Neurochem. 136, 276–284. doi: 10.1111/jnc.13407
Kleijn, M., Scheper, G. C., Voorma, H. O., and Thomas, A. A. (1998). Regulation of translation initiation factors by signal transduction. Eur. J. Biochem. 253, 531–544. doi: 10.1046/j.1432-1327.1998.2530531.x
Konieczny, A., and Safer, B. (1983). Purification of the eukaryotic initiation factor 2-eukaryotic initiation factor 2B complex and characterization of its guanine nucleotide exchange activity during protein synthesis initiation. J. Biol. Chem. 258, 3402–3408.
Kozak, M. (1987). At least six nucleotides preceding the AUG initiator codon enhance translation in mammalian cells. J. Mol. Biol. 196, 947–950. doi: 10.1016/0022-2836(87)90418-9
Ladner, C. L., Yang, J., Turner, R. J., and Edwards, R. A. (2004). Visible fluorescent detection of proteins in polyacrylamide gels without staining. Anal. Biochem. 326, 13–20. doi: 10.1016/j.ab.2003.10.047
Leegwater, P. A., Vermeulen, G., Konst, A. A., Naidu, S., Mulders, J., Visser, A., et al. (2001). Subunits of the translation initiation factor eIF2B are mutant in leukoencephalopathy with vanishing white matter. Nat. Genet. 29, 383–388. doi: 10.1038/ng764
Li, W., Wang, X., Van Der Knaap, M. S., and Proud, C. G. (2004). Mutations linked to leukoencephalopathy with vanishing white matter impair the function of the eukaryotic initiation factor 2B complex in diverse ways. Mol. Cell. Biol. 24, 3295–3306. doi: 10.1128/MCB.24.8.3295-3306.2004
Liu, R., van der Lei, H. D., Wang, X., Wortham, N. C., Tang, H., van Berkel, C. G., et al. (2011). Severity of vanishing white matter disease does not correlate with deficits in eIF2B activity or the integrity of eIF2B complexes. Hum. Mutat. 32, 1036–1045. doi: 10.1002/humu.21535
Martin-Jimenez, C. A., Salazar-Barreto, D., Barreto, G. E., and Gonzalez, J. (2017). Genome-scale reconstruction of the human astrocyte metabolic network. Front. Aging Neurosci. 9:23. doi: 10.3389/fnagi.2017.00023
Meijer, H. A., and Thomas, A. A. (2002). Control of eukaryotic protein synthesis by upstream open reading frames in the 5’-untranslated region of an mRNA. Biochem. J. 367(Pt 1), 1–11. doi: 10.1042/bj20011706
Noderer, W. L., Flockhart, R. J., Bhaduri, A., Diaz de Arce, A. J., Zhang, J., Khavari, P. A., et al. (2014). Quantitative analysis of mammalian translation initiation sites by FACS-seq. Mol. Syst. Biol. 10:748. doi: 10.15252/msb.20145136
Park, J. H., Choi, M. R., Park, K. S., Kim, S. H., Jung, K. H., and Chai, Y. G. (2012). The characterization of gene expression during mouse neural stem cell differentiation in vitro. Neurosci. Lett. 506, 50–54. doi: 10.1016/j.neulet.2011.10.046
Patra, K. C., and Hay, N. (2014). The pentose phosphate pathway and cancer. Trends Biochem. Sci. 39, 347–354. doi: 10.1016/j.tibs.2014.06.005
Petersen, T. N., Brunak, S., von Heijne, G., and Nielsen, H. (2011). SignalP 4.0: discriminating signal peptides from transmembrane regions. Nat. Methods 8, 785–786. doi: 10.1038/nmeth.1701
Proud, C. G. (2001). Regulation of eukaryotic initiation factor eIF2B. Prog. Mol. Subcell. Biol. 26, 95–114. doi: 10.1007/978-3-642-56688-2_4
Robertson, I. B., Horiguchi, M., Zilberberg, L., Dabovic, B., Hadjiolova, K., and Rifkin, D. B. (2015). Latent TGF-beta-binding proteins. Matrix Biol. 47, 44–53. doi: 10.1016/j.matbio.2015.05.005
Ruijter, J. M., Thygesen, H. H., Schoneveld, O. J., Das, A. T., Berkhout, B., and Lamers, W. H. (2006). Factor correction as a tool to eliminate between-session variation in replicate experiments: application to molecular biology and retrovirology. Retrovirology 3:2. doi: 10.1186/1742-4690-3-2
Savas, J. N., Ribeiro, L. F., Wierda, K. D., Wright, R., DeNardo-Wilke, L. A., Rice, H. C., et al. (2015). The sorting receptor SorCS1 regulates trafficking of neurexin and AMPA receptors. Neuron 87, 764–780. doi: 10.1016/j.neuron.2015.08.007
Sen, N. D., Zhou, F., Harris, M. S., Ingolia, N. T., and Hinnebusch, A. G. (2016). eIF4B stimulates translation of long mRNAs with structured 5’ UTRs and low closed-loop potential but weak dependence on eIF4G. Proc. Natl. Acad. Sci. U.S.A. 113, 10464–10472. doi: 10.1073/pnas.1612398113
Sonenberg, N., and Hinnebusch, A. G. (2009). Regulation of translation initiation in eukaryotes: mechanisms and biological targets. Cell 136, 731–745. doi: 10.1016/j.cell.2009.01.042
Stincone, A., Prigione, A., Cramer, T., Wamelink, M. M., Campbell, K., Cheung, E., et al. (2015). The return of metabolism: biochemistry and physiology of the pentose phosphate pathway. Biol. Rev. Camb. Philos. Soc. 90, 927–963. doi: 10.1111/brv.12140
Stockwell, S. R., Platt, G., Barrie, S. E., Zoumpoulidou, G., Te Poele, R. H., Aherne, G. W., et al. (2012). Mechanism-based screen for G1/S checkpoint activators identifies a selective activator of EIF2AK3/PERK signalling. PLOS ONE 7:e28568. doi: 10.1371/journal.pone.0028568
Tsiperson, V., Li, X., Schwartz, G. J., Raine, C. S., and Shafit-Zagardo, B. (2010). GAS6 enhances repair following cuprizone-induced demyelination. PLOS ONE 5:e15748. doi: 10.1371/journal.pone.0015748
van der Knaap, M. S., Breiter, S. N., Naidu, S., Hart, A. A., and Valk, J. (1999). Defining and categorizing leukoencephalopathies of unknown origin: MR imaging approach. Radiology 213, 121–133. doi: 10.1148/radiology.213.1.r99se01121
van der Knaap, M. S., Leegwater, P. A., Konst, A. A., Visser, A., Naidu, S., Oudejans, C. B., et al. (2002). Mutations in each of the five subunits of translation initiation factor eIF2B can cause leukoencephalopathy with vanishing white matter. Ann. Neurol. 51, 264–270. doi: 10.1002/ana.10112
van der Knaap, M. S., Pronk, J. C., and Scheper, G. C. (2006). Vanishing white matter disease. Lancet Neurol. 5, 413–423. doi: 10.1016/S1474-4422(06)70440-9
van Kollenburg, B., Thomas, A. A., Vermeulen, G., Bertrand, G. A., van Berkel, C. G., Pronk, J. C., et al. (2006). Regulation of protein synthesis in lymphoblasts from vanishing white matter patients. Neurobiol. Dis. 21, 496–504. doi: 10.1016/j.nbd.2005.08.009
Voorma, H. O., Thomas, A. A., and Van Heugten, H. A. (1994). Initiation of protein synthesis in eukaryotes. Mol. Biol. Rep. 19, 139–145. doi: 10.1007/BF00986956
Wong, K., Armstrong, R. C., Gyure, K. A., Morrison, A. L., Rodriguez, D., Matalon, R., et al. (2000). Foamy cells with oligodendroglial phenotype in childhood ataxia with diffuse central nervous system hypomyelination syndrome. Acta Neuropathol. 100, 635–646. doi: 10.1007/s004010000234
Zelentsova, K., Talmi, Z., Abboud-Jarrous, G., Sapir, T., Capucha, T., Nassar, M., et al. (2016). Protein S regulates neural stem cell quiescence and neurogenesis. Stem Cells 35, 679–693. doi: 10.1002/stem.2522
Zeng, L., Zhang, P., Shi, L., Yamamoto, V., Lu, W., and Wang, K. (2013). Functional impacts of NRXN1 knockdown on neurodevelopment in stem cell models. PLOS ONE 8:e59685. doi: 10.1371/journal.pone.0059685
Keywords: vanishing white matter, eIF2B, AHA, SILAC, astrocytes, metabolomics, endoplasmic reticulum
Citation: Wisse LE, Penning R, Zaal EA, van Berkel CGM, ter Braak TJ, Polder E, Kenney JW, Proud CG, Berkers CR, Altelaar MAF, Speijer D, van der Knaap MS and Abbink TEM (2017) Proteomic and Metabolomic Analyses of Vanishing White Matter Mouse Astrocytes Reveal Deregulation of ER Functions. Front. Cell. Neurosci. 11:411. doi: 10.3389/fncel.2017.00411
Received: 11 September 2017; Accepted: 07 December 2017;
Published: 20 December 2017.
Edited by:
Margaret Su-Chun Ho, ShanghaiTech University, ChinaReviewed by:
Johannes Hirrlinger, Leipzig University, GermanyJinchong Xu, Johns Hopkins University, United States
Copyright © 2017 Wisse, Penning, Zaal, van Berkel, ter Braak, Polder, Kenney, Proud, Berkers, Altelaar, Speijer, van der Knaap and Abbink. This is an open-access article distributed under the terms of the Creative Commons Attribution License (CC BY). The use, distribution or reproduction in other forums is permitted, provided the original author(s) or licensor are credited and that the original publication in this journal is cited, in accordance with accepted academic practice. No use, distribution or reproduction is permitted which does not comply with these terms.
*Correspondence: Truus E. M. Abbink, g.abbink@vumc.nl
†Present address: Justin W. Kenney, The Hospital for Sick Children, Toronto, ON, Canada; Christopher G. Proud, South Australian Health and Medical Research Institute, School of Biological Sciences, University of Adelaide, Adelaide, SA, Australia
‡These authors have contributed equally to this work.