Mapping functional connectivity between neuronal ensembles with larval zebrafish transgenic for a ratiometric calcium indicator
- 1 Center for Bioinformatics, National Laboratory of Protein Engineering and Plant Genetic Engineering, College of Life Sciences, Peking University, Beijing, China
- 2 Department of Cellular Biology, University of Georgia, Athens, GA, USA
- 3 Department of Mathematics and Faculty of Engineering, University of Georgia, Athens, GA, USA
The ability to map functional connectivity is necessary for the study of the flow of activity in neuronal circuits. Optical imaging of calcium indicators, including FRET-based genetically encoded indicators and extrinsic dyes, is an important adjunct to electrophysiology and is widely used to visualize neuronal activity. However, techniques for mapping functional connectivities with calcium imaging data have been lacking. We present a procedure to compute reduced functional couplings between neuronal ensembles undergoing seizure activity from ratiometric calcium imaging data in three steps: (1) calculation of calcium concentrations and neuronal firing rates from ratiometric data; (2) identification of putative neuronal populations from spatio-temporal time-series of neural bursting activity; and then, (3) derivation of reduced connectivity matrices that represent neuronal population interactions. We apply our method to the larval zebrafish central nervous system undergoing chemoconvulsant-induced seizures. These seizures generate propagating, central nervous system-wide neural activity from which population connectivities may be calculated. This automatic functional connectivity mapping procedure provides a practical and user-independent means for summarizing the flow of activity between neuronal ensembles.
Introduction
A fundamental problem in neuroscience is to understand how information flows through pathways in the central nervous system (CNS). The control of this process is thought to be the basis of cognition, and irregularities are thought to be at the core of many mental disorders, substance abuse, and seizures. Functional connectivity, an important component of this problem, has been studied at the cognitive level using fMRI (Logothetis, 2003; Zhou et al., 2009), MEG (Owen et al., 2009; Stam, 2009; Babajani-Feremi and Soltanian-Zadeh, 2010), and EEG (Cantero et al., 2009; Carbonell et al., 2009; de Haan et al., 2009), and at the microcircuit level using multi-electrode arrays (Chiu and Weliky, 2002; Pillow et al., 2008; Ye et al., 2008; Field et al., 2010) and optical imaging techniques (Cacciatore et al., 1999; Taylor et al., 2003). While these approaches have yielded important insights into brain function, they have typically either addressed global pathways or microcircuitry without linking the two together. The translucent zebrafish larva represents an opportunity to create functional connectivity maps of an entire vertebrate nervous system in vivo using optical imaging.
Our long-term goal is to map out the functional connectivity of a vertebrate brain with cellular resolution using optical methods. Our working hypothesis is that mapping neural activity in a relatively simple vertebrate brain will provide insight into the mechanisms that direct the flow of neural information. This manuscript describes methodology that may be used to understand the mechanisms responsible for the propagation of seizure-related neural bursting activity in the larval zebrafish transgenic for the ratiometric cameleon Ca2+ indicator (Higashijima et al., 2003) or other preparations transgenic for ratiometric Ca2+ indicators (Garaschuk et al., 2007; Mank et al., 2008).
Even with a relatively simple vertebrate such as the larval zebrafish, it would be daunting to attempt to map the full repertoire of information regulation mechanisms. Therefore, as a first step we simplified the problem by studying neural pathways dominated by large-scale coherent bursting activity induced by chemoconvulsants. It has been shown that the 7-days-post-fertilization (dpf) larval zebrafish exhibits epileptiform-like electrographic activity in response to bath application of the chemoconvulsant PTZ, a GABAA antagonist (Baraban, 2005, 2007; Baraban et al., 2005, 2007). In addition, we have recently shown that PTZ induces Ca2+ activity that can take the form of waves that propagate through the CNS.
From a network perspective, during a burst, a large population of neurons acts in concert. This means that, analytically, the coherent activity of many underlying neurons may be combined and treated as a small set of population variables, which simplifies the problem of studying bursting activity propagation. Thus, to compare the reduction of dimension achieved by studying (1) a neural subsystem with (2) the CNS undergoing bursting activity we note that in the neural subsystem, activity flows between a small set of neurons communicating via synapses, but in a CNS destabilized to bursting, the activity flows between a small set of neuronal populations via the ensemble of their synapses, which we denote as their reduced connectivity.
Thus, the number of variables in our problem is reduced from the huge number of individual neurons to the much smaller number of independently acting neuronal populations that are involved in bursting activity. In this context, the details of synaptic connectivity are subsumed in the reduced connectivity of the neuronal populations. Thus, while we cannot directly measure changes in synaptic connectivity between individual neurons in the seizing larval zebrafish, we can measure changes in the reduced connectivity and draw conclusions about how neuronal populations interact.
The immediate purpose of the methodology that we present here is to provide a way to identify putative neuronal populations and to visualize reduced connectivities both at the abstract population and the neuronal level. Our algorithm consists of first estimating firing rates from ratiometric imaging data, reducing the data’s dimension (i.e., filtering the data with a set of empirically determined spatial functions), then inferring reduced connectivities in the dimensionally reduced space. This allows us to visualize, either for a given neural population or a given pixel, which other populations or pixels influence its activity and which other pixels are influenced by it. We are also able to visualize dynamical modes of activity that are represented in the data. These are crucial pieces of information both for the experimentalist and the theorist, and may be used as the basis for the identification of mechanisms involved in the processing of neural activity, network modeling, and simulation efforts.
We have applied our method to the estimation of reduced connectivities from waves of neural activity in chemoconvulsant-induced seizures in larval zebrafish. For this reason, there are limits on what we can conclude from the particular dataset that we analyze here: (1) Only a single optical plane is imaged. Actual connectivities could only be inferred if the entire network were imaged. Complete optical sectioning would be required to image the entire network (or at least a much more complete sample of neurons). Furthermore, complete optical sectioning requires imaging of a larval zebrafish (since the adult brain cannot be completely imaged due to its opacity); (2) We use a linear model to infer connectivities. This may be reasonable for the widespread excitatory activity of a seizure, but not for a normally functioning nervous system; (3) The seizure-related activity that we image has a higher signal-to-noise ratio (SNR) than would be expected due to normal activity (since much more calcium is expected to be produced in this case). In order to apply our analysis framework (presumably with a non-linear neuronal model) to normal neuronal physiology, we would need higher SNRs. (4) Because of the assumptions in our model, linearity of neural activity and calcium release solely due to action potentials (see Materials and Methods), the term “firing rate” should perhaps be replaced by the weaker term “field potential.” That being said, points (1) and (3) are technical limitations and there is hope of overcoming them (although we would still be limited to imaging zebrafish early in development), and theoretical progress has been made on point (2) (Pillow et al., 2008; Vogelstein et al., 2009, 2010; Tao and Sornborger, 2010). Finally, we have used the term “firing rate” because it makes sense given our modeling framework, but caution the reader to remember the assumptions used in our model.
Materials and Methods
Zebrafish Strains and Maintenance
Larvae transgenic for the YC2.1 cameleon Ca2+ indicator (Higashijima et al., 2003) were obtained from adult zebrafish (Danio rerio) maintained in the University of Georgia Zebrafish Facility following standard procedures (Westerfield, 2000). The line of zebrafish transgenic for cameleon was originally obtained from Dr. Joe Fetcho (Cornell University, NY, USA). Embryos and larvae were reared as previously described (Westerfield, 2000) and staged by hours post-fertilization (hpf) at 28°C and by standard staging criteria (Kimmel et al., 1995). All experiments were performed in accordance with National Institutes of Health guidelines under protocols approved by the University of Georgia Animal Care and Use Committee.
Confocal Microscopy
Larvae were mounted in 1% agar and imaged in either a Dvorak–Stotler chamber (Lucas-Highland, Chantilly, VA, USA) or an imaging chamber (ALA Scientific Instruments, Inc., MS-CPC). Larvae were exposed to a bath of 4.4 mM (+)-Tubocurarine chloride hydrate (Sigma, cat. # T2379) for 8–10 min prior to mounting. This exposure resulted in paralysis lasting up to 4 h. Confocal microscopy was performed on a Leica TCS SP5 confocal microscope (Leica DMI 6000 B, Leica Microsystems Inc.). Cameleon YC2.1 fluorescence was excited with the 458-nm line of a 100-mW argon laser. Emission was imaged at 485 ± 20 nm (cyan) and 535 ± 15 nm (yellow). From the beginning of each experiment, 15 mM PTZ (Sigma, cat. # P6500) was continuously perfused through the chamber at a rate of 8.3 μl/s. Laser intensity was set such that fewer than 1% of pixels reached saturation. 8-bit images were collected at a rate of 1 Hz at a scale of 256 × 256 pixels, converted to raw data and binned to 128 × 128 using ImageJ (Rasband, W.S., ImageJ, U. S. National Institutes of Health, Bethesda, MD, USA, http://rsb.info.nih.gov/ij/, 1997 2009).
Data Analysis
Our analysis algorithm was implemented using the following steps: (1) We performed a statistical optimization for the analysis of ratiometric signals (SOARS) analysis on the ratiometric imaging data. This provided us with a low-noise estimate of the ratio. (2) We calculated estimates of intracellular Ca2+ concentrations from the ratio, then (3) calculated estimates of neuronal firing rates from Ca2+ concentrations. We calculated (4) a singular value decomposition (SVD) of the neuronal firing rates. This was used to (5) form an efficient (fast) non-negative matrix factorization (NMF) of the firing rates. Then (6) using either the non-negative factors or the singular eigenvectors, we calculated a least-squares estimate of the reduced connectivity matrix. Finally (7) we visualized incoming and outgoing connectivities in the pixel space (i.e., as an image) and (8) we visualized eigenvectors of the reduced connectivity matrix in the pixel space.
Statistical Optimization for the Analysis of Ratiometric Signals
The SOARS algorithm has been described elsewhere and a MATLAB implementation is available upon request. For input to SOARS, two imaging datasets are required. For the cameleon FRET indicator, we excited at 458 nm (cyan fluorescent protein, CFP) and imaged emission at 485 and 535 nm (yellow fluorescent protein, YFP). The method consists of the following computations resulting in a denoised ratio: First, pixel time-courses for both CFP and YFP datasets were standardized by subtracting the time-course’s mean, then normalizing by its SD. The standardized time-courses were then subtracted from each other. An SVD was then performed on the resulting dataset and statistically significant eigenvectors were detected. Statistical significance was determined according to the distribution of the time-courses of the singular eigenvectors (i.e., the right eigenvectors). If the distribution was Gaussian (null hypothesis), the eigenvector was rejected, if non-Gaussian, it was retained. Gaussianity was determined with a Lilliefors test. Finally, the statistically significant eigenvectors and their projections in the YFP and CFP datasets were used to reconstruct a denoised estimate of the YFP/CFP ratio (Broder et al., 2007; Fan et al., 2007; Sornborger et al., 2008; Xu et al., 2008).
Calcium Concentrations
Based on previously published data (Miyawaki et al., 1999), a good approximation for the relationship between the YFP/CFP ratio, R(t), and the Ca2+ concentration, c(t), is
We used this expression to determine Ca2+ concentrations for all pixels in the SOARS denoised ratio.
Firing Rates
Assuming that firing rates were approximately constant during the time between frames, and that all intracellular Ca2+ release was due to action potentials, we deconvolved the Ca2+ concentration, c(t) (see Supplementary Material for a detailed calculation) to calculate the firing rate, m(t), with the expression
The time constant, τ, was set to 1.75 s (Yaksi and Friedrich, 2006). Since the calcium release per action potential α is small (∼250 nM; Hires et al., 2008), this expression may be expanded as
Therefore, we report a rescaled firing rate m←αm in arbitrary units.
SVD of Firing Rates
One might expect the firing rates to be of the same low dimension as the ratio that was calculated with the SOARS method; however, the data dimension can change due to the non-linearity of the transformations performed on the ratio data. Therefore, we performed an SVD on the firing rates, M = USVT, to determine the number of statistically significant dimensions. Here, the firing rates m(t) are represented as a matrix, M. Thus, M was a P × T matrix, where P = 128 × 128 = 16384 and T = 3600. The statistically significant number of dimensions making up the ratio was typically from 40 to 50 and the dimension of the firing rate data was usually only slightly higher, from 50 to 60. Thus, the SVD was a product of U, a 16384 × n matrix, S, an n × n matrix, and VT, an n × 3600 matrix, where n was typically in the range of 50 to 60. This allowed us to calculate the NMF and correlation matrices quickly.
Non-Negative Matrix Factorization
In cases where we were interested in dynamics at the population level (Figures 4 and 5), we used NMF, an unsupervised, parts-based data decomposition/dimensional reduction technique that has been used in image processing and pattern recognition (Lee and Seung, 1999, 2001), in computational biology (Brunet et al., 2004), and many other fields of interest (see, for instance, Devarajan, 2008). Donoho and Stodden (2004) showed that, for a fairly general class of image libraries, NMF did indeed find a parts-based, local decomposition.
Furthermore, by definition, an NMF of the firing rate data had the property that the factors into which the data were decomposed were all non-negative and had non-negative time-courses. This choice was important from the following point of view: The physiologically relevant interaction between neurons is synaptic excitation and inhibition. If the factors into which the data were decomposed can be both positive and negative (as they may be in the SVD or independent component analysis; ICA) then excitatory or inhibitory coupling between populations can be difficult to assess. However, when all of the factors are positive and represent a positive contribution to firing rates, then couplings between the factors may be interpreted as being excitatory when they are positive and inhibitory when they are negative. Thus, to identify putative neuronal populations from the dimensionally reduced firing rate data, we performed an NMF on the firing rate data, M = : WH, where W and H were non-negative matrices and had dimensions P × n and n × T, respectively. The NMF was calculated by iterating the update rules (Lee and Seung, 1999, 2001):
where Wk and Hk are the W and H matrices at the kth iteration.
Reduced Connectivity Matrix
We used a linear model to relate firing rates at time t with firing rates at time t + Δt; i.e., we assumed that the firing rates were related by m(t + Δt) = Km(t). This equation could be written in matrix form as M′ = KM, where M′ denoted the firing rate matrix shifted by one time-step.
To calculate a least-squares estimate, Keff, of the connectivity matrix, K, we first projected the firing rate data into a low-dimensional space (i.e., filtered the data) by using either an SVD or an NMF of M. In the SVD basis, this resulted in the relation  where X = SVT was a reduced firing rate matrix in the SVD basis and X′ denoted the same matrix shifted by one time-step. In the NMF basis, this resulted in the relation
  where H′ is, similarly, H shifted by one time-step. The connectivity matrix resulting from this calculation is effectively an “average” connectivity in that it is determined by fitting to the entire dataset. For this reason, it would also provide useful spatial information relating to connectivity even for data generated by non-linearly acting neuronal populations. Similarly, reduced connectivity matrices could be calculated for calcium concentrations (instead of firing rates). However, couplings are more likely to be physiologically relevant when calculated from firing rate data. Note that, for typical experiments, the full 16384 × 16384 coupling matrix, K, was too big to be determined directly without dimensional reduction.
Incoming and Outgoing Connectivities
Both of the full reduced connectivity matrices,  were approximated by projecting back from the reduced space to the pixel space with the relations
  (for the SVD) or
  (for the NMF). Since visualizing these huge reduced connectivity matrices in the pixel basis was intractable, we visualized incoming and outgoing connectivities for individual pixels (putative neurons or groups of neurons), we rearranged either the rows (incoming connectivities), or columns (outgoing connectivities) of Keff as 128 × 128 arrays and inspected them as images.
Eigenvectors of the Reduced Connectivity Matrix
The eigenvectors, ν, of the connectivity matrix were visualized by projecting θ, the eigenvectors of Keff, back to the pixel space with the relations ν ≈ Uθ (SVD) and ν ≈ Wθ (NMF). The approximate eigenvectors were then visualized rearranged in 128 × 128 arrays and inspected as images.
Results
Imaging Widespread Coherent Neural Activity in Larval Zebrafish
Widespread coherent neural activity in the form of large-scale Ca2+ waves was induced in the larval zebrafish CNS with the chemoconvulsant PTZ, which has previously been shown to induce electrophysiological correlates of seizures (unpublished data; see Baraban, 2005, 2007; Baraban et al., 2005, 2007). The results presented below are an analysis of a single, representative ratiometric Ca2+ imaging dataset out of approximately 24 datasets that we have analyzed. A live, 7 dpf larval zebrafish transgenic for cameleon YC2.1 was paralyzed with curare, mounted laterally and imaged using a 10× objective such that the focal plane contained the CNS from the spinal cord to the forebrain (Figure 1A). The cameleon Ca2+ indicator was imaged in CFP (465–505 nm) and YFP (524–598 nm) bands (Figure 1A). One hour of ratiometric Ca2+ imaging data was taken with a confocal microscope at a rate of 1 Hz.
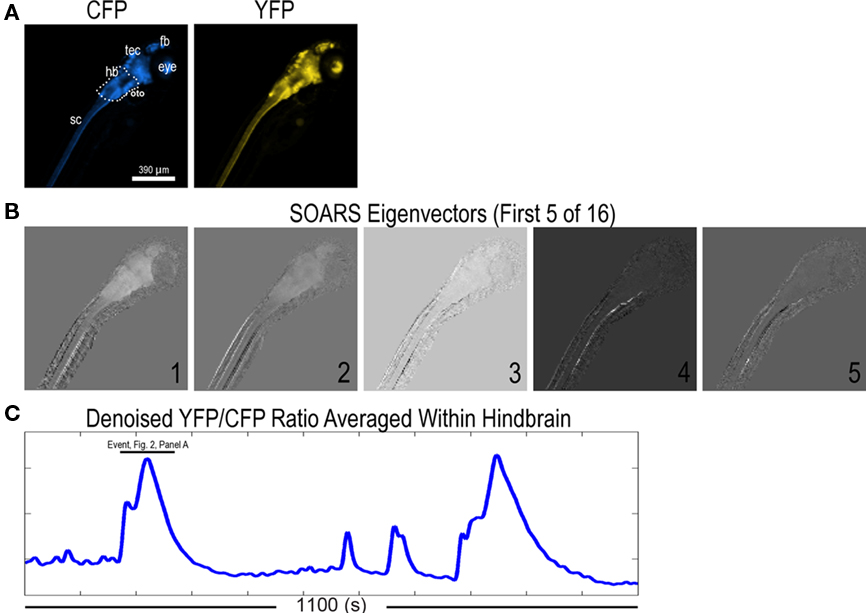
Figure 1. Ratiometric imaging data of Ca2+ wave events in 7 dpf HuC::cameleon transgenic zebrafish upon exposure to the chemoconvulsant, PTZ. (A) CFP and YFP images from an imaging dataset. The larva is mounted such that the spinal cord is in the lower left and the brain is in the upper right of this and all subsequent panels. (sc: spinal cord, hb: hindbrain, tec: tectum, fb: forebrain). (B) Intermediate results from a SOARS analysis (Broder et al., 2007). These eigenvectors depict part of the covarying ratiometric signal that SOARS detected in this dataset. (C) The averaged, denoised ratio in a region of interest (ROI) drawn about the hindbrain [hb, see (A)]. Four Ca2+ events (two of large amplitude and two of smaller amplitude) are shown in this 1100 s trace.
In Figure 1B, we show the first five (of 16) statistically significant SOARS eigenvectors for this dataset. These eigenvectors depict the dominant ratiometric signal in the dataset and were used to construct a movie of the denoised ratio that was used for our firing rate estimates (see below). Under the experimental conditions above, the denoised ratio gave evidence of Ca2+ activity (Figure 1C).
The Ca2+ activity in the dataset analyzed in this paper took the form of six large waves and other low amplitude activity that propagated throughout the CNS (Figure 2A). Comparison of different Ca2+ events revealed a variety of propagation patterns (Figure 2B). This suggested that there were multiple pathways for the propagation of coherent neural activity.
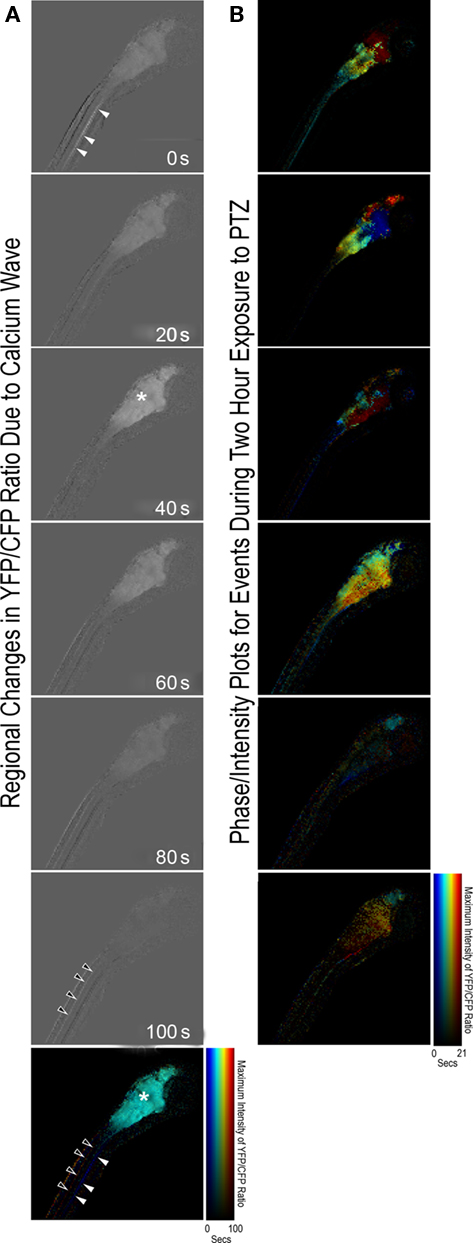
Figure 2. (A) Frames from a movie of the evolution of the first large (100 s) event in Figure 1C (see bar drawn over the event in Figure 1C for precise timing). Light (dark) pixels indicate Ca2+ concentrations above (below) baseline. We visualized a wave by depicting the time that a given pixel reached its maximum with color and the amplitude of the maximum with intensity (a phase/intensity plot). The correspondence between times and amplitudes with color and intensity (resp.) is shown in the colorbar. Note that the event in (A) is a wave beginning in the axonal tracts in the presumptive lateral funiculus (blue arrowhead) in the spinal cord, traveling to the presumptive eminentia granularis and other locations in the hindbrain and tectum (cyan arrowhead), then back to a different set of axonal tracts in the spinal cord (red arrowhead). (B) Phase-intensity plots of six other Ca2+ wave events that occurred during the 1-h imaging experiment. Note the variety of propagation patterns. Lower right scale-bar refers to all phase-intensity plots in column (B).
Estimating Firing Rates from Ratiometric Imaging Data
We estimated firing rates in two steps: First, quantitative intracellular Ca2+ concentration estimates were calculated for each pixel of the SOARS estimated ratio. The Kd used for these estimates (Kd = 10−6.5) was taken from published measurements of the cameleon YC2.1 Ca2+ indicator (Miyawaki et al., 1999). Second, Ca2+ concentrations were deconvolved to determine average firing rates for neurons within each pixel area (20 μm2, or of the order of 10 neurons). The Ca2+ decay constant was taken to be 1.75 s, the largest value for which estimated firing rates from our deconvolution remained positive. This value is smaller than published values for zebrafish olfactory neurons (Yaksi and Friedrich, 2006) by a factor of two, but consistent with the decay constant for many other neuronal Ca2+ measurements (Badea et al., 2001). Setting the decay rate to a larger value, then eliminating the few negative values (setting a threshold at zero) did not significantly change our results. This suggests that our firing rate estimation procedure is robust to changes in the decay constant of order approximately 1 s.
To illustrate the steps that we used in our firing rate estimation procedure, we determined firing rates for a Ca2+ wave from our dataset. In Figure 3, we depict (1) the SOARS estimated YFP/CFP ratio (the ratio) with background subtracted, (2) Ca2+ concentration, and (3) firing rate for 20 s during the Ca2+ wave. In a panel on the right, we show time-courses within the hb ROI depicted in Figure 1A. Although there are statistically significant changes in the ratio as a function of time, these changes are not easily discernible by eye except between 0 and 5 s in the ratio. Therefore, we subtracted the mean ratio to show the dynamics of the ratio. The ratio is non-linearly related to the Ca2+concentration, therefore regional changes in Ca2+ concentrations are more evident. With the assumption that action potentials are the dominant source of Ca2+ release, large changes in Ca2+ concentration are associated with high firing rates. In this event, a wave of uniform neuronal firing is evident in the forebrain, tectum, and ventral hindbrain. (See Movie S1 in Supplementary Material for a movie of the ratio, Ca2+ concentration and firing rate estimates for the entire 1-h dataset).
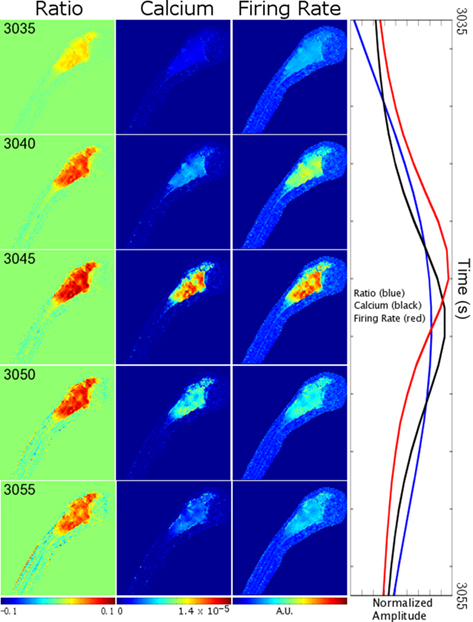
Figure 3. Estimating firing rates from ratiometric Ca2+ imaging data. Background subtracted YFP/CFP ratios, and associated Ca2+ concentrations and firing rates are depicted for the same laterally mounted 7 dpf zebrafish larva as was depicted in Figure 1. Snapshots from 20 s of data are shown at 5 s intervals with time running from top to bottom. The left column depicts the background subtracted YFP/CFP ratio estimated using the SOARS method. Numbers in the upper left denote the number of seconds from the beginning of the experiment. The middle left column depicts intracellular Ca2+ concentrations calculated from the ratios in the left column (see Materials and Methods). The middle right column depicts firing rates deconvolved from the Ca2+ concentrations in the middle left column (see Materials and Methods). Normalized time-courses (mean subtracted, divided by SD) showing relative timing of peaks and shapes of the ratio, calcium and firing rates for the ROI depicted in Figure 1A are shown in the right-hand column. CNS regions and scale are given in Figure 1A. See Supplemental Information for a complete movie of the entire experiment.
Determining Putative Neuronal Ensembles Using Non-Negative Matrix Factorization
In Figure 4, we show a spatio-temporal decomposition of neuronal firing rates of the event in Figure 2A using NMF (Lee and Seung, 1999) into spatial factors and their time-courses. A number of decomposition methods are available for such purposes including the SVD (Sirovich and Uglesich, 2004), ICA (Makeig et al., 1997), and others. Below, we make use of both SVD and NMF factorizations.
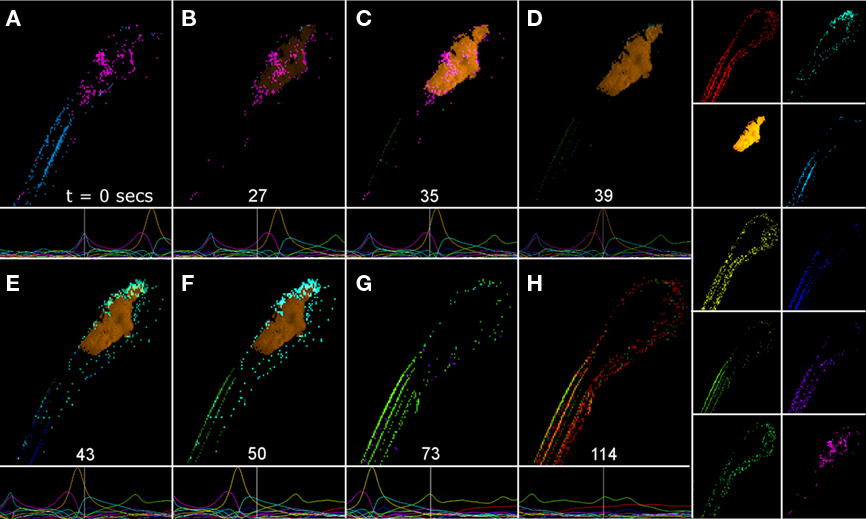
Figure 4. A propagating Ca2+ wave decomposed into a set of contributing factors. In this analysis, non-negative matrix factorization was used because non-negative factors may be interpreted as putative neuronal populations contributing to the wave (see text). (A–H) depict the combination of factors contributing to various instants in the evolution of the Ca2+ wave depicted in Figure 2A. Each frame in (A–H) is made up of a linear combination of the matrix factors shown in the 10 panels on the right. The amplitude of each factor is depicted in the panels underneath (A–H). The white line denotes the specific time of each reconstructed frame. The time of each panel is shown in (A–H) above the white line. CNS regions and scale are given in Figure 1A. See Supplemental Information for a complete movie of an NMF of the entire 1-h experiment using a 25 factor decomposition.
For this figure, we approximated firing rates using 10 non-negative factors capturing 98.1% of the root-mean-squared (RMS) variability. The factors were thresholded for the figure to remove low-level background noise for better visualization. Two factors, the blue and magenta factors depicted in Figure 4A, represent the initial firing rates in two sets of axonal tracts (blue), one located dorsally and the other located ventrally, and neurons (magenta) in the spinal cord and brain. The firing rate activity then propagated to a presumptive neuronal ensemble, the yellow factor (second down, left panel of factors), in the hindbrain, and tectum as depicted in Figures 4C–F. A new ensemble, the cyan factor, located primarily in the anterior hindbrain and tectum then increased its amplitude (Figures 4E,F). Finally, the activity propagated posteriorly to two presumptive axonal tracts in the spinal cord, the green and red factors (Figures 4G,H). These tracts were distinct from those in Figure 4A. The entire event lasted for roughly 114 s. (See Movie S2 in Supplementary Material for a movie of the estimated firing rate and the estimated firing rate decomposed into 25 non-negative factors for the entire 1-h dataset).
Functional Coupling between Neuronal Ensembles
The NMF provided us with a set of putative neuronal ensembles (factors) and their time-courses. Information regarding the interactions between these ensembles may be summarized in a reduced connectivity matrix (see Materials and Methods). We have assumed that the wave-like bursting activity is (approximately) linear for this seizure model (i.e., that average bursting rates within the wave are not varying considerably as it propagates, therefore we can linearly expand the gain function within the wave), normal physiological interactions between neurons would require a non-linear model. In Figure 5, we plot the reduced connectivities between all of the 10 NMF factors used in Figure 4. In this matrix the diagonal (i.e., self-coupling) has been removed. [The diagonal is large because the waves move slowly (time-scale of minutes), but the connectivity matrix is calculated on a faster time-scale (1 s)].
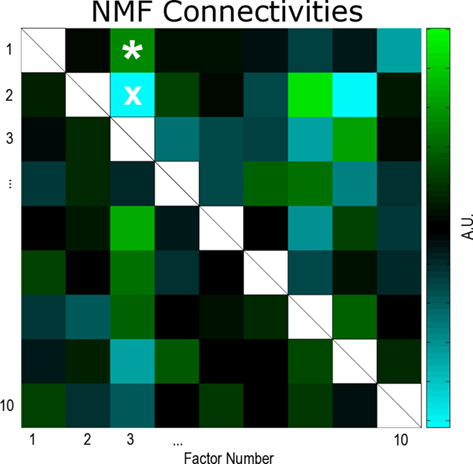
Figure 5. Reduced network connectivities estimated using a non-negative matrix factorization (NMF) of the data. Large self-couplings (white boxes) due to the slowness of wave propagation have been dropped (see text). In the NMF connectivity matrix, quantities less than zero (cyan, see colorbar) may be interpreted as effectively inhibitory couplings between the neuronal populations represented by the matrix indices. Conversely, quantities greater than zero (green) may be interpreted as effectively excitatory couplings between neuronal populations. From the information in this reduced connectivity matrix, we can infer how the putative neuronal populations depicted in Figure 4 are interacting. White asterisk, connectivity between factors 3 and 1 (population 3 effectively excites population 1); white ×, connectivity between factors 3 and 2 (population 3 effectively inhibits population 2).
As discussed in Section “Materials and Methods,” an important property of the NMF factors is that their interactions may be interpreted as either excitatory or inhibitory. For instance, the asterisk (?) in Figure 5 denotes the reduced connectivity between factor 3 and factor 1 (the yellow and red factors in Figure 4, right panels). This connectivity is effectively excitatory (green) in that when the firing rate increases in the neuronal ensemble represented by 3, it tends to also increase in 1. The “x” in Figure 5 denotes the reduced connectivity between factor 3 and factor 2 (the yellow and orange-yellow factors in Figure 4, right panels). This connectivity is effectively inhibitory (cyan) since when the firing rate increases in 3, it tends to decrease in 2.
Although Figures 2A, 3 and 4 show a representative wave of activity in our dataset, taken individually it only provides anecdotal evidence of wave dynamics. The reduced connectivity matrix, on the other hand, translates the dynamical information contained in all waves in the dataset into structural information about reduced functional connectivities at the population level.
Inferring Neuronal Coupling from Ensemble Coupling
The information in the reduced connectivity matrix may be visualized at the neuronal level. Here, we did this by calculating the reduced connectivity matrix in the SVD basis, then projecting the matrix back to the pixel basis (i.e., we are reconstructing a filtered form of the full reduced connectivity matrix, see Materials and Methods). This full reduced connectivity matrix contained the connectivity pattern for each pixel in the dataset.
In Figure 6, we show three examples of incoming (receiving activity from other neuronal populations) and outgoing (propagating activity to other neuronal populations) connectivities in neurons from various regions of the CNS. The region (white box) in Figure 6A is excited by neurons distributed throughout the hindbrain and tectum (Figure 6A, Incoming, green) but inhibits small populations of neurons located in the dorsal hindbrain and the tectum (Figure 6A, Outgoing, cyan) and excites neurons with projections into the spinal cord (Figure 6A, Outgoing, green). The pixel (white box) depicted in Figure 6B has a different connectivity pattern than that in Figure 6A, and excites and inhibits smaller populations of neurons. The pixel in Figure 6C, is apparently connected only to a few other neurons in the spinal cord.
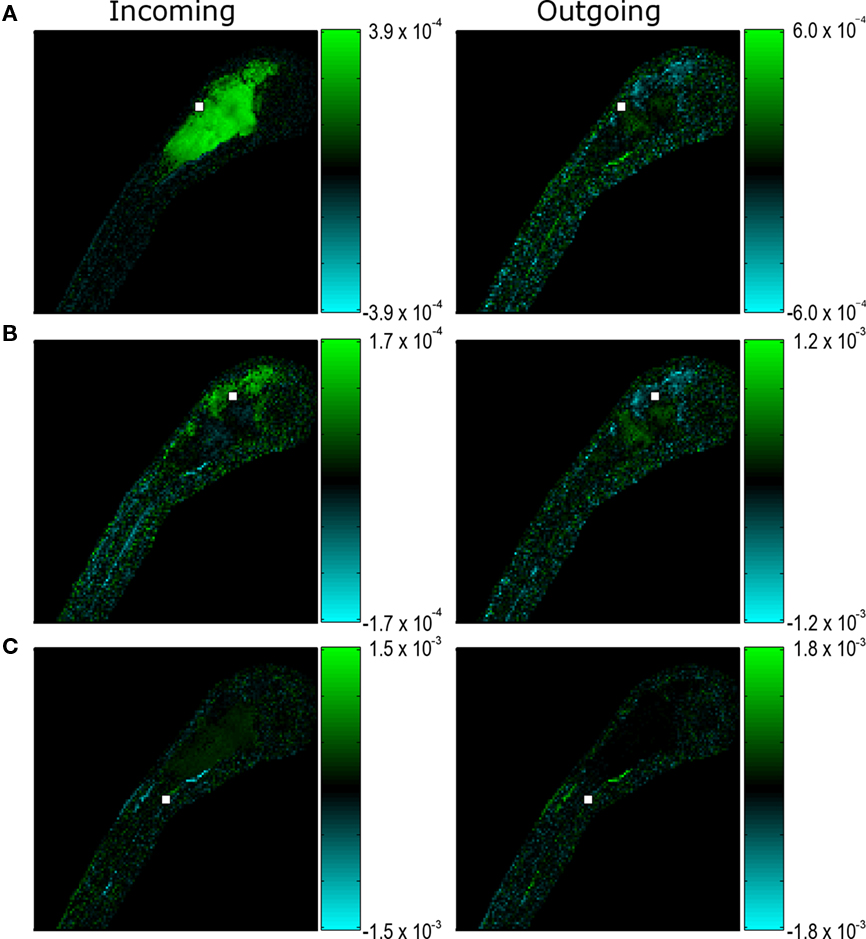
Figure 6. Putative in- and out-going reduced connectivities for presumptive neurons (pixels) in the CNS of a 7 dpf larval zebrafish. Reduced connectivities estimated from an SVD decomposition have been visualized in the image basis (see text). Green (cyan) pixels represent putative excitatory (inhibitory) coupling strengths. (A,B,C) show representative in- and out-going reduced connectivities for presumptive neurons in different regions of the CNS. For ease of visualization, the presumptive neurons (pixels) are depicted with a 2 by 2 pixel white box. CNS regions and scale are given in Figure 1A.
Visualizing the Flow of Activity in the CNS
The activity of a neuronal population represented by an eigenvector of the reduced connectivity matrix will persist within the same population assuming linear dynamics. Of course, neuronal networks are not linear systems; nonetheless, these eigenvectors may be considered as canonical pathways or circuits in the flow of bursting activity through the nervous system. Although we cannot determine the identities or physical connectivities of the neurons in this data, the pattern of activity observed using these methods is consistent with what is known about the types of connections present in the optic tectum, tegmentum, hindbrain, and spinal cord. In zebrafish, as well as other vertebrates, sets of interconnected nuclei located in the hindbrain and midbrain receive input largely from the telencephalon, optic tectum, and spinal cord and project to a variety of targets, including neurons within the hindbrain, midbrain, extraocular motoneurons, and motor circuits in the spinal cord (e.g., Kimmel et al., 1982; Mendelson, 1986; Metcalfe et al., 1986; Wulliman et al., 1996; Ali et al., 2000; Perez-Perez et al., 2003a,b).
In Figure 7, we show three examples of eigenvectors of the reduced connectivity matrix. Two of the eigenvectors are complex (a and b) and one is real (c). Eigenvector (a) represents a dynamical mode that conveys firing from a dorsal region of the hindbrain and tectum to the entire hindbrain and tectum. This mode has a characteristic frequency of 0.08 Hz (Tperiod = 78 s), as determined from the complex phase of its eigenvalue. Eigenvector (b) represents a dynamical mode that conveys firing from the hindbrain and tectum to the spinal cord with frequency 0.02 Hz (Tperiod = 367 s). Eigenvector (c) represents a dynamical mode that does not propagate. This mode primarily represents activity of an individual neuron in the spinal cord whose activity is independent of other neurons.
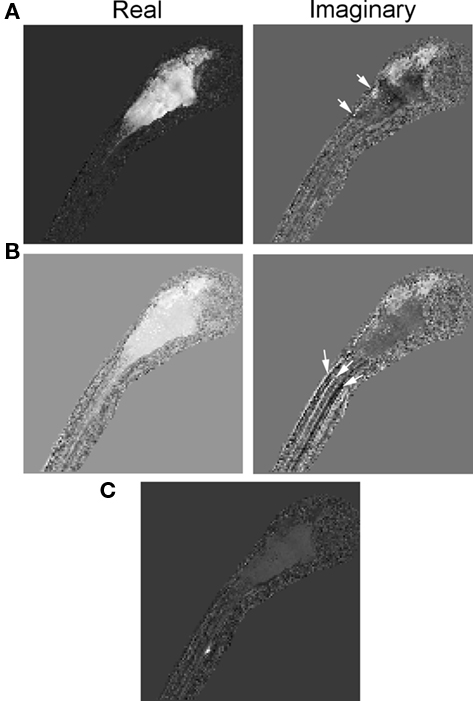
Figure 7. Eigenvectors of the reduced connectivity matrix, Keff, estimated using an SVD decomposition. Each eigenvector represents a dynamical mode of neuronal activity calculated from the estimated firing rates. (A,B) represent dynamical modes with complex eigenvalues and therefore they are wave-like modes with firing rates propagating between the real and imaginary parts of the eigenvector. A few regions exhibiting significant but localized differences between eigenvectors (A,B) are indicated (arrows). (C) Represents a dynamical mode with a real eigenvalue and thus a non-propagating mode. In this case, a single neuron or group of neurons (the region of bright pixels) in the spinal cord fired independently of other neuronal activity. CNS regions and scale are given in Figure 1A.
Discussion
In summary, we have set forth and demonstrated a method for visualizing functional neuronal ensembles and mapping reduced functional connectivities in ratiometric Ca2+ imaging data. Our results clearly show that with these methods we were able to discover neural populations contributing to firing rate dynamics, identify putative incoming and outgoing connectivities in our imaging data, and estimate dynamical modes captured by the data. We have checked that the connectivity matrices derived with our method were robust to changes in the Ca2+ decay rate (1 < τ < 4 s) used in firing rate estimates and to our choice of Rmax and Rmin in the calculation of Ca2+ concentrations. This is largely due to the fact that the reduced connectivity matrix was linearly derived from the Ca2+ concentration and that the ratio varied close to the linear region of the ratio/concentration curve during the wave events. Because of this reliance on approximate linearity, there remains a question of the global amplitude of the firing rates from which the connectivity matrices are derived. In order to eliminate this unknown factor, simultaneous electrophysiological and imaging experiments need to be performed.
The limitations of our approach as presented here include both methodological and technical aspects. One limitation is introduced by our use of a linear model to infer connectivities. While a non-linear model is more appropriate for determining connectivities in a normally functioning nervous system, application of our analysis framework with a non-linear neuronal model to study normal neuronal activity requires significantly higher SNRs than are currently achievable using extant lines of transgenic zebrafish. Furthermore, our approach as presented here is limited by the data of bursting activity that we analyzed. Actual connectivities could only be inferred if the entire network were imaged with sufficient temporal resolution to capture fast synaptic events. Our imaging data was taken of a single focal plane at relatively low temporal resolution (1 Hz). Therefore, the “connectivities” that we infer are at the ensemble level since fast synaptic events are not resolved at 1 Hz. The entire remaining CNS volume outside of our focal plane has been missed in our data, thus limiting our ability to capture all of the relevant information concerning propagation pathways of neural activity. The recent advent of more sensitive detection systems and faster computers suggests that the imaging limitations associated with the current study will soon be overcome and it should be feasible to volumetrically image fast synaptic events in the larval zebrafish in the relatively near future.
The advantage of our approach is that it can immediately be applied to data of any temporal and spatial resolution. It may also be immediately applied to volumetric data with no changes. In principle, with a good SNR at 100 Hz, high spatial resolution volumetric imaging data, our method would be able to capture incoming and outgoing neuronal connectivities that truly represent synaptic connectivities, since at this temporal resolution the time-course of individual calcium transients can be resolved and, in principle, with volumetric data, all neurons could be captured.
The dimensional reduction methods that we presented here are designed to be amenable to the analysis of large datasets with limited computational space. The dataset analyzed in this manuscript contained 3600 frames, each of which was 16384 (128 × 128) pixels. But performing an analysis on 50 or even 100 factors reduces the least-squares fit of the reduced connectivity matrix to a fit on a 50 or 100 by 3600 data matrix.
The question concerning whether the connectivity matrices represent real functional connections or just time-delayed events depends on a number of things such as the imaging frame rate and the completeness of the measurements over the entire brain. Generally, it is known to be difficult to prove causality. From this point of view, the connectivity matrices that we calculate are “effective” connectivities representing potential connectivities given the data and information gleaned from them would necessarily need to be validated with electrophysiology. Our point of view is that our connectivities are useful additions to our knowledge about the system and contain information that cannot be gleaned from electrophysiological measurements, since electrophysiological measurements typically sample only a very small number of neurons, whereas with imaging methods large tissues may be measured.
Because they capture crucial information about putative neuronal connectivities, connectivity matrices inferred with our method can be combined with realistic simulations of neuronal networks and electrophysiological experiments to validate hypothesized mechanisms of neuronal interaction and activity propagation. In this context, the simple linear model that we used to estimate the reduced connectivity matrix can be replaced with more biophysically motivated non-linear models, which may be fit using statistical methods similar to those that we have used. Two of us have already shown that, using data from numerical experiments, accurate reduced connectivity matrices may be estimated using realistic, integrate-and-fire neuronal models (Tao and Sornborger, 2010).
Conclusion
In summary, we have used a zebrafish seizure model to explore an automated procedure for detecting putative neuronal ensembles that are active in CNS-wide events and for mapping their functional connectivities directly from ratiometric Ca2+ imaging data. Our results show that this analytical framework can be used to visualize the connectivity of neuronal ensembles that are involved in the flow of seizure activity in neuronal networks. We have shown that the eigenvectors of the connectivity matrix are a useful means of summarizing putative neural circuits involved in activity flow.
With the accelerating development of fast, high-resolution imaging techniques and transgenic animals engineered for neural imaging purposes, the need to develop systematic procedures to extract as much functional information as possible directly from large datasets is becoming more and more pressing. The procedure that we presented here and, more generally, the analysis framework that our work represents was developed as a practical, user-independent means to serve this need.
Conflict of Interest Statement
The authors declare that the research was conducted in the absence of any commercial or financial relationships that could be construed as a potential conflict of interest.
Acknowledgments
This work was supported by (Andrew T. Sornborger and James D. Lauderdale) NIH NIBIB 005432, NIH NINDS 070159, and (Louis Tao) the National Basic Research Program of China (973 Program 2011CB809105). Andrew T. Sornborger would like to thank Liping Wei and the Center for Bioinformatics at the College of Life Sciences at Peking University for their hospitality.
Supplementary Material
The Movies 1 and 2 for this article can be found online at http://www.frontiersin.org/neuralcircuits/paper/10.3389/fncir.2011.00002/abstract
References
Ali, D. W., Buss, R. R., and Drapeau, P. (2000). Properties of miniature glutamatergic EPSCs in neurons of the locomotor regions of the developing zebrafish. J. Neurophysiol. 83, 181–191.
Babajani-Feremi, A., and Soltanian-Zadeh, H. (2010). Multi-area neural mass modeling of EEG and MEG signals. Neuroimage 52, 793–811.
Badea, T., Goldberg, J., Mao, B., and Yuste, R. (2001). Calcium imaging of epileptiform events with single-cell resolution. J. Neurobiol. 48, 215–227.
Baraban, S. C. (2005). “Modeling epilepsy and seizures in developing zebrafish larvae,” in Models of Seizures and Epilepsy, eds A. Pitkänen, P. A. Schwartzkroin, and S. L. Moshé, (New York: Elsevier, Academic Press), 189–198.
Baraban, S. C. (2007). Emerging epilepsy models: insights from mice, flies, worms and fish. Curr. Opin. Neurol. 20, 164–168.
Baraban, S. C., Dinday, M. T., Castro, P. A., Chege, S., Guyenet, S., and Taylor, M. R. (2007). A large-scale mutagenesis screen to identify seizure-resistant zebrafish. Epilepsia 48, 1151–1157.
Baraban, S. C., Taylor, M. R., Castro, P. A., and Baier, H. (2005). Pentylenetetrazole induced changes in zebrafish behavior, neural activity and c-fos expression. Neuroscience 131, 759–768.
Broder, J., Majumder, A., Porter, E., Srinivasamoorthy, G., Keith, C., Lauderdale, J., and Sornborger, A. (2007). Estimating weak ratiometric signals in imaging data. I. Dual-channel data. J. Opt. Soc. Am. A Opt. Image Sci. Vis. 24, 2921–2931.
Brunet, J. P., Tamayo, P., Golub, T. R., and Mesirov, J. P. (2004). Metagenes and molecular pattern discovery using matrix factorization. Proc. Natl. Acad. Sci. U.S.A. 101, 4164–4169.
Cacciatore, T. W., Brodfuehrer, P. D., Gonzalez, J. E., Jiang, T., Adams, S. R., Tsien, R. Y., Kristan, W. B. Jr., and Kleinfeld, D. (1999). Identification of neural circuits by imaging coherent electrical activity with FRET-based dyes. Neuron 23, 449–459.
Cantero, J. L., Atienza, M., Gomez-Herrero, G., Cruz-Vadell, A., Gil-Neciga, E., Rodriguez-Romero, R., and Garcia-Solis, D. (2009). Functional integrity of thalamocortical circuits differentiates normal aging from mild cognitive impairment. Hum. Brain Mapp. 30, 3944–3957.
Carbonell, F., Worsley, K. J., Trujillo-Barreto, N. J., and Sotero, R. C. (2009). Random fields – union intersection tests for detecting functional connectivity in EEG/MEG imaging. Hum. Brain Mapp. 30, 2477–2486.
Chiu, C., and Weliky, M. (2002). Relationship of correlated spontaneous activity to functional ocular dominance columns in the developing visual cortex. Neuron 35, 1123–1134.
de Haan, W., Pijnenburg, Y. A., Strijers, R. L., van der Made, Y., van der Flier, W. M., Scheltens, P., and Stam, C. J. (2009). Functional neural network analysis in frontotemporal dementia and Alzheimer’s disease using EEG and graph theory. BMC Neurosci. 10, 101. doi: 10.1186/1471-2202-10-101
Devarajan, K. (2008). Nonnegative matrix factorization: an analytical and interpretive tool in computational biology. PLoS Comput. Biol. 4, e1000029. doi: 10.1371/journal.pcbi.1000029
Donoho, D., and Stodden, V. (2004). “When does non-negative matrix factorization give a correct decomposition into parts?” in Advances in Neural Information Processing Systems Vol. 16 (Cambridge, MA: MIT Press), 1141–1148.
Fan, X., Majumder, A., Reagin, S. S., Porter, E. L., Sornborger, A. T., Keith, C. H., and Lauderdale, J. D. (2007). New statistical methods enhance imaging of cameleon fluorescence resonance energy transfer in cultured zebrafish spinal neurons. J. Biomed. Opt. 12, 034017.
Field, G. D., Gauthier, J. L., Sher, A., Greschner, M., Machado, T. A., Jepson, L. H., Shlens, J., Gunning, D. E., Mathieson, K., Dabrowski, W., Paninski, L., Litke, A. M., and Chichilnisky, E. J. (2010). Functional connectivity in the retina at the resolution of photoreceptors. Nature 467, 673–677.
Garaschuk, O., Griesbeck, O., and Konnerth, A. (2007). Troponin C-based biosensors: a new family of genetically encoded indicators for in vivo calcium imaging in the nervous system. Cell Calcium 42, 351–361.
Higashijima, S., Masino, M. A., Mandel, G., and Fetcho, J. R. (2003). Imaging neuronal activity during zebrafish behavior with a genetically encoded calcium indicator. J. Neurophysiol. 90, 3986–3997.
Hires, S. A., Tian, L., and Looger, L. L. (2008). Reporting neural activity with genetically encoded calcium indicators. Brain Cell Biol. 36, 69–86.
Kimmel, C. B., Ballard, W. W., Kimmel, S. R., Ullmann, B., and Schilling, T. F. (1995). Stages of embryonic development of the zebrafish. Dev. Dyn. 203, 253–310.
Kimmel, C. B., Powell, S. L., and Metcalfe, W. K. (1982). Brain neurons which project to the spinal cord in young larvae of the zebrafish. J. Comp. Neurol. 205, 112–127.
Lee, D. D., and Seung, H. S. (1999). Learning the parts of objects by non-negative matrix factorization. Nature 401, 788–791.
Lee, D. D., and Seung, H. S. (2001). “Algorithms for non-negative matrix factorization,” in Advances in Neural Information Processing Systems Vol. 13 (Cambridge, MA: MIT Press), 556–562.
Logothetis, N. K. (2003). MR imaging in the non-human primate: studies of function and of dynamic connectivity. Curr. Opin. Neurobiol. 13, 630–642.
Makeig, S., Jung, T. P., Bell, A. J., Ghahremani, D., and Sejnowski, T. J. (1997). Blind separation of auditory event-related brain responses into independent components. Proc. Natl. Acad. Sci. U.S.A. 94, 10979–10984.
Mank, M., Santos, A. F., Direnberger, S., Mrsic-Flogel, T. D., Hofer, S. B., Stein, V., Hendel, T., Reiff, D. F., Levelt, C., Borst, A., Bonhoeffer, T., Hubener, M., and Griesbeck, O. (2008). A genetically encoded calcium indicator for chronic in vivo two-photon imaging. Nat. Methods 5, 805–811.
Mendelson, B. (1986). Development of reticulospinal neurons of the zebrafish. II. Early axonal outgrowth and cell body position. J. Comp. Neurol. 251, 172–184.
Metcalfe, W. K., Mendelson, B., and Kimmel, C. B. (1986). Segmental homologies among reticulospinal neurons in the hindbrain of the zebrafish larva. J. Comp. Neurol. 251, 147–159.
Miyawaki, A., Griesbeck, O., Heim, R., and Tsien, R. Y. (1999). Dynamic and quantitative Ca2+ measurements using improved cameleons. Proc. Natl. Acad. Sci. U.S.A. 96, 2135–2140.
Owen, J. P., Wipf, D. P., Attias, H. T., Sekihara, K., and Nagarajan, S. S. (2009). Accurate reconstruction of brain activity and functional connectivity from noisy MEG data. Conf. Proc. IEEE Eng. Med. Biol. Soc. 1, 65–68.
Perez-Perez, M. P., Luque, M. A., Herrero, L., Nunez-Abades, P. A., and Torres, B. (2003a). Afferent connectivity to different functional zones of the optic tectum in goldfish. Vis. Neurosci. 20, 397–410.
Perez-Perez, M. P., Luque, M. A., Herrero, L., Nunez-Abades, P. A., and Torres, B. (2003b). Connectivity of the goldfish optic tectum with the mesencephalic and rhombencephalic reticular formation. Exp. Brain Res. 151, 123–135.
Pillow, J. W., Shlens, J., Paninski, L., Sher, A., Litke, A. M., Chichilnisky, E. J., and Simoncelli, E. P. (2008). Spatio-temporal correlations and visual signalling in a complete neuronal population. Nature 454, 995–999.
Sirovich, L., and Uglesich, R. (2004). The organization of orientation and spatial frequency in primary visual cortex. Proc. Natl. Acad. Sci. U.S.A. 101, 16941–16946.
Sornborger, A., Broder, J., Majumder, A., Srinivasamoorthy, G., Porter, E., Reagin, S. S., Keith, C., and Lauderdale, J. D. (2008). Estimating weak ratiometric signals in imaging data. II. Meta-analysis with multiple, dual-channel datasets. J. Opt. Soc. Am. A. Opt. Image Sci. Vis. 25, 2185–2194.
Stam, C. J. (2009). Use of magnetoencephalography (MEG) to study functional brain networks in neurodegenerative disorders. J. Neurol. Sci. 289, 128–134.
Tao, L., and Sornborger, A. T. (2010). Dimensionally-reduced visual cortical network model predicts network response and connects system- and cellular-level descriptions. J. Comput. Neurosci. 28, 91–106.
Taylor, A. L., Cottrell, G. W., Kleinfeld, D., Kristan, W. B. Jr. (2003). Imaging reveals synaptic targets of a swim-terminating neuron in the leech CNS. J. Neurosci. 23, 11402–11410.
Vogelstein, J. T., Packer, A. M., Machado, T. A., Sippy, T., Babadi, B., Yuste, R., and Paninski, L. (2010). Fast non-negative deconvolution for spike train inference from population calcium imaging. J. Neurophysiol. 104, 3691–3704.
Vogelstein, J. T., Watson, B. O., Packer, A. M., Yuste, R., Jedynak, B., and Paninski, L. (2009). Spike inference from calcium imaging using sequential Monte Carlo methods. Biophys. J. 97, 636–655.
Westerfield, M. (ed.) (2000). The Zebrafish Book: A Guide for the Laboratory use of Zebrafish (Danio rerio), 4th Edn. Eugene, OR: University of Oregon Press.
Wulliman, M. F., Rupp, B., and Reichert, H. (1996). Neuroanatomy of the Zebrafish Brain: A Topological Atlas, 1st Edn. Basel: Birkhauser.
Xu, J., Sornborger, A. T., Lee, J. K., and Shen, P. (2008). Drosophila TRPA channel modulates sugar-stimulated neural excitation, avoidance and social response. Nat. Neurosci. 11, 676–682.
Yaksi, E., and Friedrich, R. W. (2006). Reconstruction of firing rate changes across neuronal populations by temporally deconvolved Ca2+ imaging. Nat. Methods 3, 377–383.
Ye, J. H., Ryu, S. B., Kim, K. H., and Goo, Y. S. (2008). Functional connectivity map of retinal ganglion cells for retinal prosthesis. Korean J. Physiol. Pharmacol. 12, 307–314.
Keywords: calcium imaging, zebrafish, seizure, epilepsy, ratiometry, calcium wave, chemoconvulsant, bursting activity
Citation: Tao L, Lauderdale JD and Sornborger AT (2011) Mapping functional connectivity between neuronal ensembles with larval zebrafish transgenic for a ratiometric calcium indicator. Front. Neural Circuits 5:2. doi: 10.3389/fncir.2011.00002
Received: 23 June 2010;
Paper pending published: 23 August 2010;
Accepted: 11 January 2011;
Published online: 22 February 2011.
Edited by:
Karl Deisseroth, Stanford University, USAReviewed by:
Moritz Helmstaedter, Max Planck Institute for Medical Research, GermanyJit Muthuswamy, Arizona State University, USA
Schuff Norbert, University of California, USA
Theodore C. Dumas, George Mason University Krasnow Institute, USA
Copyright: © 2011 Tao, Lauderdale and Sornborger. This is an open-access article subject to an exclusive license agreement between the authors and Frontiers Media SA, which permits unrestricted use, distribution, and reproduction in any medium, provided the original authors and source are credited.
*Correspondence: Louis Tao, Center for Bioinformatics, National Laboratory of Protein Engineering and Plant Genetics Engineering, College of Life Sciences, Peking University, Number 5 Summer Palace Road, Beijing 100871, People’s Republic of China.e-mail: taolt@cbi.pku.edu.cn;
James D. Lauderdale, Department of Cellular Biology, Coverdell Biomedical and Health Sciences Institute, University of Georgia, 500 D.W. Brooks Drive, Athens, GA 30602, USA. e-mail: jdlauder@uga.edu;
Andrew T. Sornborger, Department of Mathematics and Faculty of Engineering, Coverdell Biomedical and Health Sciences Institute, University of Georgia, 500 D.W. Brooks Drive, Athens, GA 30602, USA. e-mail: ats@math.uga.edu