Lateral connectivity in the olfactory bulb is sparse and segregated
- 1 Department of Neurobiology, Yale University School of Medicine, New Haven, CT, USA
- 2 Department of Physics, Yale University, New Haven, CT, USA
Lateral connections in the olfactory bulb were previously thought to be organized for center–surround inhibition. However, recent anatomical and physiological studies showed sparse and distributed interactions of inhibitory granule cells (GCs) which tended to be organized in columnar clusters. Little is known about how these distributed clusters are interconnected. In this study, we use transsynaptic tracing viruses bearing green or red fluorescent proteins to further elucidate mitral- and tufted-to-GC connectivity. Separate sites in the glomerular layer were injected with each virus. Columns with labeling from both viruses after transsynaptic spread show sparse red or green GCs which tended to be segregated. However, there was a higher incidence of co-labeled cells than chance would predict. Similar segregation of labeling is observed from dual injections into olfactory cortex. Collectively, these results suggest that neighboring mitral and tufted cells receive inhibitory inputs from segregated subsets of GCs, enabling inhibition of a center by specific and discontinuous lateral elements.
Introduction
One role of lateral inhibitory networks is mediating contrast enhancement of similar inputs in several brain regions (Kuffler, 1953; Sur, 1980; DeVries and Baylor, 1993; Ma and Suga, 2004). In sensory modalities with spatially organized input, as in vision, or input converted to space from a linear continuum such as frequency in audition, a spatially organized center–surround network is sufficient to enable contrast enhancement. In olfaction the stimulus is not spatial, but is transformed into a spatial pattern in the glomerular layer of the olfactory bulb (OB). The axons from sensory neuron that recognize structurally related odorants tend to be located in similar glomerular regions (Xu et al., 2003; Mori et al., 2006; Johnson and Leon, 2007). However, several lines of evidence show that there is not a definitive chemotopy in which glomerular location is a strict function of the molecular properties of the encoded odorant (Cleland and Sethupathy, 2006; Man et al., 2007; Soucy et al., 2009). Consequently, a spatially organized center– surround inhibitory environment would not achieve olfactory contrast enhancement because signal from nearest neighbors are not necessarily related; more distant interactions may be required.
The external plexiform layer includes the lateral dendrites of mitral and tufted (MT) projection neurons which form dendrodendritic synapses with inhibitory granule cells (GCs; Shepherd et al., 2004). Because the MT lateral dendrites can extend up to half of the OB circumference (Mori et al., 1983; Orona et al., 1984), each MT cell can form synapses with a large number of both proximal and distal GCs, providing a promising site for long range interactions. GCs outnumber MT cells by approximately 25 to 1 (Meisami and Safari, 1981; Frazier and Brunjes, 1988; Royet et al., 1998). In most brain regions the inhibitory to excitatory neuron ratio is closer to parity, or, as is the case in the cerebellum and thalamus, more excitatory than inhibitory neurons (Shepherd, 2004). The high ratio of inhibitory to projection neurons in the OB has not been explained, though given the very large disparity it seems reasonable to speculate that this property is central to odor processing.
We previously used transsynapticpseudorabies virus (PRV) tracing to demonstrate laterally distributed columnar organization of GCs (Willhite et al., 2006). The previous work did not address how two sites interconnect. When multiple glomeruli laterally influence another glomerulus, how is the network constructed to process the convergence? Here, we explore the convergence of the OB lateral inhibitory network using two PRV strains expressing GFP and RFP respectively (Billig et al., 2000; Smith et al., 2000; Banfield et al., 2003). Separate glomerular layer injections revealed sparse MT-to-GC connections within a column are generally segregated. Dual injections into separate sites in the anterior piriform cortex also resulted in segregated GC labeling within a column, suggesting that each MT cell forms synaptic connections with only a subset of the GCs within a column. We propose that these GC subsets allow summation of inhibition from multiple lateral sources, enabling combinatorial lateral inhibition consistent with the combinatorial nature of the olfactory code.
Materials and Methods
Surgery
All of the animal use procedures in this study conformed to the Guide for the Care and Use of Laboratory Animals (1996, National Academy of Sciences) and were approved by the Yale Institutional Animal Care and Use Committee.
Attenuated Bartha-PRV strains which were further modified to express enhanced green fluorescent protein or mRFP1 under control of the cytomegalovirus immediate early promoter, PRV-152 and PRV-614 respectively, were used for transneuronal tracing of synaptic pathways in this study. The double-stranded DNA pseudorabies virus should not be confused with the single-stranded RNA rabies virus also used in tracing studies (Miyamichi et al., 2010).
Sprague–Dawley rats age 6–8 weeks were used in this study. Detailed previously published protocols were followed for viral injections (Card and Enquist, 1999). Rats were anaesthetized with 75 mg/kg ketamine and 5 mg/kg xylazine by intraperitoneal injection and additional drug was added as necessary. PRV injection solution was prepared by adjusting the titer to 1 × 10⁸ PFU/mL with phosphate buffered saline (PBS) and adding red or green fluorescent microspheres to mark the injection site (Molecular Probes, Eugene, OR, USA). 100 nL of PRV was injected using a Hamilton syringe (Fisher Scientific, Pittsburgh, PA, USA) with a 33 gauge needle into the indicated areas using a stereotaxic instrument (Stoelting, Wood Dale, IL, USA). The rate of injection was 20 nL/min, controlled by a Nano-Injector system (Stoelting, Wood Dale, IL, USA). After 15 min to allow diffusion of the bolus, the syringe was removed slowly.
Three days post-injection (70–74 h), the animals were deeply anaesthetized using urethane or ketamize/xylazine overdose, then perfused transcardially with PBS followed by a 4% paraformaldehyde (PFA) solution in PBS. The brain was extracted after fixation and post-fixed in PFA overnight or for 3 h for histological preparation.
Tissue Preparation, Histology, and Imaging
Hundred micron (50 micron for histology) free-floating sections were prepared on a Leica VT1200S vibrating microtome. Sections that had not been infected with PRV 152 or PRV 614 were stained with mouse anti-NeuN (IHCR1001-6, Millipore, Billerica, MA, USA) for stereology. PRV 152 infected sections were stained with Anti-Caspase 3 (active, 04-439), Anti-Nestin clone rat-401 (IHCR1006-6), Anti-NG-2 (AB5320MI) also from Millipore, anti-doublecortin (sc-8066, Santa Cruz Biotechnology, Santa Cruz, CA, USA), or GAD65/67 Monoclonal Antibody (9A6, Assay Designs Ann Arbor, MI, USA). Antigen recovery was performed on every tenth 50 micron section for NeuN staining only by placing each in 500 μL 0.1 M Na-citrate pH 6 and placed at 99°C for 10 min. Sections were resuspended in 200 μL PBS for 10 min, then replaced with 200 μL of 2% BSA + 1% Triton in PBS (blocking buffer) for 30 min, then stained with primary antibody overnight at 4°C. After wash with blocking buffer, sections were stained with a 1:2500 dilution of the anti-mouse Alexa 594 (Invitrogen, #11005) in blocking buffer at room temperature for 2 h, then washed in blocking buffer. Anti-Caspase 3 (Active), Millipore Temecula, CA, USA.
Tissue sections were wet mounted in Vecta-Shield mounting medium containing DAPI (Vector Laboratories, Burlingame, CA, USA). Sections were examined using a Leica DM5500 fluorescent microscope or an Olympus Fluoview 1000 confocal microscope. Images were manipulated for brightness and contrast, and cropped using Adobe Photoshop version 6.0.1. or Photoshop Elements version 2.0.2. Distance measures and volumes were not adjusted for shrinkage of samples due to tissue processing. Diagram figures were created using Microsoft PowerPoint 2003, and other graphs using MATLAB V.7.8.0.347, and further manipulated in Adobe Photoshop.
OB Flat Map Reconstructions
Maps of the fluorescent intensity in the granule cell layer (GrCL) were constructed with OdorMap Builder (Liu et al., 2004). While the software was designed to display odor activation patterns in the glomerular layer, it is capable of constructing an intensity plot of any given set of sections through any selected lamina. The region immediately deep to the internal plexiform layer was traced for each 100 micron OB section.
Stereology
Total neuron number as assessed by NeuN positive cells in the GrCL was determined using the optical disector method (Sterio, 1984; Gundersen et al., 1988). Every 10th 50 micron coronal section was used for random sampling from five animals. The GrCL, defined by the boundaries of the internal plexiform layer superficially and the rostral migratory stream deep, was outlined using StereoInvestigator software and hardware interfaced with a Leica DM5500 fluorescence microscope equipped with an automated stage (MBF Bioscience, Williston, VT, USA). See Table 1 for additional stereological methods.
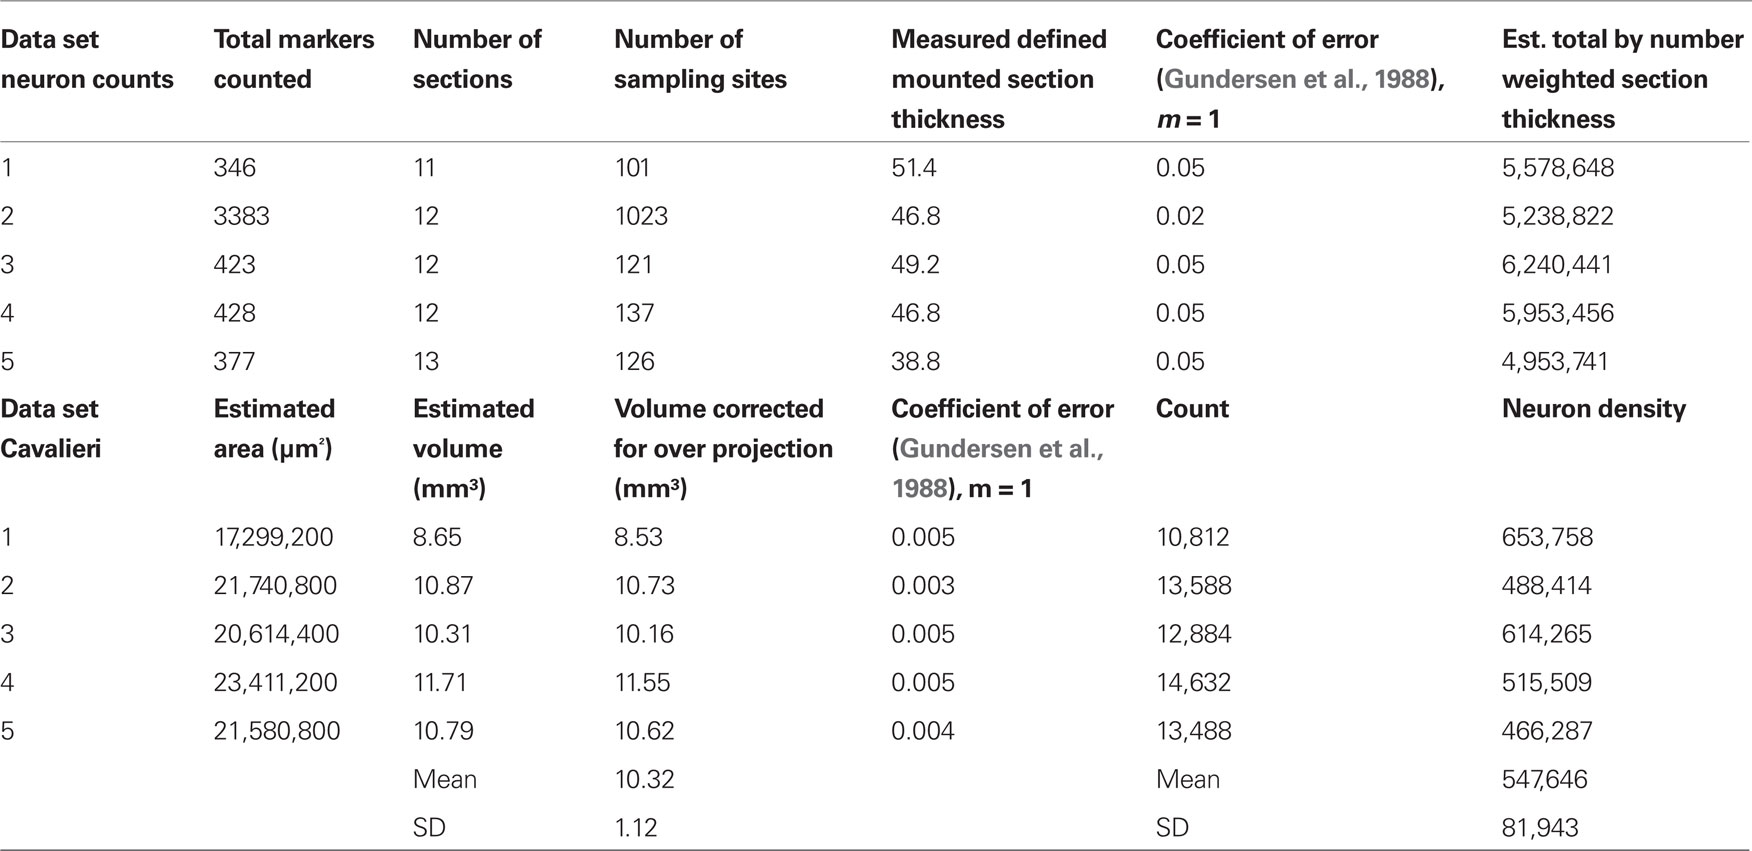
Table 1. Stereological estimate of GrCL neuron density. The counting frame area was 400 μm2, the Cavalieri grid size was 40 microns. The average total number of neurons in the GrCL at 6–8 weeks was estimated at 5,593,021 with a standard deviation of 520,424. This average should not be confused with the number of granule cells, some of which are present in the mitral cell layer, and it also includes deep short axon and other potential NeuN positive neuron types in the GrCL. Animal #2 was randomly chosen for oversampling.
Stochastic Model
Stochastic MT-to-GC connectivity models were generated in MATLAB V.7.8.0.347 (R2009a TheMathWorks). The probabilities for red and green labeling (and hence connectivity) were calculated from the measured number of red and green neurons as well as the volume of each column assuming a uniform density from the stereological result within each column. Based on the observed percent of red and green neurons within an individual column, the predicted percent of stochastically connected yellow neurons was determined from a binomial distribution assuming independent probabilities of a neuron being either red or green. The mean yellow percent is then given by (% red × % green) and its variance by [% red × % green × (1 − % red × % green)].
The probability mass function and cumulative distribution functions were fit according to a binomial distribution for the stochastic model and a log-logistic distribution for the data due to the heavier tails. Plots were normalized to make the integrals equal to one. The entirety of the data was shifted by one to two standard deviations from zero (positively) in order to obtain a non-negative abscissa for the fitting function.
Results
Sparse Lateral OB Connectivity
Dual PRV injections into medial glomerular layer sites separated by 500–800 microns were performed to determine the convergence or segregation of lateral connectivity. The tracer was targeted to the glomerular layer of the OB, as assessed by 1-μm fluorescent spheres included with the injections. After 1 day, labeling is observed in MT cells proximal to the injection site (data not shown). Three days after injection, widespread columnar labeling was apparent in the GrCL (Figure 1A). One possible expectation would be red, green, and yellow columns representing the segregated and convergent cases, respectively. The observed labeling showed some columns with only red or green GCs with no co-labeling or interdigitation. Columns labeled with both tracers occupying the same space, however, demonstrated a further subset of segregation – red and green labeled GCs within the same column, with apparently few co-labeled (yellow) cells (Figures 2A–C). This arrangement suggests that lateral dendrites innervating the EPL of a given column form sparse, segregated connections with GCs within the column. No columns were observed that contained only co-labeled cells. Pyramidal cells in the piriform cortex from the same animal show a high degree of co-labeling (Figure 2D) indicating that cells readily accept co-infection by both viral tracers. We interpret the cortical labeling to arise via centrifugal projections onto second-order GCs. Figure 3 shows the lateral extent of the labeling from the injection sites for one animal. While there is more labeling proximal to the injection than distal, the distribution is selective and with gaps not observed in a classical center-surround organization. No two injection sites were closer than 500 microns to prevent co-infection of first-order neurons.
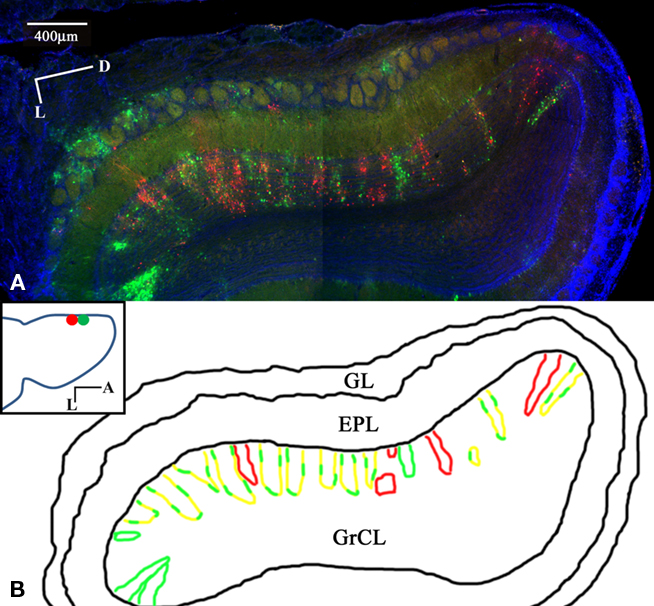
Figure 1. Sparse, segregated labeling in GrCL columns after dual glomerular layer injection. Coronal section of the rat OB and piriform cortex 3 days after Dual PRV injection into the medial glomerular layer (GL). PRV-152 (green) was injected ~500 μm posterior to PRV-614 (red), DAPI (blue). (A) OB section montage. Heterogeneous labeling shows some columns of only one color and varying degrees of columns with interdigitated red and green GCs. (B) Schematic showing columns with single or dual labeling. No columns were observed that contained only co-labeled cells. (Inset) Horizontal schematic showing the injection sites. M/T cells not associated with GC columns are interpreted to arise from third-order labeling via second-order GCs. Labeling is mostly restricted to the injected half of the bulb. Note the few labeled GL cells, showing that PRV can infect these cell types, but labeling is not widespread in the GL.

Figure 2. (A) Confocal image stack of a column with interdigitated labeling. (B,C) A view of a column with interdigitated labeling at 200× and the same column at 400× magnification imaged with mercury lamp excitation to avoid differential bleaching of the fluorophores with laser excitation (maximum intensity plots of 20 image z-stacks). (D) Anterior piriform cortex from the same animal is highly co-labeled in pyramidal cells, suggesting less co-labeling in the GCs is not the result of a viral property.
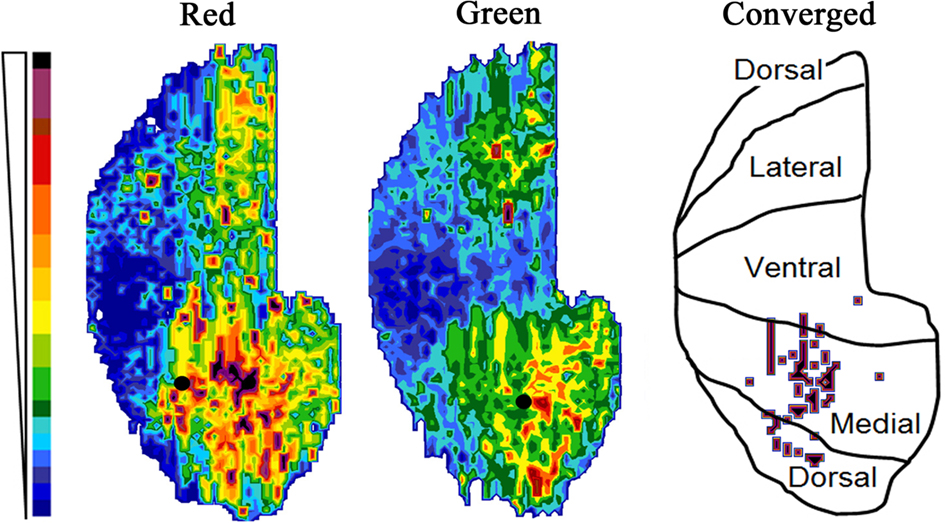
Figure 3. Map of the fluorescent intensity in the GrCL just deep to the internal plexiform layer (for an explanation of the mapping technique, see Xu et al., 2003). Intensity scale at left. Filled circles show the position of the injection sites in the displayed animal, while the schematic shows the anatomical positions of the rolled out map. Marks on the schematic indicate areas on the medial side where there are strongly converged columns (arbitrary threshold).
We define first-order labeling as the subset of neurons that uptake virus directly from the injection, while second- and third-order are mono- and di-synaptic connections respectively. The majority of the second-order labeling occurred in GCs. The other candidate inhibitory cell population, the periglomerular cells, are not widely labeled using the PRV method (Figure 1; Willhite et al., 2006). Because the indicator of infection is fluorescence, and the active production of fluorescent protein prevents distinguishing first-order from higher-order infections, the first-order neurons must be inferred from the injection site location, and the cell types known to innervate that location.
The candidate neuron types that form synapses with cells in both the glomerular layer and GCs consist of only three cell types: mitral cells, tufted cells, and a recently identified subset of deep short axon cell (dSAC; Figure 4; Eyre et al., 2008). Examination of the labeling patterns 1 day after infection of the glomerular layer to reveal the first-order population showed only limited labeling of the dSACs (data not shown), which are not thought to have lateral processes spanning significant distances other than the axon innervating the glomerular layer. This neuron subset is therefore unlikely to account for the widespread GC columns observed at later time points.
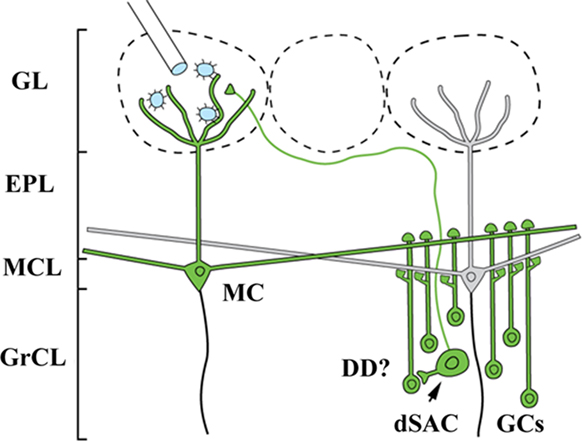
Figure 4. Lateral retrograde connections from the OB glomerular layer (GL) to the granule cell layer (GrCL). Because GCs have no axons, a GL injection of Bartha-PRV (which is missing several gene products necessary for anterograde transport) has only two known routes to infect them: lateral dendrites of MT cells and a recently identified sub-population of deep short axon cell (dSAC) which sends axons into the GL. For the infection to pass through the dSAC route, dendrodendritic synapses (DD) must be present, an assumption for which data is lacking. This and the absence of widespread dSAC labeling at early time points lead to the interpretation that the GC column labeling results from PRV crossing the lateral dendrite DD synapses.
Non-Stochastic Lateral Connections
The number of observed convergently connected GCs as assessed by co-labeling was apparently few. However, to quantify if the observed labeling was more or less convergent than expected, the labeled neurons were counted, and the results were compared to a model of MT-to-GC connections based on a stochastic assumption. In the viral tracing experiment it is not possible to know with precision how many first-order neurons were infected. However, for any labeled volume of the GrCL, if the fraction of the total neurons labeled by each fluorophoreis known, then the probability that a cell should be co-labeled is also known by a normal distribution function (see Materials and Methods). As a simplified example, if 10% of the neurons were labeled red and 10% green, then 1% would be expected to be co-labeled.
We therefore determined the neuron density in the rat GrCL. This was approximately 550,000 neurons/mm3 with a standard deviation of 82,000 using NeuNimmunohistological staining as a neuronal marker to quantify using standard stereological procedures and the Cavalieri method to determine GrCL volume in five Sprague–Dawley rats age 6–8 weeks (see Table 1).
Pseudorabies virus bearing genes for red or green fluorescent proteins were injected into the medial glomerular layer. The injection sites were separated by at least 500 microns to ensure separate first-order infection. After 3 days, determined to be adequate time for lateral spread, OB sections were prepared as described previously (Willhite et al., 2006).
The total number of red, green, and co-labeled neurons was determined for at least 10 dual-labeled columns per animal, 109 columns total. Due to the sparseness of the labeling, all neurons in each column were counted (12,503 total); stereological estimates were not used. Column boundaries were defined independently using red or green cells within a 40 micron radius to the next cell as a standard for nearest neighbor analysis. Boundaries of convergent columns were similarly defined using 40 microns with interdigitation of red and green as a standard. Columns without co-labeling were not further analyzed because the expected convergence value would be zero in all such cases. The filter sets used showed no cross-talk between the red and green channels.
Figure 5A shows the prediction of the stochastic connectivity model at the densities relevant to the data. The abscissa and ordinate represent the percentage of red and green cells respectively, and the color scale shows the expected random convergence. Figure 5B shows the actual data with each point representing a column on a background showing the stochastic case. The most heavily labeled columns, while visually robust, represented less than 7% of the average total neurons in the column volume, again indicating a sparse representation (three data points are not included in the figures for better visualization of the remainder). Most striking, however, is that all but 6 of the 109 randomly assayed columns showed a higher number of convergent neurons than expected. Further, none of the six was outside of one standard deviation from the expected mean.
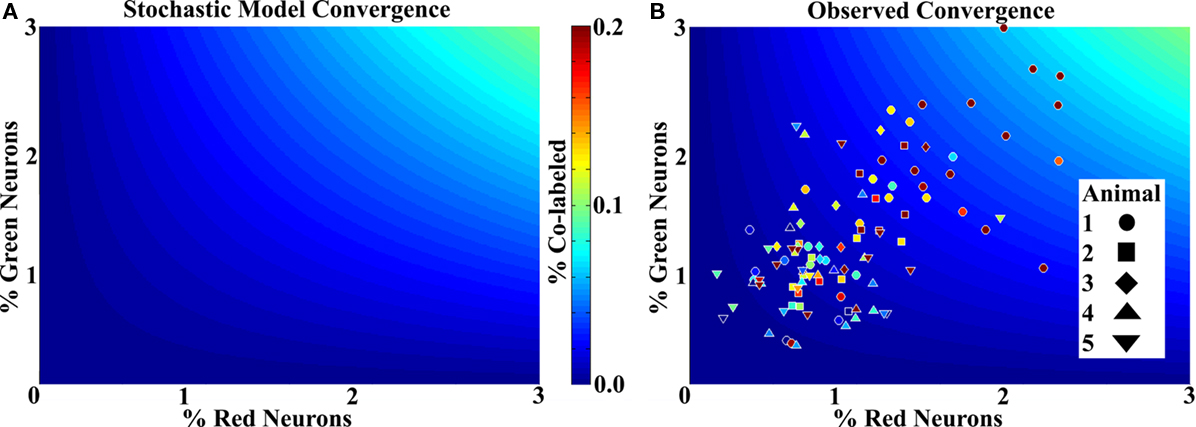
Figure 5. Labeling shows non-stochastic convergence. (A) A mathematical model showing the mean probability of a cell being co-labeled with a known density (percentage) of each species in the ranges relevant to the data. Color scale to the right applies to (A) and (B). Very few co-labeled cells are expected. (B) Column data superimposed on the stochastic model for comparison. Each data point represents a column for which the labeled neurons were counted and the volume measured, a color more red in the spectrum (or lighter blue) than the background represents greater co-labeling than the model predicts. The numbers were divided by the mean expected number of total neurons for the measured volume to obtain percentages. All but six columns show more co-labeling than predicted by chance. While some animals have more co-labeling than others, no trends were statistically significant.
The experiment was repeated mixing the two viruses in the same syringe and injecting in a single site in the medial glomerular layer. 100% convergence was not observed, suggesting that first-order infection is a low probability event. As expected, however, there was significantly more convergence than in the separate injections (Figure 6). This control clearly shows that the two variants are able co-infect GCs.
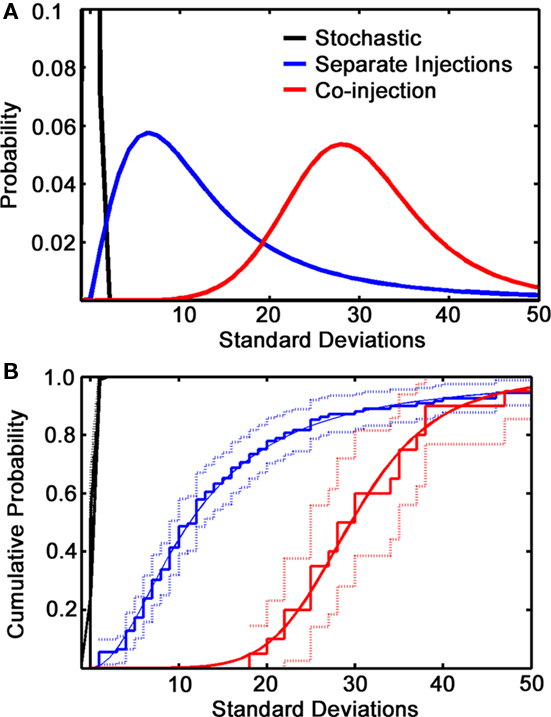
Figure 6. Co-injections vs. separate injection sites. (A) Normalized curve fits showing the deviation of co-labeling from a stochastic model (black line, which represents a single standard deviation from the mean expected co-labeling) for separate injection data (blue line) and co-injection (red line). (B) Cumulative distribution plot of the same data showing the fitted curve (solid lines), the raw data (steps) and statistical significance (light lines). The stochastic curve merges with the top frame of the plot.
We then subdivided the columns from the separate injection data set into three bins by proximity to the injection site. It was expected that there may be more convergence in proximal columns than distal ones; however, no obvious trend was apparent (data not shown). This may be due to the relatively large distance between injection sites (500 microns) that are necessary to maintain separate first-order infection, or may reflect a genuine distance-independent lateral connectivity environment.
The columns were then subdivided into three bins on the basis of depth within the GrCL. The more superficial GCs are thought to represent more mature neurons that have perhaps more fully integrated into the network than newly arrived GCs (Lledo et al., 2008). Perhaps due to the random nature of the injection sites, however, there were no differences in the observed convergence between these groups (data not shown).
Segregation within a Glomerular Unit
We define a glomerular unit as the set of neurons associated with a single glomerulus. A key question is how the MT cells within a given glomerular unit connect to the local GCs. The sparse and largely segregated nature of the lateral MT-to-GC connection does not address the connectivity within a given glomerular unit. The 20–50 MT cells connected to a single glomerulus may share a common set of GCs, or connect to subsets. Two days following glomerular layer injection, the labeling in the GC layer is local beneath the infected MT cells; the spread of virus along the lateral dendrites will only occur after 3 days. Three days following cortical infection, therefore, the labeling observed in the GC layer is interpreted to arise from somatic or proximal synaptic contact with infected MT cells (Card and Enquist, 1999). Supporting this model, no GC columns were observed from cortical injections which did not have labeled MT cells directly superficial to the column, while many such GC-only columns arose after glomerular layer injection. This property enabled us to address the question of MT-to-GC connectivity within the glomerular unit.
Dual PRV injections were performed in the anterior piriform cortex. Injections were separated by 500 microns to minimize the chance of first-order infection with both species. RFP and GFP labeled columns are apparent in the GC layer 3 days following injection (Figure 7). The borders between the two can be strikingly sharp. When columns are labeled in both red and green, segregation is again observed, suggesting that MT cells connected to the same glomerulus form connections with different populations of GCs. We cannot rule out, however, the possibility that the source MT cell for a given labeled GC is from an adjacent glomerulus.
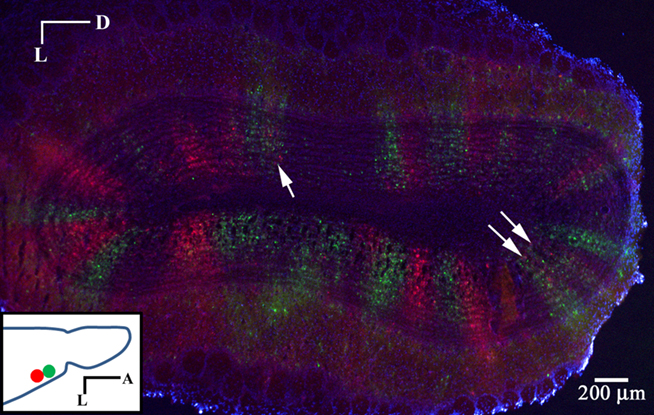
Figure 7. Segregated labeling from injections in piriform cortex. Coronal section of the OB 3 days after dual PRV injection into the anterior piriform cortex. Injection sites were separated by 500 microns. Note the sharp divisions between red and green columns. Columns with labeling in both red and green generally show segregation (arrows). (Inset) Horizontal schematic showing the injection sites.
PRV Tracing Controls
Though the columns are visually robust, the sparseness of the labeling (generally no more than 3% of total neurons present) raises the possibility that PRV is targeting a specific sub-population of cells. As expected, the majority of cells labeled in the GC layer are positive for GAD (data not shown). The number of known GC subtypes that can possibly account for the observed labeling is limited.
To determine if PRV targets only immature, or only mature neurons, we identified immature neurons in PRV infected tissue using doublecortin (DCX) expression as a marker. Immuno-staining revealed that PRV can infect, but does not exclusively infect, DCX positive neurons (Figure 8A).
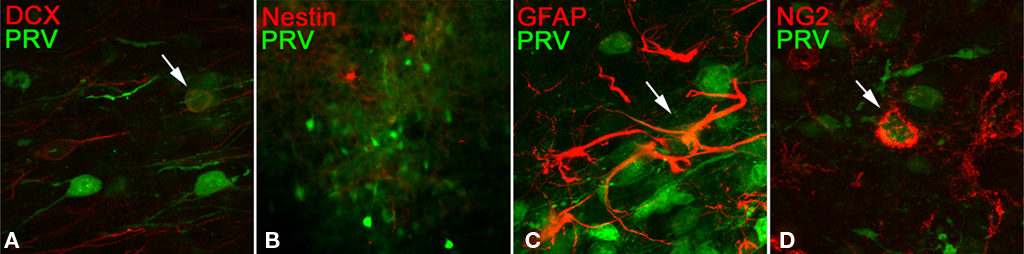
Figure 8. Sections infected in the glomerular layer and prepared as described previously were counter-stained with antibodies to the indicated proteins (A) doublecortin, (B) nestin, (C) glial fibrillary acidic protein, (D) chondroitin sulfate proteoglycan. Arrows indicate co-localization. No sub-population was found that accounts for the observed PRV labeling (see text).
Recently, a GC subtype expressing nestin was found to selectively form synapses on the soma, as opposed to the lateral dendrites, of MT cells. Immuno-staining with anti-nestin showed a population of cells which appeared to be more sparse than the PRV staining. We were unable to find convincing evidence of co-localization of PRV with nestin positive cells, but clearly PRV is not selectively targeting this population (Figure 8B). We cannot rule out a possible unidentified subset which is selectively targeted, but have not found an exclusively targeted subset in the limited known GC sub-populations.
To determine if the virus also targets non-neuronal cell types in the OB, we immuno-stained for expression of glial fibrillary acidic protein (GFAP) or NG2 chondroitin sulfate proteoglycan (NG2) expression. As in other systems, PRV is able to infect these cell types in the OB (Figures 8C,D). Previous studies indicate that infection of glial cell types is non-productive – the virus can enter the cell but does not pass to new cells through this route (Ekstrand et al., 2008).
A recent study showed that PRV infection of neurons in vitro rapidly alters the cell morphology and physiology (McCarthy et al., 2009). Previous studies have suggested that the in vivo time course for neuronal damage is longer than 6 days, which is well beyond the maximal 3-day infection period used in this study (Smith et al., 2000; Irnaten et al., 2001; Davis et al., 2003; Glatzer et al., 2003; Rothermel et al., 2009). To determine if PRV is causing cell death in the OB in a more rapid time course than in the previously studied systems, we infected the glomerular layer as previously indicated and stained for the active form of caspase-3, an indicator of early stage apoptosis. In normal OB tissue, one or two cells would be labeled per 100 micron section. Infection with PRV for 3 days did not produce an increase in the number of cells with the active form of caspase-3 (data not shown). We then performed the same experiment, but infected with 10-fold lower titer to allow the animal to survive a 5-day time course. The cells near the injection site therefore should have been infected for the full 5-day period. There again was no increase in active caspase-3 positive cells over control tissue at any location. While it is possible that the increase in co-labeled cells over the expected value can be attributed to the in vitro neuronal changes noted in the McCarthy study, the degree of segregated labeling in addition to the lack of increased apoptosis in the OB suggest that such changes are not playing a major role in the 3-day in vivo time course.
Discussion
This study examines connectivity relationships of the projection neurons within the OB. Transsynaptic tracing showed sparse and segregated lateral connections of MT cells with the inhibitory GCs. Further analysis demonstrated that the network does not fit a random connection assumption, and that the deviation from random connectivity is independent of distance or depth in the lamina. The probability of co-infection presumably depends on the specific locations of the injection sites.
Lateral inhibition in other sensory systems is thought to play a role in enhancing the contrast of similar inputs (Kuffler, 1953; Sur, 1980; DeVries and Baylor, 1993; Ma and Suga, 2004; Priebe and Ferster, 2008). The lateral interactions in the OB have the anatomical potential to act over much larger distances than these interactions in other sensory modalities (Mori et al., 1983; Orona et al., 1984), and have been shown to be physiologically capable of doing so in brain slice experiments (Xiong and Chen, 2002). It has been proposed, however, that the lateral network mediates gain control rather than contrast enhancement in olfaction (Schoppa, 2009). If this is the case, it is difficult to see what value would be gained by additional inhibitory units (GCs), where only a few with more synapses should serve the same function. Further, it is not clear how the gain control model address the role of adult turnover of GC populations.
Evidence from olfactory cortex has recently shown that a fairly constant fraction of pyramidal cells respond to monomolecular odorants which have very different levels of presynaptic glomerular activation (Rennaker et al., 2007; Poo and Isaacson, 2009). Mixtures of odorants do not necessarily produce more pyramidal cell activation, but different ensembles are activated that are not predictable on the basis of the two separate activation patterns (Stettler and Axel, 2009). Taken together, these data suggest that a degree of both gain control and contrast enhancement are performed in the OB prior to cortical activation.
The data presented in this study shows that, in the general case, MT cells from any given glomerulus form connections with GCs that are segregated from other lateral inputs. Several lines of evidence indicate that olfactory information is coded in a combinatorial manner (Sharp et al., 1975; Malnic et al., 1999; Araneda et al., 2000; Wilson, 2001; Soucy et al., 2009). The sparse MT-to-GC connectivity shown here suggests a mechanism for coincident inhibition to influence MT firing rates based on the specific combinations of surrounding MT activation, consistent with the combinatorial model. We speculate that the segregated connections may allow summation of coincident inhibition and enables MT cells to combine to perform the equivalent of a NOT-AND Boolean operation on other MT cells (Shepherd and Brayton, 1987), where an all-to-all MT-to-GC network would only be capable of NOT-OR operations. Slice recordings showing the need for summed inputs to induce lateral inhibition also suggest NOT-AND gating (Arevian et al., 2008), however, further physiological evidence is necessary.
Conflict of Interest Statement
The authors declare that the research was conducted in the absence of any commercial or financial relationships that could be construed as a potential conflict of interest.
Acknowledgments
PRV strains were provided by L. W. Enquist, Princeton University as a service of the National Center for Experimental Neuroanatomy with Neurotropic Viruses: NCRR P40 RRO118604 and the National Science Foundation under agreement No. IBN-9876754. We thank A. Bordey and S. Z. Young for use of a confocal microscope and technical assistance. We thank C. A. Greer for helpful comments and use of reagents. This work was supported by NIH/NIDCD grants DC000086 and DC008874.
References
Araneda, R. C., Kini, A. D., and Firestein, S. (2000). The molecular receptive range of an odorant receptor. Nat. Neurosci. 3, 1248–1255.
Arevian, A. C., Kapoor, V., and Urban, N. N. (2008). Activity-dependent gating of lateral inhibition in the mouse olfactory bulb. Nat. Neurosci. 11, 80–87.
Banfield, B. W., Kaufman, J. D., Randall, J. A., and Pickard, G. E. (2003). Development of pseudorabies virus strains expressing red fluorescent proteins: new tools for multisynaptic labeling applications. J. Virol. 77, 10106–10112.
Billig, I., Foris, J. M., Enquist, L. W., Card, J. P., and Yates, B. J. (2000). Definition of neuronal circuitry controlling the activity of phrenic and abdominal motoneurons in the ferret using recombinant strains of pseudorabies virus. J. Neurosci. 20, 7446–7454.
Card, J. P., and Enquist, L. W. (1999). “Transneuronal circuit analysis with pseudorabies virus,” in Current Protocols in Neuroscience, ed. J. N. Crawley (New York, NY: J. Wiley), 1.5.1–1.5.28.
Cleland, T. A., and Sethupathy, P. (2006). Non-topographical contrast enhancement in the olfactory bulb. BMC Neurosci. 7, 7. doi: 10.1186/1471-2202-7-7
Davis, S. F., Williams, K. W., Xu, W., Glatzer, N. R., and Smith, B. N. (2003). Selective enhancement of synaptic inhibition by hypocretin (orexin) in rat vagal motor neurons: implications for autonomic regulation. J. Neurosci. 23, 3844–3854.
DeVries, S. H., and Baylor, D. A. (1993). Synaptic circuitry of the retina and olfactory bulb. Cell 72 Suppl:139–149.
Ekstrand, M. I., Enquist, L. W., and Pomeranz, L. E. (2008). The alpha-herpesviruses: molecular pathfinders in nervous system circuits. Trends. Mol. Med. 14, 134–140.
Eyre, M. D., Antal, M., and Nusser, Z. (2008). Distinct deep short-axon cell subtypes of the main olfactory bulb provide novel intrabulbar and extrabulbar GABAergic connections. J. Neurosci. 28, 8217–8229.
Frazier, L. L., and Brunjes, P. C. (1988). Unilateral odor deprivation: early postnatal changes in olfactory bulb cell density and number. J. Comp. Neurol. 269, 355–370.
Glatzer, N. R., Hasney, C. P., Bhaskaran, M. D., and Smith, B. N. (2003). Synaptic and morphologic properties in vitro of premotor rat nucleus tractus solitarius neurons labeled transneuronally from the stomach. J. Comp. Neurol. 464, 525–539.
Guide for the Care Use of Laboratory Animals. (1996). National Academy of Sciences. Washington, DC: National Academy Press.
Gundersen, H. J., Bagger, P., Bendtsen, T. F., Evans, S. M., Korbo, L., Marcussen, N., Moller, A., Nielsen, K., Nyengaard, J. R., Pakkenberg, B., SØRensen, F. B., Vesterby, A., and West, M. J. (1988). The new stereological tools: disector, fractionator, nucleator and point sampled intercepts and their use in pathological research and diagnosis. APMIS 96, 857–881.
Irnaten, M., Neff, R. A., Wang, J., Loewy, A. D., Mettenleiter, T. C., and Mendelowitz, D. (2001). Activity of cardiorespiratory networks revealed by transsynaptic virus expressing GFP. J. Neurophysiol. 85, 435–438.
Johnson, B. A., and Leon, M. (2007). Chemotopic odorant coding in a mammalian olfactory system. J. Comp. Neurol. 503, 1–34.
Kuffler, S. W. (1953). Discharge patterns and functional organization of mammalian retina. J. Neurophysiol. 16, 37–68.
Liu, N., Xu, F., Marenco, L., Hyder, F., Miller, P., and Shepherd, G. M. (2004). Informatics approaches to functional MRI odor mapping of the rodent olfactory bulb: OdorMapBuilder and OdorMapDB. Neuroinformatics 2, 3–18.
Lledo, P. M., Merkle, F. T., and Alvarez-Buylla, A. (2008). Origin and function of olfactory bulb interneuron diversity. Trends Neurosci. 31, 392–400.
Ma, X., and Suga, N. (2004). Lateral inhibition for center-surround reorganization of the frequency map of bat auditory cortex. J. Neurophysiol. 92, 3192–3199.
Malnic, B., Hirono, J., Sato, T., and Buck, L. B. (1999). Combinatorial receptor codes for odors. Cell 96, 713–723.
Man, O., Willhite, D. C., Crasto, C. J., Shepherd, G. M., and Gilad, Y. (2007). A framework for exploring functional variability in olfactory receptor genes. PLoS ONE 2, e682. doi: 10.1371/journal.pone.0000682
McCarthy, K. M., Tank, D. W., and Enquist, L. W. (2009). Pseudorabies virus infection alters neuronal activity and connectivity in vitro. PLoS Pathog. 5, e1000640. doi: 10.1371/journal.ppat.1000640
Meisami, E., and Safari, L. (1981). A quantitative study of the effects of early unilateral olfactory deprivation on the number and distribution of mitral and tufted cells and of glomeruli in the rat olfactory bulb. Brain Res. 221, 81–107.
Miyamichi, K., Amat, F., Moussavi, F., Wang, C., Wickersham, I., Wall, N. R., Taniguchi, H., Tasic, B., Huang, Z. J., He, Z., Callaway, E. M., Horowitz, M. A., and Luo, L. (2010). Cortical representations of olfactory input by trans-synaptic tracing. Nature 472,191–196.
Mori, K., Kishi, K., and Ojima, H. (1983). Distribution of dendrites of mitral, displaced mitral, tufted, and granule cells in the rabbit olfactory bulb. J. Comp. Neurol. 219, 339–355.
Mori, K., Takahashi, Y. K., Igarashi, K. M., and Yamaguchi, M. (2006). Maps of odorant molecular features in the Mammalian olfactory bulb. Physiol. Rev. 86, 409–433.
Orona, E., Rainer, E. C., and Scott, J. W. (1984). Dendritic and axonal organization of mitral and tufted cells in the rat olfactory bulb. J. Comp. Neurol. 226, 346–356.
Poo, C., and Isaacson, J. S. (2009). Odor representations in olfactory cortex: “sparse” coding, global inhibition, and oscillations. Neuron 62, 850–861.
Priebe, N. J., and Ferster, D. (2008). Inhibition, spike threshold, and stimulus selectivity in primary visual cortex. Neuron 57, 482–497.
Rennaker, R. L., Chen, C. F., Ruyle, A. M., Sloan, A. M., and Wilson, D. A. (2007). Spatial and temporal distribution of odorant-evoked activity in the piriform cortex. J. Neurosci. 27, 1534–1542.
Rothermel, M., Brunert, D., Klupp, B. G., Luebbert, M., Mettenleiter, T. C., and Hatt, H. (2009). Advanced tracing tools: functional neuronal expression of virally encoded fluorescent calcium indicator proteins. J. Neurovirol. 15, 458–464.
Royet, J. P., Distel, H., Hudson, R., and Gervais, R. (1998). A re-estimation of the number of glomeruli and mitral cells in the olfactory bulb of rabbit. Brain Res. 788, 35–42.
Schoppa, N. E. (2009). Making scents out of how olfactory neurons are ordered in space. Nat. Neurosci. 12, 103–104.
Sharp, F. R., Kauer, J. S., and Shepherd, G. M. (1975). Local sites of activity-related glucose metabolism in rat olfactory bulb during olfactory stimulation. Brain Res. 98, 596–600.
Shepherd, G. M. (2004). The Synaptic Organization of the Brain, 5th Edn. New York: Oxford University Press.
Shepherd, G. M., and Brayton, R. K. (1987). Logic operations are properties of computer-simulated interactions between excitable dendritic spines. Neuroscience 21, 151–165.
Shepherd, G. M., Chen, W. R., and Greer, C. A. (2004). “Olfactory bulb,” in The Synaptic Organization of the Brain, 5th Edn, ed. G. M. Shepherd (New York: Oxford University Press), xiv, 719 p.
Smith, B. N., Banfield, B. W., Smeraski, C. A., Wilcox, C. L., Dudek, F. E., Enquist, L. W., and Pickard, G. E. (2000). Pseudorabies virus expressing enhanced green fluorescent protein: A tool for in vitro electrophysiological analysis of transsynaptically labeled neurons in identified central nervous system circuits. Proc. Natl. Acad. Sci. U.S.A. 97, 9264–9269.
Soucy, E. R., Albeanu, D. F., Fantana, A. L., Murthy, V. N., and Meister, M. (2009). Precision and diversity in an odor map on the olfactory bulb. Nat. Neurosci. 12, 210–220.
Sterio, D. C. (1984). The unbiased estimation of number and sizes of arbitrary particles using the disector. J. Microsc. 134, 127–136.
Stettler, D. D., and Axel, R. (2009). Representations of odor in the piriform cortex. Neuron 63, 854–864.
Sur, M. (1980). Receptive fields of neurons in areas 3b and 1 of somatosensory cortex in monkeys. Brain Res. 198, 465–471.
Willhite, D. C., Nguyen, K. T., Masurkar, A. V., Greer, C. A., Shepherd, G. M., and Chen, W. R. (2006). Viral tracing identifies distributed columnar organization in the olfactory bulb. Proc. Natl. Acad. Sci. U.S.A. 103, 12592–12597.
Xiong, W., and Chen, W. R. (2002). Dynamic gating of spike propagation in the mitral cell lateral dendrites. Neuron 34, 115–126.
Keywords: lateral inhibition, circuits, olfaction, olfactory bulb, connectivity
Citation: Kim DH, Phillips ME, Chang AY, Patel HK, Nguyen KT and Willhite DC (2011) Lateral connectivity in the olfactory bulb is sparse and segregated. Front. Neural Circuits. 5:5. doi: 10.3389/fncir.2011.00005
Received: 07 February 2011; Paper pending published: 09 March 2011;
Accepted: 09 April 2011; Published online: 25 April 2011.
Edited by:
Aravinthan Samuel, Harvard University, USACopyright: © 2011 Kim, Phillips, Chang, Patel, Nguyen and Willhite. This is an open-access article subject to a non-exclusive license between the authors and Frontiers Media SA, which permits use, distribution and reproduction in other forums, provided the original authors and source are credited and other Frontiers conditions are complied with.
*Correspondence: David C. Willhite, Department of Neurobiology, Yale University School of Medicine, New Haven, CT 06520, USA. e-mail: david.willhite@yale.edu